Immigrants from Bolivia Self-Care Disability
COMPARE
Immigrants from Bolivia
Select to Compare
Self-Care Disability
Immigrants from Bolivia Self-Care Disability
2.2%
SELF-CARE DISABILITY
100.0/ 100
METRIC RATING
7th/ 347
METRIC RANK
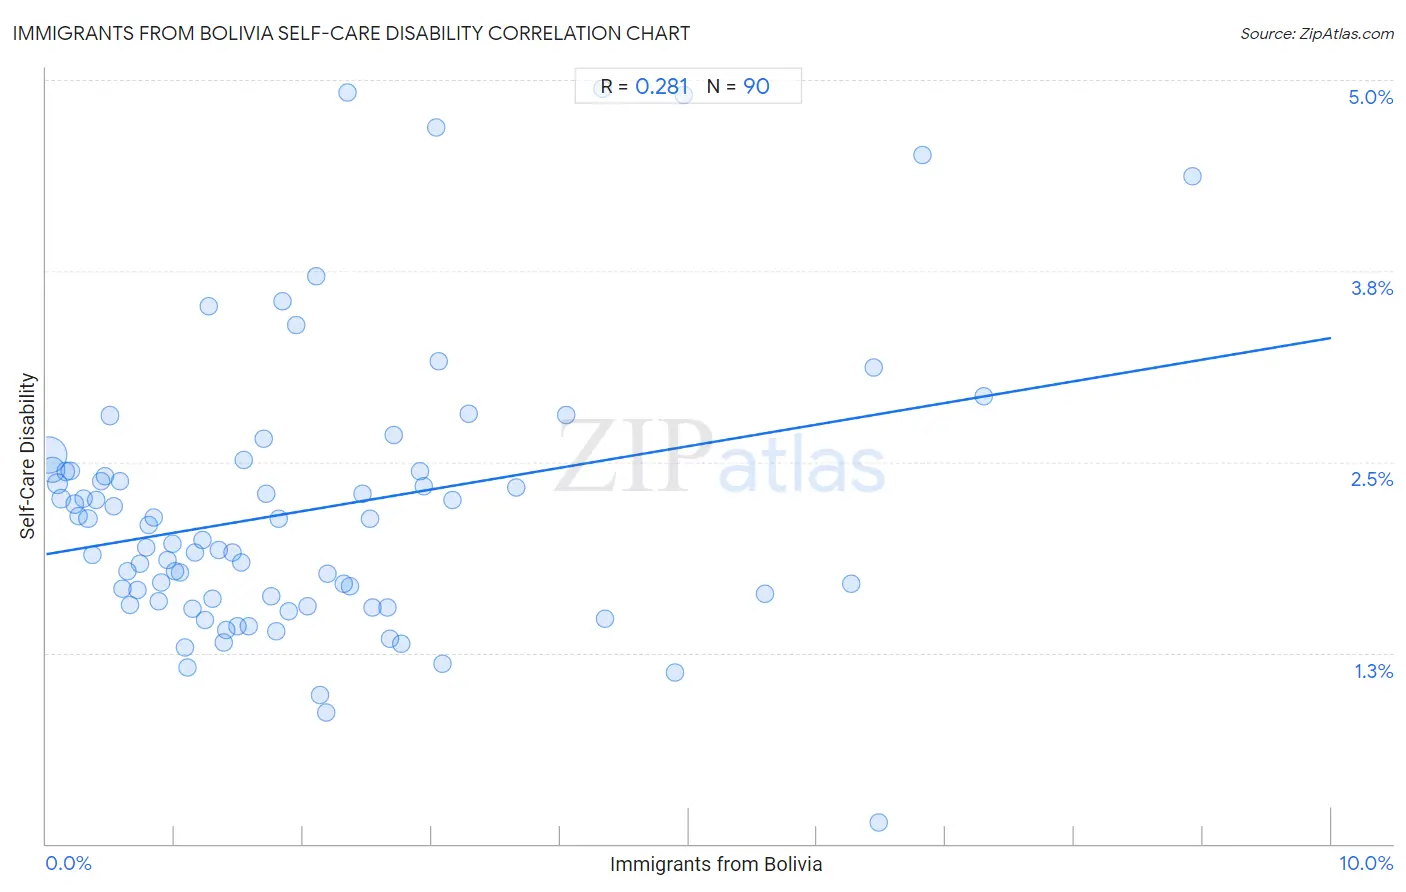
Immigrants from Bolivia Self-Care Disability Correlation Chart
The statistical analysis conducted on geographies consisting of 158,671,201 people shows a weak positive correlation between the proportion of Immigrants from Bolivia and percentage of population with self-care disability in the United States with a correlation coefficient (R) of 0.281 and weighted average of 2.2%. On average, for every 1% (one percent) increase in Immigrants from Bolivia within a typical geography, there is an increase of 0.14% in percentage of population with self-care disability.
It is essential to understand that the correlation between the percentage of Immigrants from Bolivia and percentage of population with self-care disability does not imply a direct cause-and-effect relationship. It remains uncertain whether the presence of Immigrants from Bolivia influences an upward or downward trend in the level of percentage of population with self-care disability within an area, or if Immigrants from Bolivia simply ended up residing in those areas with higher or lower levels of percentage of population with self-care disability due to other factors.
Demographics Similar to Immigrants from Bolivia by Self-Care Disability
In terms of self-care disability, the demographic groups most similar to Immigrants from Bolivia are Bolivian (2.2%, a difference of 0.050%), Immigrants from Nepal (2.2%, a difference of 0.18%), Filipino (2.2%, a difference of 0.21%), Zimbabwean (2.2%, a difference of 0.46%), and Sudanese (2.2%, a difference of 1.4%).
| Demographics | Rating | Rank | Self-Care Disability |
| Yup'ik | 100.0 /100 | #1 | Exceptional 1.9% |
| Immigrants from India | 100.0 /100 | #2 | Exceptional 2.0% |
| Thais | 100.0 /100 | #3 | Exceptional 2.1% |
| Immigrants from Singapore | 100.0 /100 | #4 | Exceptional 2.1% |
| Zimbabweans | 100.0 /100 | #5 | Exceptional 2.2% |
| Filipinos | 100.0 /100 | #6 | Exceptional 2.2% |
| Immigrants from Bolivia | 100.0 /100 | #7 | Exceptional 2.2% |
| Bolivians | 100.0 /100 | #8 | Exceptional 2.2% |
| Immigrants from Nepal | 100.0 /100 | #9 | Exceptional 2.2% |
| Sudanese | 100.0 /100 | #10 | Exceptional 2.2% |
| Immigrants from South Central Asia | 100.0 /100 | #11 | Exceptional 2.2% |
| Immigrants from Ethiopia | 100.0 /100 | #12 | Exceptional 2.2% |
| Ethiopians | 100.0 /100 | #13 | Exceptional 2.2% |
| Luxembourgers | 100.0 /100 | #14 | Exceptional 2.2% |
| Okinawans | 100.0 /100 | #15 | Exceptional 2.2% |
Immigrants from Bolivia Self-Care Disability Correlation Summary
| Measurement | Immigrants from Bolivia Data | Self-Care Disability Data |
| Minimum | 0.017% | 0.14% |
| Maximum | 8.9% | 4.9% |
| Range | 8.9% | 4.8% |
| Mean | 2.0% | 2.2% |
| Median | 1.5% | 2.0% |
| Interquartile 25% (IQ1) | 0.78% | 1.6% |
| Interquartile 75% (IQ3) | 2.7% | 2.4% |
| Interquartile Range (IQR) | 1.9% | 0.85% |
| Standard Deviation (Sample) | 1.8% | 0.92% |
| Standard Deviation (Population) | 1.8% | 0.91% |
Correlation Details
| Immigrants from Bolivia Percentile | Sample Size | Self-Care Disability |
[ 0.0% - 0.5% ] 0.017% | 83,887,468 | 2.5% |
[ 0.0% - 0.5% ] 0.048% | 35,286,923 | 2.4% |
[ 0.0% - 0.5% ] 0.084% | 11,393,913 | 2.4% |
[ 0.0% - 0.5% ] 0.12% | 6,161,613 | 2.3% |
[ 0.0% - 0.5% ] 0.15% | 3,871,589 | 2.4% |
[ 0.0% - 0.5% ] 0.19% | 3,578,351 | 2.4% |
[ 0.0% - 0.5% ] 0.22% | 2,228,962 | 2.2% |
[ 0.0% - 0.5% ] 0.25% | 1,463,914 | 2.1% |
[ 0.0% - 0.5% ] 0.29% | 1,156,042 | 2.3% |
[ 0.0% - 0.5% ] 0.32% | 1,423,729 | 2.1% |
[ 0.0% - 0.5% ] 0.36% | 777,534 | 1.9% |
[ 0.0% - 0.5% ] 0.39% | 611,520 | 2.2% |
[ 0.0% - 0.5% ] 0.43% | 589,737 | 2.4% |
[ 0.0% - 0.5% ] 0.45% | 498,337 | 2.4% |
[ 0.0% - 0.5% ] 0.50% | 489,335 | 2.8% |
[ 0.5% - 1.0% ] 0.53% | 349,891 | 2.2% |
[ 0.5% - 1.0% ] 0.57% | 570,041 | 2.4% |
[ 0.5% - 1.0% ] 0.59% | 191,262 | 1.7% |
[ 0.5% - 1.0% ] 0.63% | 274,128 | 1.8% |
[ 0.5% - 1.0% ] 0.66% | 235,620 | 1.6% |
[ 0.5% - 1.0% ] 0.71% | 181,087 | 1.7% |
[ 0.5% - 1.0% ] 0.73% | 157,712 | 1.8% |
[ 0.5% - 1.0% ] 0.78% | 121,214 | 1.9% |
[ 0.5% - 1.0% ] 0.80% | 214,310 | 2.1% |
[ 0.5% - 1.0% ] 0.84% | 161,533 | 2.1% |
[ 0.5% - 1.0% ] 0.87% | 225,858 | 1.6% |
[ 0.5% - 1.0% ] 0.90% | 206,292 | 1.7% |
[ 0.5% - 1.0% ] 0.95% | 154,708 | 1.9% |
[ 0.5% - 1.0% ] 0.98% | 111,618 | 2.0% |
[ 1.0% - 1.5% ] 1.00% | 96,307 | 1.8% |
[ 1.0% - 1.5% ] 1.04% | 125,771 | 1.8% |
[ 1.0% - 1.5% ] 1.08% | 296,381 | 1.3% |
[ 1.0% - 1.5% ] 1.10% | 19,401 | 1.2% |
[ 1.0% - 1.5% ] 1.14% | 105,029 | 1.5% |
[ 1.0% - 1.5% ] 1.16% | 16,620 | 1.9% |
[ 1.0% - 1.5% ] 1.22% | 31,235 | 2.0% |
[ 1.0% - 1.5% ] 1.24% | 22,339 | 1.5% |
[ 1.0% - 1.5% ] 1.26% | 38,982 | 3.5% |
[ 1.0% - 1.5% ] 1.30% | 35,353 | 1.6% |
[ 1.0% - 1.5% ] 1.34% | 5,663 | 1.9% |
[ 1.0% - 1.5% ] 1.38% | 54,699 | 1.3% |
[ 1.0% - 1.5% ] 1.40% | 36,063 | 1.4% |
[ 1.0% - 1.5% ] 1.45% | 65,223 | 1.9% |
[ 1.0% - 1.5% ] 1.48% | 118,205 | 1.4% |
[ 1.5% - 2.0% ] 1.52% | 113,497 | 1.8% |
[ 1.5% - 2.0% ] 1.54% | 21,991 | 2.5% |
[ 1.5% - 2.0% ] 1.57% | 114,723 | 1.4% |
[ 1.5% - 2.0% ] 1.69% | 19,372 | 2.6% |
[ 1.5% - 2.0% ] 1.71% | 6,649 | 2.3% |
[ 1.5% - 2.0% ] 1.75% | 24,644 | 1.6% |
[ 1.5% - 2.0% ] 1.79% | 7,057 | 1.4% |
[ 1.5% - 2.0% ] 1.81% | 1,604 | 2.1% |
[ 1.5% - 2.0% ] 1.84% | 27,734 | 3.6% |
[ 1.5% - 2.0% ] 1.89% | 65,644 | 1.5% |
[ 1.5% - 2.0% ] 1.94% | 31,022 | 3.4% |
[ 2.0% - 2.5% ] 2.03% | 45,008 | 1.6% |
[ 2.0% - 2.5% ] 2.10% | 9,141 | 3.7% |
[ 2.0% - 2.5% ] 2.13% | 17,788 | 0.97% |
[ 2.0% - 2.5% ] 2.18% | 3,851 | 0.86% |
[ 2.0% - 2.5% ] 2.19% | 5,790 | 1.8% |
[ 2.0% - 2.5% ] 2.32% | 24,785 | 1.7% |
[ 2.0% - 2.5% ] 2.35% | 1,790 | 4.9% |
[ 2.0% - 2.5% ] 2.36% | 38,077 | 1.7% |
[ 2.0% - 2.5% ] 2.46% | 26,573 | 2.3% |
[ 2.5% - 3.0% ] 2.52% | 58,872 | 2.1% |
[ 2.5% - 3.0% ] 2.54% | 58,775 | 1.5% |
[ 2.5% - 3.0% ] 2.65% | 16,250 | 1.5% |
[ 2.5% - 3.0% ] 2.68% | 43,882 | 1.3% |
[ 2.5% - 3.0% ] 2.71% | 2,068 | 2.7% |
[ 2.5% - 3.0% ] 2.76% | 52,359 | 1.3% |
[ 2.5% - 3.0% ] 2.91% | 19,812 | 2.4% |
[ 2.5% - 3.0% ] 2.94% | 16,827 | 2.3% |
[ 3.0% - 3.5% ] 3.03% | 2,573 | 4.7% |
[ 3.0% - 3.5% ] 3.06% | 4,218 | 3.2% |
[ 3.0% - 3.5% ] 3.09% | 6,510 | 1.2% |
[ 3.0% - 3.5% ] 3.16% | 728 | 2.3% |
[ 3.0% - 3.5% ] 3.29% | 49,246 | 2.8% |
[ 3.5% - 4.0% ] 3.66% | 6,500 | 2.3% |
[ 4.0% - 4.5% ] 4.04% | 2,052 | 2.8% |
[ 4.0% - 4.5% ] 4.33% | 1,202 | 4.9% |
[ 4.0% - 4.5% ] 4.35% | 4,003 | 1.5% |
[ 4.5% - 5.0% ] 4.90% | 4,024 | 1.1% |
[ 4.5% - 5.0% ] 4.96% | 746 | 4.9% |
[ 5.5% - 6.0% ] 5.59% | 34,860 | 1.6% |
[ 6.0% - 6.5% ] 6.27% | 31,121 | 1.7% |
[ 6.0% - 6.5% ] 6.44% | 652 | 3.1% |
[ 6.0% - 6.5% ] 6.47% | 2,533 | 0.14% |
[ 6.5% - 7.0% ] 6.82% | 1,584 | 4.5% |
[ 7.0% - 7.5% ] 7.30% | 1,137 | 2.9% |
[ 8.5% - 9.0% ] 8.92% | 415 | 4.4% |