Immigrants from Bolivia Married-Couple Family Poverty
COMPARE
Immigrants from Bolivia
Select to Compare
Married-Couple Family Poverty
Immigrants from Bolivia Married-Couple Family Poverty
4.7%
POVERTY | MARRIED-COUPLE FAMILIES
96.2/ 100
METRIC RATING
110th/ 347
METRIC RANK
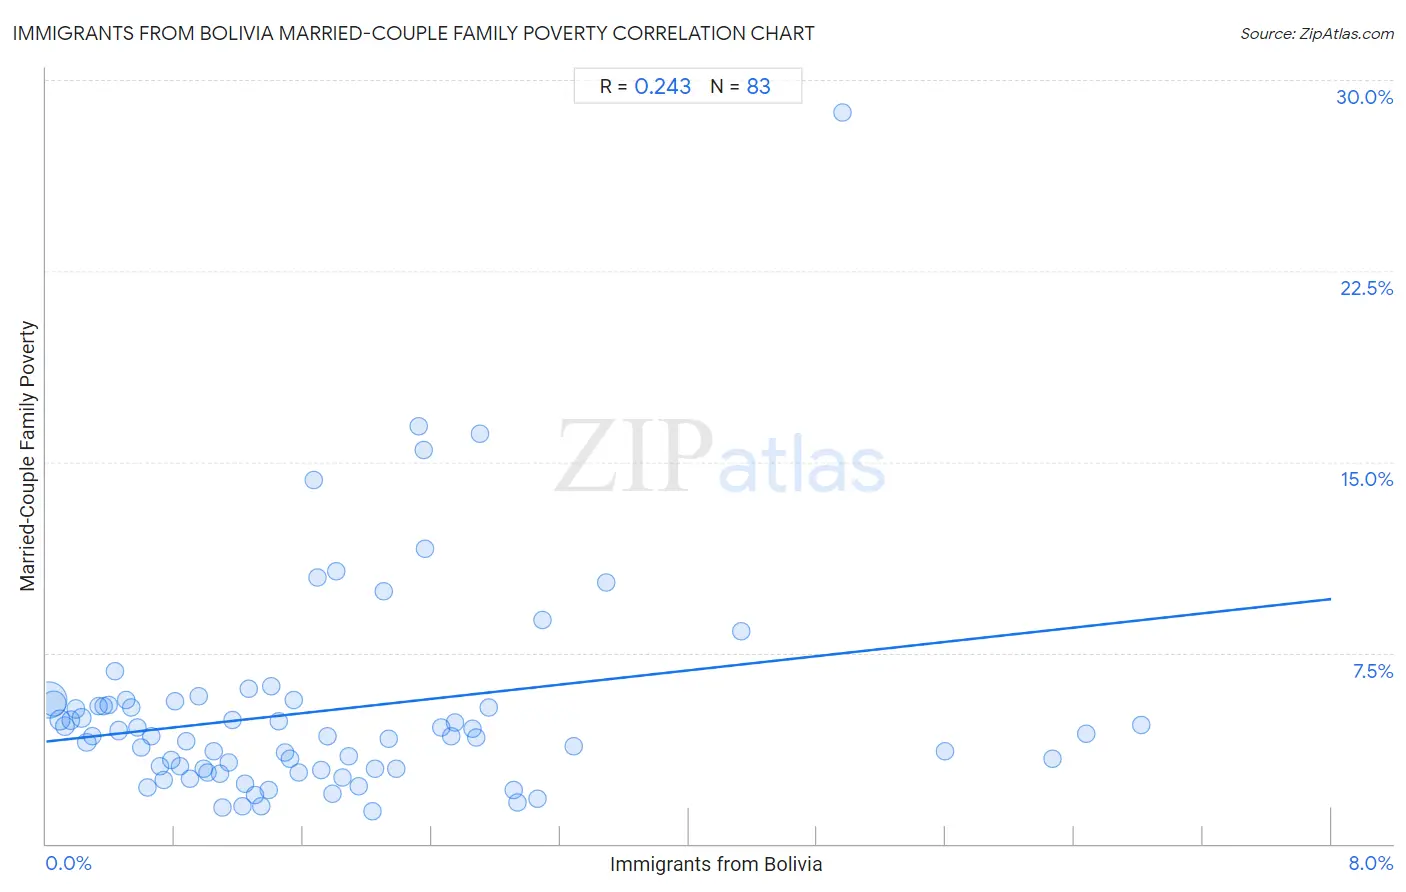
Immigrants from Bolivia Married-Couple Family Poverty Correlation Chart
The statistical analysis conducted on geographies consisting of 158,190,450 people shows a weak positive correlation between the proportion of Immigrants from Bolivia and poverty level among married-couple families in the United States with a correlation coefficient (R) of 0.243 and weighted average of 4.7%. On average, for every 1% (one percent) increase in Immigrants from Bolivia within a typical geography, there is an increase of 0.70% in poverty level among married-couple families.
It is essential to understand that the correlation between the percentage of Immigrants from Bolivia and poverty level among married-couple families does not imply a direct cause-and-effect relationship. It remains uncertain whether the presence of Immigrants from Bolivia influences an upward or downward trend in the level of poverty level among married-couple families within an area, or if Immigrants from Bolivia simply ended up residing in those areas with higher or lower levels of poverty level among married-couple families due to other factors.
Demographics Similar to Immigrants from Bolivia by Married-Couple Family Poverty
In terms of married-couple family poverty, the demographic groups most similar to Immigrants from Bolivia are Pakistani (4.7%, a difference of 0.040%), Immigrants from Hong Kong (4.7%, a difference of 0.16%), Tongan (4.7%, a difference of 0.22%), Immigrants from Nepal (4.7%, a difference of 0.29%), and Laotian (4.7%, a difference of 0.36%).
| Demographics | Rating | Rank | Married-Couple Family Poverty |
| Immigrants from Romania | 97.3 /100 | #103 | Exceptional 4.7% |
| Immigrants from Moldova | 97.1 /100 | #104 | Exceptional 4.7% |
| Aleuts | 97.0 /100 | #105 | Exceptional 4.7% |
| Immigrants from France | 96.9 /100 | #106 | Exceptional 4.7% |
| Immigrants from Germany | 96.8 /100 | #107 | Exceptional 4.7% |
| Laotians | 96.6 /100 | #108 | Exceptional 4.7% |
| Immigrants from Hong Kong | 96.4 /100 | #109 | Exceptional 4.7% |
| Immigrants from Bolivia | 96.2 /100 | #110 | Exceptional 4.7% |
| Pakistanis | 96.2 /100 | #111 | Exceptional 4.7% |
| Tongans | 95.9 /100 | #112 | Exceptional 4.7% |
| Immigrants from Nepal | 95.9 /100 | #113 | Exceptional 4.7% |
| Immigrants from Indonesia | 95.1 /100 | #114 | Exceptional 4.8% |
| Taiwanese | 94.8 /100 | #115 | Exceptional 4.8% |
| Celtics | 94.8 /100 | #116 | Exceptional 4.8% |
| Kenyans | 94.7 /100 | #117 | Exceptional 4.8% |
Immigrants from Bolivia Married-Couple Family Poverty Correlation Summary
| Measurement | Immigrants from Bolivia Data | Married-Couple Family Poverty Data |
| Minimum | 0.017% | 1.3% |
| Maximum | 6.8% | 28.7% |
| Range | 6.8% | 27.5% |
| Mean | 1.7% | 5.2% |
| Median | 1.4% | 4.2% |
| Interquartile 25% (IQ1) | 0.71% | 2.9% |
| Interquartile 75% (IQ3) | 2.3% | 5.5% |
| Interquartile Range (IQR) | 1.6% | 2.6% |
| Standard Deviation (Sample) | 1.4% | 4.2% |
| Standard Deviation (Population) | 1.4% | 4.1% |
Correlation Details
| Immigrants from Bolivia Percentile | Sample Size | Married-Couple Family Poverty |
[ 0.0% - 0.5% ] 0.017% | 83,850,836 | 5.7% |
[ 0.0% - 0.5% ] 0.048% | 35,225,455 | 5.5% |
[ 0.0% - 0.5% ] 0.084% | 11,340,593 | 4.9% |
[ 0.0% - 0.5% ] 0.12% | 6,124,059 | 4.6% |
[ 0.0% - 0.5% ] 0.15% | 3,848,105 | 4.9% |
[ 0.0% - 0.5% ] 0.19% | 3,557,619 | 5.3% |
[ 0.0% - 0.5% ] 0.22% | 2,220,223 | 4.9% |
[ 0.0% - 0.5% ] 0.25% | 1,450,523 | 4.0% |
[ 0.0% - 0.5% ] 0.29% | 1,151,515 | 4.2% |
[ 0.0% - 0.5% ] 0.32% | 1,414,224 | 5.4% |
[ 0.0% - 0.5% ] 0.36% | 767,332 | 5.4% |
[ 0.0% - 0.5% ] 0.39% | 604,699 | 5.5% |
[ 0.0% - 0.5% ] 0.43% | 583,065 | 6.8% |
[ 0.0% - 0.5% ] 0.45% | 493,947 | 4.4% |
[ 0.0% - 0.5% ] 0.50% | 469,255 | 5.7% |
[ 0.5% - 1.0% ] 0.53% | 345,182 | 5.3% |
[ 0.5% - 1.0% ] 0.57% | 559,178 | 4.6% |
[ 0.5% - 1.0% ] 0.59% | 169,018 | 3.8% |
[ 0.5% - 1.0% ] 0.63% | 275,710 | 2.2% |
[ 0.5% - 1.0% ] 0.66% | 235,620 | 4.2% |
[ 0.5% - 1.0% ] 0.71% | 168,810 | 3.0% |
[ 0.5% - 1.0% ] 0.73% | 157,712 | 2.5% |
[ 0.5% - 1.0% ] 0.78% | 121,214 | 3.3% |
[ 0.5% - 1.0% ] 0.80% | 214,310 | 5.6% |
[ 0.5% - 1.0% ] 0.84% | 154,604 | 3.0% |
[ 0.5% - 1.0% ] 0.87% | 225,858 | 4.0% |
[ 0.5% - 1.0% ] 0.90% | 199,808 | 2.5% |
[ 0.5% - 1.0% ] 0.95% | 154,708 | 5.8% |
[ 0.5% - 1.0% ] 0.98% | 111,618 | 3.0% |
[ 1.0% - 1.5% ] 1.01% | 78,226 | 2.8% |
[ 1.0% - 1.5% ] 1.04% | 123,005 | 3.6% |
[ 1.0% - 1.5% ] 1.08% | 293,987 | 2.8% |
[ 1.0% - 1.5% ] 1.10% | 12,542 | 1.4% |
[ 1.0% - 1.5% ] 1.13% | 70,998 | 3.2% |
[ 1.0% - 1.5% ] 1.16% | 16,620 | 4.8% |
[ 1.0% - 1.5% ] 1.22% | 31,235 | 1.5% |
[ 1.0% - 1.5% ] 1.24% | 20,340 | 2.4% |
[ 1.0% - 1.5% ] 1.26% | 31,451 | 6.1% |
[ 1.0% - 1.5% ] 1.30% | 35,353 | 1.9% |
[ 1.0% - 1.5% ] 1.34% | 5,663 | 1.5% |
[ 1.0% - 1.5% ] 1.38% | 54,699 | 2.1% |
[ 1.0% - 1.5% ] 1.40% | 36,063 | 6.2% |
[ 1.0% - 1.5% ] 1.45% | 63,973 | 4.8% |
[ 1.0% - 1.5% ] 1.48% | 118,205 | 3.6% |
[ 1.5% - 2.0% ] 1.52% | 113,497 | 3.3% |
[ 1.5% - 2.0% ] 1.54% | 21,991 | 5.6% |
[ 1.5% - 2.0% ] 1.57% | 114,723 | 2.8% |
[ 1.5% - 2.0% ] 1.67% | 120 | 14.3% |
[ 1.5% - 2.0% ] 1.69% | 19,372 | 10.5% |
[ 1.5% - 2.0% ] 1.71% | 6,649 | 2.9% |
[ 1.5% - 2.0% ] 1.75% | 24,644 | 4.2% |
[ 1.5% - 2.0% ] 1.79% | 7,057 | 2.0% |
[ 1.5% - 2.0% ] 1.81% | 1,604 | 10.7% |
[ 1.5% - 2.0% ] 1.84% | 27,734 | 2.6% |
[ 1.5% - 2.0% ] 1.89% | 65,644 | 3.4% |
[ 1.5% - 2.0% ] 1.94% | 31,022 | 2.3% |
[ 2.0% - 2.5% ] 2.03% | 44,959 | 1.3% |
[ 2.0% - 2.5% ] 2.05% | 8,975 | 2.9% |
[ 2.0% - 2.5% ] 2.10% | 9,141 | 9.9% |
[ 2.0% - 2.5% ] 2.13% | 17,788 | 4.1% |
[ 2.0% - 2.5% ] 2.18% | 3,851 | 3.0% |
[ 2.0% - 2.5% ] 2.32% | 24,785 | 16.4% |
[ 2.0% - 2.5% ] 2.35% | 1,790 | 15.5% |
[ 2.0% - 2.5% ] 2.36% | 38,077 | 11.6% |
[ 2.0% - 2.5% ] 2.46% | 26,573 | 4.6% |
[ 2.5% - 3.0% ] 2.52% | 58,872 | 4.2% |
[ 2.5% - 3.0% ] 2.54% | 52,415 | 4.7% |
[ 2.5% - 3.0% ] 2.65% | 15,459 | 4.5% |
[ 2.5% - 3.0% ] 2.68% | 43,882 | 4.2% |
[ 2.5% - 3.0% ] 2.70% | 185 | 16.1% |
[ 2.5% - 3.0% ] 2.76% | 52,359 | 5.3% |
[ 2.5% - 3.0% ] 2.91% | 19,812 | 2.1% |
[ 2.5% - 3.0% ] 2.94% | 16,827 | 1.6% |
[ 3.0% - 3.5% ] 3.06% | 4,218 | 1.8% |
[ 3.0% - 3.5% ] 3.09% | 6,510 | 8.8% |
[ 3.0% - 3.5% ] 3.29% | 49,246 | 3.8% |
[ 3.0% - 3.5% ] 3.49% | 1,463 | 10.3% |
[ 4.0% - 4.5% ] 4.33% | 1,202 | 8.4% |
[ 4.5% - 5.0% ] 4.96% | 746 | 28.7% |
[ 5.5% - 6.0% ] 5.59% | 34,860 | 3.6% |
[ 6.0% - 6.5% ] 6.27% | 31,121 | 3.3% |
[ 6.0% - 6.5% ] 6.47% | 2,533 | 4.3% |
[ 6.5% - 7.0% ] 6.82% | 1,584 | 4.6% |