Immigrants from Albania 1 or more Vehicles in Household
COMPARE
Immigrants from Albania
Select to Compare
1 or more Vehicles in Household
Immigrants from Albania 1 or more Vehicles in Household
87.1%
1+ VEHICLES AVAILABLE
0.1/ 100
METRIC RATING
279th/ 347
METRIC RANK
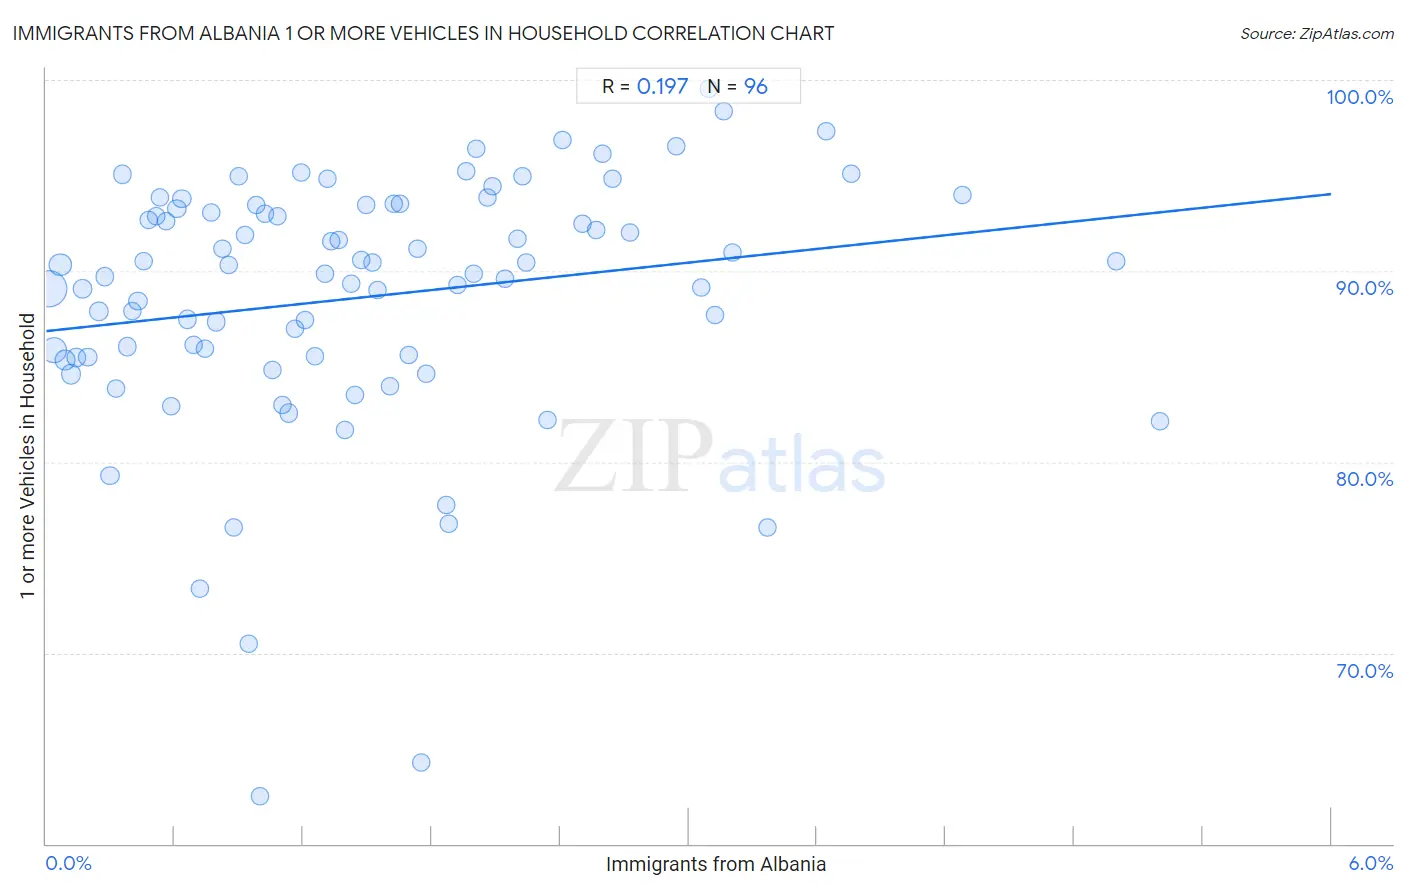
Immigrants from Albania 1 or more Vehicles in Household Correlation Chart
The statistical analysis conducted on geographies consisting of 107,656,140 people shows a poor positive correlation between the proportion of Immigrants from Albania and percentage of households with 1 or more vehicles available in the United States with a correlation coefficient (R) of 0.197 and weighted average of 87.1%. On average, for every 1% (one percent) increase in Immigrants from Albania within a typical geography, there is an increase of 1.2% in percentage of households with 1 or more vehicles available.
It is essential to understand that the correlation between the percentage of Immigrants from Albania and percentage of households with 1 or more vehicles available does not imply a direct cause-and-effect relationship. It remains uncertain whether the presence of Immigrants from Albania influences an upward or downward trend in the level of percentage of households with 1 or more vehicles available within an area, or if Immigrants from Albania simply ended up residing in those areas with higher or lower levels of percentage of households with 1 or more vehicles available due to other factors.
Demographics Similar to Immigrants from Albania by 1 or more Vehicles in Household
In terms of 1 or more vehicles in household, the demographic groups most similar to Immigrants from Albania are Immigrants from Southern Europe (87.1%, a difference of 0.0%), Immigrants from Croatia (87.0%, a difference of 0.030%), Alsatian (87.1%, a difference of 0.040%), Mongolian (87.0%, a difference of 0.090%), and Immigrants from France (87.1%, a difference of 0.10%).
| Demographics | Rating | Rank | 1 or more Vehicles in Household |
| Aleuts | 0.2 /100 | #272 | Tragic 87.5% |
| Immigrants from Northern Africa | 0.2 /100 | #273 | Tragic 87.4% |
| Immigrants from Morocco | 0.1 /100 | #274 | Tragic 87.4% |
| Immigrants from Singapore | 0.1 /100 | #275 | Tragic 87.2% |
| Immigrants from France | 0.1 /100 | #276 | Tragic 87.1% |
| Alsatians | 0.1 /100 | #277 | Tragic 87.1% |
| Immigrants from Southern Europe | 0.1 /100 | #278 | Tragic 87.1% |
| Immigrants from Albania | 0.1 /100 | #279 | Tragic 87.1% |
| Immigrants from Croatia | 0.0 /100 | #280 | Tragic 87.0% |
| Mongolians | 0.0 /100 | #281 | Tragic 87.0% |
| Colville | 0.0 /100 | #282 | Tragic 86.8% |
| Immigrants from Eastern Europe | 0.0 /100 | #283 | Tragic 86.7% |
| Central American Indians | 0.0 /100 | #284 | Tragic 86.7% |
| Immigrants from Kazakhstan | 0.0 /100 | #285 | Tragic 86.6% |
| Immigrants from Eastern Asia | 0.0 /100 | #286 | Tragic 86.5% |
Immigrants from Albania 1 or more Vehicles in Household Correlation Summary
| Measurement | Immigrants from Albania Data | 1 or more Vehicles in Household Data |
| Minimum | 0.011% | 62.5% |
| Maximum | 5.2% | 99.5% |
| Range | 5.2% | 37.0% |
| Mean | 1.5% | 88.6% |
| Median | 1.3% | 90.1% |
| Interquartile 25% (IQ1) | 0.65% | 85.5% |
| Interquartile 75% (IQ3) | 2.1% | 93.3% |
| Interquartile Range (IQR) | 1.4% | 7.8% |
| Standard Deviation (Sample) | 1.1% | 6.7% |
| Standard Deviation (Population) | 1.1% | 6.7% |
Correlation Details
| Immigrants from Albania Percentile | Sample Size | 1 or more Vehicles in Household |
[ 0.0% - 0.5% ] 0.011% | 44,401,240 | 89.1% |
[ 0.0% - 0.5% ] 0.038% | 16,968,197 | 85.9% |
[ 0.0% - 0.5% ] 0.065% | 10,234,005 | 90.3% |
[ 0.0% - 0.5% ] 0.089% | 5,691,256 | 85.3% |
[ 0.0% - 0.5% ] 0.12% | 3,957,356 | 84.6% |
[ 0.0% - 0.5% ] 0.14% | 2,760,655 | 85.4% |
[ 0.0% - 0.5% ] 0.17% | 2,849,336 | 89.0% |
[ 0.0% - 0.5% ] 0.19% | 1,842,422 | 85.5% |
[ 0.0% - 0.5% ] 0.25% | 2,499,653 | 87.9% |
[ 0.0% - 0.5% ] 0.27% | 1,049,658 | 89.7% |
[ 0.0% - 0.5% ] 0.30% | 2,790,009 | 79.3% |
[ 0.0% - 0.5% ] 0.33% | 987,042 | 83.8% |
[ 0.0% - 0.5% ] 0.35% | 339,944 | 95.1% |
[ 0.0% - 0.5% ] 0.38% | 946,611 | 86.0% |
[ 0.0% - 0.5% ] 0.40% | 685,925 | 87.9% |
[ 0.0% - 0.5% ] 0.43% | 842,172 | 88.4% |
[ 0.0% - 0.5% ] 0.45% | 463,505 | 90.5% |
[ 0.0% - 0.5% ] 0.48% | 213,604 | 92.7% |
[ 0.5% - 1.0% ] 0.51% | 348,431 | 92.9% |
[ 0.5% - 1.0% ] 0.53% | 379,678 | 93.9% |
[ 0.5% - 1.0% ] 0.56% | 388,615 | 92.6% |
[ 0.5% - 1.0% ] 0.59% | 150,123 | 82.9% |
[ 0.5% - 1.0% ] 0.61% | 168,564 | 93.2% |
[ 0.5% - 1.0% ] 0.63% | 130,926 | 93.8% |
[ 0.5% - 1.0% ] 0.66% | 224,030 | 87.5% |
[ 0.5% - 1.0% ] 0.69% | 614,796 | 86.1% |
[ 0.5% - 1.0% ] 0.72% | 506,935 | 73.4% |
[ 0.5% - 1.0% ] 0.74% | 371,836 | 86.0% |
[ 0.5% - 1.0% ] 0.77% | 130,008 | 93.1% |
[ 0.5% - 1.0% ] 0.79% | 229,641 | 87.3% |
[ 0.5% - 1.0% ] 0.82% | 156,645 | 91.1% |
[ 0.5% - 1.0% ] 0.85% | 185,393 | 90.3% |
[ 0.5% - 1.0% ] 0.88% | 299,326 | 76.5% |
[ 0.5% - 1.0% ] 0.90% | 129,055 | 94.9% |
[ 0.5% - 1.0% ] 0.93% | 164,560 | 91.9% |
[ 0.5% - 1.0% ] 0.94% | 44,196 | 70.5% |
[ 0.5% - 1.0% ] 0.98% | 125,758 | 93.5% |
[ 0.5% - 1.0% ] 1.00% | 172,513 | 62.5% |
[ 1.0% - 1.5% ] 1.02% | 110,301 | 93.0% |
[ 1.0% - 1.5% ] 1.06% | 157,605 | 84.8% |
[ 1.0% - 1.5% ] 1.08% | 66,165 | 92.9% |
[ 1.0% - 1.5% ] 1.11% | 181,872 | 83.0% |
[ 1.0% - 1.5% ] 1.13% | 127,044 | 82.6% |
[ 1.0% - 1.5% ] 1.16% | 126,406 | 87.0% |
[ 1.0% - 1.5% ] 1.19% | 92,104 | 95.1% |
[ 1.0% - 1.5% ] 1.21% | 86,266 | 87.4% |
[ 1.0% - 1.5% ] 1.25% | 65,709 | 85.5% |
[ 1.0% - 1.5% ] 1.30% | 26,488 | 89.9% |
[ 1.0% - 1.5% ] 1.31% | 83,752 | 94.8% |
[ 1.0% - 1.5% ] 1.33% | 43,682 | 91.5% |
[ 1.0% - 1.5% ] 1.37% | 55,344 | 91.6% |
[ 1.0% - 1.5% ] 1.39% | 175,179 | 81.7% |
[ 1.0% - 1.5% ] 1.42% | 146,188 | 89.4% |
[ 1.0% - 1.5% ] 1.44% | 204,191 | 83.5% |
[ 1.0% - 1.5% ] 1.47% | 100,388 | 90.6% |
[ 1.0% - 1.5% ] 1.49% | 211,068 | 93.5% |
[ 1.5% - 2.0% ] 1.53% | 73,170 | 90.5% |
[ 1.5% - 2.0% ] 1.54% | 44,039 | 89.0% |
[ 1.5% - 2.0% ] 1.60% | 35,211 | 84.0% |
[ 1.5% - 2.0% ] 1.62% | 41,356 | 93.6% |
[ 1.5% - 2.0% ] 1.65% | 17,305 | 93.5% |
[ 1.5% - 2.0% ] 1.69% | 40,254 | 85.6% |
[ 1.5% - 2.0% ] 1.73% | 92,572 | 91.2% |
[ 1.5% - 2.0% ] 1.75% | 55,127 | 64.3% |
[ 1.5% - 2.0% ] 1.78% | 61,164 | 84.6% |
[ 1.5% - 2.0% ] 1.87% | 23,256 | 77.8% |
[ 1.5% - 2.0% ] 1.88% | 5,325 | 76.8% |
[ 1.5% - 2.0% ] 1.92% | 108,261 | 89.3% |
[ 1.5% - 2.0% ] 1.96% | 9,069 | 95.2% |
[ 1.5% - 2.0% ] 1.99% | 66,150 | 89.9% |
[ 2.0% - 2.5% ] 2.01% | 24,728 | 96.4% |
[ 2.0% - 2.5% ] 2.06% | 21,723 | 93.9% |
[ 2.0% - 2.5% ] 2.09% | 44,921 | 94.5% |
[ 2.0% - 2.5% ] 2.14% | 60,883 | 89.6% |
[ 2.0% - 2.5% ] 2.20% | 28,248 | 91.7% |
[ 2.0% - 2.5% ] 2.22% | 3,061 | 94.9% |
[ 2.0% - 2.5% ] 2.24% | 23,540 | 90.5% |
[ 2.0% - 2.5% ] 2.34% | 20,678 | 82.2% |
[ 2.0% - 2.5% ] 2.41% | 9,826 | 96.9% |
[ 2.5% - 3.0% ] 2.51% | 1,875 | 92.5% |
[ 2.5% - 3.0% ] 2.57% | 3,700 | 92.1% |
[ 2.5% - 3.0% ] 2.59% | 84,827 | 96.1% |
[ 2.5% - 3.0% ] 2.64% | 605 | 94.8% |
[ 2.5% - 3.0% ] 2.73% | 9,387 | 92.0% |
[ 2.5% - 3.0% ] 2.94% | 2,688 | 96.5% |
[ 3.0% - 3.5% ] 3.06% | 29,215 | 89.1% |
[ 3.0% - 3.5% ] 3.09% | 7,213 | 99.5% |
[ 3.0% - 3.5% ] 3.12% | 38,062 | 87.7% |
[ 3.0% - 3.5% ] 3.17% | 695 | 98.4% |
[ 3.0% - 3.5% ] 3.21% | 7,987 | 91.0% |
[ 3.0% - 3.5% ] 3.37% | 4,011 | 76.6% |
[ 3.5% - 4.0% ] 3.64% | 1,346 | 97.3% |
[ 3.5% - 4.0% ] 3.76% | 2,049 | 95.1% |
[ 4.0% - 4.5% ] 4.28% | 23,200 | 94.0% |
[ 4.5% - 5.0% ] 4.99% | 25,869 | 90.5% |
[ 5.0% - 5.5% ] 5.20% | 173 | 82.1% |