Immigrants from Albania Married-Couple Family Poverty
COMPARE
Immigrants from Albania
Select to Compare
Married-Couple Family Poverty
Immigrants from Albania Married-Couple Family Poverty
5.3%
POVERTY | MARRIED-COUPLE FAMILIES
33.8/ 100
METRIC RATING
187th/ 347
METRIC RANK
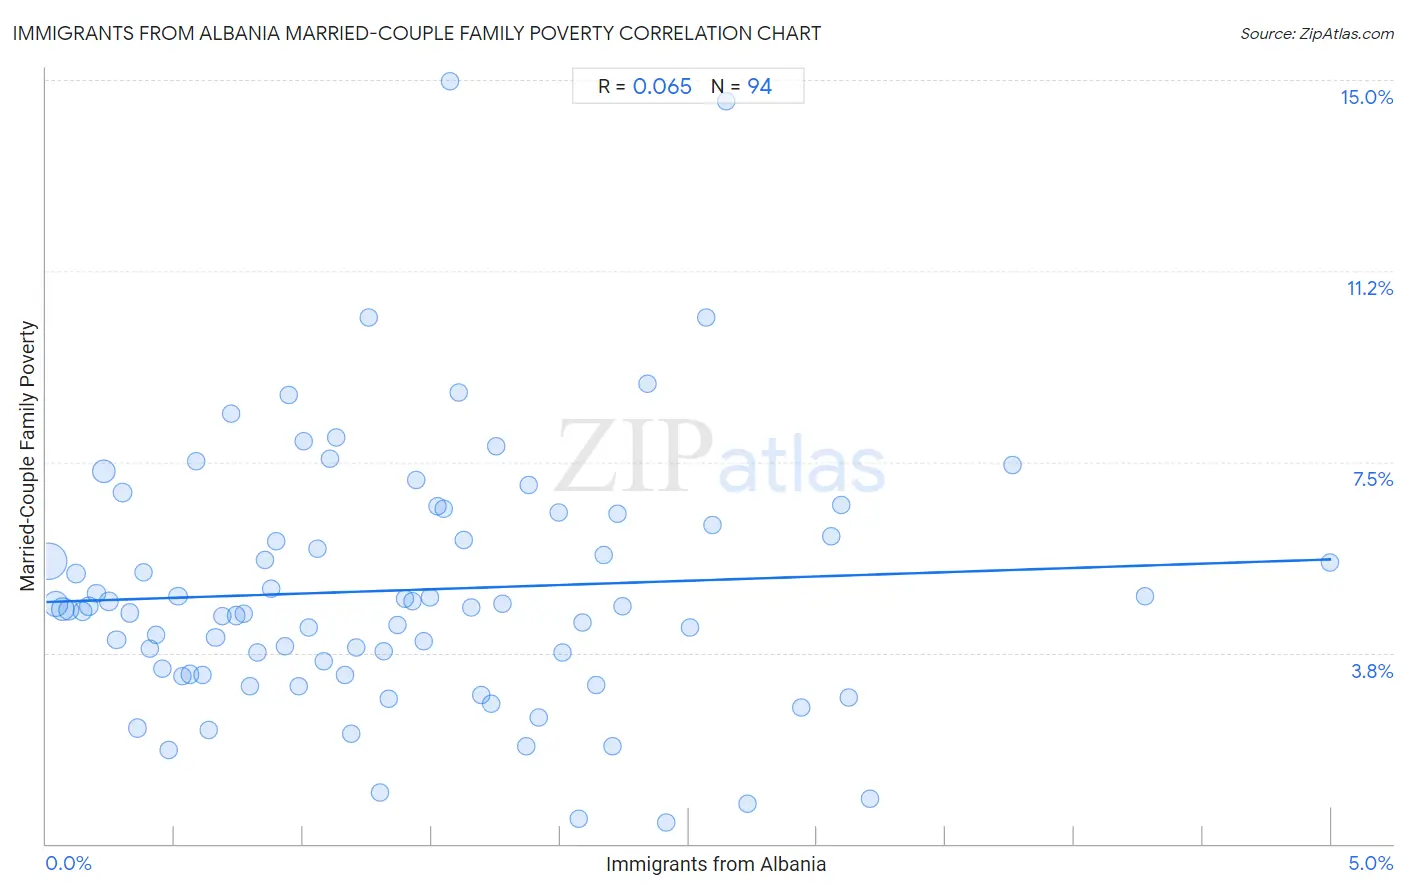
Immigrants from Albania Married-Couple Family Poverty Correlation Chart
The statistical analysis conducted on geographies consisting of 119,005,627 people shows a slight positive correlation between the proportion of Immigrants from Albania and poverty level among married-couple families in the United States with a correlation coefficient (R) of 0.065 and weighted average of 5.3%. On average, for every 1% (one percent) increase in Immigrants from Albania within a typical geography, there is an increase of 0.17% in poverty level among married-couple families.
It is essential to understand that the correlation between the percentage of Immigrants from Albania and poverty level among married-couple families does not imply a direct cause-and-effect relationship. It remains uncertain whether the presence of Immigrants from Albania influences an upward or downward trend in the level of poverty level among married-couple families within an area, or if Immigrants from Albania simply ended up residing in those areas with higher or lower levels of poverty level among married-couple families due to other factors.
Demographics Similar to Immigrants from Albania by Married-Couple Family Poverty
In terms of married-couple family poverty, the demographic groups most similar to Immigrants from Albania are Israeli (5.3%, a difference of 0.090%), Hungarian (5.3%, a difference of 0.11%), South American Indian (5.3%, a difference of 0.18%), American (5.3%, a difference of 0.19%), and Nonimmigrants (5.3%, a difference of 0.25%).
| Demographics | Rating | Rank | Married-Couple Family Poverty |
| Immigrants from Sierra Leone | 39.3 /100 | #180 | Fair 5.3% |
| Immigrants from Chile | 38.8 /100 | #181 | Fair 5.3% |
| Immigrants from Vietnam | 37.7 /100 | #182 | Fair 5.3% |
| Peruvians | 37.6 /100 | #183 | Fair 5.3% |
| Nonimmigrants | 35.8 /100 | #184 | Fair 5.3% |
| Americans | 35.4 /100 | #185 | Fair 5.3% |
| Hungarians | 34.7 /100 | #186 | Fair 5.3% |
| Immigrants from Albania | 33.8 /100 | #187 | Fair 5.3% |
| Israelis | 33.1 /100 | #188 | Fair 5.3% |
| South American Indians | 32.5 /100 | #189 | Fair 5.3% |
| Ugandans | 31.6 /100 | #190 | Fair 5.3% |
| Immigrants from Cabo Verde | 30.9 /100 | #191 | Fair 5.3% |
| Cape Verdeans | 30.7 /100 | #192 | Fair 5.3% |
| Malaysians | 29.5 /100 | #193 | Fair 5.4% |
| Immigrants from Israel | 27.8 /100 | #194 | Fair 5.4% |
Immigrants from Albania Married-Couple Family Poverty Correlation Summary
| Measurement | Immigrants from Albania Data | Married-Couple Family Poverty Data |
| Minimum | 0.011% | 0.42% |
| Maximum | 5.0% | 15.0% |
| Range | 5.0% | 14.6% |
| Mean | 1.4% | 5.0% |
| Median | 1.2% | 4.6% |
| Interquartile 25% (IQ1) | 0.61% | 3.3% |
| Interquartile 75% (IQ3) | 2.0% | 6.3% |
| Interquartile Range (IQR) | 1.4% | 2.9% |
| Standard Deviation (Sample) | 0.99% | 2.5% |
| Standard Deviation (Population) | 0.99% | 2.5% |
Correlation Details
| Immigrants from Albania Percentile | Sample Size | Married-Couple Family Poverty |
[ 0.0% - 0.5% ] 0.011% | 44,401,240 | 5.6% |
[ 0.0% - 0.5% ] 0.038% | 16,947,636 | 4.7% |
[ 0.0% - 0.5% ] 0.065% | 10,209,150 | 4.6% |
[ 0.0% - 0.5% ] 0.089% | 5,670,760 | 4.6% |
[ 0.0% - 0.5% ] 0.12% | 3,919,511 | 5.3% |
[ 0.0% - 0.5% ] 0.14% | 2,743,019 | 4.6% |
[ 0.0% - 0.5% ] 0.17% | 2,846,254 | 4.7% |
[ 0.0% - 0.5% ] 0.19% | 1,818,698 | 4.9% |
[ 0.0% - 0.5% ] 0.23% | 11,518,874 | 7.3% |
[ 0.0% - 0.5% ] 0.25% | 2,493,117 | 4.8% |
[ 0.0% - 0.5% ] 0.27% | 1,032,818 | 4.0% |
[ 0.0% - 0.5% ] 0.30% | 2,752,252 | 6.9% |
[ 0.0% - 0.5% ] 0.33% | 983,306 | 4.5% |
[ 0.0% - 0.5% ] 0.35% | 311,770 | 2.3% |
[ 0.0% - 0.5% ] 0.38% | 939,582 | 5.3% |
[ 0.0% - 0.5% ] 0.40% | 685,925 | 3.8% |
[ 0.0% - 0.5% ] 0.43% | 831,424 | 4.1% |
[ 0.0% - 0.5% ] 0.45% | 458,771 | 3.4% |
[ 0.0% - 0.5% ] 0.48% | 208,272 | 1.9% |
[ 0.5% - 1.0% ] 0.51% | 348,431 | 4.9% |
[ 0.5% - 1.0% ] 0.53% | 375,732 | 3.3% |
[ 0.5% - 1.0% ] 0.56% | 388,615 | 3.3% |
[ 0.5% - 1.0% ] 0.59% | 141,855 | 7.5% |
[ 0.5% - 1.0% ] 0.61% | 168,564 | 3.3% |
[ 0.5% - 1.0% ] 0.63% | 123,710 | 2.2% |
[ 0.5% - 1.0% ] 0.66% | 224,030 | 4.1% |
[ 0.5% - 1.0% ] 0.69% | 614,796 | 4.5% |
[ 0.5% - 1.0% ] 0.72% | 506,935 | 8.4% |
[ 0.5% - 1.0% ] 0.74% | 371,836 | 4.5% |
[ 0.5% - 1.0% ] 0.77% | 130,008 | 4.5% |
[ 0.5% - 1.0% ] 0.79% | 229,641 | 3.1% |
[ 0.5% - 1.0% ] 0.82% | 156,645 | 3.8% |
[ 0.5% - 1.0% ] 0.85% | 185,393 | 5.6% |
[ 0.5% - 1.0% ] 0.88% | 299,326 | 5.0% |
[ 0.5% - 1.0% ] 0.90% | 129,055 | 6.0% |
[ 0.5% - 1.0% ] 0.93% | 164,560 | 3.9% |
[ 0.5% - 1.0% ] 0.94% | 44,196 | 8.8% |
[ 0.5% - 1.0% ] 0.98% | 125,758 | 3.1% |
[ 0.5% - 1.0% ] 1.00% | 172,211 | 7.9% |
[ 1.0% - 1.5% ] 1.02% | 110,301 | 4.2% |
[ 1.0% - 1.5% ] 1.05% | 153,276 | 5.8% |
[ 1.0% - 1.5% ] 1.08% | 66,165 | 3.6% |
[ 1.0% - 1.5% ] 1.11% | 181,601 | 7.6% |
[ 1.0% - 1.5% ] 1.13% | 125,720 | 8.0% |
[ 1.0% - 1.5% ] 1.16% | 122,576 | 3.3% |
[ 1.0% - 1.5% ] 1.19% | 87,969 | 2.2% |
[ 1.0% - 1.5% ] 1.21% | 86,266 | 3.9% |
[ 1.0% - 1.5% ] 1.25% | 55,124 | 10.3% |
[ 1.0% - 1.5% ] 1.30% | 26,488 | 1.0% |
[ 1.0% - 1.5% ] 1.31% | 83,752 | 3.8% |
[ 1.0% - 1.5% ] 1.33% | 43,682 | 2.9% |
[ 1.0% - 1.5% ] 1.37% | 55,344 | 4.3% |
[ 1.0% - 1.5% ] 1.39% | 172,658 | 4.8% |
[ 1.0% - 1.5% ] 1.42% | 146,188 | 4.8% |
[ 1.0% - 1.5% ] 1.44% | 204,191 | 7.2% |
[ 1.0% - 1.5% ] 1.47% | 100,388 | 4.0% |
[ 1.0% - 1.5% ] 1.49% | 211,068 | 4.8% |
[ 1.5% - 2.0% ] 1.52% | 66,258 | 6.6% |
[ 1.5% - 2.0% ] 1.54% | 40,203 | 6.6% |
[ 1.5% - 2.0% ] 1.57% | 91,687 | 15.0% |
[ 1.5% - 2.0% ] 1.60% | 35,211 | 8.9% |
[ 1.5% - 2.0% ] 1.62% | 41,356 | 6.0% |
[ 1.5% - 2.0% ] 1.65% | 13,924 | 4.6% |
[ 1.5% - 2.0% ] 1.69% | 38,845 | 2.9% |
[ 1.5% - 2.0% ] 1.73% | 92,572 | 2.8% |
[ 1.5% - 2.0% ] 1.75% | 50,868 | 7.8% |
[ 1.5% - 2.0% ] 1.78% | 61,164 | 4.7% |
[ 1.5% - 2.0% ] 1.87% | 23,256 | 1.9% |
[ 1.5% - 2.0% ] 1.88% | 5,325 | 7.0% |
[ 1.5% - 2.0% ] 1.92% | 108,261 | 2.5% |
[ 1.5% - 2.0% ] 1.99% | 66,150 | 6.5% |
[ 2.0% - 2.5% ] 2.01% | 24,728 | 3.8% |
[ 2.0% - 2.5% ] 2.07% | 7,282 | 0.48% |
[ 2.0% - 2.5% ] 2.09% | 44,255 | 4.3% |
[ 2.0% - 2.5% ] 2.14% | 60,883 | 3.1% |
[ 2.0% - 2.5% ] 2.17% | 105,521 | 5.7% |
[ 2.0% - 2.5% ] 2.20% | 28,248 | 1.9% |
[ 2.0% - 2.5% ] 2.22% | 2,476 | 6.5% |
[ 2.0% - 2.5% ] 2.24% | 23,540 | 4.7% |
[ 2.0% - 2.5% ] 2.34% | 20,678 | 9.0% |
[ 2.0% - 2.5% ] 2.41% | 9,826 | 0.42% |
[ 2.5% - 3.0% ] 2.51% | 1,875 | 4.2% |
[ 2.5% - 3.0% ] 2.57% | 3,700 | 10.3% |
[ 2.5% - 3.0% ] 2.59% | 84,827 | 6.3% |
[ 2.5% - 3.0% ] 2.64% | 605 | 14.6% |
[ 2.5% - 3.0% ] 2.73% | 9,387 | 0.78% |
[ 2.5% - 3.0% ] 2.94% | 2,688 | 2.7% |
[ 3.0% - 3.5% ] 3.06% | 29,215 | 6.0% |
[ 3.0% - 3.5% ] 3.09% | 7,213 | 6.7% |
[ 3.0% - 3.5% ] 3.12% | 38,062 | 2.9% |
[ 3.0% - 3.5% ] 3.21% | 7,987 | 0.89% |
[ 3.5% - 4.0% ] 3.76% | 2,049 | 7.4% |
[ 4.0% - 4.5% ] 4.28% | 23,200 | 4.9% |
[ 4.5% - 5.0% ] 4.99% | 25,869 | 5.5% |