Immigrants Male Disability
COMPARE
Immigrants
Select to Compare
Male Disability
Immigrants Male Disability
10.8%
DISABILITY | MALES
93.9/ 100
METRIC RATING
110th/ 347
METRIC RANK
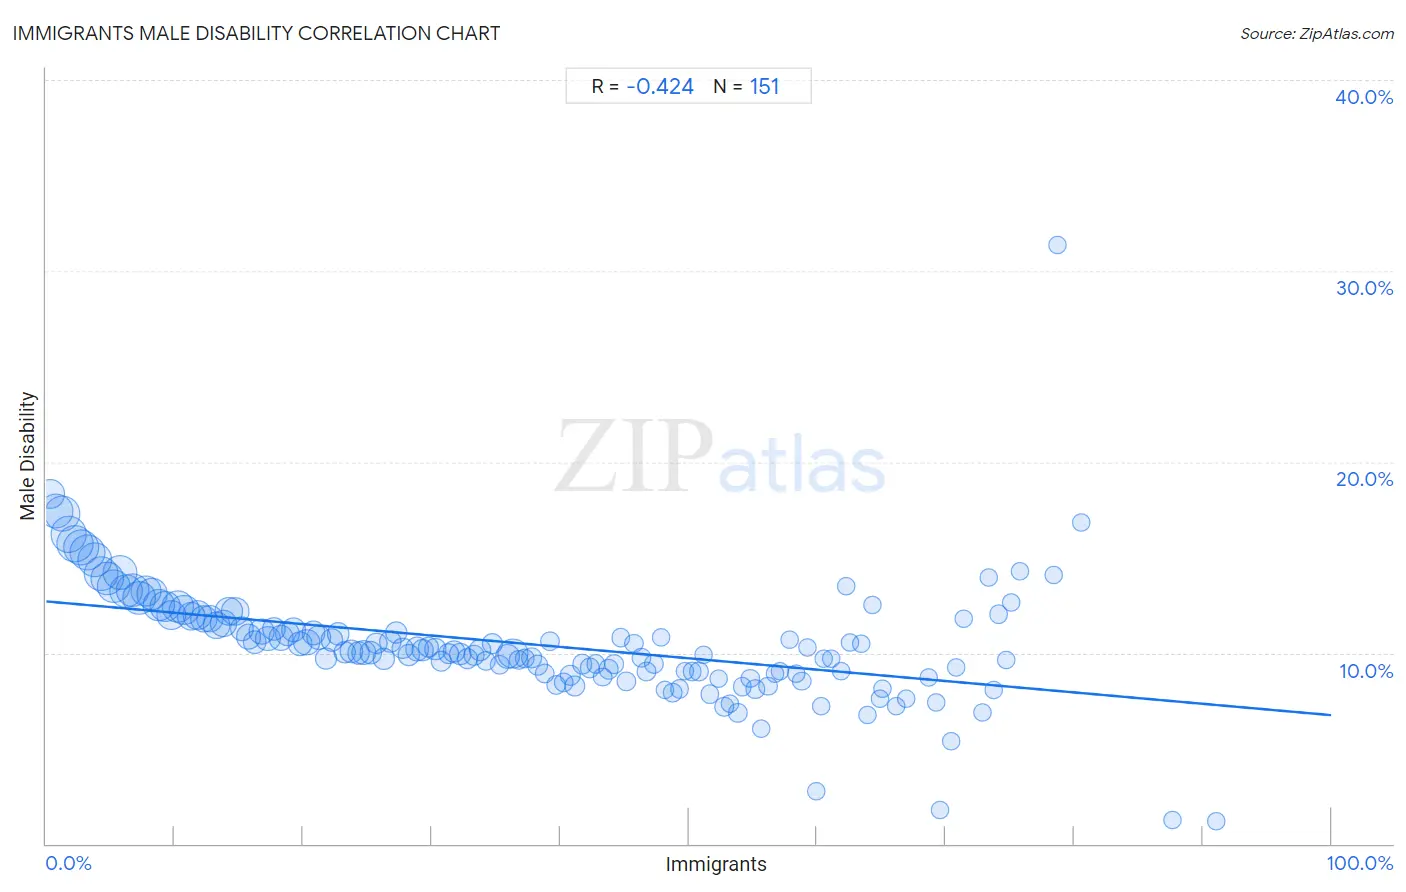
Immigrants Male Disability Correlation Chart
The statistical analysis conducted on geographies consisting of 577,387,777 people shows a moderate negative correlation between the proportion of Immigrants and percentage of males with a disability in the United States with a correlation coefficient (R) of -0.424 and weighted average of 10.8%. On average, for every 1% (one percent) increase in Immigrants within a typical geography, there is a decrease of 0.060% in percentage of males with a disability.
It is essential to understand that the correlation between the percentage of Immigrants and percentage of males with a disability does not imply a direct cause-and-effect relationship. It remains uncertain whether the presence of Immigrants influences an upward or downward trend in the level of percentage of males with a disability within an area, or if Immigrants simply ended up residing in those areas with higher or lower levels of percentage of males with a disability due to other factors.
Demographics Similar to Immigrants by Male Disability
In terms of male disability, the demographic groups most similar to Immigrants are Immigrants from Uganda (10.8%, a difference of 0.030%), Immigrants from Uruguay (10.8%, a difference of 0.040%), Immigrants from Belgium (10.8%, a difference of 0.080%), Immigrants from Eastern Africa (10.8%, a difference of 0.090%), and Ghanaian (10.8%, a difference of 0.14%).
| Demographics | Rating | Rank | Male Disability |
| Uruguayans | 95.3 /100 | #103 | Exceptional 10.7% |
| Immigrants from Nigeria | 95.1 /100 | #104 | Exceptional 10.8% |
| Immigrants from Brazil | 95.0 /100 | #105 | Exceptional 10.8% |
| Immigrants from Syria | 94.9 /100 | #106 | Exceptional 10.8% |
| Immigrants from Eastern Africa | 94.3 /100 | #107 | Exceptional 10.8% |
| Immigrants from Belgium | 94.2 /100 | #108 | Exceptional 10.8% |
| Immigrants from Uganda | 94.0 /100 | #109 | Exceptional 10.8% |
| Immigrants | 93.9 /100 | #110 | Exceptional 10.8% |
| Immigrants from Uruguay | 93.8 /100 | #111 | Exceptional 10.8% |
| Ghanaians | 93.4 /100 | #112 | Exceptional 10.8% |
| Immigrants from Zimbabwe | 93.0 /100 | #113 | Exceptional 10.8% |
| Central Americans | 92.7 /100 | #114 | Exceptional 10.8% |
| Immigrants from Barbados | 92.2 /100 | #115 | Exceptional 10.8% |
| Immigrants from South Africa | 91.8 /100 | #116 | Exceptional 10.8% |
| Eastern Europeans | 90.6 /100 | #117 | Exceptional 10.9% |
Immigrants Male Disability Correlation Summary
| Measurement | Immigrants Data | Male Disability Data |
| Minimum | 0.28% | 1.2% |
| Maximum | 91.1% | 31.4% |
| Range | 90.8% | 30.2% |
| Mean | 38.3% | 10.4% |
| Median | 37.8% | 10.0% |
| Interquartile 25% (IQ1) | 18.8% | 8.9% |
| Interquartile 75% (IQ3) | 56.7% | 11.8% |
| Interquartile Range (IQR) | 37.9% | 2.8% |
| Standard Deviation (Sample) | 22.8% | 3.2% |
| Standard Deviation (Population) | 22.7% | 3.2% |
Correlation Details
| Immigrants Percentile | Sample Size | Male Disability |
[ 0.0% - 0.5% ] 0.28% | 9,792,091 | 18.3% |
[ 0.5% - 1.0% ] 0.76% | 14,922,176 | 17.4% |
[ 1.0% - 1.5% ] 1.25% | 15,913,590 | 17.3% |
[ 1.5% - 2.0% ] 1.75% | 15,752,599 | 16.2% |
[ 2.0% - 2.5% ] 2.24% | 16,735,791 | 15.7% |
[ 2.5% - 3.0% ] 2.74% | 15,757,610 | 15.5% |
[ 3.0% - 3.5% ] 3.24% | 15,742,654 | 15.3% |
[ 3.5% - 4.0% ] 3.75% | 14,911,123 | 14.9% |
[ 4.0% - 4.5% ] 4.25% | 14,669,739 | 14.2% |
[ 4.5% - 5.0% ] 4.75% | 13,925,957 | 13.9% |
[ 5.0% - 5.5% ] 5.26% | 13,510,134 | 13.5% |
[ 5.5% - 6.0% ] 5.75% | 14,492,657 | 14.2% |
[ 6.0% - 6.5% ] 6.24% | 13,730,986 | 13.2% |
[ 6.5% - 7.0% ] 6.75% | 13,109,691 | 13.3% |
[ 7.0% - 7.5% ] 7.24% | 12,656,407 | 12.9% |
[ 7.5% - 8.0% ] 7.74% | 11,625,241 | 13.3% |
[ 8.0% - 8.5% ] 8.23% | 11,974,919 | 13.1% |
[ 8.5% - 9.0% ] 8.74% | 12,116,300 | 12.5% |
[ 9.0% - 9.5% ] 9.25% | 10,798,989 | 12.4% |
[ 9.5% - 10.0% ] 9.76% | 9,908,865 | 12.0% |
[ 10.0% - 10.5% ] 10.26% | 11,698,927 | 12.4% |
[ 10.5% - 11.0% ] 10.74% | 10,265,231 | 12.2% |
[ 11.0% - 11.5% ] 11.24% | 8,916,321 | 11.9% |
[ 11.5% - 12.0% ] 11.76% | 9,981,268 | 12.0% |
[ 12.0% - 12.5% ] 12.22% | 7,665,295 | 11.8% |
[ 12.5% - 13.0% ] 12.75% | 7,962,357 | 11.8% |
[ 13.0% - 13.5% ] 13.25% | 7,148,362 | 11.4% |
[ 13.5% - 14.0% ] 13.80% | 8,317,181 | 11.5% |
[ 14.0% - 14.5% ] 14.24% | 8,826,139 | 12.2% |
[ 14.5% - 15.0% ] 14.73% | 8,591,515 | 12.2% |
[ 15.0% - 15.5% ] 15.23% | 5,440,952 | 11.3% |
[ 15.5% - 16.0% ] 15.77% | 5,915,882 | 10.8% |
[ 16.0% - 16.5% ] 16.23% | 5,019,307 | 10.6% |
[ 16.5% - 17.0% ] 16.74% | 6,101,639 | 11.1% |
[ 17.0% - 17.5% ] 17.25% | 5,953,081 | 10.8% |
[ 17.5% - 18.0% ] 17.70% | 4,131,168 | 11.2% |
[ 18.0% - 18.5% ] 18.25% | 5,996,517 | 10.8% |
[ 18.5% - 19.0% ] 18.78% | 5,663,803 | 11.0% |
[ 19.0% - 19.5% ] 19.26% | 5,946,683 | 11.2% |
[ 19.5% - 20.0% ] 19.74% | 5,474,921 | 10.5% |
[ 20.0% - 20.5% ] 20.27% | 7,110,548 | 10.6% |
[ 20.5% - 21.0% ] 20.77% | 4,832,268 | 11.0% |
[ 21.0% - 21.5% ] 21.23% | 5,560,836 | 10.8% |
[ 21.5% - 22.0% ] 21.77% | 3,710,461 | 9.7% |
[ 22.0% - 22.5% ] 22.23% | 4,427,022 | 10.7% |
[ 22.5% - 23.0% ] 22.73% | 4,303,330 | 11.0% |
[ 23.0% - 23.5% ] 23.24% | 3,756,670 | 10.0% |
[ 23.5% - 24.0% ] 23.76% | 4,202,278 | 10.1% |
[ 24.0% - 24.5% ] 24.28% | 3,613,879 | 10.0% |
[ 24.5% - 25.0% ] 24.75% | 5,523,768 | 10.0% |
[ 25.0% - 25.5% ] 25.25% | 4,176,836 | 10.0% |
[ 25.5% - 26.0% ] 25.69% | 2,918,874 | 10.5% |
[ 26.0% - 26.5% ] 26.24% | 3,199,599 | 9.7% |
[ 26.5% - 27.0% ] 26.76% | 2,755,951 | 10.6% |
[ 27.0% - 27.5% ] 27.27% | 3,317,408 | 11.1% |
[ 27.5% - 28.0% ] 27.73% | 2,977,833 | 10.2% |
[ 28.0% - 28.5% ] 28.24% | 3,348,516 | 9.9% |
[ 28.5% - 29.0% ] 28.86% | 5,113,025 | 10.2% |
[ 29.0% - 29.5% ] 29.27% | 3,120,548 | 10.2% |
[ 29.5% - 30.0% ] 29.76% | 2,779,612 | 10.3% |
[ 30.0% - 30.5% ] 30.27% | 2,698,895 | 10.2% |
[ 30.5% - 31.0% ] 30.74% | 2,240,200 | 9.6% |
[ 31.0% - 31.5% ] 31.31% | 2,414,115 | 10.0% |
[ 31.5% - 32.0% ] 31.75% | 2,832,949 | 10.1% |
[ 32.0% - 32.5% ] 32.21% | 2,889,655 | 9.9% |
[ 32.5% - 33.0% ] 32.75% | 2,369,398 | 9.7% |
[ 33.0% - 33.5% ] 33.27% | 1,734,703 | 9.9% |
[ 33.5% - 34.0% ] 33.74% | 3,249,442 | 10.2% |
[ 34.0% - 34.5% ] 34.23% | 1,748,922 | 9.6% |
[ 34.5% - 35.0% ] 34.74% | 2,390,056 | 10.5% |
[ 35.0% - 35.5% ] 35.26% | 1,586,411 | 9.4% |
[ 35.5% - 36.0% ] 35.91% | 5,381,430 | 9.8% |
[ 36.0% - 36.5% ] 36.32% | 10,447,094 | 9.9% |
[ 36.5% - 37.0% ] 36.77% | 1,321,397 | 9.6% |
[ 37.0% - 37.5% ] 37.26% | 1,596,141 | 9.7% |
[ 37.5% - 38.0% ] 37.76% | 1,537,333 | 9.7% |
[ 38.0% - 38.5% ] 38.23% | 1,934,404 | 9.4% |
[ 38.5% - 39.0% ] 38.81% | 1,611,800 | 8.9% |
[ 39.0% - 39.5% ] 39.23% | 1,153,920 | 10.6% |
[ 39.5% - 40.0% ] 39.69% | 1,208,851 | 8.3% |
[ 40.0% - 40.5% ] 40.25% | 1,249,653 | 8.4% |
[ 40.5% - 41.0% ] 40.76% | 1,733,625 | 8.8% |
[ 41.0% - 41.5% ] 41.11% | 2,638,081 | 8.3% |
[ 41.5% - 42.0% ] 41.73% | 1,525,850 | 9.4% |
[ 42.0% - 42.5% ] 42.28% | 1,498,423 | 9.2% |
[ 42.5% - 43.0% ] 42.78% | 815,858 | 9.4% |
[ 43.0% - 43.5% ] 43.26% | 890,239 | 8.7% |
[ 43.5% - 44.0% ] 43.79% | 1,289,775 | 9.1% |
[ 44.0% - 44.5% ] 44.20% | 368,443 | 9.4% |
[ 44.5% - 45.0% ] 44.72% | 858,656 | 10.8% |
[ 45.0% - 45.5% ] 45.14% | 871,806 | 8.5% |
[ 45.5% - 46.0% ] 45.75% | 709,891 | 10.5% |
[ 46.0% - 46.5% ] 46.30% | 775,811 | 9.7% |
[ 46.5% - 47.0% ] 46.72% | 708,226 | 9.0% |
[ 47.0% - 47.5% ] 47.30% | 841,320 | 9.4% |
[ 47.5% - 48.0% ] 47.83% | 277,561 | 10.8% |
[ 48.0% - 48.5% ] 48.14% | 169,549 | 8.0% |
[ 48.5% - 49.0% ] 48.74% | 845,868 | 7.9% |
[ 49.0% - 49.5% ] 49.28% | 847,337 | 8.1% |
[ 49.5% - 50.0% ] 49.69% | 165,984 | 9.1% |
[ 50.0% - 50.5% ] 50.28% | 640,490 | 9.0% |
[ 50.5% - 51.0% ] 50.79% | 730,401 | 9.0% |
[ 51.0% - 51.5% ] 51.18% | 319,766 | 9.9% |
[ 51.5% - 52.0% ] 51.67% | 305,963 | 7.8% |
[ 52.0% - 52.5% ] 52.32% | 204,872 | 8.6% |
[ 52.5% - 53.0% ] 52.76% | 236,458 | 7.2% |
[ 53.0% - 53.5% ] 53.23% | 137,110 | 7.3% |
[ 53.5% - 54.0% ] 53.81% | 463,502 | 6.8% |
[ 54.0% - 54.5% ] 54.17% | 374,567 | 8.2% |
[ 54.5% - 55.0% ] 54.78% | 593,597 | 8.7% |
[ 55.0% - 55.5% ] 55.18% | 482,758 | 8.1% |
[ 55.5% - 56.0% ] 55.61% | 148,289 | 6.0% |
[ 56.0% - 56.5% ] 56.17% | 91,519 | 8.2% |
[ 56.5% - 57.0% ] 56.72% | 75,873 | 8.9% |
[ 57.0% - 57.5% ] 57.13% | 110,508 | 9.0% |
[ 57.5% - 58.0% ] 57.84% | 598,156 | 10.7% |
[ 58.0% - 58.5% ] 58.34% | 98,125 | 8.9% |
[ 58.5% - 59.0% ] 58.80% | 221,458 | 8.5% |
[ 59.0% - 59.5% ] 59.19% | 86,935 | 10.3% |
[ 59.5% - 60.0% ] 59.92% | 15,852 | 2.7% |
[ 60.0% - 60.5% ] 60.30% | 154,064 | 7.2% |
[ 60.5% - 61.0% ] 60.53% | 36,392 | 9.7% |
[ 61.0% - 61.5% ] 61.13% | 58,079 | 9.7% |
[ 61.5% - 62.0% ] 61.88% | 128,876 | 9.0% |
[ 62.0% - 62.5% ] 62.28% | 93,984 | 13.5% |
[ 62.5% - 63.0% ] 62.58% | 26,090 | 10.5% |
[ 63.0% - 63.5% ] 63.42% | 26,777 | 10.5% |
[ 63.5% - 64.0% ] 63.90% | 117,893 | 6.8% |
[ 64.0% - 64.5% ] 64.33% | 109,357 | 12.5% |
[ 64.5% - 65.0% ] 64.88% | 105,802 | 7.6% |
[ 65.0% - 65.5% ] 65.10% | 53,206 | 8.1% |
[ 66.0% - 66.5% ] 66.17% | 152,851 | 7.2% |
[ 66.5% - 67.0% ] 66.91% | 109,218 | 7.6% |
[ 68.5% - 69.0% ] 68.68% | 119,624 | 8.7% |
[ 69.0% - 69.5% ] 69.26% | 90,791 | 7.4% |
[ 69.5% - 70.0% ] 69.58% | 766 | 1.8% |
[ 70.0% - 70.5% ] 70.39% | 115,169 | 5.3% |
[ 70.5% - 71.0% ] 70.79% | 138,182 | 9.3% |
[ 71.0% - 71.5% ] 71.37% | 45,620 | 11.8% |
[ 72.5% - 73.0% ] 72.85% | 57,066 | 6.9% |
[ 73.0% - 73.5% ] 73.31% | 29,830 | 14.0% |
[ 73.5% - 74.0% ] 73.75% | 19,399 | 8.1% |
[ 74.0% - 74.5% ] 74.15% | 257,738 | 12.0% |
[ 74.5% - 75.0% ] 74.68% | 46,798 | 9.6% |
[ 75.0% - 75.5% ] 75.10% | 71,088 | 12.6% |
[ 75.5% - 76.0% ] 75.74% | 1,018 | 14.3% |
[ 78.0% - 78.5% ] 78.37% | 42,081 | 14.1% |
[ 78.5% - 79.0% ] 78.65% | 178 | 31.4% |
[ 80.5% - 81.0% ] 80.58% | 1,030 | 16.8% |
[ 87.5% - 88.0% ] 87.63% | 97 | 1.2% |
[ 91.0% - 91.5% ] 91.07% | 112 | 1.2% |