Immigrants 1 or more Vehicles in Household
COMPARE
Immigrants
Select to Compare
1 or more Vehicles in Household
Immigrants 1 or more Vehicles in Household
90.1%
1+ VEHICLES AVAILABLE
73.6/ 100
METRIC RATING
155th/ 347
METRIC RANK
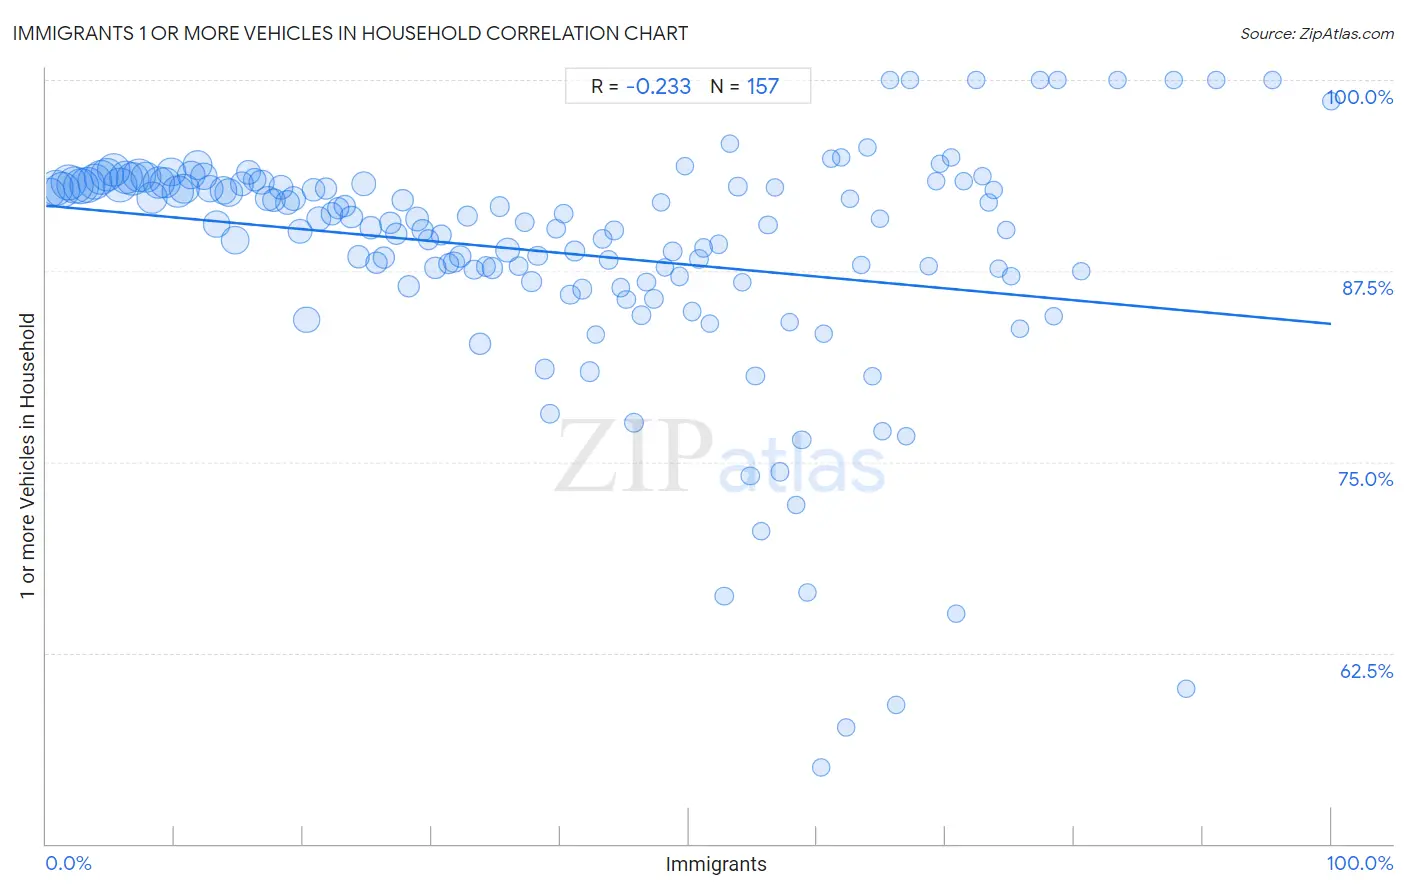
Immigrants 1 or more Vehicles in Household Correlation Chart
The statistical analysis conducted on geographies consisting of 566,737,688 people shows a weak negative correlation between the proportion of Immigrants and percentage of households with 1 or more vehicles available in the United States with a correlation coefficient (R) of -0.233 and weighted average of 90.1%. On average, for every 1% (one percent) increase in Immigrants within a typical geography, there is a decrease of 0.077% in percentage of households with 1 or more vehicles available.
It is essential to understand that the correlation between the percentage of Immigrants and percentage of households with 1 or more vehicles available does not imply a direct cause-and-effect relationship. It remains uncertain whether the presence of Immigrants influences an upward or downward trend in the level of percentage of households with 1 or more vehicles available within an area, or if Immigrants simply ended up residing in those areas with higher or lower levels of percentage of households with 1 or more vehicles available due to other factors.
Demographics Similar to Immigrants by 1 or more Vehicles in Household
In terms of 1 or more vehicles in household, the demographic groups most similar to Immigrants are New Zealander (90.1%, a difference of 0.0%), Immigrants from Uganda (90.1%, a difference of 0.0%), Tlingit-Haida (90.1%, a difference of 0.010%), Australian (90.0%, a difference of 0.020%), and Immigrants from Bosnia and Herzegovina (90.1%, a difference of 0.040%).
| Demographics | Rating | Rank | 1 or more Vehicles in Household |
| Immigrants from Eastern Africa | 78.2 /100 | #148 | Good 90.1% |
| Immigrants from Nicaragua | 76.7 /100 | #149 | Good 90.1% |
| Immigrants from Micronesia | 75.9 /100 | #150 | Good 90.1% |
| Immigrants from Bosnia and Herzegovina | 75.4 /100 | #151 | Good 90.1% |
| Tlingit-Haida | 74.3 /100 | #152 | Good 90.1% |
| New Zealanders | 73.8 /100 | #153 | Good 90.1% |
| Immigrants from Uganda | 73.8 /100 | #154 | Good 90.1% |
| Immigrants | 73.6 /100 | #155 | Good 90.1% |
| Australians | 72.4 /100 | #156 | Good 90.0% |
| Immigrants from Congo | 71.2 /100 | #157 | Good 90.0% |
| Brazilians | 71.0 /100 | #158 | Good 90.0% |
| South Africans | 69.7 /100 | #159 | Good 90.0% |
| Immigrants from Indonesia | 68.8 /100 | #160 | Good 90.0% |
| Salvadorans | 68.7 /100 | #161 | Good 90.0% |
| Spanish American Indians | 67.0 /100 | #162 | Good 89.9% |
Immigrants 1 or more Vehicles in Household Correlation Summary
| Measurement | Immigrants Data | 1 or more Vehicles in Household Data |
| Minimum | 0.28% | 55.0% |
| Maximum | 100.0% | 100.0% |
| Range | 99.7% | 45.0% |
| Mean | 40.3% | 88.7% |
| Median | 39.7% | 90.6% |
| Interquartile 25% (IQ1) | 19.5% | 87.0% |
| Interquartile 75% (IQ3) | 59.7% | 93.2% |
| Interquartile Range (IQR) | 40.3% | 6.2% |
| Standard Deviation (Sample) | 24.4% | 8.1% |
| Standard Deviation (Population) | 24.3% | 8.1% |
Correlation Details
| Immigrants Percentile | Sample Size | 1 or more Vehicles in Household |
[ 0.0% - 0.5% ] 0.28% | 9,789,551 | 92.6% |
[ 0.5% - 1.0% ] 0.76% | 14,920,047 | 92.9% |
[ 1.0% - 1.5% ] 1.25% | 15,914,629 | 92.8% |
[ 1.5% - 2.0% ] 1.75% | 15,757,521 | 93.3% |
[ 2.0% - 2.5% ] 2.24% | 16,728,041 | 93.2% |
[ 2.5% - 3.0% ] 2.74% | 15,741,789 | 93.1% |
[ 3.0% - 3.5% ] 3.24% | 15,717,259 | 93.1% |
[ 3.5% - 4.0% ] 3.75% | 14,893,749 | 93.4% |
[ 4.0% - 4.5% ] 4.25% | 14,672,233 | 93.6% |
[ 4.5% - 5.0% ] 4.75% | 13,921,067 | 93.8% |
[ 5.0% - 5.5% ] 5.26% | 13,498,030 | 94.1% |
[ 5.5% - 6.0% ] 5.75% | 14,480,657 | 93.1% |
[ 6.0% - 6.5% ] 6.24% | 13,692,933 | 93.6% |
[ 6.5% - 7.0% ] 6.75% | 13,099,037 | 93.5% |
[ 7.0% - 7.5% ] 7.24% | 12,654,269 | 93.7% |
[ 7.5% - 8.0% ] 7.74% | 11,616,663 | 93.6% |
[ 8.0% - 8.5% ] 8.23% | 11,971,132 | 92.3% |
[ 8.5% - 9.0% ] 8.74% | 12,113,604 | 93.3% |
[ 9.0% - 9.5% ] 9.25% | 10,788,546 | 93.3% |
[ 9.5% - 10.0% ] 9.76% | 9,899,395 | 94.0% |
[ 10.0% - 10.5% ] 10.26% | 11,700,172 | 92.7% |
[ 10.5% - 11.0% ] 10.74% | 10,249,816 | 92.9% |
[ 11.0% - 11.5% ] 11.24% | 8,915,041 | 93.8% |
[ 11.5% - 12.0% ] 11.76% | 9,974,935 | 94.5% |
[ 12.0% - 12.5% ] 12.22% | 7,661,480 | 93.7% |
[ 12.5% - 13.0% ] 12.75% | 7,940,078 | 92.9% |
[ 13.0% - 13.5% ] 13.25% | 7,148,633 | 90.6% |
[ 13.5% - 14.0% ] 13.80% | 8,316,946 | 92.8% |
[ 14.0% - 14.5% ] 14.24% | 8,821,308 | 92.6% |
[ 14.5% - 15.0% ] 14.73% | 8,592,777 | 89.5% |
[ 15.0% - 15.5% ] 15.23% | 5,435,792 | 93.2% |
[ 15.5% - 16.0% ] 15.77% | 5,918,626 | 94.0% |
[ 16.0% - 16.5% ] 16.23% | 5,021,206 | 93.5% |
[ 16.5% - 17.0% ] 16.74% | 6,104,227 | 93.3% |
[ 17.0% - 17.5% ] 17.25% | 5,951,822 | 92.2% |
[ 17.5% - 18.0% ] 17.70% | 4,132,626 | 92.1% |
[ 18.0% - 18.5% ] 18.25% | 5,997,590 | 93.0% |
[ 18.5% - 19.0% ] 18.78% | 5,660,465 | 92.0% |
[ 19.0% - 19.5% ] 19.26% | 5,943,170 | 92.2% |
[ 19.5% - 20.0% ] 19.74% | 5,474,651 | 90.1% |
[ 20.0% - 20.5% ] 20.27% | 7,111,561 | 84.3% |
[ 20.5% - 21.0% ] 20.77% | 4,832,249 | 92.8% |
[ 21.0% - 21.5% ] 21.23% | 5,561,551 | 90.9% |
[ 21.5% - 22.0% ] 21.77% | 3,714,816 | 92.9% |
[ 22.0% - 22.5% ] 22.23% | 4,428,140 | 91.3% |
[ 22.5% - 23.0% ] 22.73% | 4,307,260 | 91.6% |
[ 23.0% - 23.5% ] 23.24% | 3,757,247 | 91.8% |
[ 23.5% - 24.0% ] 23.76% | 4,204,052 | 91.0% |
[ 24.0% - 24.5% ] 24.28% | 3,614,781 | 88.4% |
[ 24.5% - 25.0% ] 24.75% | 5,524,563 | 93.2% |
[ 25.0% - 25.5% ] 25.25% | 4,178,041 | 90.3% |
[ 25.5% - 26.0% ] 25.69% | 2,919,510 | 88.0% |
[ 26.0% - 26.5% ] 26.24% | 3,199,820 | 88.4% |
[ 26.5% - 27.0% ] 26.76% | 2,756,803 | 90.6% |
[ 27.0% - 27.5% ] 27.27% | 3,319,129 | 89.9% |
[ 27.5% - 28.0% ] 27.73% | 2,970,542 | 92.1% |
[ 28.0% - 28.5% ] 28.24% | 3,349,114 | 86.5% |
[ 28.5% - 29.0% ] 28.86% | 5,113,852 | 90.9% |
[ 29.0% - 29.5% ] 29.27% | 3,120,582 | 90.2% |
[ 29.5% - 30.0% ] 29.76% | 2,779,639 | 89.6% |
[ 30.0% - 30.5% ] 30.27% | 2,702,620 | 87.7% |
[ 30.5% - 31.0% ] 30.74% | 2,241,401 | 89.8% |
[ 31.0% - 31.5% ] 31.31% | 2,414,630 | 88.0% |
[ 31.5% - 32.0% ] 31.75% | 2,833,535 | 88.1% |
[ 32.0% - 32.5% ] 32.21% | 2,889,922 | 88.4% |
[ 32.5% - 33.0% ] 32.75% | 2,370,489 | 91.1% |
[ 33.0% - 33.5% ] 33.27% | 1,734,712 | 87.6% |
[ 33.5% - 34.0% ] 33.74% | 3,250,013 | 82.7% |
[ 34.0% - 34.5% ] 34.23% | 1,749,851 | 87.8% |
[ 34.5% - 35.0% ] 34.74% | 2,390,850 | 87.7% |
[ 35.0% - 35.5% ] 35.26% | 1,587,217 | 91.7% |
[ 35.5% - 36.0% ] 35.91% | 5,381,430 | 88.8% |
[ 36.5% - 37.0% ] 36.77% | 1,322,357 | 87.8% |
[ 37.0% - 37.5% ] 37.26% | 1,598,123 | 90.7% |
[ 37.5% - 38.0% ] 37.76% | 1,537,537 | 86.8% |
[ 38.0% - 38.5% ] 38.23% | 1,934,643 | 88.5% |
[ 38.5% - 39.0% ] 38.81% | 1,612,241 | 81.1% |
[ 39.0% - 39.5% ] 39.23% | 1,154,486 | 78.1% |
[ 39.5% - 40.0% ] 39.69% | 1,209,964 | 90.3% |
[ 40.0% - 40.5% ] 40.25% | 1,249,653 | 91.3% |
[ 40.5% - 41.0% ] 40.76% | 1,734,022 | 86.0% |
[ 41.0% - 41.5% ] 41.11% | 2,639,001 | 88.8% |
[ 41.5% - 42.0% ] 41.73% | 1,525,850 | 86.3% |
[ 42.0% - 42.5% ] 42.28% | 1,501,804 | 80.9% |
[ 42.5% - 43.0% ] 42.78% | 816,236 | 83.3% |
[ 43.0% - 43.5% ] 43.26% | 890,544 | 89.6% |
[ 43.5% - 44.0% ] 43.79% | 1,290,311 | 88.2% |
[ 44.0% - 44.5% ] 44.20% | 369,253 | 90.1% |
[ 44.5% - 45.0% ] 44.72% | 858,656 | 86.4% |
[ 45.0% - 45.5% ] 45.14% | 871,806 | 85.6% |
[ 45.5% - 46.0% ] 45.75% | 710,381 | 77.6% |
[ 46.0% - 46.5% ] 46.30% | 775,976 | 84.6% |
[ 46.5% - 47.0% ] 46.72% | 708,284 | 86.8% |
[ 47.0% - 47.5% ] 47.30% | 841,371 | 85.7% |
[ 47.5% - 48.0% ] 47.83% | 277,561 | 92.0% |
[ 48.0% - 48.5% ] 48.14% | 169,826 | 87.7% |
[ 48.5% - 49.0% ] 48.74% | 845,868 | 88.8% |
[ 49.0% - 49.5% ] 49.28% | 847,337 | 87.1% |
[ 49.5% - 50.0% ] 49.69% | 166,054 | 94.4% |
[ 50.0% - 50.5% ] 50.28% | 640,490 | 84.8% |
[ 50.5% - 51.0% ] 50.79% | 730,765 | 88.3% |
[ 51.0% - 51.5% ] 51.18% | 322,007 | 89.0% |
[ 51.5% - 52.0% ] 51.67% | 305,963 | 84.1% |
[ 52.0% - 52.5% ] 52.32% | 205,023 | 89.3% |
[ 52.5% - 53.0% ] 52.76% | 236,458 | 66.2% |
[ 53.0% - 53.5% ] 53.23% | 137,110 | 95.8% |
[ 53.5% - 54.0% ] 53.81% | 463,502 | 93.0% |
[ 54.0% - 54.5% ] 54.17% | 375,384 | 86.7% |
[ 54.5% - 55.0% ] 54.78% | 593,749 | 74.1% |
[ 55.0% - 55.5% ] 55.18% | 482,171 | 80.6% |
[ 55.5% - 56.0% ] 55.61% | 148,599 | 70.4% |
[ 56.0% - 56.5% ] 56.17% | 91,519 | 90.5% |
[ 56.5% - 57.0% ] 56.72% | 75,873 | 93.0% |
[ 57.0% - 57.5% ] 57.13% | 110,585 | 74.3% |
[ 57.5% - 58.0% ] 57.84% | 598,269 | 84.1% |
[ 58.0% - 58.5% ] 58.34% | 98,862 | 72.2% |
[ 58.5% - 59.0% ] 58.80% | 221,572 | 76.4% |
[ 59.0% - 59.5% ] 59.19% | 87,048 | 66.5% |
[ 60.0% - 60.5% ] 60.30% | 154,064 | 55.0% |
[ 60.5% - 61.0% ] 60.53% | 36,448 | 83.4% |
[ 61.0% - 61.5% ] 61.13% | 58,079 | 94.8% |
[ 61.5% - 62.0% ] 61.88% | 128,910 | 94.9% |
[ 62.0% - 62.5% ] 62.28% | 94,284 | 57.6% |
[ 62.5% - 63.0% ] 62.58% | 26,268 | 92.2% |
[ 63.0% - 63.5% ] 63.42% | 26,861 | 87.9% |
[ 63.5% - 64.0% ] 63.91% | 117,426 | 95.6% |
[ 64.0% - 64.5% ] 64.33% | 109,357 | 80.6% |
[ 64.5% - 65.0% ] 64.88% | 105,842 | 90.9% |
[ 65.0% - 65.5% ] 65.10% | 53,206 | 77.0% |
[ 65.5% - 66.0% ] 65.66% | 99 | 100.0% |
[ 66.0% - 66.5% ] 66.17% | 153,024 | 59.1% |
[ 66.5% - 67.0% ] 66.91% | 109,332 | 76.7% |
[ 67.0% - 67.5% ] 67.23% | 177 | 100.0% |
[ 68.5% - 69.0% ] 68.68% | 119,624 | 87.8% |
[ 69.0% - 69.5% ] 69.26% | 90,830 | 93.4% |
[ 69.5% - 70.0% ] 69.58% | 766 | 94.5% |
[ 70.0% - 70.5% ] 70.39% | 115,169 | 94.9% |
[ 70.5% - 71.0% ] 70.79% | 138,182 | 65.0% |
[ 71.0% - 71.5% ] 71.37% | 45,620 | 93.4% |
[ 72.0% - 72.5% ] 72.38% | 449 | 100.0% |
[ 72.5% - 73.0% ] 72.85% | 57,066 | 93.7% |
[ 73.0% - 73.5% ] 73.31% | 29,830 | 92.0% |
[ 73.5% - 74.0% ] 73.75% | 19,452 | 92.8% |
[ 74.0% - 74.5% ] 74.15% | 257,769 | 87.6% |
[ 74.5% - 75.0% ] 74.68% | 46,798 | 90.2% |
[ 75.0% - 75.5% ] 75.10% | 71,088 | 87.2% |
[ 75.5% - 76.0% ] 75.74% | 1,018 | 83.7% |
[ 77.0% - 77.5% ] 77.38% | 84 | 100.0% |
[ 78.0% - 78.5% ] 78.37% | 42,178 | 84.5% |
[ 78.5% - 79.0% ] 78.65% | 178 | 100.0% |
[ 80.5% - 81.0% ] 80.58% | 1,030 | 87.4% |
[ 83.0% - 83.5% ] 83.33% | 72 | 100.0% |
[ 87.5% - 88.0% ] 87.72% | 171 | 100.0% |
[ 88.5% - 89.0% ] 88.69% | 168 | 60.2% |
[ 91.0% - 91.5% ] 91.07% | 112 | 100.0% |
[ 95.0% - 95.5% ] 95.43% | 197 | 100.0% |
[ 99.5% - 100.0% ] 100.00% | 931 | 98.6% |