Ethiopian Female Disability

COMPARE

Ethiopian
Race
Ancestry
AfghanAfricanAlaska NativeAlaskan AthabascanAlbanianAleutAlsatianAmericanApacheArabArapahoArgentineanArmenianAssyrian/Chaldean/SyriacAustralianAustrianBahamianBangladeshiBarbadianBasqueBelgianBelizeanBermudanBhutaneseBlackfeetBolivianBrazilianBritishBritish West IndianBulgarianBurmeseCajunCambodianCanadianCape VerdeanCarpatho RusynCelticCentral AmericanCentral American IndianCherokeeCheyenneChickasawChileanChineseChippewaChoctawColombianColvilleComancheCosta RicanCreeCreekCroatianCrowCubanCypriotCzechCzechoslovakianDanishDelawareDominicanDutchDutch West IndianEastern EuropeanEcuadorianEgyptianEnglishEstonianEthiopianEuropeanFijianFilipinoFinnishFrenchFrench American IndianFrench CanadianGermanGerman RussianGhanaianGreekGuamanian/ChamorroGuatemalanGuyaneseHaitianHmongHonduranHopiHoumaHungarianIcelanderIndian (Asian)IndonesianInupiatIranianIraqiIrishIroquoisIsraeliItalianJamaicanJapaneseJordanianKenyanKiowaKoreanLaotianLatvianLebaneseLiberianLithuanianLumbeeLuxembourgerMacedonianMalaysianMalteseMarshalleseMenomineeMexicanMexican American IndianMongolianMoroccanNative HawaiianNavajoNepaleseNew ZealanderNicaraguanNigerianNorthern EuropeanNorwegianOkinawanOsageOttawaPaiutePakistaniPalestinianPanamanianParaguayanPennsylvania GermanPeruvianPimaPolishPortuguesePotawatomiPuebloPuerto RicanPuget Sound SalishRomanianRussianSalvadoranSamoanScandinavianScotch-IrishScottishSeminoleSenegaleseSerbianShoshoneSierra LeoneanSiouxSlavicSlovakSloveneSomaliSouth AfricanSouth AmericanSouth American IndianSoviet UnionSpaniardSpanishSpanish AmericanSpanish American IndianSri LankanSubsaharan AfricanSudaneseSwedishSwissSyrianTaiwaneseThaiTlingit-HaidaTohono O'OdhamTonganTrinidadian and TobagonianTsimshianTurkishU.S. Virgin IslanderUgandanUkrainianUruguayanUteVenezuelanVietnameseWelshWest IndianYakamaYaquiYugoslavianYumanYup'ikZimbabwean
Immigration
NonimmigrantsImmigrantsAfghanistanAfricaAlbaniaArgentinaArmeniaAsiaAustraliaAustriaBahamasBangladeshBarbadosBelarusBelgiumBelizeBoliviaBosnia and HerzegovinaBrazilBulgariaBurma/MyanmarCabo VerdeCambodiaCameroonCanadaCaribbeanCentral AmericaChileChinaColombiaCongoCosta RicaCroatiaCubaCzechoslovakiaDenmarkDominicaDominican RepublicEastern AfricaEastern AsiaEastern EuropeEcuadorEgyptEl SalvadorEnglandEritreaEthiopiaEuropeFijiFranceGermanyGhanaGreeceGrenadaGuatemalaGuyanaHaitiHondurasHong KongHungaryIndiaIndonesiaIranIraqIrelandIsraelItalyJamaicaJapanJordanKazakhstanKenyaKoreaKuwaitLaosLatin AmericaLatviaLebanonLiberiaLithuaniaMalaysiaMexicoMicronesiaMiddle AfricaMoldovaMoroccoNepalNetherlandsNicaraguaNigeriaNorth AmericaNorth MacedoniaNorthern AfricaNorthern EuropeNorwayOceaniaPakistanPanamaPeruPhilippinesPolandPortugalRomaniaRussiaSaudi ArabiaScotlandSenegalSerbiaSierra LeoneSingaporeSomaliaSouth AfricaSouth AmericaSouth Central AsiaSouth Eastern AsiaSouthern EuropeSpainSri LankaSt. Vincent and the GrenadinesSudanSwedenSwitzerlandSyriaTaiwanThailandTrinidad and TobagoTurkeyUgandaUkraineUruguayUzbekistanVenezuelaVietnamWest IndiesWestern AfricaWestern AsiaWestern EuropeYemenZaireZimbabweAzores
Select to Compare
Race
Ancestry
AfghanAfricanAlaska NativeAlaskan AthabascanAlbanianAleutAlsatianAmericanApacheArabArapahoArgentineanArmenianAssyrian/Chaldean/SyriacAustralianAustrianBahamianBangladeshiBarbadianBasqueBelgianBelizeanBermudanBhutaneseBlackfeetBolivianBrazilianBritishBritish West IndianBulgarianBurmeseCajunCambodianCanadianCape VerdeanCarpatho RusynCelticCentral AmericanCentral American IndianCherokeeCheyenneChickasawChileanChineseChippewaChoctawColombianColvilleComancheCosta RicanCreeCreekCroatianCrowCubanCypriotCzechCzechoslovakianDanishDelawareDominicanDutchDutch West IndianEastern EuropeanEcuadorianEgyptianEnglishEstonianEuropeanFijianFilipinoFinnishFrenchFrench American IndianFrench CanadianGermanGerman RussianGhanaianGreekGuamanian/ChamorroGuatemalanGuyaneseHaitianHmongHonduranHopiHoumaHungarianIcelanderIndian (Asian)IndonesianInupiatIranianIraqiIrishIroquoisIsraeliItalianJamaicanJapaneseJordanianKenyanKiowaKoreanLaotianLatvianLebaneseLiberianLithuanianLumbeeLuxembourgerMacedonianMalaysianMalteseMarshalleseMenomineeMexicanMexican American IndianMongolianMoroccanNative HawaiianNavajoNepaleseNew ZealanderNicaraguanNigerianNorthern EuropeanNorwegianOkinawanOsageOttawaPaiutePakistaniPalestinianPanamanianParaguayanPennsylvania GermanPeruvianPimaPolishPortuguesePotawatomiPuebloPuerto RicanPuget Sound SalishRomanianRussianSalvadoranSamoanScandinavianScotch-IrishScottishSeminoleSenegaleseSerbianShoshoneSierra LeoneanSiouxSlavicSlovakSloveneSomaliSouth AfricanSouth AmericanSouth American IndianSoviet UnionSpaniardSpanishSpanish AmericanSpanish American IndianSri LankanSubsaharan AfricanSudaneseSwedishSwissSyrianTaiwaneseThaiTlingit-HaidaTohono O'OdhamTonganTrinidadian and TobagonianTsimshianTurkishU.S. Virgin IslanderUgandanUkrainianUruguayanUteVenezuelanVietnameseWelshWest IndianYakamaYaquiYugoslavianYumanYup'ikZimbabwean
Immigration
NonimmigrantsImmigrantsAfghanistanAfricaAlbaniaArgentinaArmeniaAsiaAustraliaAustriaBahamasBangladeshBarbadosBelarusBelgiumBelizeBoliviaBosnia and HerzegovinaBrazilBulgariaBurma/MyanmarCabo VerdeCambodiaCameroonCanadaCaribbeanCentral AmericaChileChinaColombiaCongoCosta RicaCroatiaCubaCzechoslovakiaDenmarkDominicaDominican RepublicEastern AfricaEastern AsiaEastern EuropeEcuadorEgyptEl SalvadorEnglandEritreaEthiopiaEuropeFijiFranceGermanyGhanaGreeceGrenadaGuatemalaGuyanaHaitiHondurasHong KongHungaryIndiaIndonesiaIranIraqIrelandIsraelItalyJamaicaJapanJordanKazakhstanKenyaKoreaKuwaitLaosLatin AmericaLatviaLebanonLiberiaLithuaniaMalaysiaMexicoMicronesiaMiddle AfricaMoldovaMoroccoNepalNetherlandsNicaraguaNigeriaNorth AmericaNorth MacedoniaNorthern AfricaNorthern EuropeNorwayOceaniaPakistanPanamaPeruPhilippinesPolandPortugalRomaniaRussiaSaudi ArabiaScotlandSenegalSerbiaSierra LeoneSingaporeSomaliaSouth AfricaSouth AmericaSouth Central AsiaSouth Eastern AsiaSouthern EuropeSpainSri LankaSt. Vincent and the GrenadinesSudanSwedenSwitzerlandSyriaTaiwanThailandTrinidad and TobagoTurkeyUgandaUkraineUruguayUzbekistanVenezuelaVietnamWest IndiesWestern AfricaWestern AsiaWestern EuropeYemenZaireZimbabweAzores
Female Disability
Income
Poverty
Unemployment
Labor Participation
Family Structure
Vehicle Availability
Education Level
Disability

Ethiopian Female Disability
Exceptional

11.2%
DISABILITY | FEMALES
100.0/ 100
METRIC RATING
37th/ 347
METRIC RANK

Ethiopian Female Disability Correlation Chart

The statistical analysis conducted on geographies consisting of 223,237,211 people shows a mild negative correlation between the proportion of Ethiopians and percentage of females with a disability in the United States with a correlation coefficient (R) of -0.365 and weighted average of 11.2%. On average, for every 1% (one percent) increase in Ethiopians within a typical geography, there is a decrease of 0.17% in percentage of females with a disability.
Ethiopian Female Disability
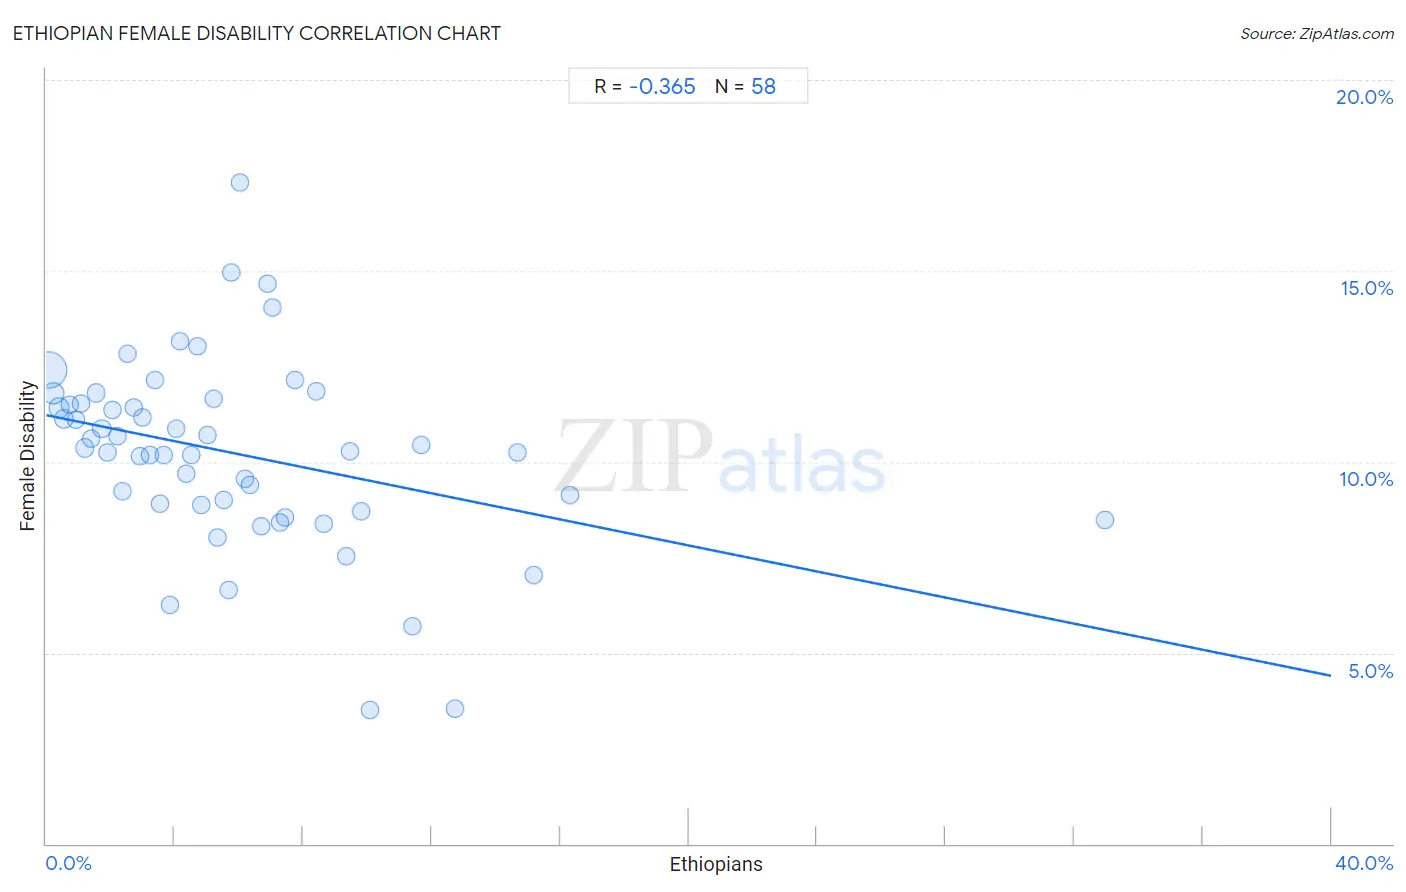
It is essential to understand that the correlation between the percentage of Ethiopians and percentage of females with a disability does not imply a direct cause-and-effect relationship. It remains uncertain whether the presence of Ethiopians influences an upward or downward trend in the level of percentage of females with a disability within an area, or if Ethiopians simply ended up residing in those areas with higher or lower levels of percentage of females with a disability due to other factors.

Demographics Similar to Ethiopians by Female Disability

In terms of female disability, the demographic groups most similar to Ethiopians are Cypriot (11.2%, a difference of 0.010%), Immigrants from Ethiopia (11.2%, a difference of 0.030%), Immigrants from Japan (11.2%, a difference of 0.080%), Immigrants from Indonesia (11.2%, a difference of 0.22%), and Immigrants from Lithuania (11.2%, a difference of 0.24%).
DemographicsRating | RankFemale Disability
Turks
100.0
/100
|
#30
Exceptional
11.1%
Immigrants from Kuwait
100.0
/100
|
#31
Exceptional
11.1%
Immigrants from Australia
100.0
/100
|
#32
Exceptional
11.1%
Immigrants from Egypt
100.0
/100
|
#33
Exceptional
11.1%
Immigrants from Indonesia
100.0
/100
|
#34
Exceptional
11.2%
Immigrants from Japan
100.0
/100
|
#35
Exceptional
11.2%
Cypriots
100.0
/100
|
#36
Exceptional
11.2%
Ethiopians
100.0
/100
|
#37
Exceptional
11.2%
Immigrants from Ethiopia
100.0
/100
|
#38
Exceptional
11.2%
Immigrants from Lithuania
100.0
/100
|
#39
Exceptional
11.2%
Mongolians
100.0
/100
|
#40
Exceptional
11.2%
Paraguayans
100.0
/100
|
#41
Exceptional
11.2%
Israelis
100.0
/100
|
#42
Exceptional
11.2%
Afghans
100.0
/100
|
#43
Exceptional
11.2%
Cambodians
100.0
/100
|
#44
Exceptional
11.3%

Ethiopian Female Disability Correlation Summary

MeasurementEthiopian DataFemale Disability Data
Minimum0.064%3.5%
Maximum33.0%17.3%
Range32.9%13.8%
Mean5.8%10.2%
Median4.8%10.3%
Interquartile 25% (IQ1)2.4%8.9%
Interquartile 75% (IQ3)7.4%11.5%
Interquartile Range (IQR)5.0%2.7%
Standard Deviation (Sample)5.3%2.5%
Standard Deviation (Population)5.3%2.5%

Correlation Details

Ethiopian PercentileSample SizeFemale Disability
[
0.0%
-
0.5%
]
0.064%
143,253,42112.4%
[
0.0%
-
0.5%
]
0.22%
34,844,74511.8%
[
0.0%
-
0.5%
]
0.40%
14,257,55211.4%
[
0.5%
-
1.0%
]
0.56%
7,870,47711.1%
[
0.5%
-
1.0%
]
0.74%
3,681,96211.5%
[
0.5%
-
1.0%
]
0.91%
3,648,44611.1%
[
1.0%
-
1.5%
]
1.08%
2,842,45811.5%
[
1.0%
-
1.5%
]
1.21%
2,517,09010.4%
[
1.0%
-
1.5%
]
1.41%
1,584,29010.6%
[
1.5%
-
2.0%
]
1.56%
1,750,46211.8%
[
1.5%
-
2.0%
]
1.73%
964,86410.9%
[
1.5%
-
2.0%
]
1.89%
807,23010.3%
[
2.0%
-
2.5%
]
2.07%
384,37911.3%
[
2.0%
-
2.5%
]
2.21%
545,50510.7%
[
2.0%
-
2.5%
]
2.39%
176,3079.2%
[
2.5%
-
3.0%
]
2.55%
381,33612.8%
[
2.5%
-
3.0%
]
2.73%
263,36611.4%
[
2.5%
-
3.0%
]
2.92%
212,40110.2%
[
3.0%
-
3.5%
]
3.00%
469,69811.2%
[
3.0%
-
3.5%
]
3.22%
236,55510.2%
[
3.0%
-
3.5%
]
3.38%
286,41612.1%
[
3.5%
-
4.0%
]
3.54%
229,9128.9%
[
3.5%
-
4.0%
]
3.65%
62,03910.2%
[
3.5%
-
4.0%
]
3.84%
100,2736.2%
[
4.0%
-
4.5%
]
4.03%
156,70110.9%
[
4.0%
-
4.5%
]
4.18%
125,40813.2%
[
4.0%
-
4.5%
]
4.36%
78,6039.7%
[
4.5%
-
5.0%
]
4.52%
264,35610.2%
[
4.5%
-
5.0%
]
4.71%
48,89013.0%
[
4.5%
-
5.0%
]
4.82%
84,5698.9%
[
5.0%
-
5.5%
]
5.03%
132,49510.7%
[
5.0%
-
5.5%
]
5.23%
164,74111.6%
[
5.0%
-
5.5%
]
5.33%
55,4398.0%
[
5.5%
-
6.0%
]
5.53%
94,0529.0%
[
5.5%
-
6.0%
]
5.69%
26,9966.7%
[
5.5%
-
6.0%
]
5.78%
4,01715.0%
[
6.0%
-
6.5%
]
6.02%
26,59517.3%
[
6.0%
-
6.5%
]
6.18%
45,0729.6%
[
6.0%
-
6.5%
]
6.33%
44,8639.4%
[
6.5%
-
7.0%
]
6.71%
14,0988.3%
[
6.5%
-
7.0%
]
6.89%
60,93714.7%
[
7.0%
-
7.5%
]
7.05%
24,58114.0%
[
7.0%
-
7.5%
]
7.28%
101,6208.4%
[
7.0%
-
7.5%
]
7.43%
26,5738.6%
[
7.5%
-
8.0%
]
7.74%
18,32412.1%
[
8.0%
-
8.5%
]
8.40%
30,92711.9%
[
8.5%
-
9.0%
]
8.65%
64,7308.4%
[
9.0%
-
9.5%
]
9.36%
25,8237.5%
[
9.0%
-
9.5%
]
9.44%
50,04910.3%
[
9.5%
-
10.0%
]
9.81%
38,3188.7%
[
10.0%
-
10.5%
]
10.10%
1,0503.5%
[
11.0%
-
11.5%
]
11.38%
5,3595.7%
[
11.5%
-
12.0%
]
11.67%
26,68410.5%
[
12.5%
-
13.0%
]
12.73%
1,8853.5%
[
14.5%
-
15.0%
]
14.66%
3,51410.2%
[
15.0%
-
15.5%
]
15.16%
4,0237.0%
[
16.0%
-
16.5%
]
16.31%
14,5539.1%
[
32.5%
-
33.0%
]
32.97%
1828.5%