Ethiopian Married-couple Households
COMPARE
Ethiopian
Select to Compare
Married-couple Households
Ethiopian Married-couple Households
43.2%
MARRIED-COUPLE HOUSEHOLDS
0.1/ 100
METRIC RATING
273rd/ 347
METRIC RANK
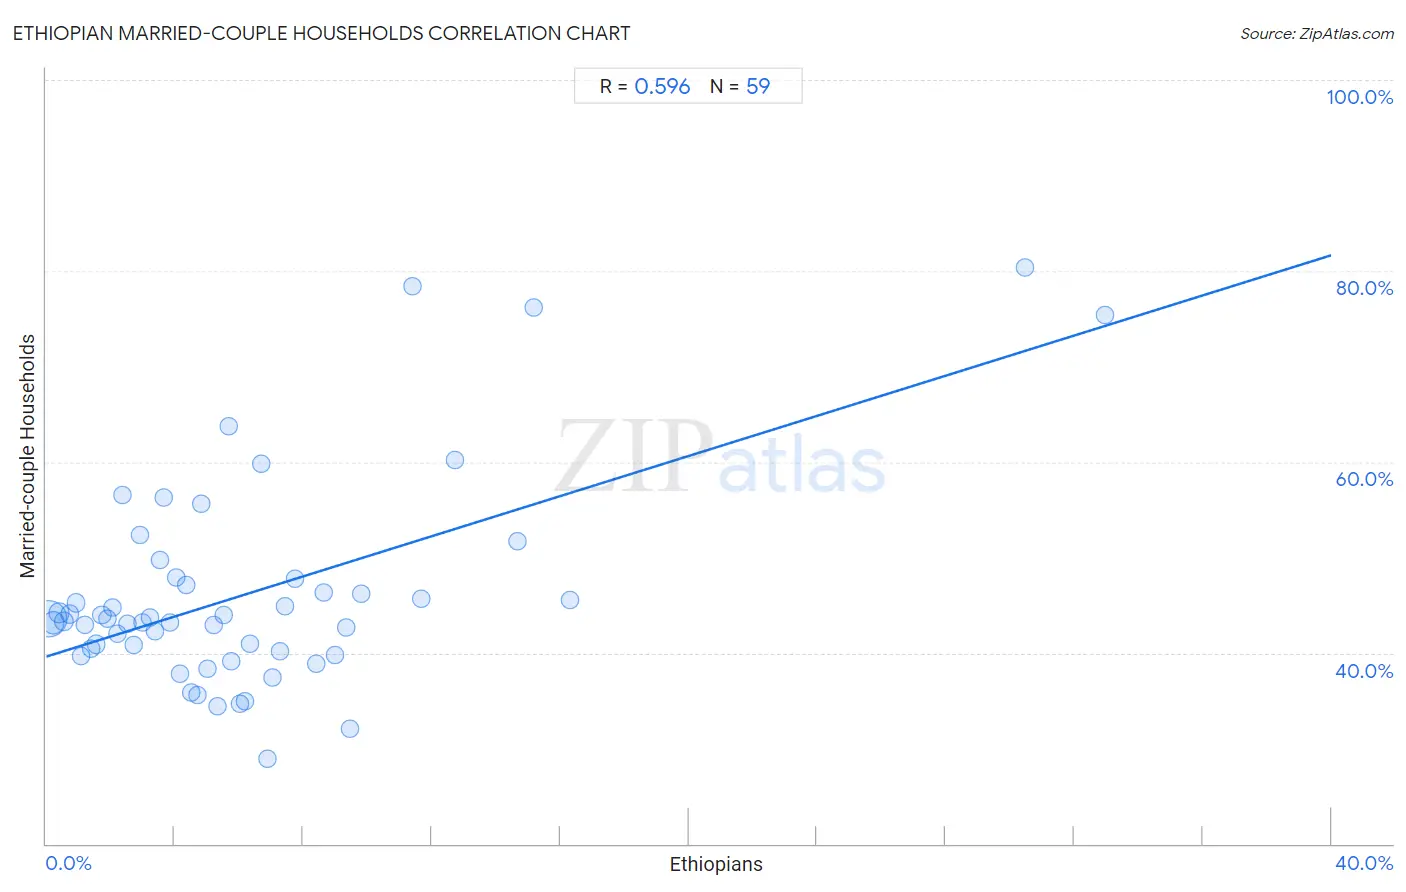
Ethiopian Married-couple Households Correlation Chart
The statistical analysis conducted on geographies consisting of 223,091,132 people shows a substantial positive correlation between the proportion of Ethiopians and percentage of married-couple family households in the United States with a correlation coefficient (R) of 0.596 and weighted average of 43.2%. On average, for every 1% (one percent) increase in Ethiopians within a typical geography, there is an increase of 1.1% in percentage of married-couple family households.
It is essential to understand that the correlation between the percentage of Ethiopians and percentage of married-couple family households does not imply a direct cause-and-effect relationship. It remains uncertain whether the presence of Ethiopians influences an upward or downward trend in the level of percentage of married-couple family households within an area, or if Ethiopians simply ended up residing in those areas with higher or lower levels of percentage of married-couple family households due to other factors.
Demographics Similar to Ethiopians by Married-couple Households
In terms of married-couple households, the demographic groups most similar to Ethiopians are Nigerian (43.2%, a difference of 0.010%), Immigrants from Nigeria (43.2%, a difference of 0.10%), Immigrants from Bangladesh (43.1%, a difference of 0.15%), Guatemalan (43.3%, a difference of 0.20%), and Immigrants from Ethiopia (43.1%, a difference of 0.26%).
| Demographics | Rating | Rank | Married-couple Households |
| Ecuadorians | 0.1 /100 | #266 | Tragic 43.5% |
| Natives/Alaskans | 0.1 /100 | #267 | Tragic 43.5% |
| Immigrants from Burma/Myanmar | 0.1 /100 | #268 | Tragic 43.4% |
| Immigrants from Sierra Leone | 0.1 /100 | #269 | Tragic 43.3% |
| Yuman | 0.1 /100 | #270 | Tragic 43.3% |
| Guatemalans | 0.1 /100 | #271 | Tragic 43.3% |
| Immigrants from Nigeria | 0.1 /100 | #272 | Tragic 43.2% |
| Ethiopians | 0.1 /100 | #273 | Tragic 43.2% |
| Nigerians | 0.1 /100 | #274 | Tragic 43.2% |
| Immigrants from Bangladesh | 0.0 /100 | #275 | Tragic 43.1% |
| Immigrants from Ethiopia | 0.0 /100 | #276 | Tragic 43.1% |
| Immigrants from Eastern Africa | 0.0 /100 | #277 | Tragic 42.9% |
| Immigrants from Africa | 0.0 /100 | #278 | Tragic 42.9% |
| Sierra Leoneans | 0.0 /100 | #279 | Tragic 42.9% |
| Immigrants from Ecuador | 0.0 /100 | #280 | Tragic 42.9% |
Ethiopian Married-couple Households Correlation Summary
| Measurement | Ethiopian Data | Married-couple Households Data |
| Minimum | 0.064% | 28.9% |
| Maximum | 33.0% | 80.4% |
| Range | 32.9% | 51.5% |
| Mean | 6.2% | 46.2% |
| Median | 4.8% | 43.6% |
| Interquartile 25% (IQ1) | 2.4% | 40.1% |
| Interquartile 75% (IQ3) | 7.7% | 47.7% |
| Interquartile Range (IQR) | 5.4% | 7.6% |
| Standard Deviation (Sample) | 6.2% | 10.9% |
| Standard Deviation (Population) | 6.1% | 10.8% |
Correlation Details
| Ethiopian Percentile | Sample Size | Married-couple Households |
[ 0.0% - 0.5% ] 0.064% | 143,190,644 | 43.6% |
[ 0.0% - 0.5% ] 0.22% | 34,812,229 | 43.1% |
[ 0.0% - 0.5% ] 0.40% | 14,248,499 | 44.2% |
[ 0.5% - 1.0% ] 0.56% | 7,862,662 | 43.3% |
[ 0.5% - 1.0% ] 0.74% | 3,675,696 | 44.0% |
[ 0.5% - 1.0% ] 0.91% | 3,642,545 | 45.2% |
[ 1.0% - 1.5% ] 1.08% | 2,837,523 | 39.6% |
[ 1.0% - 1.5% ] 1.21% | 2,508,449 | 42.9% |
[ 1.0% - 1.5% ] 1.41% | 1,584,290 | 40.4% |
[ 1.5% - 2.0% ] 1.56% | 1,749,499 | 40.9% |
[ 1.5% - 2.0% ] 1.73% | 964,864 | 44.0% |
[ 1.5% - 2.0% ] 1.89% | 807,075 | 43.6% |
[ 2.0% - 2.5% ] 2.07% | 384,379 | 44.7% |
[ 2.0% - 2.5% ] 2.21% | 542,547 | 42.0% |
[ 2.0% - 2.5% ] 2.39% | 173,348 | 56.5% |
[ 2.5% - 3.0% ] 2.55% | 381,336 | 43.0% |
[ 2.5% - 3.0% ] 2.73% | 263,366 | 40.8% |
[ 2.5% - 3.0% ] 2.92% | 212,401 | 52.3% |
[ 3.0% - 3.5% ] 3.00% | 469,698 | 43.2% |
[ 3.0% - 3.5% ] 3.22% | 236,713 | 43.7% |
[ 3.0% - 3.5% ] 3.38% | 286,416 | 42.2% |
[ 3.5% - 4.0% ] 3.54% | 229,912 | 49.8% |
[ 3.5% - 4.0% ] 3.65% | 62,039 | 56.3% |
[ 3.5% - 4.0% ] 3.84% | 100,273 | 43.1% |
[ 4.0% - 4.5% ] 4.03% | 156,701 | 47.9% |
[ 4.0% - 4.5% ] 4.18% | 124,288 | 37.8% |
[ 4.0% - 4.5% ] 4.36% | 78,603 | 47.1% |
[ 4.5% - 5.0% ] 4.52% | 264,356 | 35.8% |
[ 4.5% - 5.0% ] 4.71% | 48,890 | 35.6% |
[ 4.5% - 5.0% ] 4.82% | 84,569 | 55.6% |
[ 5.0% - 5.5% ] 5.03% | 132,495 | 38.3% |
[ 5.0% - 5.5% ] 5.23% | 164,741 | 42.9% |
[ 5.0% - 5.5% ] 5.33% | 55,439 | 34.4% |
[ 5.5% - 6.0% ] 5.53% | 94,052 | 44.0% |
[ 5.5% - 6.0% ] 5.69% | 26,996 | 63.7% |
[ 5.5% - 6.0% ] 5.78% | 4,017 | 39.2% |
[ 6.0% - 6.5% ] 6.02% | 26,595 | 34.6% |
[ 6.0% - 6.5% ] 6.18% | 45,072 | 34.9% |
[ 6.0% - 6.5% ] 6.33% | 44,863 | 41.0% |
[ 6.5% - 7.0% ] 6.71% | 14,098 | 59.7% |
[ 6.5% - 7.0% ] 6.89% | 61,169 | 28.9% |
[ 7.0% - 7.5% ] 7.05% | 24,581 | 37.4% |
[ 7.0% - 7.5% ] 7.28% | 101,620 | 40.1% |
[ 7.0% - 7.5% ] 7.43% | 26,573 | 44.8% |
[ 7.5% - 8.0% ] 7.74% | 18,324 | 47.7% |
[ 8.0% - 8.5% ] 8.40% | 30,927 | 38.8% |
[ 8.5% - 9.0% ] 8.65% | 64,730 | 46.3% |
[ 8.5% - 9.0% ] 8.97% | 535 | 39.8% |
[ 9.0% - 9.5% ] 9.36% | 25,823 | 42.7% |
[ 9.0% - 9.5% ] 9.44% | 50,049 | 32.1% |
[ 9.5% - 10.0% ] 9.81% | 38,318 | 46.2% |
[ 11.0% - 11.5% ] 11.38% | 5,359 | 78.4% |
[ 11.5% - 12.0% ] 11.67% | 26,684 | 45.6% |
[ 12.5% - 13.0% ] 12.73% | 1,885 | 60.2% |
[ 14.5% - 15.0% ] 14.66% | 3,514 | 51.7% |
[ 15.0% - 15.5% ] 15.16% | 4,023 | 76.1% |
[ 16.0% - 16.5% ] 16.31% | 14,553 | 45.5% |
[ 30.0% - 30.5% ] 30.48% | 105 | 80.4% |
[ 32.5% - 33.0% ] 32.97% | 182 | 75.4% |