Arab Unemployment Among Women with Children Ages 6 to 17 years
COMPARE
Arab
Select to Compare
Unemployment Among Women with Children Ages 6 to 17 years
Arab Unemployment Among Women with Children Ages 6 to 17 years
9.3%
UNEMPLOYMENT | WOMEN W/ CHILDREN 6 TO 17
2.7/ 100
METRIC RATING
238th/ 347
METRIC RANK
Arab Unemployment Among Women with Children Ages 6 to 17 years Correlation Chart
The statistical analysis conducted on geographies consisting of 331,347,771 people shows a weak positive correlation between the proportion of Arabs and unemployment rate among women with children between the ages 6 and 17 in the United States with a correlation coefficient (R) of 0.268 and weighted average of 9.3%. On average, for every 1% (one percent) increase in Arabs within a typical geography, there is an increase of 0.18% in unemployment rate among women with children between the ages 6 and 17.
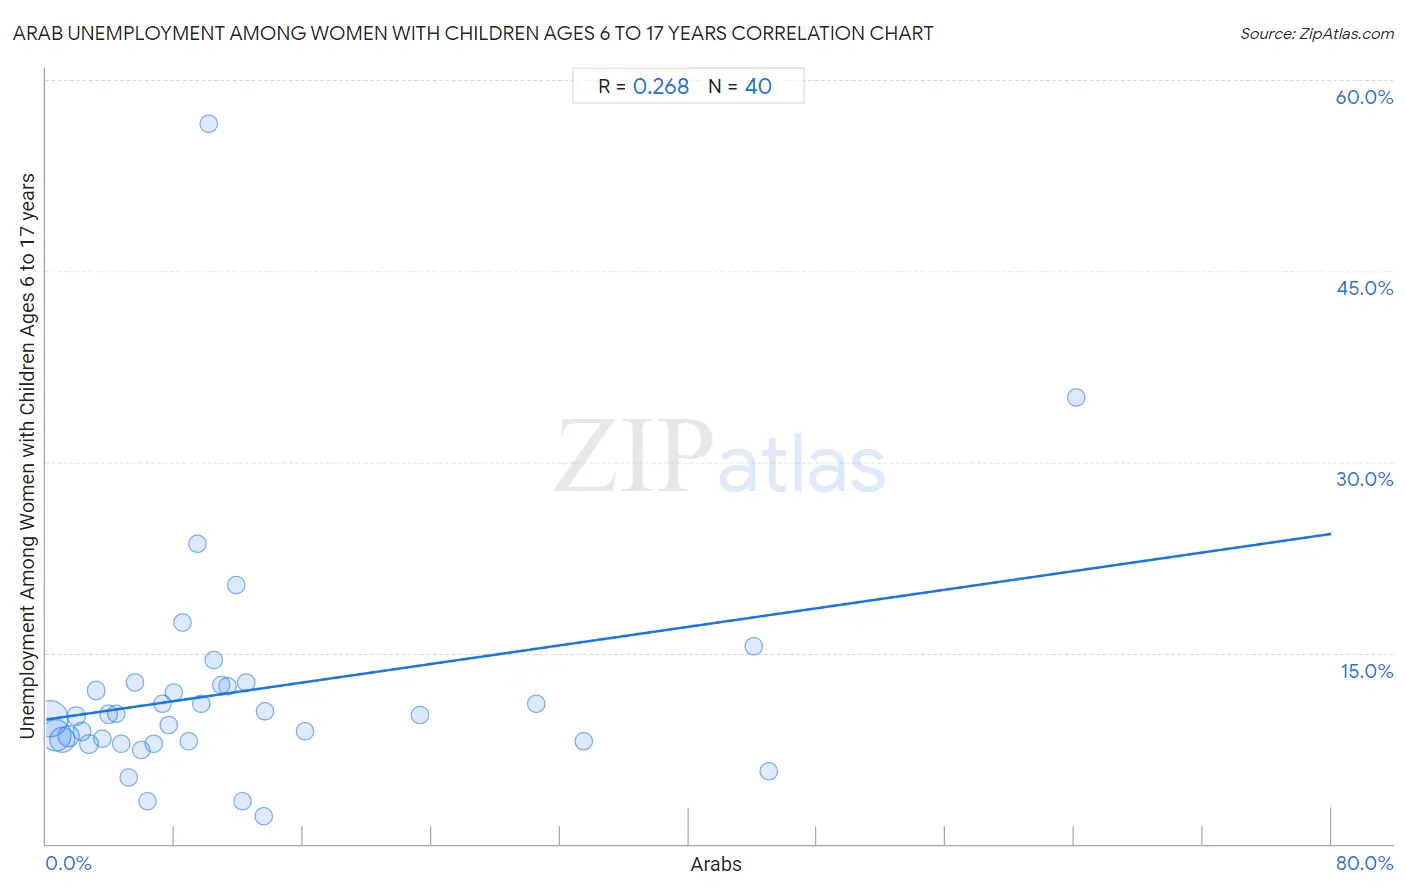
It is essential to understand that the correlation between the percentage of Arabs and unemployment rate among women with children between the ages 6 and 17 does not imply a direct cause-and-effect relationship. It remains uncertain whether the presence of Arabs influences an upward or downward trend in the level of unemployment rate among women with children between the ages 6 and 17 within an area, or if Arabs simply ended up residing in those areas with higher or lower levels of unemployment rate among women with children between the ages 6 and 17 due to other factors.
Demographics Similar to Arabs by Unemployment Among Women with Children Ages 6 to 17 years
In terms of unemployment among women with children ages 6 to 17 years, the demographic groups most similar to Arabs are Immigrants from Saudi Arabia (9.3%, a difference of 0.0%), Immigrants from Belize (9.3%, a difference of 0.080%), Hungarian (9.3%, a difference of 0.12%), Guatemalan (9.3%, a difference of 0.14%), and Uruguayan (9.3%, a difference of 0.15%).
| Demographics | Rating | Rank | Unemployment Among Women with Children Ages 6 to 17 years |
| Macedonians | 3.9 /100 | #231 | Tragic 9.3% |
| French American Indians | 3.7 /100 | #232 | Tragic 9.3% |
| Immigrants from St. Vincent and the Grenadines | 3.3 /100 | #233 | Tragic 9.3% |
| Mexicans | 3.2 /100 | #234 | Tragic 9.3% |
| Uruguayans | 3.0 /100 | #235 | Tragic 9.3% |
| Hungarians | 3.0 /100 | #236 | Tragic 9.3% |
| Immigrants from Belize | 2.8 /100 | #237 | Tragic 9.3% |
| Arabs | 2.7 /100 | #238 | Tragic 9.3% |
| Immigrants from Saudi Arabia | 2.7 /100 | #239 | Tragic 9.3% |
| Guatemalans | 2.3 /100 | #240 | Tragic 9.3% |
| Colombians | 2.2 /100 | #241 | Tragic 9.3% |
| Immigrants from Colombia | 2.1 /100 | #242 | Tragic 9.3% |
| Scottish | 2.0 /100 | #243 | Tragic 9.4% |
| English | 1.9 /100 | #244 | Tragic 9.4% |
| Immigrants from Cameroon | 1.8 /100 | #245 | Tragic 9.4% |
Arab Unemployment Among Women with Children Ages 6 to 17 years Correlation Summary
| Measurement | Arab Data | Unemployment Among Women with Children Ages 6 to 17 years Data |
| Minimum | 0.20% | 2.2% |
| Maximum | 64.1% | 56.6% |
| Range | 63.9% | 54.4% |
| Mean | 12.0% | 11.9% |
| Median | 8.2% | 10.1% |
| Interquartile 25% (IQ1) | 4.1% | 8.1% |
| Interquartile 75% (IQ3) | 12.3% | 12.4% |
| Interquartile Range (IQR) | 8.2% | 4.4% |
| Standard Deviation (Sample) | 13.6% | 9.2% |
| Standard Deviation (Population) | 13.4% | 9.1% |
Correlation Details
| Arab Percentile | Sample Size | Unemployment Among Women with Children Ages 6 to 17 years |
[ 0.0% - 0.5% ] 0.20% | 129,077,033 | 9.9% |
[ 0.5% - 1.0% ] 0.62% | 90,403,961 | 8.5% |
[ 0.5% - 1.0% ] 0.99% | 54,009,972 | 8.2% |
[ 1.0% - 1.5% ] 1.37% | 27,970,376 | 8.5% |
[ 1.5% - 2.0% ] 1.84% | 9,865,906 | 10.0% |
[ 2.0% - 2.5% ] 2.23% | 6,531,243 | 8.8% |
[ 2.5% - 3.0% ] 2.67% | 4,990,874 | 7.8% |
[ 3.0% - 3.5% ] 3.09% | 1,758,684 | 12.0% |
[ 3.5% - 4.0% ] 3.51% | 1,175,720 | 8.2% |
[ 3.5% - 4.0% ] 3.86% | 1,533,944 | 10.2% |
[ 4.0% - 4.5% ] 4.35% | 412,576 | 10.2% |
[ 4.5% - 5.0% ] 4.69% | 500,974 | 7.8% |
[ 5.0% - 5.5% ] 5.13% | 500,811 | 5.2% |
[ 5.5% - 6.0% ] 5.52% | 290,265 | 12.7% |
[ 5.5% - 6.0% ] 5.90% | 160,198 | 7.4% |
[ 6.0% - 6.5% ] 6.31% | 250,638 | 3.4% |
[ 6.5% - 7.0% ] 6.67% | 85,875 | 7.9% |
[ 7.0% - 7.5% ] 7.25% | 90,331 | 11.0% |
[ 7.5% - 8.0% ] 7.64% | 241,344 | 9.4% |
[ 7.5% - 8.0% ] 7.97% | 150,759 | 11.9% |
[ 8.0% - 8.5% ] 8.45% | 30,372 | 17.3% |
[ 8.5% - 9.0% ] 8.87% | 278,433 | 8.0% |
[ 9.0% - 9.5% ] 9.40% | 26,913 | 23.6% |
[ 9.5% - 10.0% ] 9.63% | 84,901 | 11.0% |
[ 10.0% - 10.5% ] 10.09% | 17,794 | 56.6% |
[ 10.0% - 10.5% ] 10.42% | 88,751 | 14.4% |
[ 10.5% - 11.0% ] 10.90% | 124,912 | 12.5% |
[ 11.0% - 11.5% ] 11.30% | 134,009 | 12.4% |
[ 11.5% - 12.0% ] 11.83% | 46,979 | 20.4% |
[ 12.0% - 12.5% ] 12.22% | 16,742 | 3.3% |
[ 12.0% - 12.5% ] 12.43% | 22,082 | 12.7% |
[ 13.5% - 14.0% ] 13.55% | 33,174 | 2.2% |
[ 13.5% - 14.0% ] 13.60% | 71,800 | 10.4% |
[ 16.0% - 16.5% ] 16.13% | 34,046 | 8.8% |
[ 23.0% - 23.5% ] 23.30% | 43,213 | 10.1% |
[ 30.5% - 31.0% ] 30.52% | 27,842 | 11.0% |
[ 33.0% - 33.5% ] 33.47% | 62,474 | 8.1% |
[ 44.0% - 44.5% ] 44.01% | 108,414 | 15.5% |
[ 44.5% - 45.0% ] 44.98% | 40,392 | 5.7% |
[ 64.0% - 64.5% ] 64.10% | 53,044 | 35.1% |