Greenview, WV Map & Demographics
Greenview Map
Greenview Overview
$21,914
PER CAPITA INCOME
$54,048
AVG HOUSEHOLD INCOME
0.43
INEQUALITY / GINI INDEX
239
TOTAL POPULATION
143
MALE POPULATION
96
FEMALE POPULATION
148.96
MALES / 100 FEMALES
67.13
FEMALES / 100 MALES
41.7
MEDIAN AGE
2.7
AVG FAMILY SIZE
3.3
AVG HOUSEHOLD SIZE
69
LABOR FORCE [ PEOPLE ]
35.8%
PERCENT IN LABOR FORCE
Income in Greenview
Income Overview in Greenview
| Characteristic | Number | Measure |
| Per Capita Income | 239 | $21,914 |
| Median Family Income | 57 | $0 |
| Mean Family Income | 57 | $56,404 |
| Median Household Income | 72 | $54,048 |
| Mean Household Income | 72 | $57,019 |
| Income Deficit | 57 | $0 |
| Wage / Income Gap (%) | 239 | 0.00% |
| Wage / Income Gap ($) | 239 | 100.00¢ per $1 |
| Gini / Inequality Index | 239 | 0.43 |
Earnings by Sex in Greenview
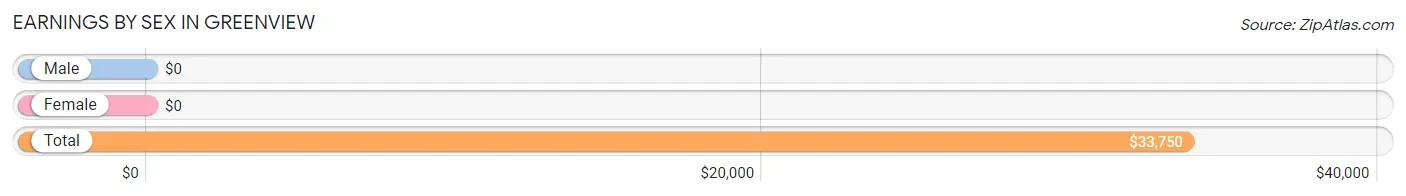
| Sex | Number | Average Earnings |
| Male | 61 (88.4%) | $0 |
| Female | 8 (11.6%) | $0 |
| Total | 69 (100.0%) | $33,750 |
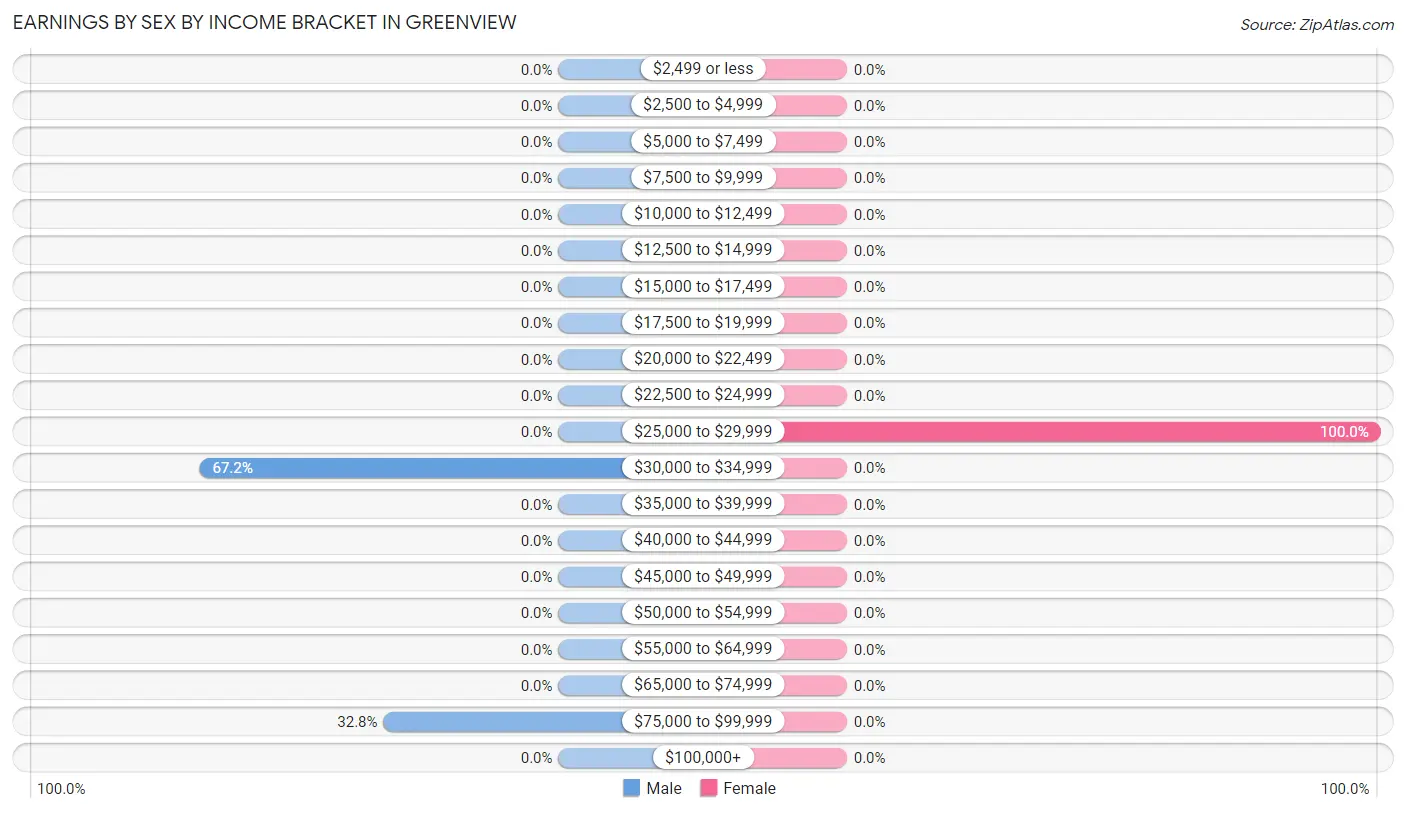
Earnings by Sex by Income Bracket in Greenview
The most common earnings brackets in Greenview are $30,000 to $34,999 for men (41 | 67.2%) and $25,000 to $29,999 for women (8 | 100.0%).
| Income | Male | Female |
| $2,499 or less | 0 (0.0%) | 0 (0.0%) |
| $2,500 to $4,999 | 0 (0.0%) | 0 (0.0%) |
| $5,000 to $7,499 | 0 (0.0%) | 0 (0.0%) |
| $7,500 to $9,999 | 0 (0.0%) | 0 (0.0%) |
| $10,000 to $12,499 | 0 (0.0%) | 0 (0.0%) |
| $12,500 to $14,999 | 0 (0.0%) | 0 (0.0%) |
| $15,000 to $17,499 | 0 (0.0%) | 0 (0.0%) |
| $17,500 to $19,999 | 0 (0.0%) | 0 (0.0%) |
| $20,000 to $22,499 | 0 (0.0%) | 0 (0.0%) |
| $22,500 to $24,999 | 0 (0.0%) | 0 (0.0%) |
| $25,000 to $29,999 | 0 (0.0%) | 8 (100.0%) |
| $30,000 to $34,999 | 41 (67.2%) | 0 (0.0%) |
| $35,000 to $39,999 | 0 (0.0%) | 0 (0.0%) |
| $40,000 to $44,999 | 0 (0.0%) | 0 (0.0%) |
| $45,000 to $49,999 | 0 (0.0%) | 0 (0.0%) |
| $50,000 to $54,999 | 0 (0.0%) | 0 (0.0%) |
| $55,000 to $64,999 | 0 (0.0%) | 0 (0.0%) |
| $65,000 to $74,999 | 0 (0.0%) | 0 (0.0%) |
| $75,000 to $99,999 | 20 (32.8%) | 0 (0.0%) |
| $100,000+ | 0 (0.0%) | 0 (0.0%) |
| Total | 61 (100.0%) | 8 (100.0%) |
Earnings by Sex by Educational Attainment in Greenview
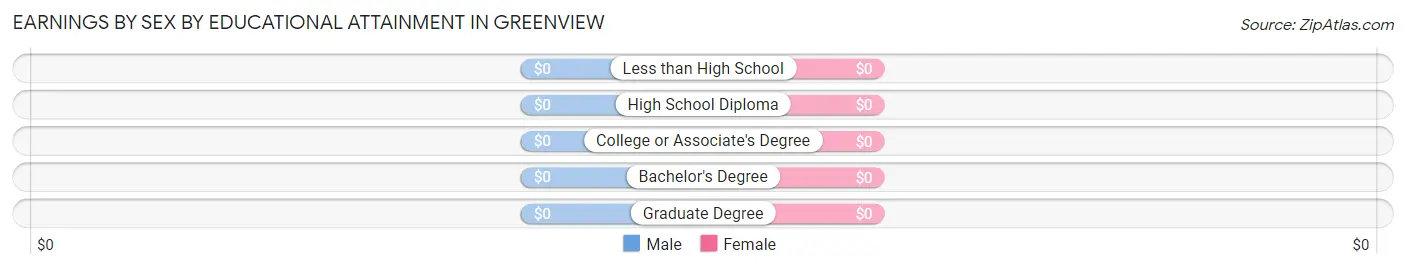
| Educational Attainment | Male Income | Female Income |
| Less than High School | - | - |
| High School Diploma | - | - |
| College or Associate's Degree | - | - |
| Bachelor's Degree | - | - |
| Graduate Degree | - | - |
| Total | - | - |
Family Income in Greenview
Family Income Brackets in Greenview
According to the Greenview family income data, there are 21 families falling into the $15,000 to $24,999 income range, which is the most common income bracket and makes up 36.8% of all families.
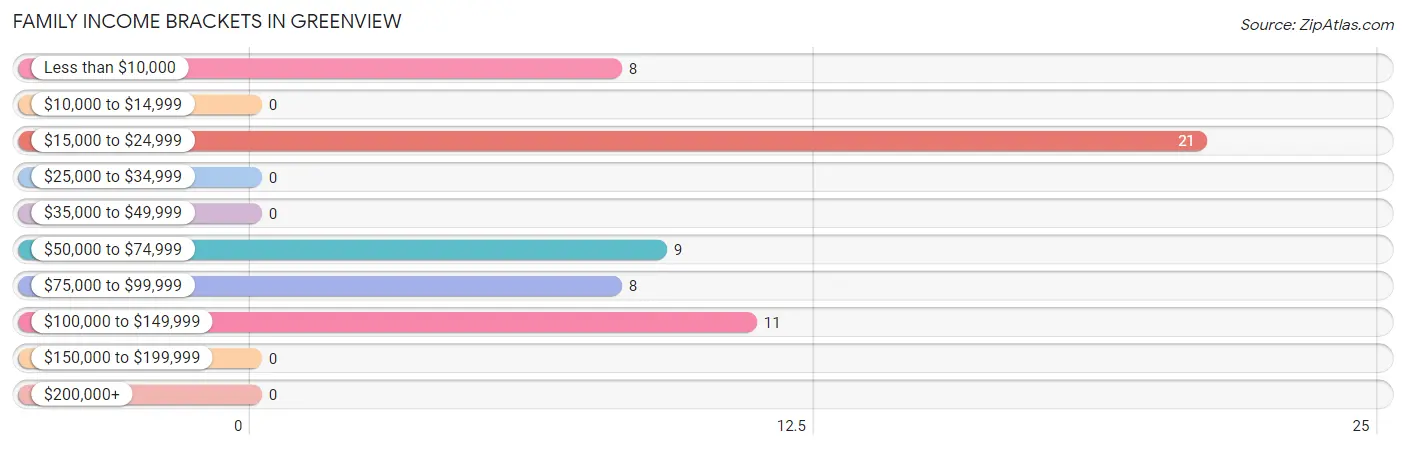
| Income Bracket | # Families | % Families |
| Less than $10,000 | 8 | 14.0% |
| $10,000 to $14,999 | 0 | 0.0% |
| $15,000 to $24,999 | 21 | 36.8% |
| $25,000 to $34,999 | 0 | 0.0% |
| $35,000 to $49,999 | 0 | 0.0% |
| $50,000 to $74,999 | 9 | 15.8% |
| $75,000 to $99,999 | 8 | 14.0% |
| $100,000 to $149,999 | 11 | 19.3% |
| $150,000 to $199,999 | 0 | 0.0% |
| $200,000+ | 0 | 0.0% |
Family Income by Famaliy Size in Greenview
| Income Bracket | # Families | Median Income |
| 2-Person Families | 49 (86.0%) | $0 |
| 3-Person Families | 0 (0.0%) | $0 |
| 4-Person Families | 8 (14.0%) | $0 |
| 5-Person Families | 0 (0.0%) | $0 |
| 6-Person Families | 0 (0.0%) | $0 |
| 7+ Person Families | 0 (0.0%) | $0 |
| Total | 57 (100.0%) | $0 |
Family Income by Number of Earners in Greenview
| Number of Earners | # Families | Median Income |
| No Earners | 29 (50.9%) | $0 |
| 1 Earner | 28 (49.1%) | $0 |
| 2 Earners | 0 (0.0%) | $0 |
| 3+ Earners | 0 (0.0%) | $0 |
| Total | 57 (100.0%) | $0 |
Household Income in Greenview
Household Income Brackets in Greenview
With 30 households falling in the category, the $50,000 to $74,999 income range is the most frequent in Greenview, accounting for 41.7% of all households.
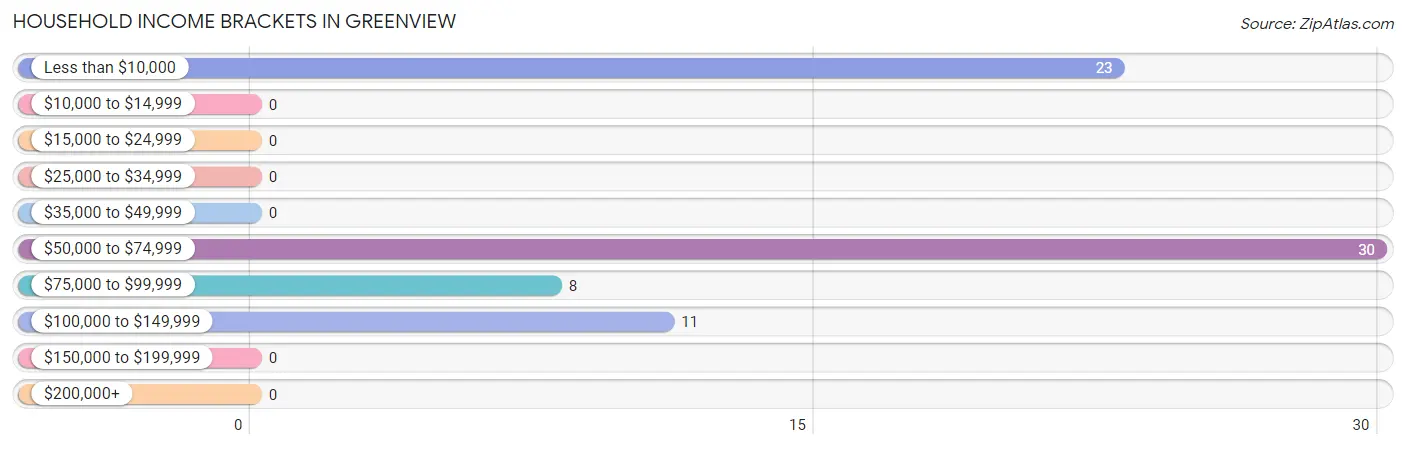
| Income Bracket | # Households | % Households |
| Less than $10,000 | 23 | 31.9% |
| $10,000 to $14,999 | 0 | 0.0% |
| $15,000 to $24,999 | 0 | 0.0% |
| $25,000 to $34,999 | 0 | 0.0% |
| $35,000 to $49,999 | 0 | 0.0% |
| $50,000 to $74,999 | 30 | 41.7% |
| $75,000 to $99,999 | 8 | 11.1% |
| $100,000 to $149,999 | 11 | 15.3% |
| $150,000 to $199,999 | 0 | 0.0% |
| $200,000+ | 0 | 0.0% |
Household Income by Householder Age in Greenview
The median household income in Greenview is $54,048, with the highest median household income of $54,464 found in the 65+ years age bracket for the primary householder. A total of 49 households (68.1%) fall into this category.
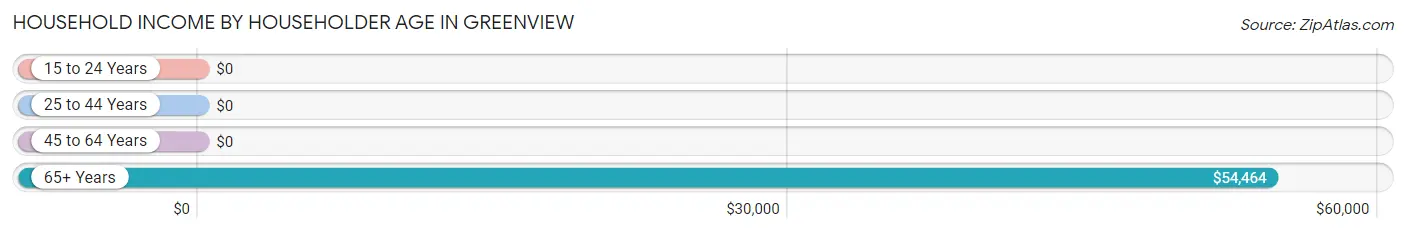
| Income Bracket | # Households | Median Income |
| 15 to 24 Years | 0 (0.0%) | $0 |
| 25 to 44 Years | 8 (11.1%) | $0 |
| 45 to 64 Years | 15 (20.8%) | $0 |
| 65+ Years | 49 (68.1%) | $54,464 |
| Total | 72 (100.0%) | $54,048 |
Poverty in Greenview
Income Below Poverty by Sex and Age in Greenview
With 37.8% poverty level for males and 91.7% for females among the residents of Greenview, under 5 year old males and 6 to 11 year old females are the most vulnerable to poverty, with 10 males (100.0%) and 26 females (100.0%) in their respective age groups living below the poverty level.
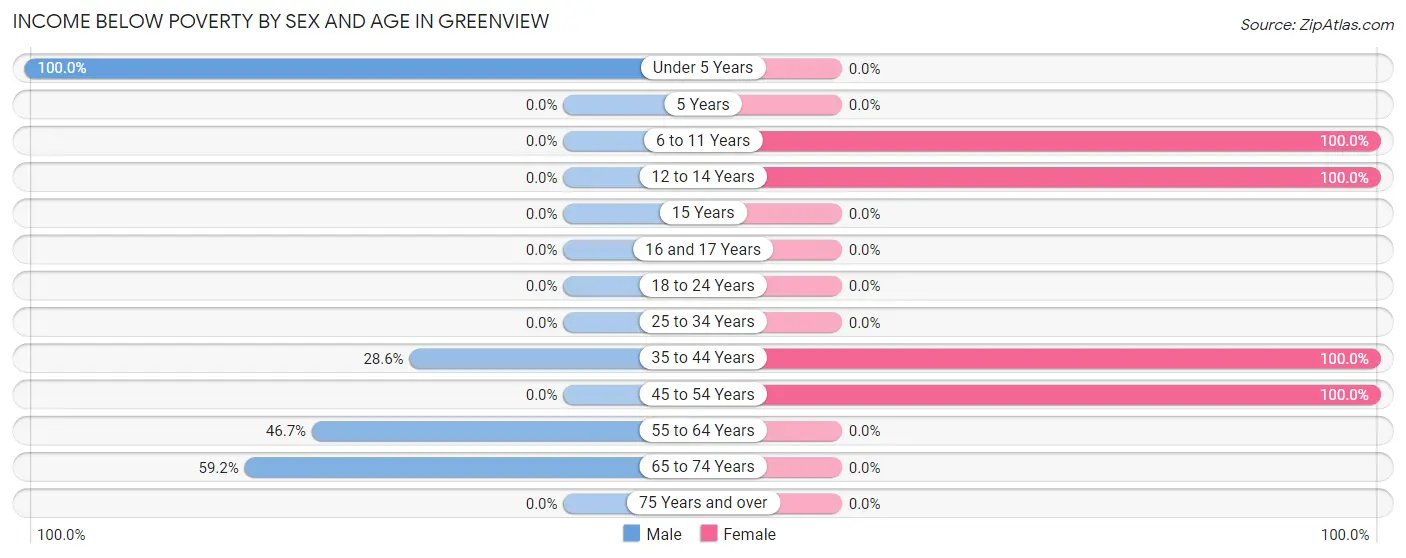
| Age Bracket | Male | Female |
| Under 5 Years | 10 (100.0%) | 0 (0.0%) |
| 5 Years | 0 (0.0%) | 0 (0.0%) |
| 6 to 11 Years | 0 (0.0%) | 26 (100.0%) |
| 12 to 14 Years | 0 (0.0%) | 10 (100.0%) |
| 15 Years | 0 (0.0%) | 0 (0.0%) |
| 16 and 17 Years | 0 (0.0%) | 0 (0.0%) |
| 18 to 24 Years | 0 (0.0%) | 0 (0.0%) |
| 25 to 34 Years | 0 (0.0%) | 0 (0.0%) |
| 35 to 44 Years | 8 (28.6%) | 11 (100.0%) |
| 45 to 54 Years | 0 (0.0%) | 41 (100.0%) |
| 55 to 64 Years | 7 (46.7%) | 0 (0.0%) |
| 65 to 74 Years | 29 (59.2%) | 0 (0.0%) |
| 75 Years and over | 0 (0.0%) | 0 (0.0%) |
| Total | 54 (37.8%) | 88 (91.7%) |
Income Above Poverty by Sex and Age in Greenview
According to the poverty statistics in Greenview, males aged 18 to 24 years and females aged 55 to 64 years are the age groups that are most secure financially, with 100.0% of males and 100.0% of females in these age groups living above the poverty line.
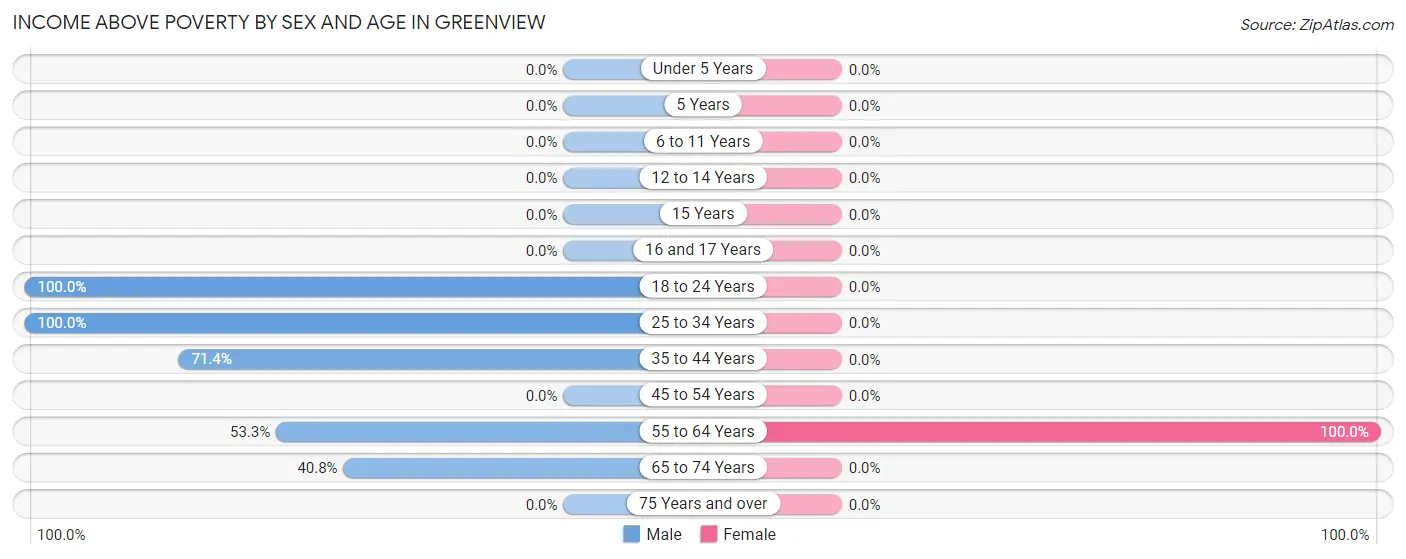
| Age Bracket | Male | Female |
| Under 5 Years | 0 (0.0%) | 0 (0.0%) |
| 5 Years | 0 (0.0%) | 0 (0.0%) |
| 6 to 11 Years | 0 (0.0%) | 0 (0.0%) |
| 12 to 14 Years | 0 (0.0%) | 0 (0.0%) |
| 15 Years | 0 (0.0%) | 0 (0.0%) |
| 16 and 17 Years | 0 (0.0%) | 0 (0.0%) |
| 18 to 24 Years | 12 (100.0%) | 0 (0.0%) |
| 25 to 34 Years | 29 (100.0%) | 0 (0.0%) |
| 35 to 44 Years | 20 (71.4%) | 0 (0.0%) |
| 45 to 54 Years | 0 (0.0%) | 0 (0.0%) |
| 55 to 64 Years | 8 (53.3%) | 8 (100.0%) |
| 65 to 74 Years | 20 (40.8%) | 0 (0.0%) |
| 75 Years and over | 0 (0.0%) | 0 (0.0%) |
| Total | 89 (62.2%) | 8 (8.3%) |
Income Below Poverty Among Married-Couple Families in Greenview
The poverty statistics for married-couple families in Greenview show that 50.0% or 8 of the total 16 families live below the poverty line. Families with 1 or 2 children have the highest poverty rate of 100.0%, comprising of 8 families. On the other hand, families with no children have the lowest poverty rate of 0.0%, which includes 0 families.
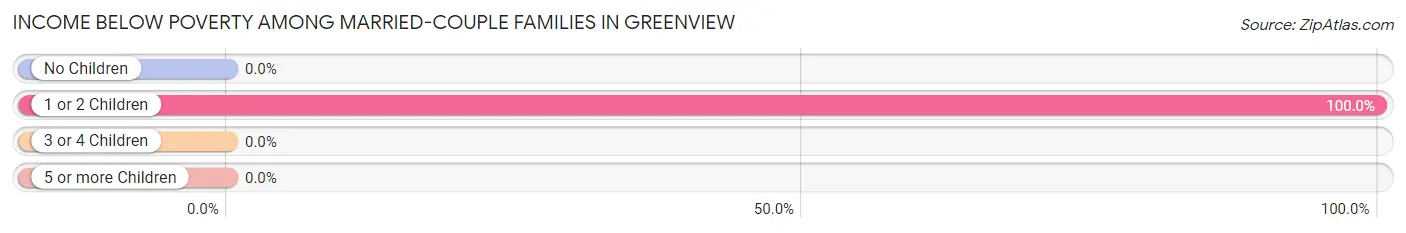
| Children | Above Poverty | Below Poverty |
| No Children | 8 (100.0%) | 0 (0.0%) |
| 1 or 2 Children | 0 (0.0%) | 8 (100.0%) |
| 3 or 4 Children | 0 (0.0%) | 0 (0.0%) |
| 5 or more Children | 0 (0.0%) | 0 (0.0%) |
| Total | 8 (50.0%) | 8 (50.0%) |
Income Below Poverty Among Single-Parent Households in Greenview
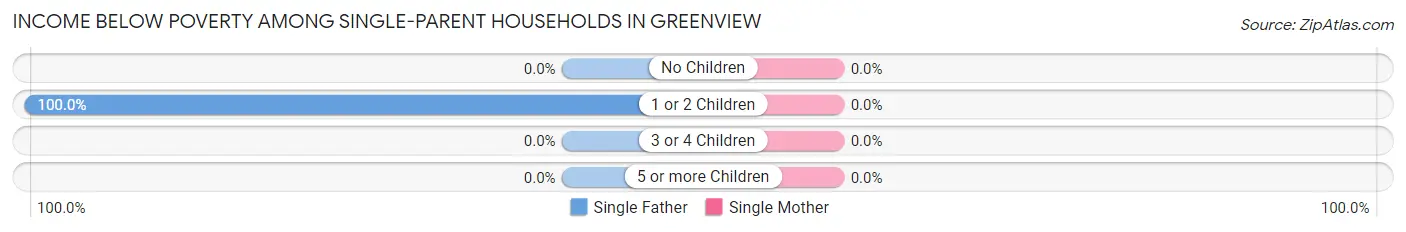
| Children | Single Father | Single Mother |
| No Children | 0 (0.0%) | 0 (0.0%) |
| 1 or 2 Children | 21 (100.0%) | 0 (0.0%) |
| 3 or 4 Children | 0 (0.0%) | 0 (0.0%) |
| 5 or more Children | 0 (0.0%) | 0 (0.0%) |
| Total | 21 (51.2%) | 0 (0.0%) |
Income Below Poverty Among Married-Couple vs Single-Parent Households in Greenview
The poverty data for Greenview shows that 8 of the married-couple family households (50.0%) and 21 of the single-parent households (51.2%) are living below the poverty level. Within the married-couple family households, those with 1 or 2 children have the highest poverty rate, with 8 households (100.0%) falling below the poverty line. Among the single-parent households, those with 1 or 2 children have the highest poverty rate, with 21 household (100.0%) living below poverty.
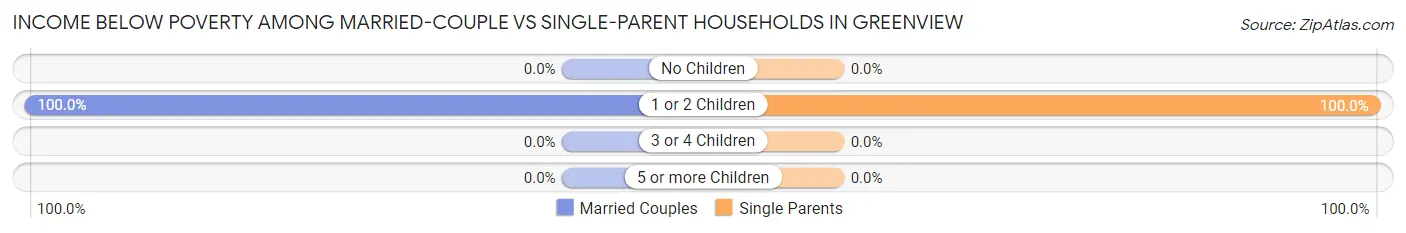
| Children | Married-Couple Families | Single-Parent Households |
| No Children | 0 (0.0%) | 0 (0.0%) |
| 1 or 2 Children | 8 (100.0%) | 21 (100.0%) |
| 3 or 4 Children | 0 (0.0%) | 0 (0.0%) |
| 5 or more Children | 0 (0.0%) | 0 (0.0%) |
| Total | 8 (50.0%) | 21 (51.2%) |
Race in Greenview
The most populous races in Greenview are , and White / Caucasian (239 | 100.0%).
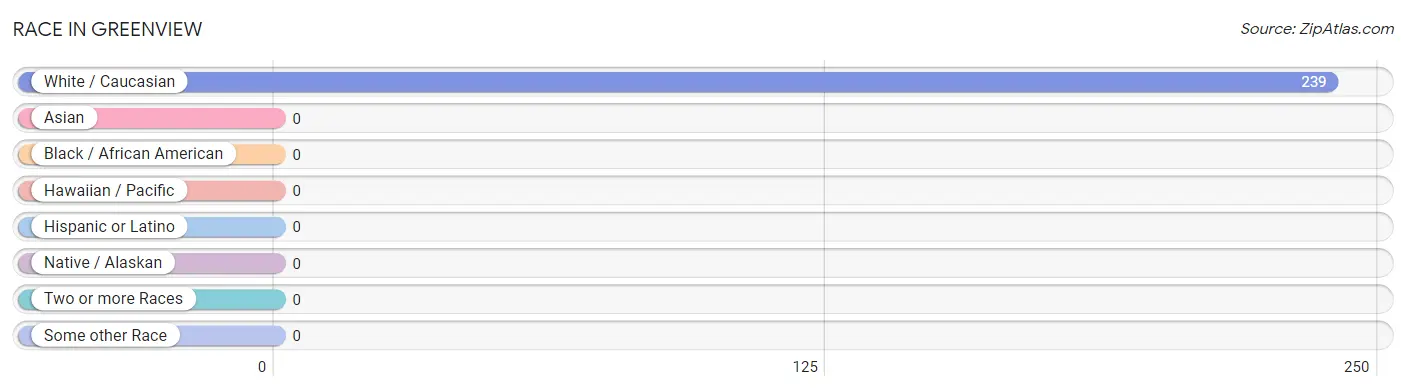
| Race | # Population | % Population |
| Asian | 0 | 0.0% |
| Black / African American | 0 | 0.0% |
| Hawaiian / Pacific | 0 | 0.0% |
| Hispanic or Latino | 0 | 0.0% |
| Native / Alaskan | 0 | 0.0% |
| White / Caucasian | 239 | 100.0% |
| Two or more Races | 0 | 0.0% |
| Some other Race | 0 | 0.0% |
| Total | 239 | 100.0% |
Ancestry in Greenview
The most populous ancestries reported in Greenview are American (36 | 15.1%), German (36 | 15.1%), and Irish (31 | 13.0%), together accounting for 43.1% of all Greenview residents.
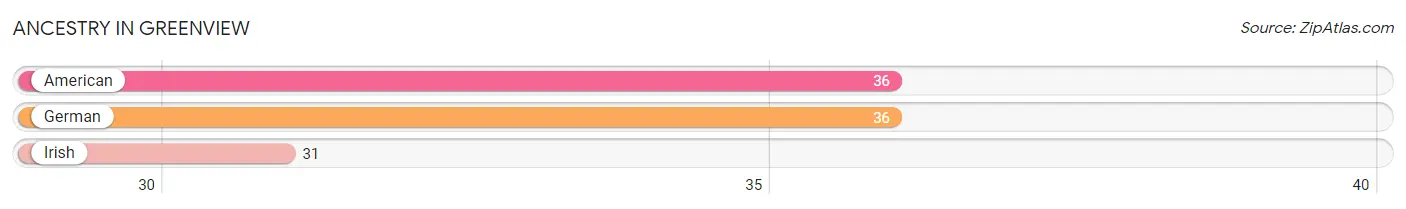
| Ancestry | # Population | % Population |
| American | 36 | 15.1% |
| German | 36 | 15.1% |
| Irish | 31 | 13.0% | View All 3 Rows |
Immigrants in Greenview

| Immigration Origin | # Population | % Population | View All 0 Rows |
Sex and Age in Greenview
Sex and Age in Greenview
The most populous age groups in Greenview are 65 to 69 Years (32 | 22.4%) for men and 50 to 54 Years (41 | 42.7%) for women.
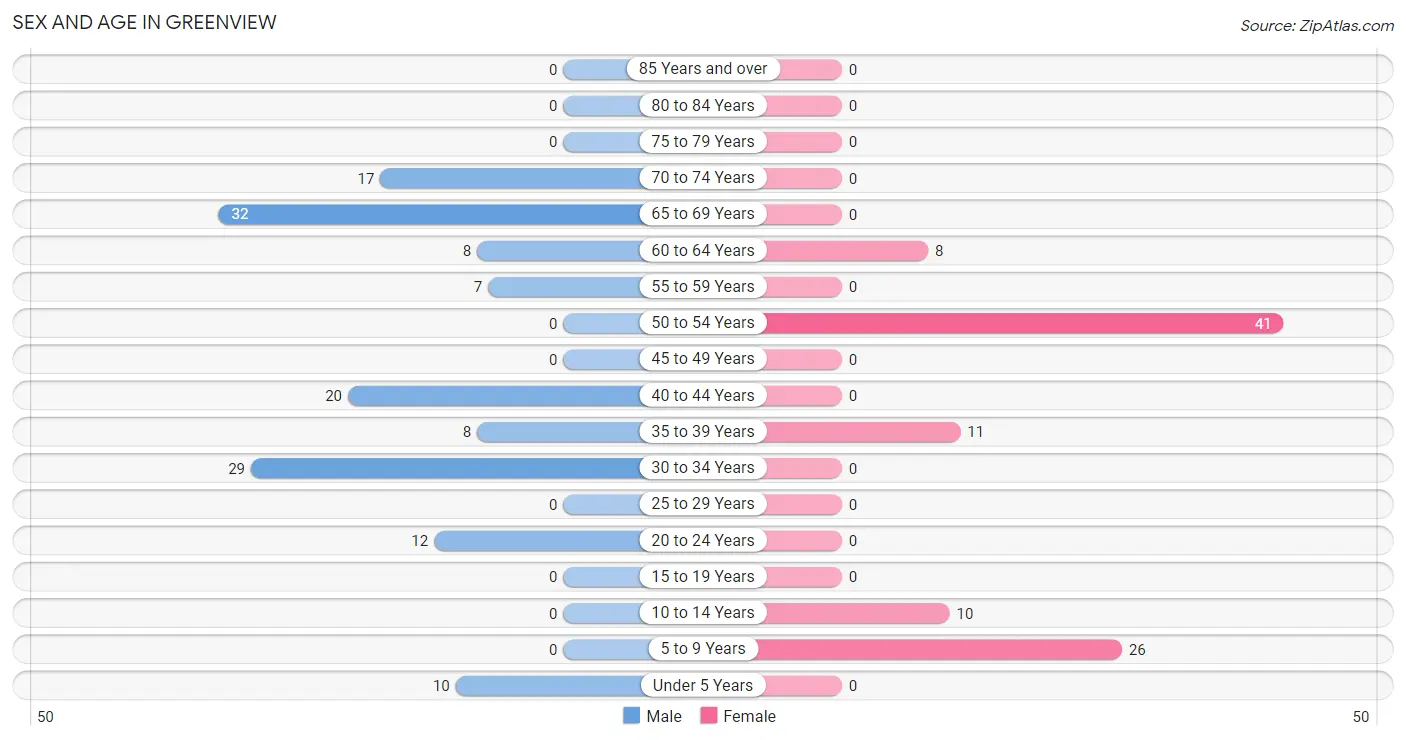
| Age Bracket | Male | Female |
| Under 5 Years | 10 (7.0%) | 0 (0.0%) |
| 5 to 9 Years | 0 (0.0%) | 26 (27.1%) |
| 10 to 14 Years | 0 (0.0%) | 10 (10.4%) |
| 15 to 19 Years | 0 (0.0%) | 0 (0.0%) |
| 20 to 24 Years | 12 (8.4%) | 0 (0.0%) |
| 25 to 29 Years | 0 (0.0%) | 0 (0.0%) |
| 30 to 34 Years | 29 (20.3%) | 0 (0.0%) |
| 35 to 39 Years | 8 (5.6%) | 11 (11.5%) |
| 40 to 44 Years | 20 (14.0%) | 0 (0.0%) |
| 45 to 49 Years | 0 (0.0%) | 0 (0.0%) |
| 50 to 54 Years | 0 (0.0%) | 41 (42.7%) |
| 55 to 59 Years | 7 (4.9%) | 0 (0.0%) |
| 60 to 64 Years | 8 (5.6%) | 8 (8.3%) |
| 65 to 69 Years | 32 (22.4%) | 0 (0.0%) |
| 70 to 74 Years | 17 (11.9%) | 0 (0.0%) |
| 75 to 79 Years | 0 (0.0%) | 0 (0.0%) |
| 80 to 84 Years | 0 (0.0%) | 0 (0.0%) |
| 85 Years and over | 0 (0.0%) | 0 (0.0%) |
| Total | 143 (100.0%) | 96 (100.0%) |
Families and Households in Greenview
Median Family Size in Greenview
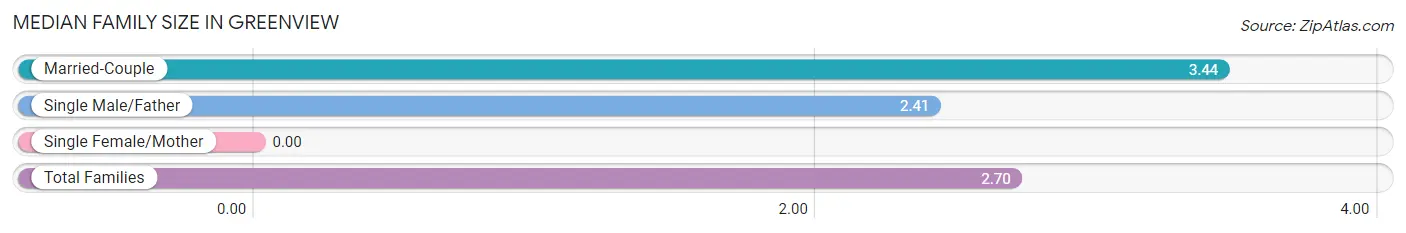
| Family Type | # Families | Family Size |
| Married-Couple | 16 (28.1%) | 3.44 |
| Single Male/Father | 41 (71.9%) | 2.41 |
| Single Female/Mother | 0 (0.0%) | - |
| Total Families | 57 (100.0%) | 2.70 |
Median Household Size in Greenview
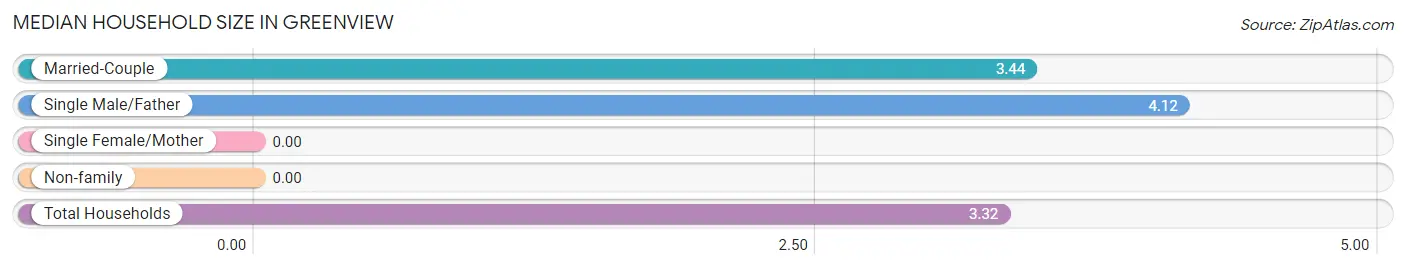
| Household Type | # Households | Household Size |
| Married-Couple | 16 (22.2%) | 3.44 |
| Single Male/Father | 41 (56.9%) | 4.12 |
| Single Female/Mother | 0 (0.0%) | - |
| Non-family | 15 (20.8%) | - |
| Total Households | 72 (100.0%) | 3.32 |
Household Size by Marriage Status in Greenview
Out of a total of 72 households in Greenview, 57 (79.2%) are family households, while 15 (20.8%) are nonfamily households. The most numerous type of family households are 4-person households, comprising 29, and the most common type of nonfamily households are 1-person households, comprising 15.
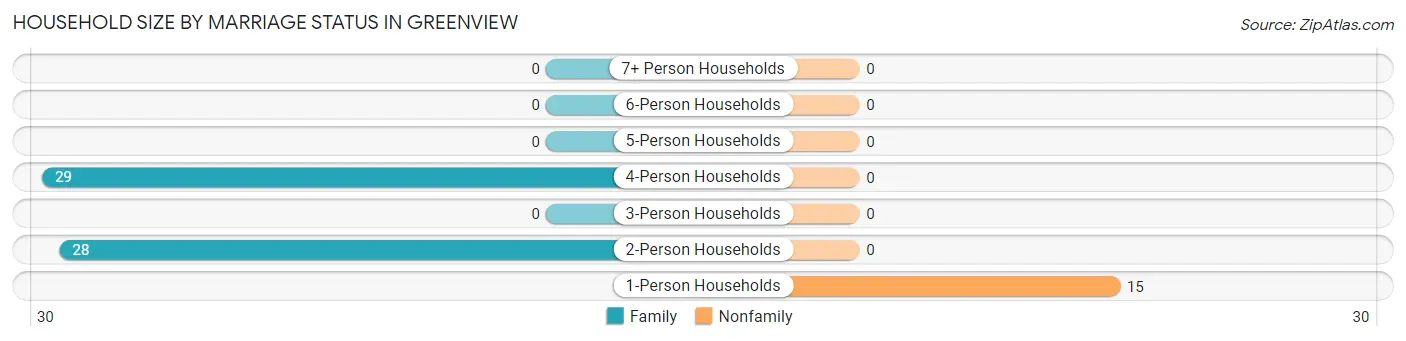
| Household Size | Family Households | Nonfamily Households |
| 1-Person Households | - | 15 (20.8%) |
| 2-Person Households | 28 (38.9%) | 0 (0.0%) |
| 3-Person Households | 0 (0.0%) | 0 (0.0%) |
| 4-Person Households | 29 (40.3%) | 0 (0.0%) |
| 5-Person Households | 0 (0.0%) | 0 (0.0%) |
| 6-Person Households | 0 (0.0%) | 0 (0.0%) |
| 7+ Person Households | 0 (0.0%) | 0 (0.0%) |
| Total | 57 (79.2%) | 15 (20.8%) |
Female Fertility in Greenview
Fertility by Age in Greenview
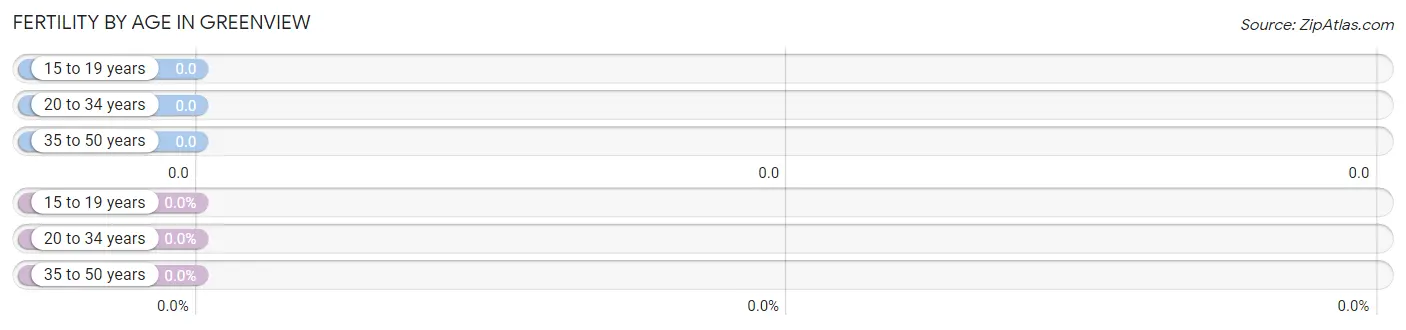
| Age Bracket | Women with Births | Births / 1,000 Women |
| 15 to 19 years | 0 (0.0%) | 0.0 |
| 20 to 34 years | 0 (0.0%) | 0.0 |
| 35 to 50 years | 0 (0.0%) | 0.0 |
| Total | 0 (0.0%) | 0.0 |
Fertility by Age by Marriage Status in Greenview
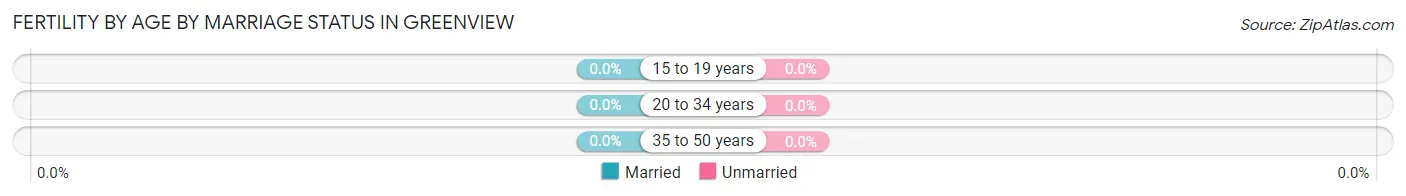
| Age Bracket | Married | Unmarried |
| 15 to 19 years | 0 (0.0%) | 0 (0.0%) |
| 20 to 34 years | 0 (0.0%) | 0 (0.0%) |
| 35 to 50 years | 0 (0.0%) | 0 (0.0%) |
| Total | 0 (0.0%) | 0 (0.0%) |
Fertility by Education in Greenview
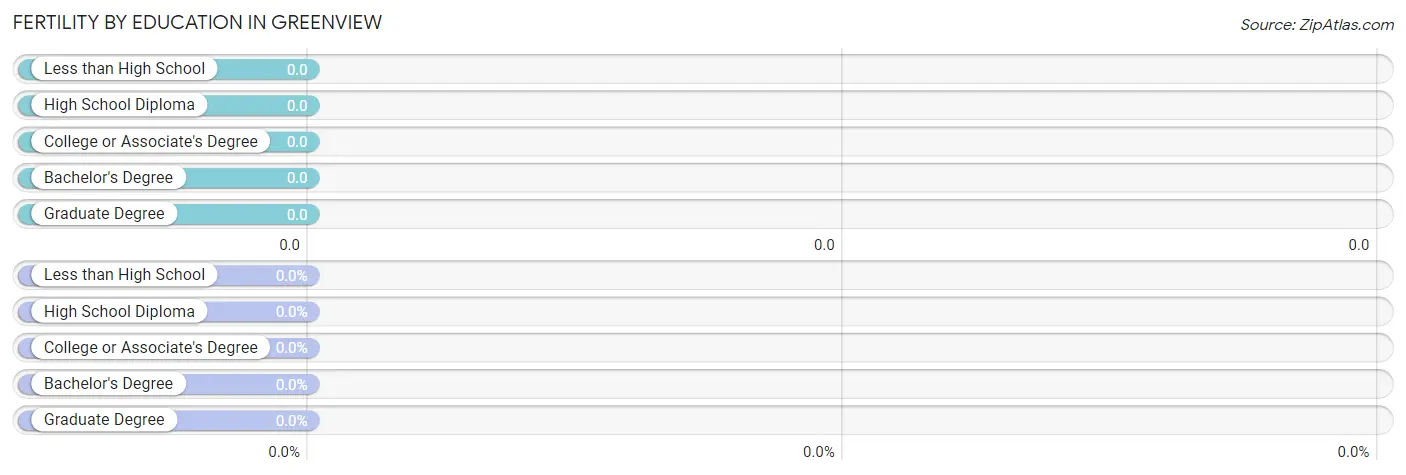
| Educational Attainment | Women with Births | Births / 1,000 Women |
| Less than High School | 0 (0.0%) | 0.0 |
| High School Diploma | 0 (0.0%) | 0.0 |
| College or Associate's Degree | 0 (0.0%) | 0.0 |
| Bachelor's Degree | 0 (0.0%) | 0.0 |
| Graduate Degree | 0 (0.0%) | 0.0 |
| Total | 0 (0.0%) | 0.0 |
Fertility by Education by Marriage Status in Greenview
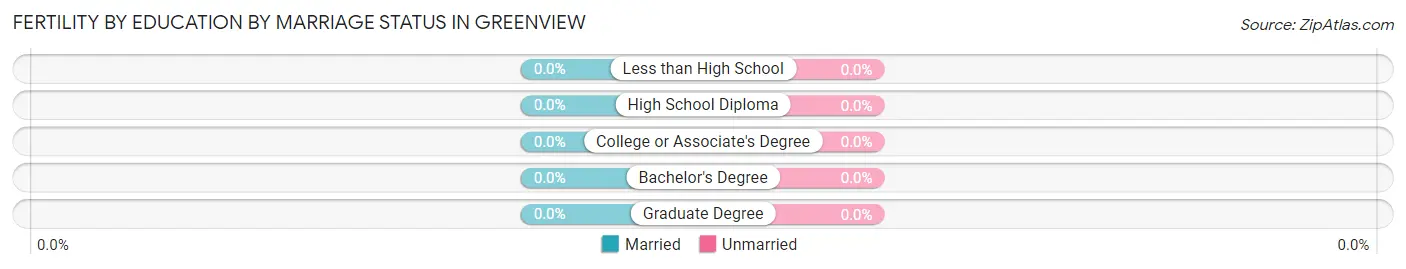
| Educational Attainment | Married | Unmarried |
| Less than High School | 0 (0.0%) | 0 (0.0%) |
| High School Diploma | 0 (0.0%) | 0 (0.0%) |
| College or Associate's Degree | 0 (0.0%) | 0 (0.0%) |
| Bachelor's Degree | 0 (0.0%) | 0 (0.0%) |
| Graduate Degree | 0 (0.0%) | 0 (0.0%) |
| Total | 0 (0.0%) | 0 (0.0%) |
Employment Characteristics in Greenview
Employment by Class of Employer in Greenview
Among the 69 employed individuals in Greenview, , and private company employees (69 | 100.0%) make up the most common classes of employment.
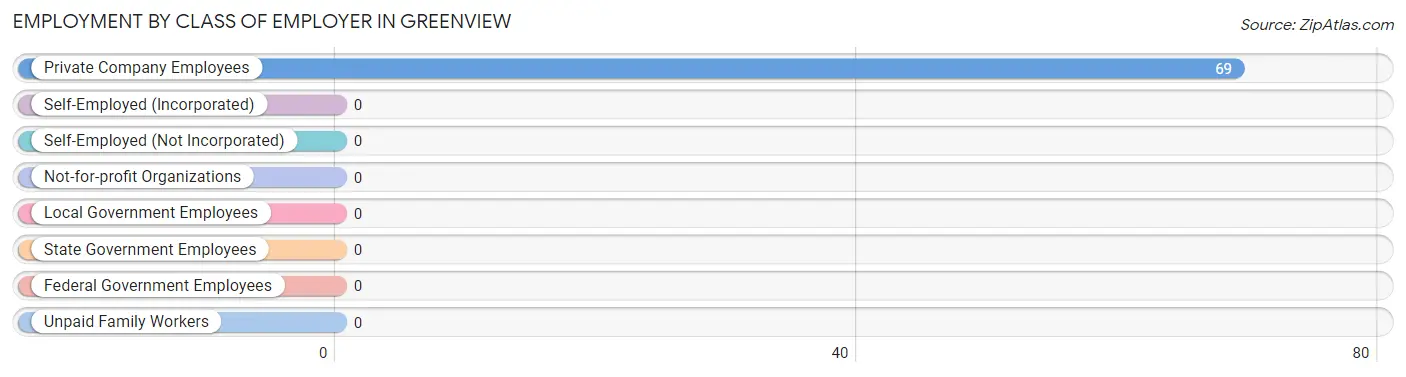
| Employer Class | # Employees | % Employees |
| Private Company Employees | 69 | 100.0% |
| Self-Employed (Incorporated) | 0 | 0.0% |
| Self-Employed (Not Incorporated) | 0 | 0.0% |
| Not-for-profit Organizations | 0 | 0.0% |
| Local Government Employees | 0 | 0.0% |
| State Government Employees | 0 | 0.0% |
| Federal Government Employees | 0 | 0.0% |
| Unpaid Family Workers | 0 | 0.0% |
| Total | 69 | 100.0% |
Employment Status by Age in Greenview
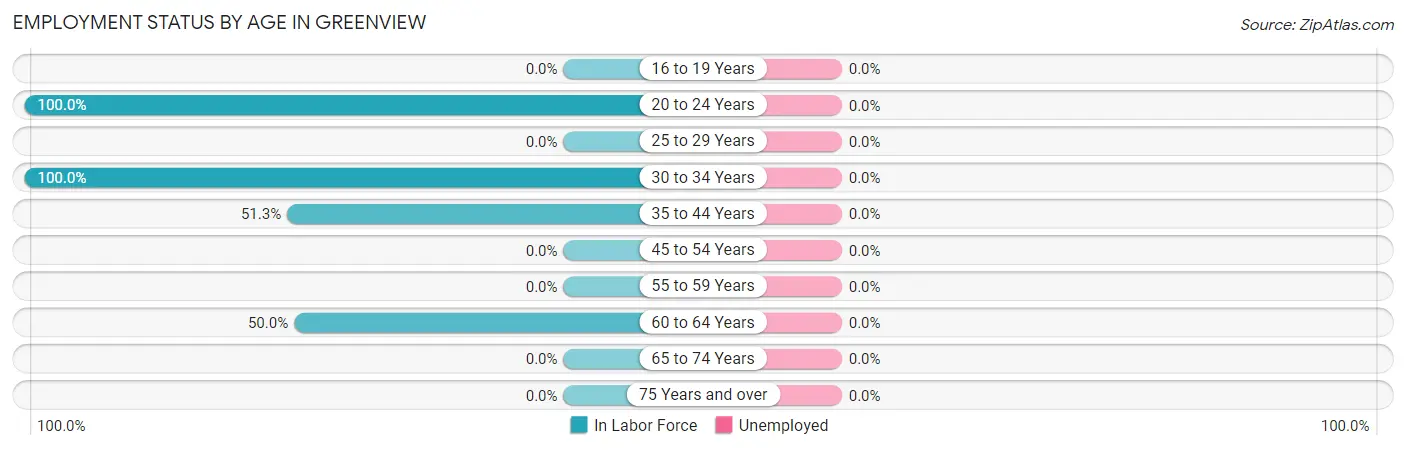
| Age Bracket | In Labor Force | Unemployed |
| 16 to 19 Years | 0 (0.0%) | 0 (0.0%) |
| 20 to 24 Years | 12 (100.0%) | 0 (0.0%) |
| 25 to 29 Years | 0 (0.0%) | 0 (0.0%) |
| 30 to 34 Years | 29 (100.0%) | 0 (0.0%) |
| 35 to 44 Years | 20 (51.3%) | 0 (0.0%) |
| 45 to 54 Years | 0 (0.0%) | 0 (0.0%) |
| 55 to 59 Years | 0 (0.0%) | 0 (0.0%) |
| 60 to 64 Years | 8 (50.0%) | 0 (0.0%) |
| 65 to 74 Years | 0 (0.0%) | 0 (0.0%) |
| 75 Years and over | 0 (0.0%) | 0 (0.0%) |
| Total | 69 (35.8%) | 0 (0.0%) |
Employment Status by Educational Attainment in Greenview
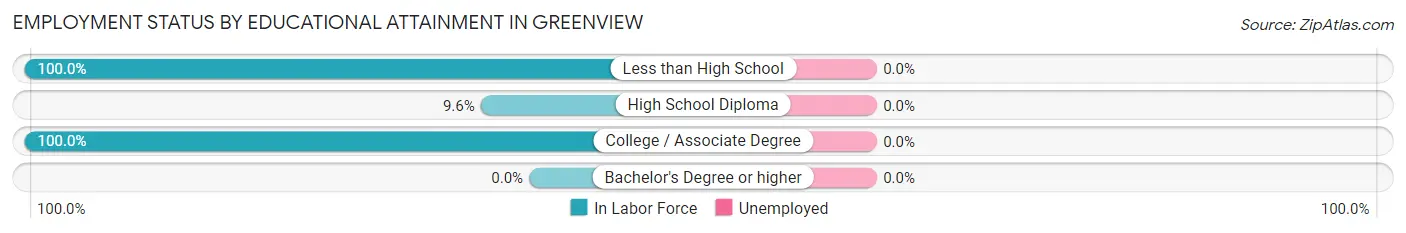
| Educational Attainment | In Labor Force | Unemployed |
| Less than High School | 29 (100.0%) | 0 (0.0%) |
| High School Diploma | 8 (9.6%) | 0 (0.0%) |
| College / Associate Degree | 20 (100.0%) | 0 (0.0%) |
| Bachelor's Degree or higher | 0 (0.0%) | 0 (0.0%) |
| Total | 57 (43.2%) | 0 (0.0%) |
Employment Occupations by Sex in Greenview
Management, Business, Science and Arts Occupations
The most common Management, Business, Science and Arts occupations in Greenview are , and Health Diagnosing & Treating (8 | 11.6%).
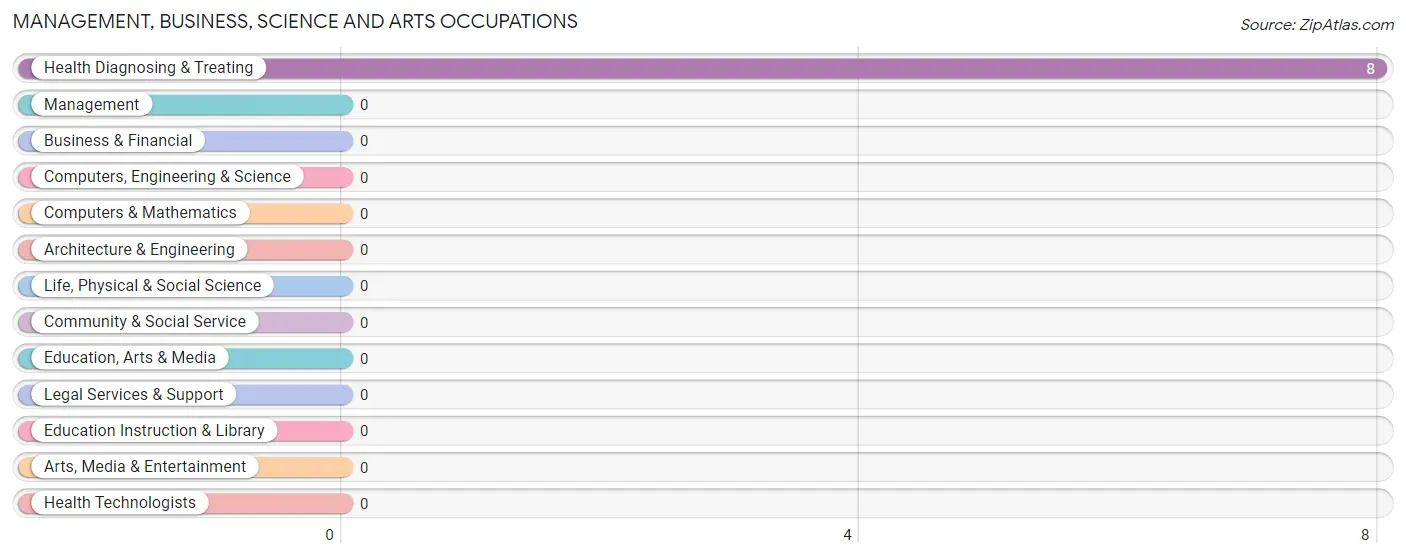
Management, Business, Science and Arts Occupations by Sex
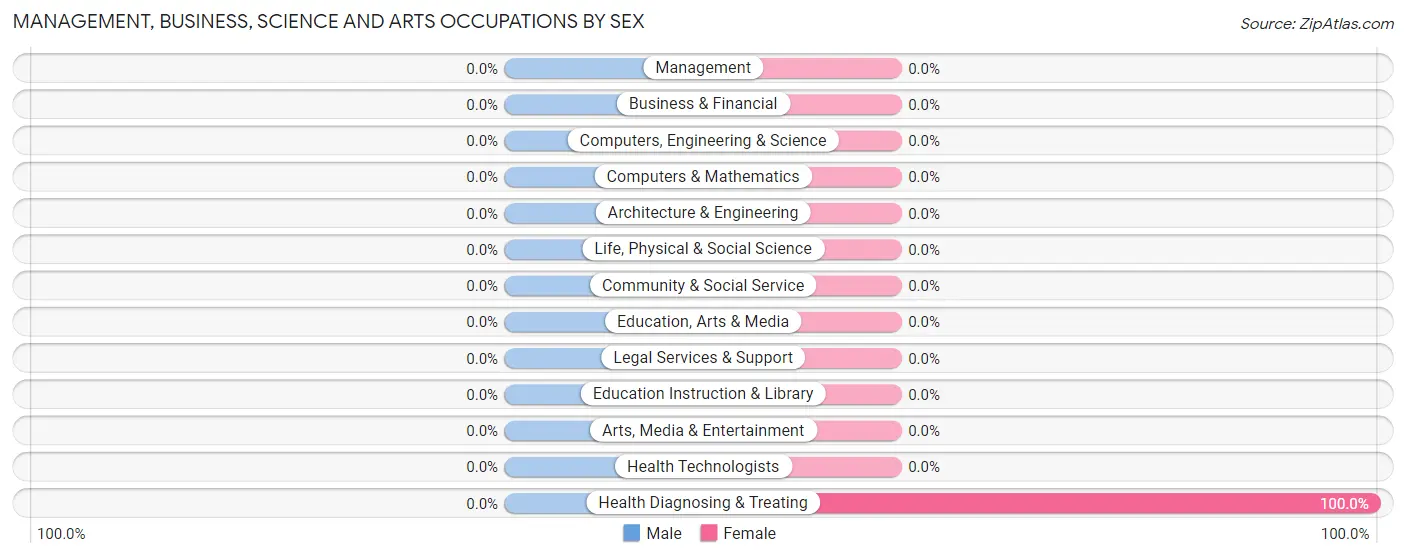
| Occupation | Male | Female |
| Management | 0 (0.0%) | 0 (0.0%) |
| Business & Financial | 0 (0.0%) | 0 (0.0%) |
| Computers, Engineering & Science | 0 (0.0%) | 0 (0.0%) |
| Computers & Mathematics | 0 (0.0%) | 0 (0.0%) |
| Architecture & Engineering | 0 (0.0%) | 0 (0.0%) |
| Life, Physical & Social Science | 0 (0.0%) | 0 (0.0%) |
| Community & Social Service | 0 (0.0%) | 0 (0.0%) |
| Education, Arts & Media | 0 (0.0%) | 0 (0.0%) |
| Legal Services & Support | 0 (0.0%) | 0 (0.0%) |
| Education Instruction & Library | 0 (0.0%) | 0 (0.0%) |
| Arts, Media & Entertainment | 0 (0.0%) | 0 (0.0%) |
| Health Diagnosing & Treating | 0 (0.0%) | 8 (100.0%) |
| Health Technologists | 0 (0.0%) | 0 (0.0%) |
| Total (Category) | 0 (0.0%) | 8 (100.0%) |
| Total (Overall) | 61 (88.4%) | 8 (11.6%) |
Services Occupations
Services Occupations by Sex
| Occupation | Male | Female |
| Healthcare Support | 0 (0.0%) | 0 (0.0%) |
| Security & Protection | 0 (0.0%) | 0 (0.0%) |
| Firefighting & Prevention | 0 (0.0%) | 0 (0.0%) |
| Law Enforcement | 0 (0.0%) | 0 (0.0%) |
| Food Preparation & Serving | 0 (0.0%) | 0 (0.0%) |
| Cleaning & Maintenance | 0 (0.0%) | 0 (0.0%) |
| Personal Care & Service | 0 (0.0%) | 0 (0.0%) |
| Total (Category) | 0 (0.0%) | 0 (0.0%) |
| Total (Overall) | 61 (88.4%) | 8 (11.6%) |
Sales and Office Occupations
Sales and Office Occupations by Sex
| Occupation | Male | Female |
| Sales & Related | 0 (0.0%) | 0 (0.0%) |
| Office & Administration | 0 (0.0%) | 0 (0.0%) |
| Total (Category) | 0 (0.0%) | 0 (0.0%) |
| Total (Overall) | 61 (88.4%) | 8 (11.6%) |
Natural Resources, Construction and Maintenance Occupations
The most common Natural Resources, Construction and Maintenance occupations in Greenview are Construction & Extraction (41 | 59.4%), and Installation, Maintenance & Repair (20 | 29.0%).

Natural Resources, Construction and Maintenance Occupations by Sex
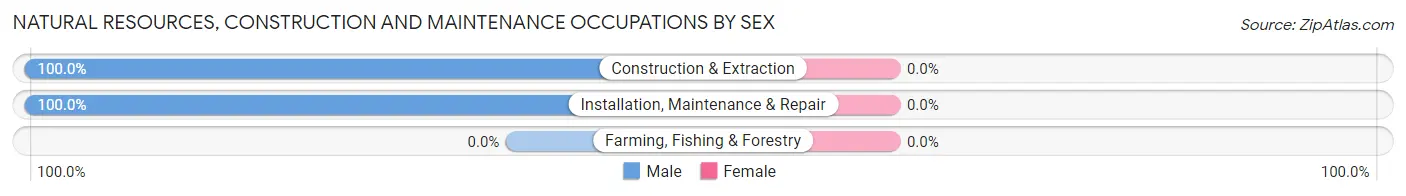
| Occupation | Male | Female |
| Farming, Fishing & Forestry | 0 (0.0%) | 0 (0.0%) |
| Construction & Extraction | 41 (100.0%) | 0 (0.0%) |
| Installation, Maintenance & Repair | 20 (100.0%) | 0 (0.0%) |
| Total (Category) | 61 (100.0%) | 0 (0.0%) |
| Total (Overall) | 61 (88.4%) | 8 (11.6%) |
Production, Transportation and Moving Occupations
Production, Transportation and Moving Occupations by Sex
| Occupation | Male | Female |
| Production | 0 (0.0%) | 0 (0.0%) |
| Transportation | 0 (0.0%) | 0 (0.0%) |
| Material Moving | 0 (0.0%) | 0 (0.0%) |
| Total (Category) | 0 (0.0%) | 0 (0.0%) |
| Total (Overall) | 61 (88.4%) | 8 (11.6%) |
Employment Industries by Sex in Greenview
Employment Industries in Greenview
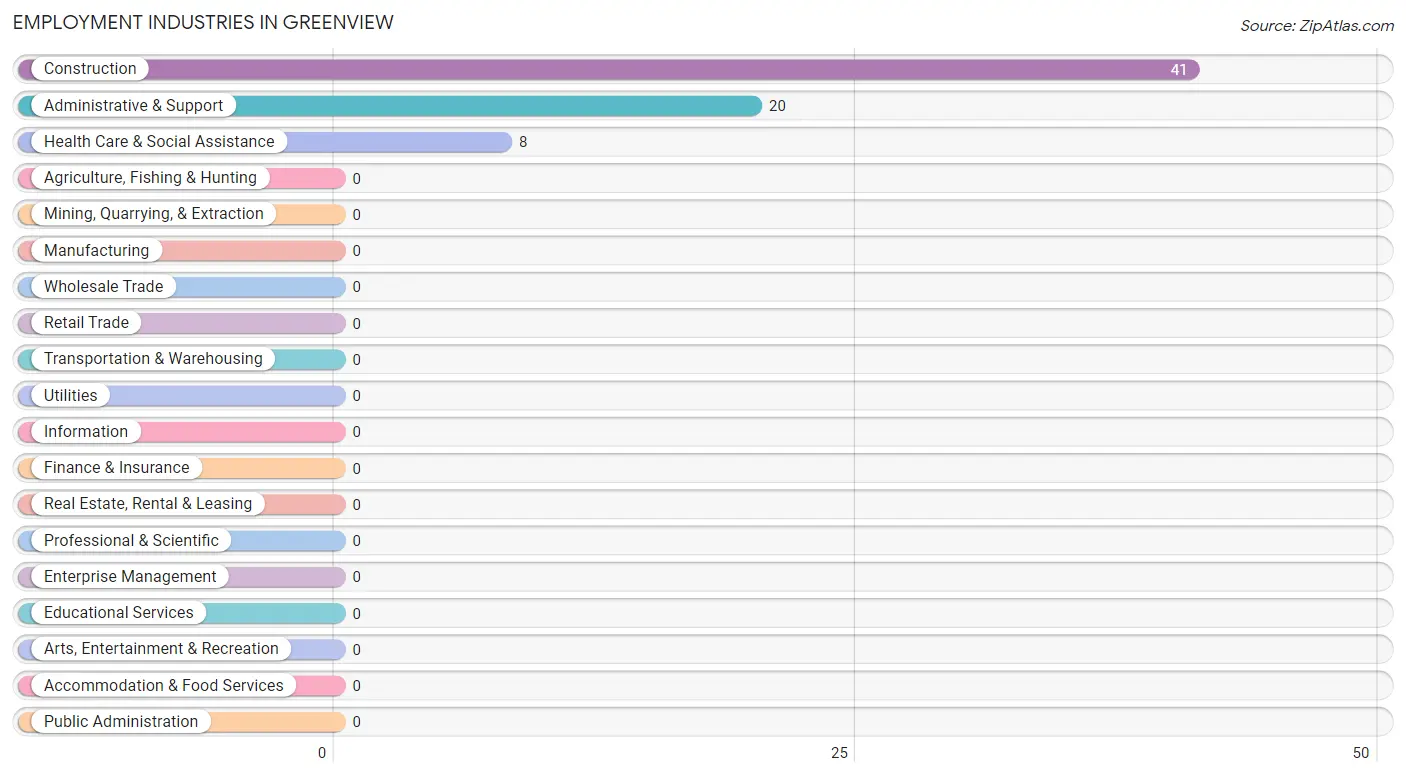
The major employment industries in Greenview include Construction (41 | 59.4%), Administrative & Support (20 | 29.0%), and Health Care & Social Assistance (8 | 11.6%).
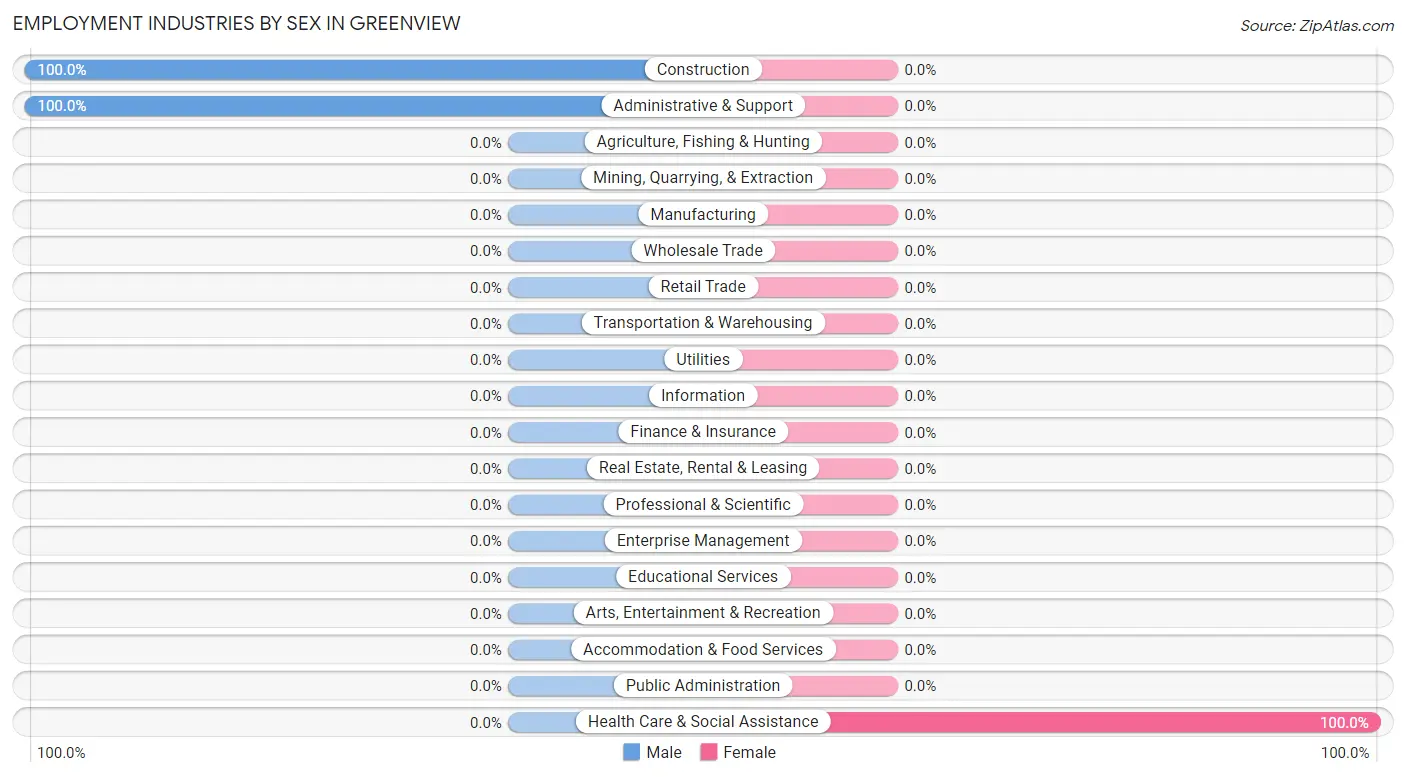
Employment Industries by Sex in Greenview
| Industry | Male | Female |
| Agriculture, Fishing & Hunting | 0 (0.0%) | 0 (0.0%) |
| Mining, Quarrying, & Extraction | 0 (0.0%) | 0 (0.0%) |
| Construction | 41 (100.0%) | 0 (0.0%) |
| Manufacturing | 0 (0.0%) | 0 (0.0%) |
| Wholesale Trade | 0 (0.0%) | 0 (0.0%) |
| Retail Trade | 0 (0.0%) | 0 (0.0%) |
| Transportation & Warehousing | 0 (0.0%) | 0 (0.0%) |
| Utilities | 0 (0.0%) | 0 (0.0%) |
| Information | 0 (0.0%) | 0 (0.0%) |
| Finance & Insurance | 0 (0.0%) | 0 (0.0%) |
| Real Estate, Rental & Leasing | 0 (0.0%) | 0 (0.0%) |
| Professional & Scientific | 0 (0.0%) | 0 (0.0%) |
| Enterprise Management | 0 (0.0%) | 0 (0.0%) |
| Administrative & Support | 20 (100.0%) | 0 (0.0%) |
| Educational Services | 0 (0.0%) | 0 (0.0%) |
| Health Care & Social Assistance | 0 (0.0%) | 8 (100.0%) |
| Arts, Entertainment & Recreation | 0 (0.0%) | 0 (0.0%) |
| Accommodation & Food Services | 0 (0.0%) | 0 (0.0%) |
| Public Administration | 0 (0.0%) | 0 (0.0%) |
| Total | 61 (88.4%) | 8 (11.6%) |
Education in Greenview
School Enrollment in Greenview
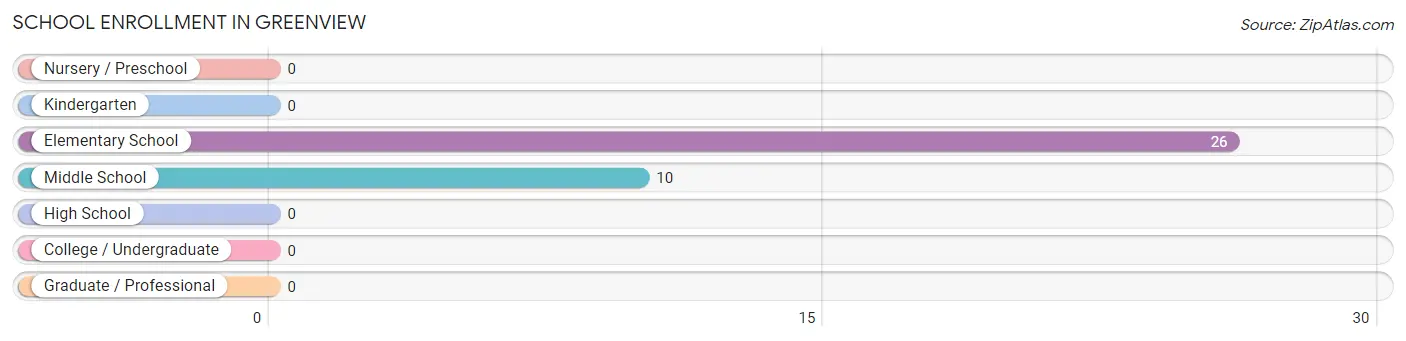
The most common levels of schooling among the 36 students in Greenview are elementary school (26 | 72.2%), and middle school (10 | 27.8%).
| School Level | # Students | % Students |
| Nursery / Preschool | 0 | 0.0% |
| Kindergarten | 0 | 0.0% |
| Elementary School | 26 | 72.2% |
| Middle School | 10 | 27.8% |
| High School | 0 | 0.0% |
| College / Undergraduate | 0 | 0.0% |
| Graduate / Professional | 0 | 0.0% |
| Total | 36 | 100.0% |
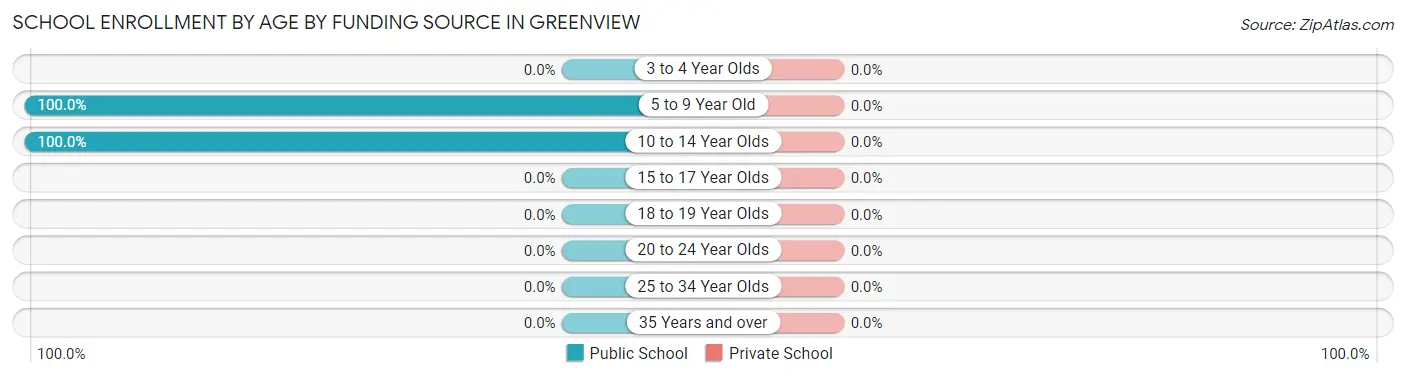
School Enrollment by Age by Funding Source in Greenview
| Age Bracket | Public School | Private School |
| 3 to 4 Year Olds | 0 (0.0%) | 0 (0.0%) |
| 5 to 9 Year Old | 26 (100.0%) | 0 (0.0%) |
| 10 to 14 Year Olds | 10 (100.0%) | 0 (0.0%) |
| 15 to 17 Year Olds | 0 (0.0%) | 0 (0.0%) |
| 18 to 19 Year Olds | 0 (0.0%) | 0 (0.0%) |
| 20 to 24 Year Olds | 0 (0.0%) | 0 (0.0%) |
| 25 to 34 Year Olds | 0 (0.0%) | 0 (0.0%) |
| 35 Years and over | 0 (0.0%) | 0 (0.0%) |
| Total | 36 (100.0%) | 0 (0.0%) |
Educational Attainment by Field of Study in Greenview
| Field of Study | # Graduates | % Graduates |
| Computers & Mathematics | 0 | 0.0% |
| Bio, Nature & Agricultural | 0 | 0.0% |
| Physical & Health Sciences | 0 | 0.0% |
| Psychology | 0 | 0.0% |
| Social Sciences | 0 | 0.0% |
| Engineering | 0 | 0.0% |
| Multidisciplinary Studies | 0 | 0.0% |
| Science & Technology | 0 | 0.0% |
| Business | 0 | 0.0% |
| Education | 0 | 0.0% |
| Literature & Languages | 0 | 0.0% |
| Liberal Arts & History | 0 | 0.0% |
| Visual & Performing Arts | 0 | 0.0% |
| Communications | 0 | 0.0% |
| Arts & Humanities | 0 | 0.0% |
| Total | 0 | 0.0% |
Transportation & Commute in Greenview
Vehicle Availability by Sex in Greenview
The most prevalent vehicle ownership categories in Greenview are males with 2 vehicles (29, accounting for 47.5%) and females with 2 vehicles (0, making up 362.5%).
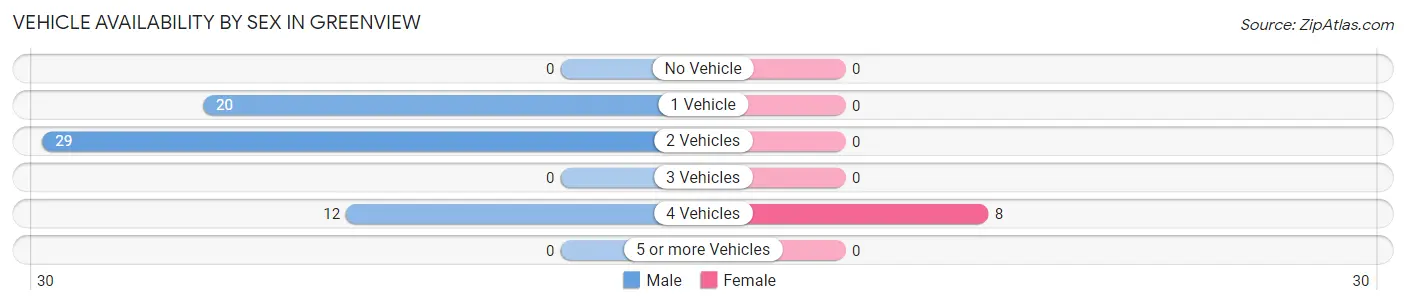
| Vehicles Available | Male | Female |
| No Vehicle | 0 (0.0%) | 0 (0.0%) |
| 1 Vehicle | 20 (32.8%) | 0 (0.0%) |
| 2 Vehicles | 29 (47.5%) | 0 (0.0%) |
| 3 Vehicles | 0 (0.0%) | 0 (0.0%) |
| 4 Vehicles | 12 (19.7%) | 8 (100.0%) |
| 5 or more Vehicles | 0 (0.0%) | 0 (0.0%) |
| Total | 61 (100.0%) | 8 (100.0%) |
Commute Time in Greenview
The most frequently occuring commute durations in Greenview are 40 to 44 minutes (32 commuters, 46.4%), 10 to 14 minutes (29 commuters, 42.0%), and 20 to 24 minutes (8 commuters, 11.6%).
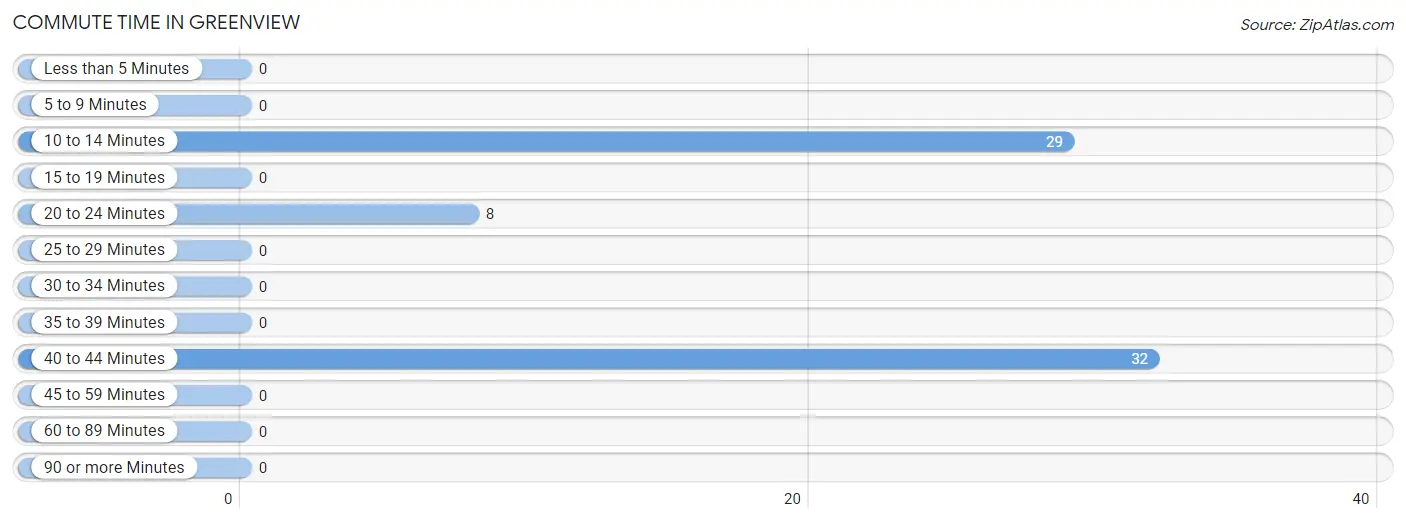
| Commute Time | # Commuters | % Commuters |
| Less than 5 Minutes | 0 | 0.0% |
| 5 to 9 Minutes | 0 | 0.0% |
| 10 to 14 Minutes | 29 | 42.0% |
| 15 to 19 Minutes | 0 | 0.0% |
| 20 to 24 Minutes | 8 | 11.6% |
| 25 to 29 Minutes | 0 | 0.0% |
| 30 to 34 Minutes | 0 | 0.0% |
| 35 to 39 Minutes | 0 | 0.0% |
| 40 to 44 Minutes | 32 | 46.4% |
| 45 to 59 Minutes | 0 | 0.0% |
| 60 to 89 Minutes | 0 | 0.0% |
| 90 or more Minutes | 0 | 0.0% |
Commute Time by Sex in Greenview
The most common commute times in Greenview are 40 to 44 minutes (32 commuters, 52.5%) for males and 20 to 24 minutes (8 commuters, 100.0%) for females.
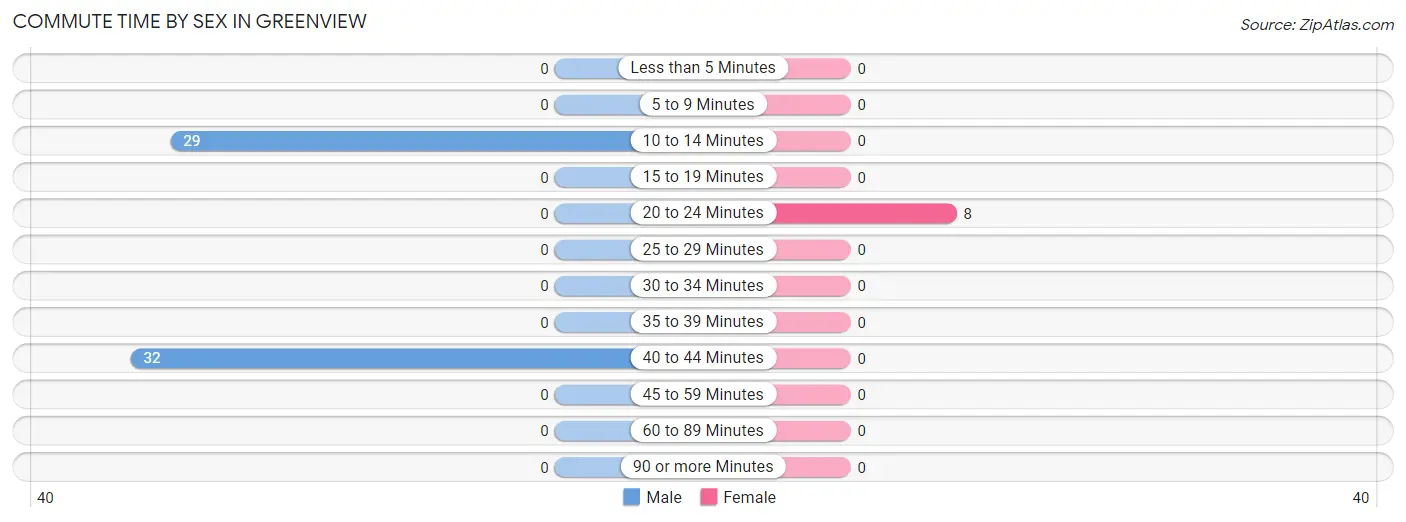
| Commute Time | Male | Female |
| Less than 5 Minutes | 0 (0.0%) | 0 (0.0%) |
| 5 to 9 Minutes | 0 (0.0%) | 0 (0.0%) |
| 10 to 14 Minutes | 29 (47.5%) | 0 (0.0%) |
| 15 to 19 Minutes | 0 (0.0%) | 0 (0.0%) |
| 20 to 24 Minutes | 0 (0.0%) | 8 (100.0%) |
| 25 to 29 Minutes | 0 (0.0%) | 0 (0.0%) |
| 30 to 34 Minutes | 0 (0.0%) | 0 (0.0%) |
| 35 to 39 Minutes | 0 (0.0%) | 0 (0.0%) |
| 40 to 44 Minutes | 32 (52.5%) | 0 (0.0%) |
| 45 to 59 Minutes | 0 (0.0%) | 0 (0.0%) |
| 60 to 89 Minutes | 0 (0.0%) | 0 (0.0%) |
| 90 or more Minutes | 0 (0.0%) | 0 (0.0%) |
Time of Departure to Work by Sex in Greenview
The most frequent times of departure to work in Greenview are 5:30 AM to 5:59 AM (32, 52.5%) for males and 9:00 AM to 9:59 AM (8, 100.0%) for females.
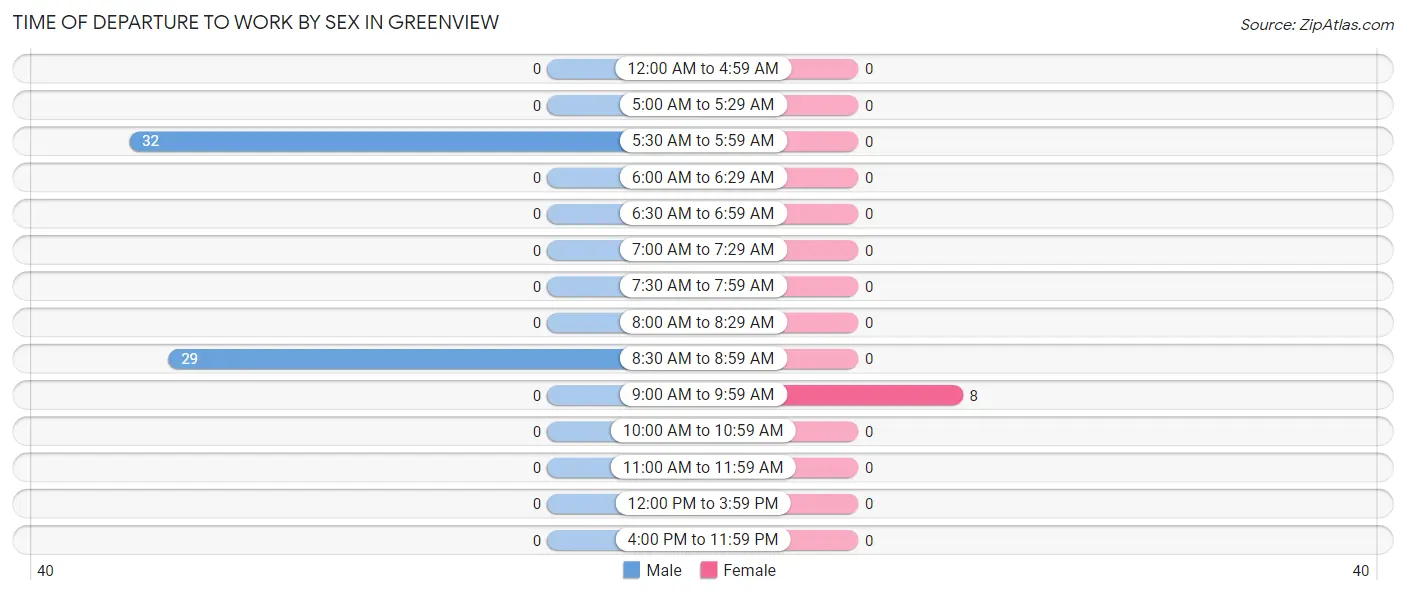
| Time of Departure | Male | Female |
| 12:00 AM to 4:59 AM | 0 (0.0%) | 0 (0.0%) |
| 5:00 AM to 5:29 AM | 0 (0.0%) | 0 (0.0%) |
| 5:30 AM to 5:59 AM | 32 (52.5%) | 0 (0.0%) |
| 6:00 AM to 6:29 AM | 0 (0.0%) | 0 (0.0%) |
| 6:30 AM to 6:59 AM | 0 (0.0%) | 0 (0.0%) |
| 7:00 AM to 7:29 AM | 0 (0.0%) | 0 (0.0%) |
| 7:30 AM to 7:59 AM | 0 (0.0%) | 0 (0.0%) |
| 8:00 AM to 8:29 AM | 0 (0.0%) | 0 (0.0%) |
| 8:30 AM to 8:59 AM | 29 (47.5%) | 0 (0.0%) |
| 9:00 AM to 9:59 AM | 0 (0.0%) | 8 (100.0%) |
| 10:00 AM to 10:59 AM | 0 (0.0%) | 0 (0.0%) |
| 11:00 AM to 11:59 AM | 0 (0.0%) | 0 (0.0%) |
| 12:00 PM to 3:59 PM | 0 (0.0%) | 0 (0.0%) |
| 4:00 PM to 11:59 PM | 0 (0.0%) | 0 (0.0%) |
| Total | 61 (100.0%) | 8 (100.0%) |
Housing Occupancy in Greenview
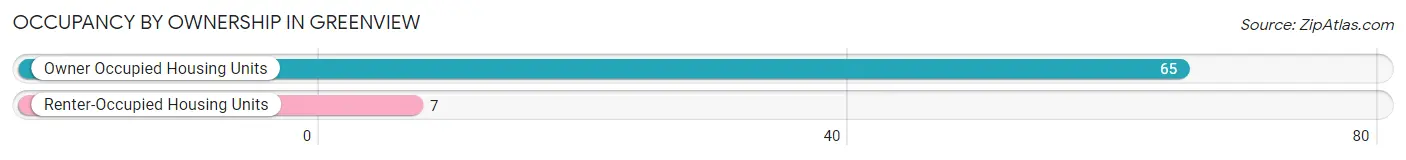
Occupancy by Ownership in Greenview
Of the total 72 dwellings in Greenview, owner-occupied units account for 65 (90.3%), while renter-occupied units make up 7 (9.7%).
| Occupancy | # Housing Units | % Housing Units |
| Owner Occupied Housing Units | 65 | 90.3% |
| Renter-Occupied Housing Units | 7 | 9.7% |
| Total Occupied Housing Units | 72 | 100.0% |
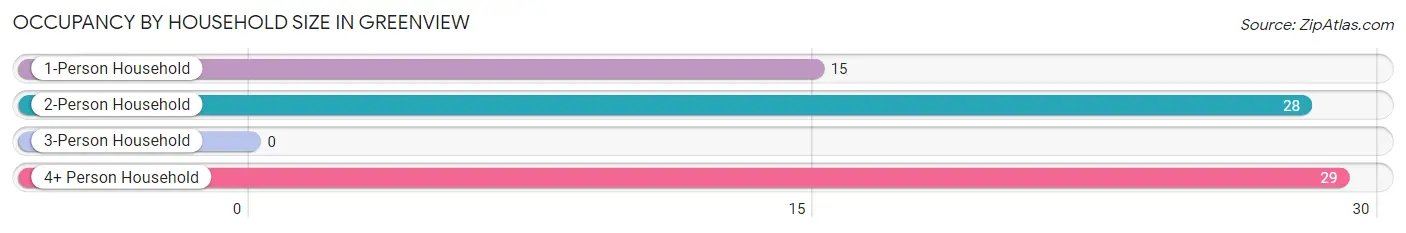
Occupancy by Household Size in Greenview
| Household Size | # Housing Units | % Housing Units |
| 1-Person Household | 15 | 20.8% |
| 2-Person Household | 28 | 38.9% |
| 3-Person Household | 0 | 0.0% |
| 4+ Person Household | 29 | 40.3% |
| Total Housing Units | 72 | 100.0% |
Occupancy by Ownership by Household Size in Greenview
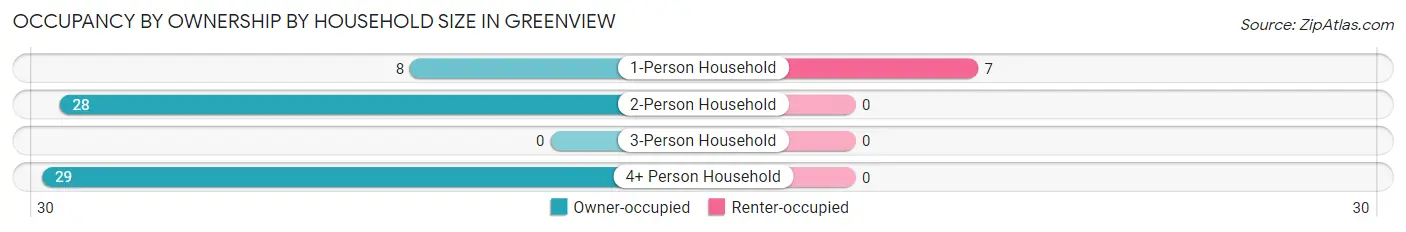
| Household Size | Owner-occupied | Renter-occupied |
| 1-Person Household | 8 (53.3%) | 7 (46.7%) |
| 2-Person Household | 28 (100.0%) | 0 (0.0%) |
| 3-Person Household | 0 (0.0%) | 0 (0.0%) |
| 4+ Person Household | 29 (100.0%) | 0 (0.0%) |
| Total Housing Units | 65 (90.3%) | 7 (9.7%) |
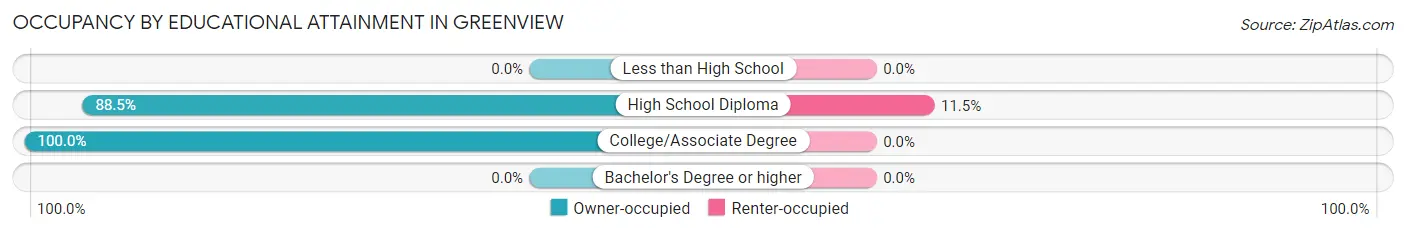
Occupancy by Educational Attainment in Greenview
| Household Size | Owner-occupied | Renter-occupied |
| Less than High School | 0 (0.0%) | 0 (0.0%) |
| High School Diploma | 54 (88.5%) | 7 (11.5%) |
| College/Associate Degree | 11 (100.0%) | 0 (0.0%) |
| Bachelor's Degree or higher | 0 (0.0%) | 0 (0.0%) |
Occupancy by Age of Householder in Greenview
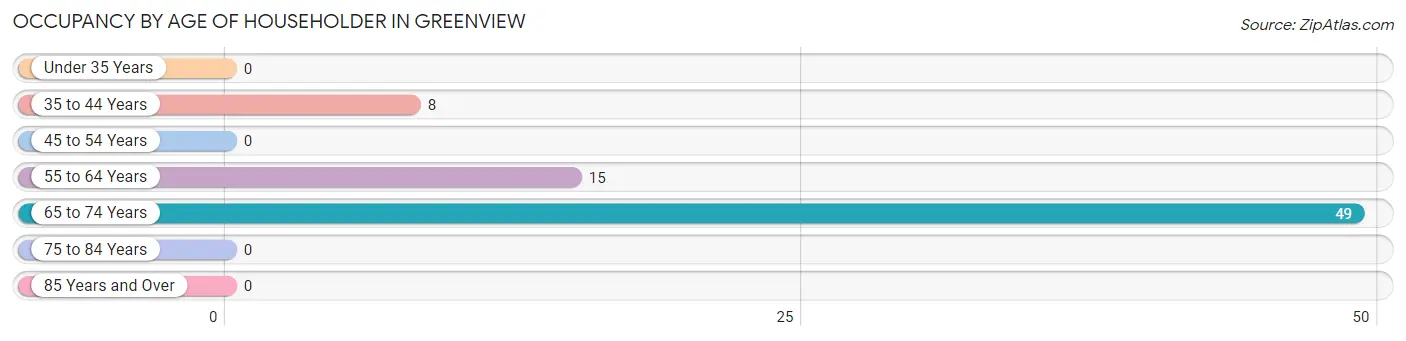
| Age Bracket | # Households | % Households |
| Under 35 Years | 0 | 0.0% |
| 35 to 44 Years | 8 | 11.1% |
| 45 to 54 Years | 0 | 0.0% |
| 55 to 64 Years | 15 | 20.8% |
| 65 to 74 Years | 49 | 68.1% |
| 75 to 84 Years | 0 | 0.0% |
| 85 Years and Over | 0 | 0.0% |
| Total | 72 | 100.0% |
Housing Finances in Greenview
Median Income by Occupancy in Greenview
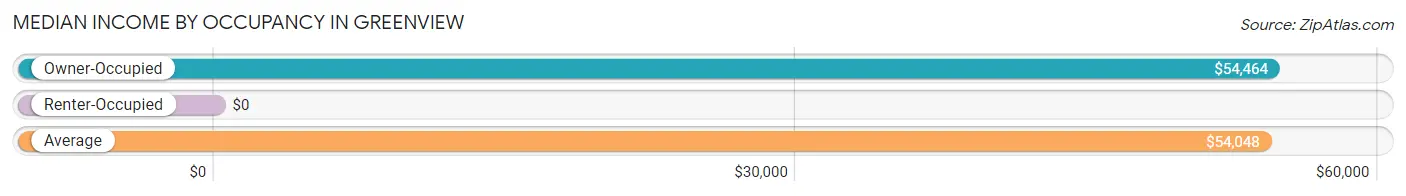
| Occupancy Type | # Households | Median Income |
| Owner-Occupied | 65 (90.3%) | $54,464 |
| Renter-Occupied | 7 (9.7%) | $0 |
| Average | 72 (100.0%) | $54,048 |
Occupancy by Householder Income Bracket in Greenview
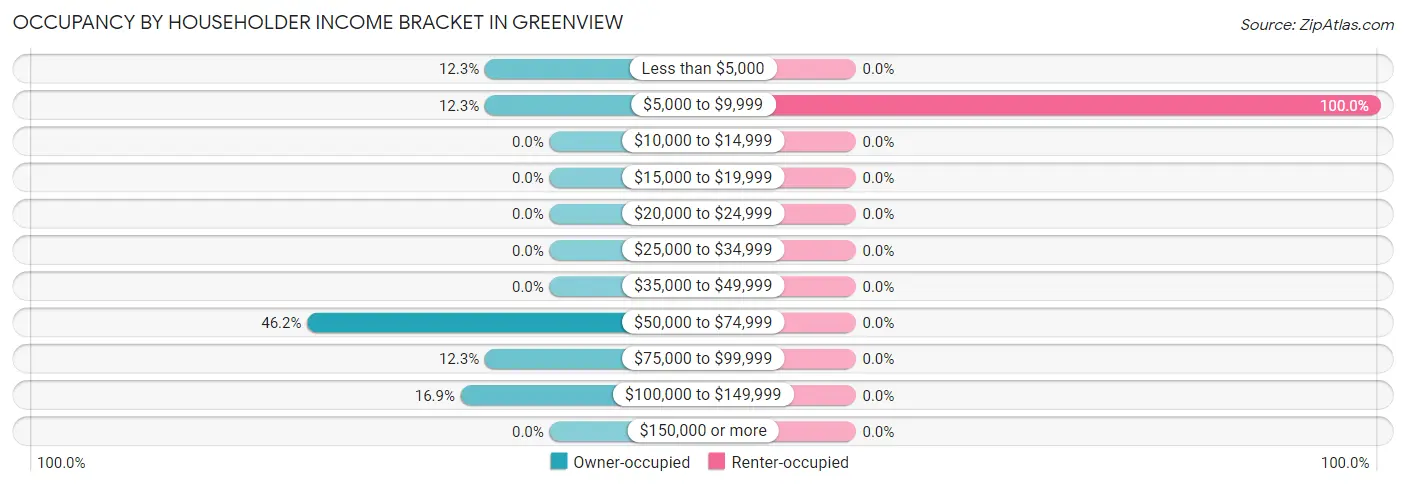
| Income Bracket | Owner-occupied | Renter-occupied |
| Less than $5,000 | 8 (12.3%) | 0 (0.0%) |
| $5,000 to $9,999 | 8 (12.3%) | 7 (100.0%) |
| $10,000 to $14,999 | 0 (0.0%) | 0 (0.0%) |
| $15,000 to $19,999 | 0 (0.0%) | 0 (0.0%) |
| $20,000 to $24,999 | 0 (0.0%) | 0 (0.0%) |
| $25,000 to $34,999 | 0 (0.0%) | 0 (0.0%) |
| $35,000 to $49,999 | 0 (0.0%) | 0 (0.0%) |
| $50,000 to $74,999 | 30 (46.2%) | 0 (0.0%) |
| $75,000 to $99,999 | 8 (12.3%) | 0 (0.0%) |
| $100,000 to $149,999 | 11 (16.9%) | 0 (0.0%) |
| $150,000 or more | 0 (0.0%) | 0 (0.0%) |
| Total | 65 (100.0%) | 7 (100.0%) |
Monthly Housing Cost Tiers in Greenview
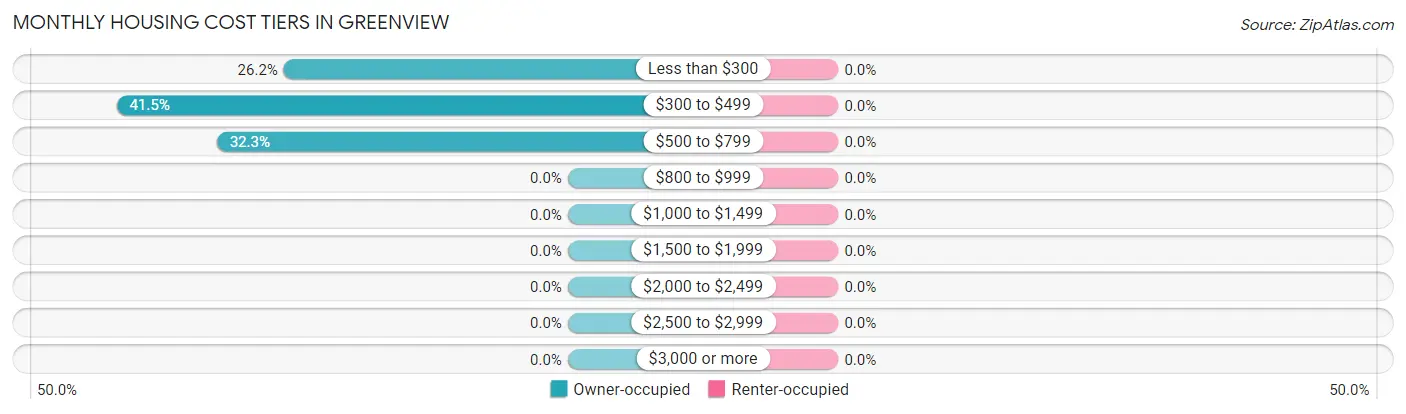
| Monthly Cost | Owner-occupied | Renter-occupied |
| Less than $300 | 17 (26.2%) | 0 (0.0%) |
| $300 to $499 | 27 (41.5%) | 0 (0.0%) |
| $500 to $799 | 21 (32.3%) | 0 (0.0%) |
| $800 to $999 | 0 (0.0%) | 0 (0.0%) |
| $1,000 to $1,499 | 0 (0.0%) | 0 (0.0%) |
| $1,500 to $1,999 | 0 (0.0%) | 0 (0.0%) |
| $2,000 to $2,499 | 0 (0.0%) | 0 (0.0%) |
| $2,500 to $2,999 | 0 (0.0%) | 0 (0.0%) |
| $3,000 or more | 0 (0.0%) | 0 (0.0%) |
| Total | 65 (100.0%) | 7 (100.0%) |
Physical Housing Characteristics in Greenview
Housing Structures in Greenview
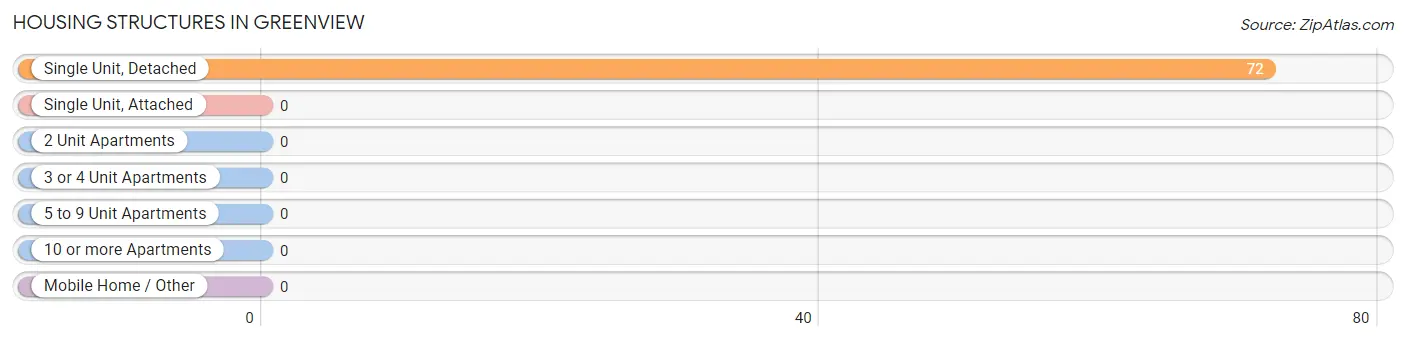
| Structure Type | # Housing Units | % Housing Units |
| Single Unit, Detached | 72 | 100.0% |
| Single Unit, Attached | 0 | 0.0% |
| 2 Unit Apartments | 0 | 0.0% |
| 3 or 4 Unit Apartments | 0 | 0.0% |
| 5 to 9 Unit Apartments | 0 | 0.0% |
| 10 or more Apartments | 0 | 0.0% |
| Mobile Home / Other | 0 | 0.0% |
| Total | 72 | 100.0% |
Housing Structures by Occupancy in Greenview
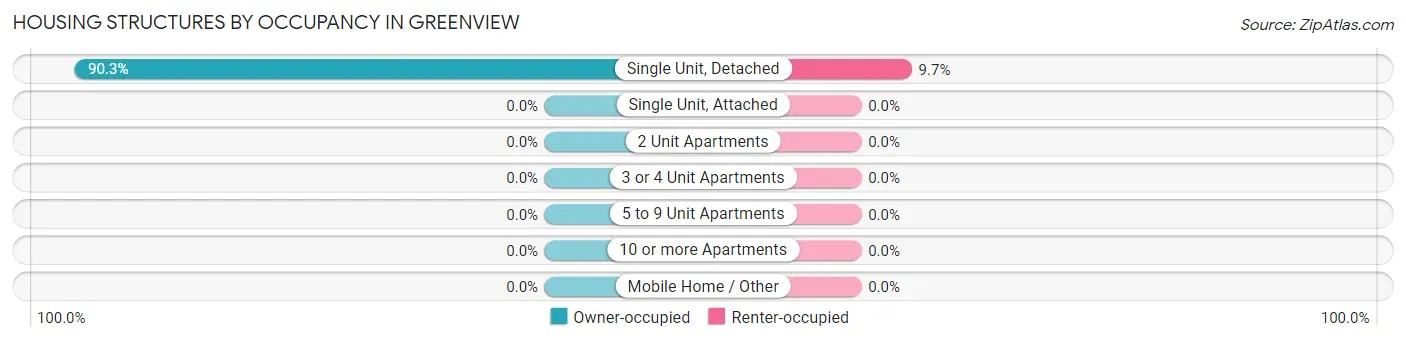
| Structure Type | Owner-occupied | Renter-occupied |
| Single Unit, Detached | 65 (90.3%) | 7 (9.7%) |
| Single Unit, Attached | 0 (0.0%) | 0 (0.0%) |
| 2 Unit Apartments | 0 (0.0%) | 0 (0.0%) |
| 3 or 4 Unit Apartments | 0 (0.0%) | 0 (0.0%) |
| 5 to 9 Unit Apartments | 0 (0.0%) | 0 (0.0%) |
| 10 or more Apartments | 0 (0.0%) | 0 (0.0%) |
| Mobile Home / Other | 0 (0.0%) | 0 (0.0%) |
| Total | 65 (90.3%) | 7 (9.7%) |
Housing Structures by Number of Rooms in Greenview
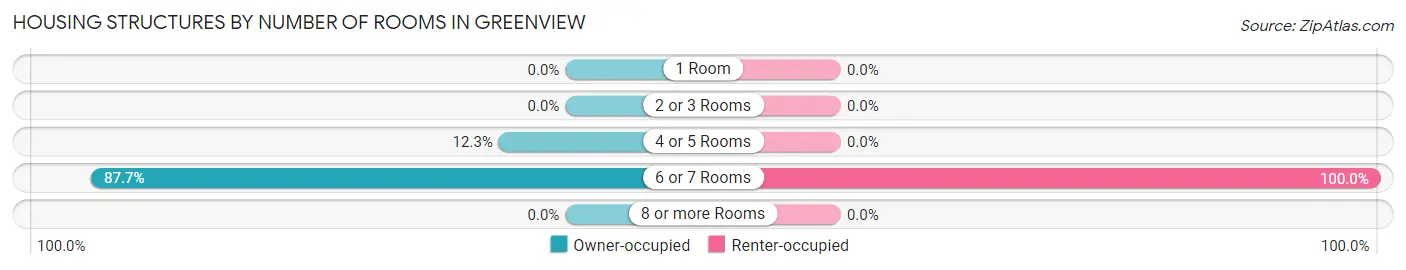
| Number of Rooms | Owner-occupied | Renter-occupied |
| 1 Room | 0 (0.0%) | 0 (0.0%) |
| 2 or 3 Rooms | 0 (0.0%) | 0 (0.0%) |
| 4 or 5 Rooms | 8 (12.3%) | 0 (0.0%) |
| 6 or 7 Rooms | 57 (87.7%) | 7 (100.0%) |
| 8 or more Rooms | 0 (0.0%) | 0 (0.0%) |
| Total | 65 (100.0%) | 7 (100.0%) |
Housing Structure by Heating Type in Greenview
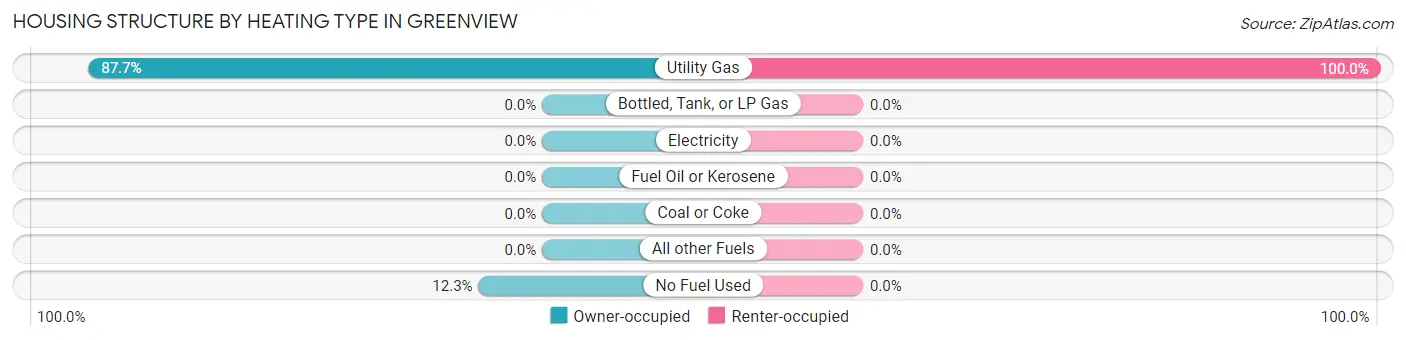
| Heating Type | Owner-occupied | Renter-occupied |
| Utility Gas | 57 (87.7%) | 7 (100.0%) |
| Bottled, Tank, or LP Gas | 0 (0.0%) | 0 (0.0%) |
| Electricity | 0 (0.0%) | 0 (0.0%) |
| Fuel Oil or Kerosene | 0 (0.0%) | 0 (0.0%) |
| Coal or Coke | 0 (0.0%) | 0 (0.0%) |
| All other Fuels | 0 (0.0%) | 0 (0.0%) |
| No Fuel Used | 8 (12.3%) | 0 (0.0%) |
| Total | 65 (100.0%) | 7 (100.0%) |
Household Vehicle Usage in Greenview
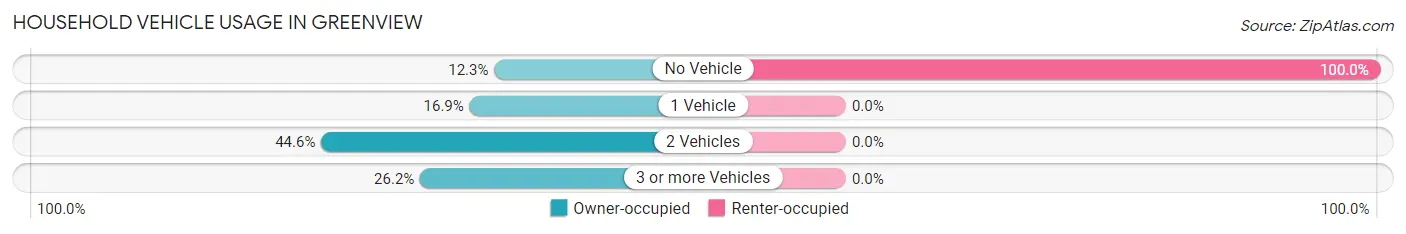
| Vehicles per Household | Owner-occupied | Renter-occupied |
| No Vehicle | 8 (12.3%) | 7 (100.0%) |
| 1 Vehicle | 11 (16.9%) | 0 (0.0%) |
| 2 Vehicles | 29 (44.6%) | 0 (0.0%) |
| 3 or more Vehicles | 17 (26.2%) | 0 (0.0%) |
| Total | 65 (100.0%) | 7 (100.0%) |
Real Estate & Mortgages in Greenview
Real Estate and Mortgage Overview in Greenview
| Characteristic | Without Mortgage | With Mortgage |
| Housing Units | 65 | 0 |
| Median Property Value | - | - |
| Median Household Income | $54,464 | $0 |
| Monthly Housing Costs | $439 | $0 |
| Real Estate Taxes | - | - |
Property Value by Mortgage Status in Greenview
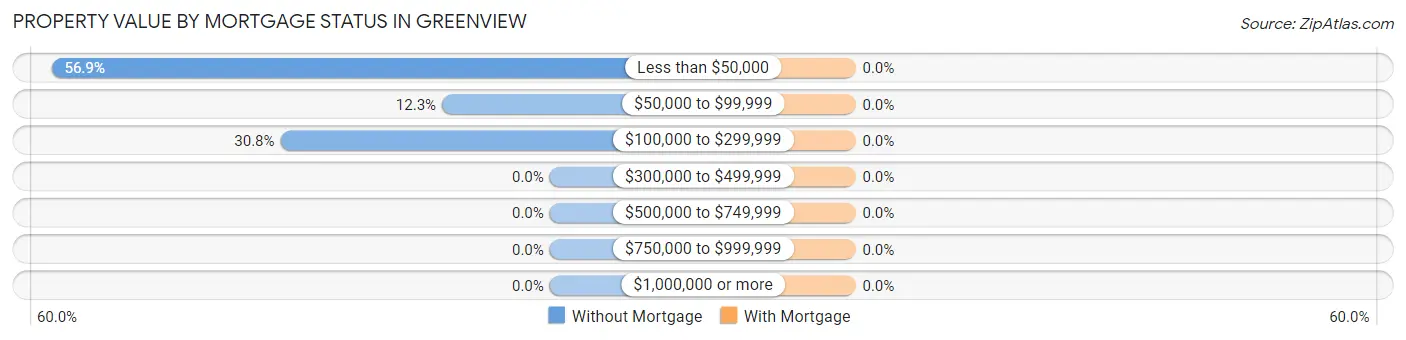
| Property Value | Without Mortgage | With Mortgage |
| Less than $50,000 | 37 (56.9%) | 0 (0.0%) |
| $50,000 to $99,999 | 8 (12.3%) | 0 (0.0%) |
| $100,000 to $299,999 | 20 (30.8%) | 0 (0.0%) |
| $300,000 to $499,999 | 0 (0.0%) | 0 (0.0%) |
| $500,000 to $749,999 | 0 (0.0%) | 0 (0.0%) |
| $750,000 to $999,999 | 0 (0.0%) | 0 (0.0%) |
| $1,000,000 or more | 0 (0.0%) | 0 (0.0%) |
| Total | 65 (100.0%) | 0 (0.0%) |
Household Income by Mortgage Status in Greenview
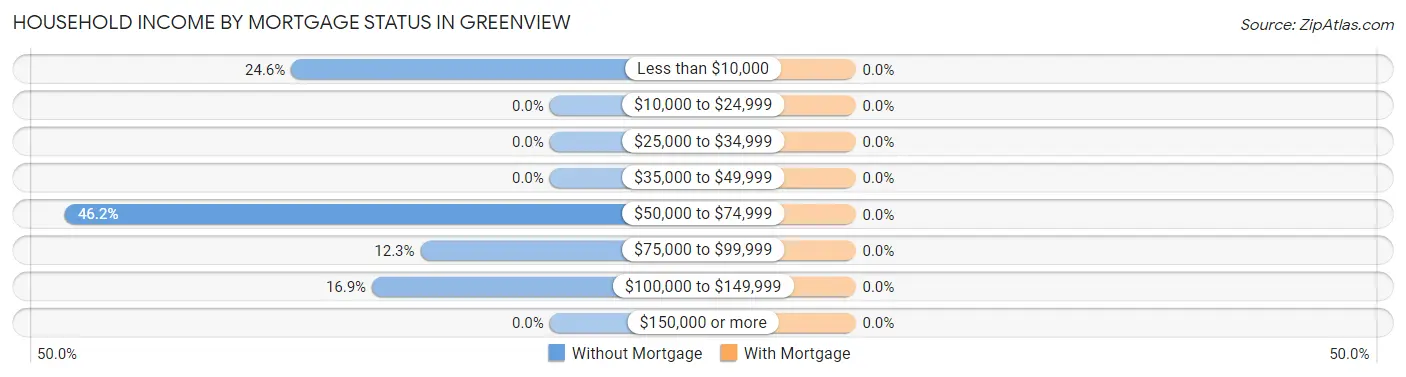
| Household Income | Without Mortgage | With Mortgage |
| Less than $10,000 | 16 (24.6%) | 0 (0.0%) |
| $10,000 to $24,999 | 0 (0.0%) | 0 (0.0%) |
| $25,000 to $34,999 | 0 (0.0%) | 0 (0.0%) |
| $35,000 to $49,999 | 0 (0.0%) | 0 (0.0%) |
| $50,000 to $74,999 | 30 (46.2%) | 0 (0.0%) |
| $75,000 to $99,999 | 8 (12.3%) | 0 (0.0%) |
| $100,000 to $149,999 | 11 (16.9%) | 0 (0.0%) |
| $150,000 or more | 0 (0.0%) | 0 (0.0%) |
| Total | 65 (100.0%) | 0 (0.0%) |
Property Value to Household Income Ratio in Greenview
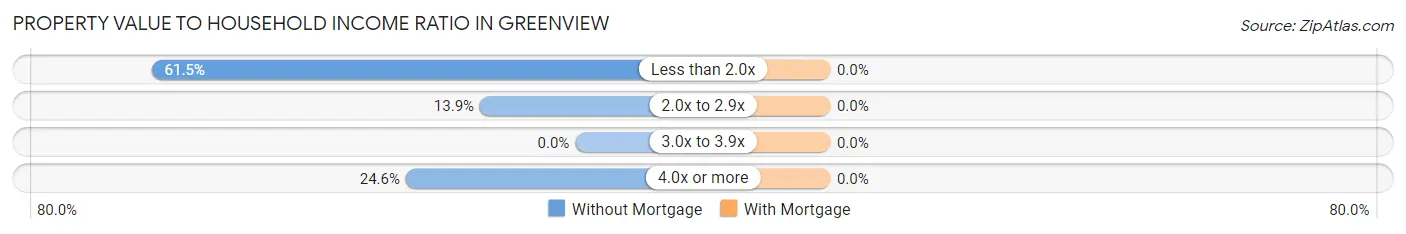
| Value-to-Income Ratio | Without Mortgage | With Mortgage |
| Less than 2.0x | 40 (61.5%) | 0 (0.0%) |
| 2.0x to 2.9x | 9 (13.9%) | 0 (0.0%) |
| 3.0x to 3.9x | 0 (0.0%) | 0 (0.0%) |
| 4.0x or more | 16 (24.6%) | 0 (0.0%) |
| Total | 65 (100.0%) | 0 (0.0%) |
Real Estate Taxes by Mortgage Status in Greenview
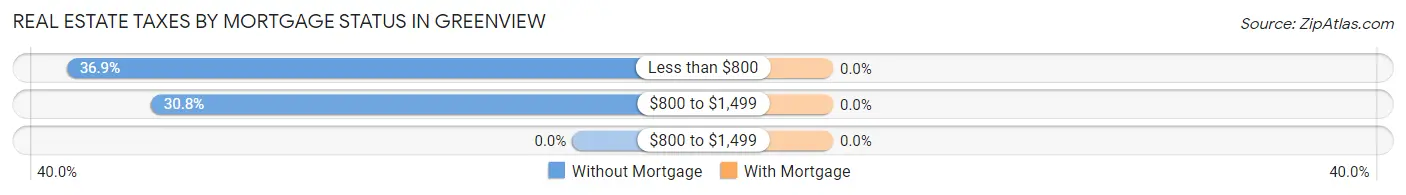
| Property Taxes | Without Mortgage | With Mortgage |
| Less than $800 | 24 (36.9%) | 0 (0.0%) |
| $800 to $1,499 | 20 (30.8%) | 0 (0.0%) |
| $800 to $1,499 | 0 (0.0%) | 0 (0.0%) |
| Total | 65 (100.0%) | 0 (0.0%) |
Health & Disability in Greenview
Health Insurance Coverage by Age in Greenview
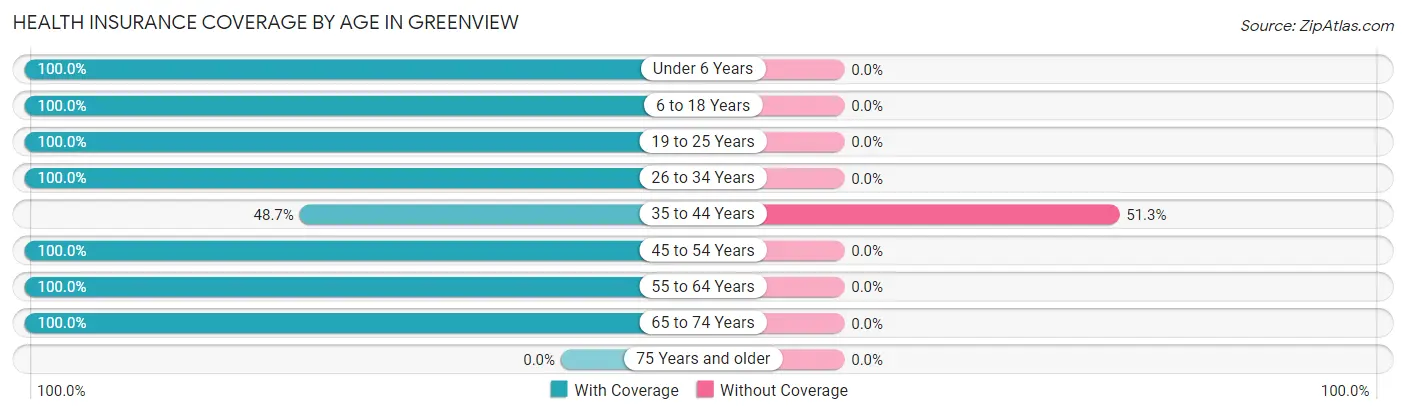
| Age Bracket | With Coverage | Without Coverage |
| Under 6 Years | 10 (100.0%) | 0 (0.0%) |
| 6 to 18 Years | 36 (100.0%) | 0 (0.0%) |
| 19 to 25 Years | 12 (100.0%) | 0 (0.0%) |
| 26 to 34 Years | 29 (100.0%) | 0 (0.0%) |
| 35 to 44 Years | 19 (48.7%) | 20 (51.3%) |
| 45 to 54 Years | 41 (100.0%) | 0 (0.0%) |
| 55 to 64 Years | 23 (100.0%) | 0 (0.0%) |
| 65 to 74 Years | 49 (100.0%) | 0 (0.0%) |
| 75 Years and older | 0 (0.0%) | 0 (0.0%) |
| Total | 219 (91.6%) | 20 (8.4%) |
Health Insurance Coverage by Citizenship Status in Greenview
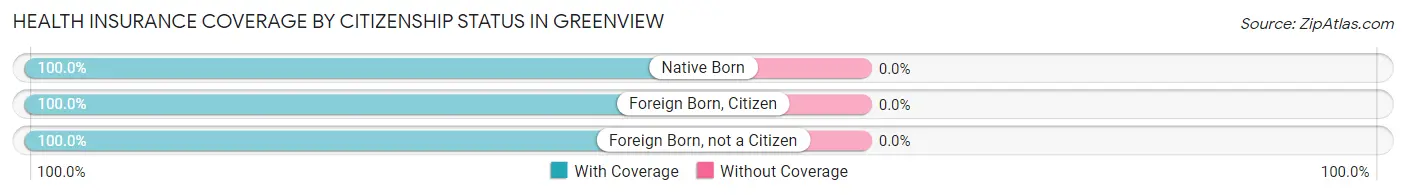
| Citizenship Status | With Coverage | Without Coverage |
| Native Born | 10 (100.0%) | 0 (0.0%) |
| Foreign Born, Citizen | 36 (100.0%) | 0 (0.0%) |
| Foreign Born, not a Citizen | 12 (100.0%) | 0 (0.0%) |
Health Insurance Coverage by Household Income in Greenview
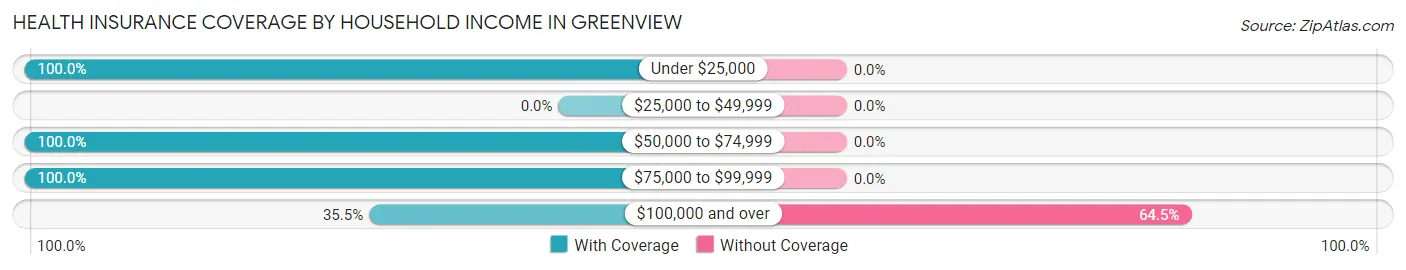
| Household Income | With Coverage | Without Coverage |
| Under $25,000 | 54 (100.0%) | 0 (0.0%) |
| $25,000 to $49,999 | 0 (0.0%) | 0 (0.0%) |
| $50,000 to $74,999 | 138 (100.0%) | 0 (0.0%) |
| $75,000 to $99,999 | 16 (100.0%) | 0 (0.0%) |
| $100,000 and over | 11 (35.5%) | 20 (64.5%) |
Public vs Private Health Insurance Coverage by Age in Greenview
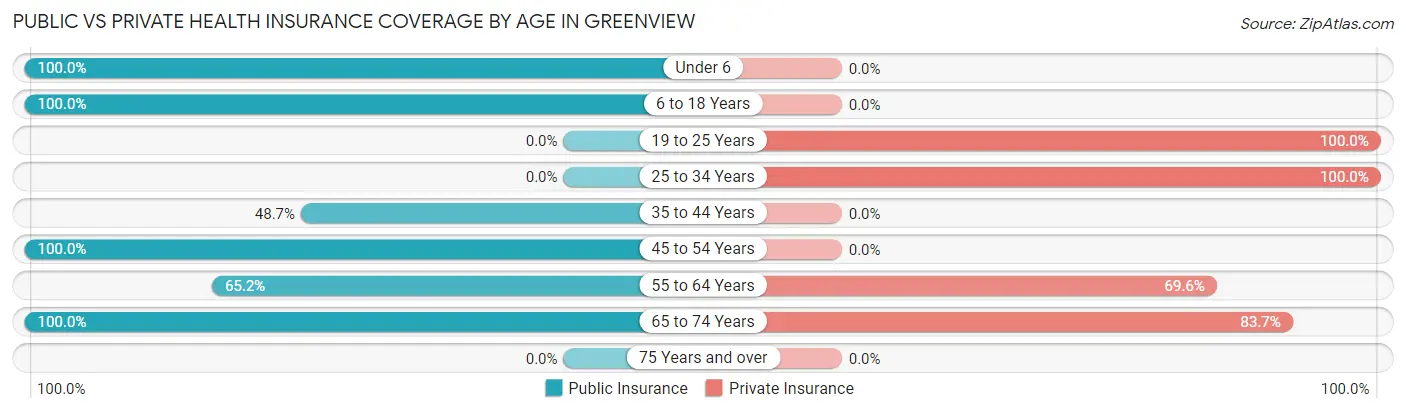
| Age Bracket | Public Insurance | Private Insurance |
| Under 6 | 10 (100.0%) | 0 (0.0%) |
| 6 to 18 Years | 36 (100.0%) | 0 (0.0%) |
| 19 to 25 Years | 0 (0.0%) | 12 (100.0%) |
| 25 to 34 Years | 0 (0.0%) | 29 (100.0%) |
| 35 to 44 Years | 19 (48.7%) | 0 (0.0%) |
| 45 to 54 Years | 41 (100.0%) | 0 (0.0%) |
| 55 to 64 Years | 15 (65.2%) | 16 (69.6%) |
| 65 to 74 Years | 49 (100.0%) | 41 (83.7%) |
| 75 Years and over | 0 (0.0%) | 0 (0.0%) |
| Total | 170 (71.1%) | 98 (41.0%) |
Disability Status by Sex by Age in Greenview
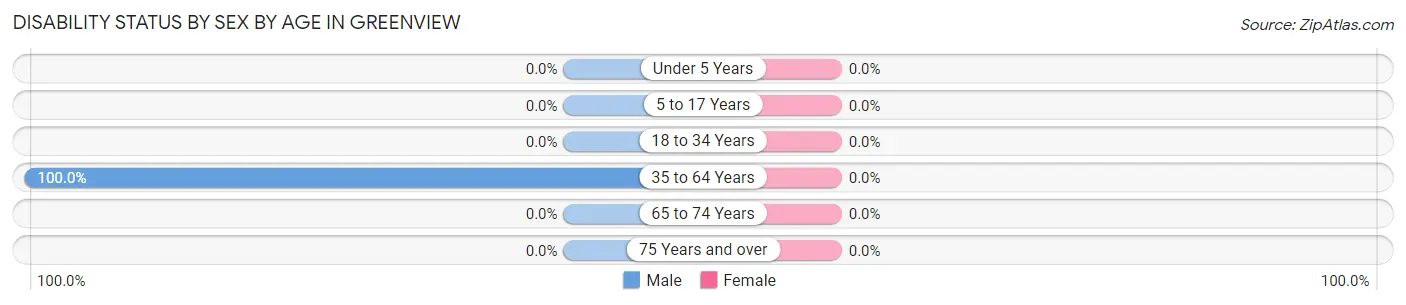
| Age Bracket | Male | Female |
| Under 5 Years | 0 (0.0%) | 0 (0.0%) |
| 5 to 17 Years | 0 (0.0%) | 0 (0.0%) |
| 18 to 34 Years | 0 (0.0%) | 0 (0.0%) |
| 35 to 64 Years | 43 (100.0%) | 0 (0.0%) |
| 65 to 74 Years | 0 (0.0%) | 0 (0.0%) |
| 75 Years and over | 0 (0.0%) | 0 (0.0%) |
Disability Class by Sex by Age in Greenview
Disability Class: Hearing Difficulty
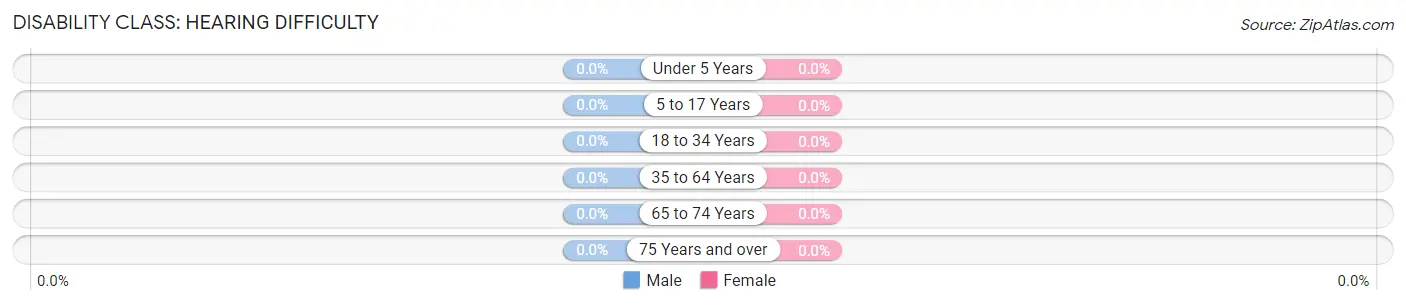
| Age Bracket | Male | Female |
| Under 5 Years | 0 (0.0%) | 0 (0.0%) |
| 5 to 17 Years | 0 (0.0%) | 0 (0.0%) |
| 18 to 34 Years | 0 (0.0%) | 0 (0.0%) |
| 35 to 64 Years | 0 (0.0%) | 0 (0.0%) |
| 65 to 74 Years | 0 (0.0%) | 0 (0.0%) |
| 75 Years and over | 0 (0.0%) | 0 (0.0%) |
Disability Class: Vision Difficulty
| Age Bracket | Male | Female |
| Under 5 Years | 0 (0.0%) | 0 (0.0%) |
| 5 to 17 Years | 0 (0.0%) | 0 (0.0%) |
| 18 to 34 Years | 0 (0.0%) | 0 (0.0%) |
| 35 to 64 Years | 0 (0.0%) | 0 (0.0%) |
| 65 to 74 Years | 0 (0.0%) | 0 (0.0%) |
| 75 Years and over | 0 (0.0%) | 0 (0.0%) |
Disability Class: Cognitive Difficulty
| Age Bracket | Male | Female |
| 5 to 17 Years | 0 (0.0%) | 0 (0.0%) |
| 18 to 34 Years | 0 (0.0%) | 0 (0.0%) |
| 35 to 64 Years | 8 (18.6%) | 0 (0.0%) |
| 65 to 74 Years | 0 (0.0%) | 0 (0.0%) |
| 75 Years and over | 0 (0.0%) | 0 (0.0%) |
Disability Class: Ambulatory Difficulty
| Age Bracket | Male | Female |
| 5 to 17 Years | 0 (0.0%) | 0 (0.0%) |
| 18 to 34 Years | 0 (0.0%) | 0 (0.0%) |
| 35 to 64 Years | 43 (100.0%) | 0 (0.0%) |
| 65 to 74 Years | 0 (0.0%) | 0 (0.0%) |
| 75 Years and over | 0 (0.0%) | 0 (0.0%) |
Disability Class: Self-Care Difficulty
| Age Bracket | Male | Female |
| 5 to 17 Years | 0 (0.0%) | 0 (0.0%) |
| 18 to 34 Years | 0 (0.0%) | 0 (0.0%) |
| 35 to 64 Years | 0 (0.0%) | 0 (0.0%) |
| 65 to 74 Years | 0 (0.0%) | 0 (0.0%) |
| 75 Years and over | 0 (0.0%) | 0 (0.0%) |
Technology Access in Greenview
Computing Device Access in Greenview
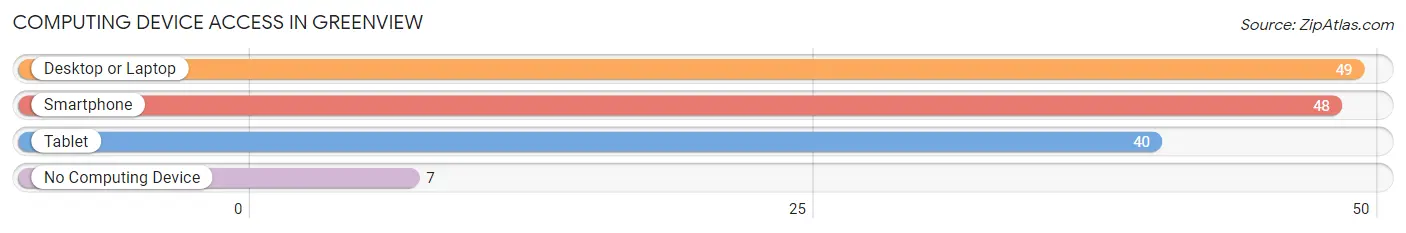
| Device Type | # Households | % Households |
| Desktop or Laptop | 49 | 68.1% |
| Smartphone | 48 | 66.7% |
| Tablet | 40 | 55.6% |
| No Computing Device | 7 | 9.7% |
| Total | 72 | 100.0% |
Internet Access in Greenview
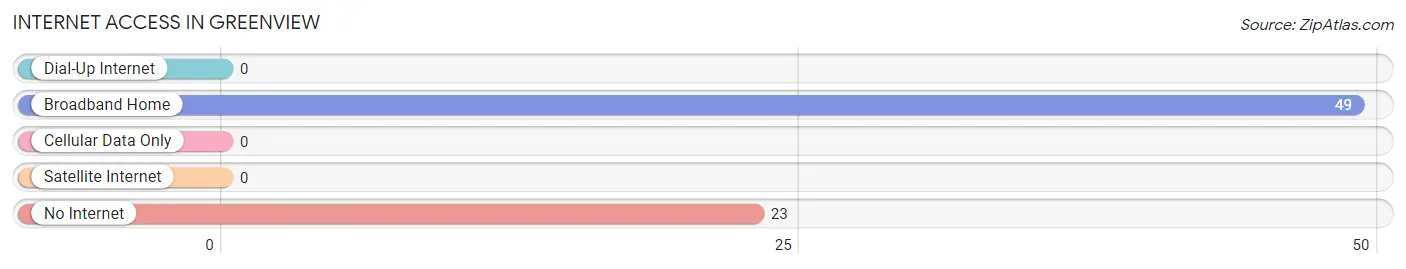
| Internet Type | # Households | % Households |
| Dial-Up Internet | 0 | 0.0% |
| Broadband Home | 49 | 68.1% |
| Cellular Data Only | 0 | 0.0% |
| Satellite Internet | 0 | 0.0% |
| No Internet | 23 | 31.9% |
| Total | 72 | 100.0% |
Greenview Summary
Greenview, West Virginia is a small town located in the eastern part of the state, in the Appalachian Mountains. It is situated in the county of Greenbrier, and is part of the Lewisburg, WV Micropolitan Statistical Area. The town has a population of just over 1,000 people, and is known for its rural charm and scenic beauty.
History
Greenview was first settled in the late 1700s by a group of settlers from Pennsylvania. The town was originally known as “Greenbrier”, after the nearby river. The town was officially incorporated in 1872, and was named after the nearby Greenbrier River.
The town was a popular destination for tourists in the late 1800s and early 1900s, due to its proximity to the Greenbrier River and the nearby mountains. The town was also home to a number of resorts, including the Greenbrier Hotel, which was built in 1858 and is still in operation today.
Geography
Greenview is located in the eastern part of West Virginia, in the Appalachian Mountains. The town is situated in the county of Greenbrier, and is part of the Lewisburg, WV Micropolitan Statistical Area. The town is located at an elevation of 1,845 feet above sea level.
The town is surrounded by a number of small towns and villages, including White Sulphur Springs, Alderson, and Ronceverte. The town is also located near the Greenbrier River, which is a popular destination for fishing and other outdoor activities.
Economy
Greenview’s economy is largely based on tourism and agriculture. The town is home to a number of resorts, including the Greenbrier Hotel, which is a popular destination for tourists. The town is also home to a number of small businesses, including restaurants, shops, and other services.
The town is also home to a number of farms, which produce a variety of crops, including corn, soybeans, and hay. The town is also home to a number of small manufacturing businesses, which produce a variety of products, including furniture, clothing, and other items.
Demographics
As of the 2010 census, the population of Greenview was 1,072. The town has a population that is predominantly white, with a small percentage of African Americans and other minorities. The median household income in the town is $35,000, and the median age is 44.
The town is home to a number of churches, including the Greenview United Methodist Church, the Greenview Baptist Church, and the Greenview Presbyterian Church. The town is also home to a number of schools, including the Greenview Elementary School, the Greenview Middle School, and the Greenview High School.
Conclusion
Greenview, West Virginia is a small town located in the eastern part of the state, in the Appalachian Mountains. The town has a population of just over 1,000 people, and is known for its rural charm and scenic beauty. The town’s economy is largely based on tourism and agriculture, and the town is home to a number of resorts, small businesses, and farms. The town is predominantly white, with a small percentage of African Americans and other minorities. The town is home to a number of churches and schools, and is a popular destination for tourists and outdoor enthusiasts.
Common Questions
What is Per Capita Income in Greenview?
Per Capita income in Greenview is $21,914.
What is the Median Household income in Greenview?
Median Household Income in Greenview is $54,048.
What is Inequality or Gini Index in Greenview?
Inequality or Gini Index in Greenview is 0.43.
What is the Total Population of Greenview?
Total Population of Greenview is 239.
What is the Total Male Population of Greenview?
Total Male Population of Greenview is 143.
What is the Total Female Population of Greenview?
Total Female Population of Greenview is 96.
What is the Ratio of Males per 100 Females in Greenview?
There are 148.96 Males per 100 Females in Greenview.
What is the Ratio of Females per 100 Males in Greenview?
There are 67.13 Females per 100 Males in Greenview.
What is the Median Population Age in Greenview?
Median Population Age in Greenview is 41.7 Years.
What is the Average Family Size in Greenview
Average Family Size in Greenview is 2.7 People.
What is the Average Household Size in Greenview
Average Household Size in Greenview is 3.3 People.
How Large is the Labor Force in Greenview?
There are 69 People in the Labor Forcein in Greenview.
What is the Percentage of People in the Labor Force in Greenview?
35.8% of People are in the Labor Force in Greenview.