Piney View, WV Map & Demographics
Piney View Map
Piney View Overview
$34,937
PER CAPITA INCOME
$90,425
AVG FAMILY INCOME
$39,781
AVG HOUSEHOLD INCOME
10.2%
WAGE / INCOME GAP [ % ]
89.8¢/ $1
WAGE / INCOME GAP [ $ ]
0.49
INEQUALITY / GINI INDEX
708
TOTAL POPULATION
361
MALE POPULATION
347
FEMALE POPULATION
104.03
MALES / 100 FEMALES
96.12
FEMALES / 100 MALES
58.3
MEDIAN AGE
2.7
AVG FAMILY SIZE
2.0
AVG HOUSEHOLD SIZE
270
LABOR FORCE [ PEOPLE ]
46.7%
PERCENT IN LABOR FORCE
3.7%
UNEMPLOYMENT RATE
Piney View Area Codes
Income in Piney View
Income Overview in Piney View
Per Capita Income in Piney View is $34,937, while median incomes of families and households are $90,425 and $39,781 respectively.
| Characteristic | Number | Measure |
| Per Capita Income | 708 | $34,937 |
| Median Family Income | 201 | $90,425 |
| Mean Family Income | 201 | $81,015 |
| Median Household Income | 354 | $39,781 |
| Mean Household Income | 354 | $66,563 |
| Income Deficit | 201 | $0 |
| Wage / Income Gap (%) | 708 | 10.21% |
| Wage / Income Gap ($) | 708 | 89.79¢ per $1 |
| Gini / Inequality Index | 708 | 0.49 |
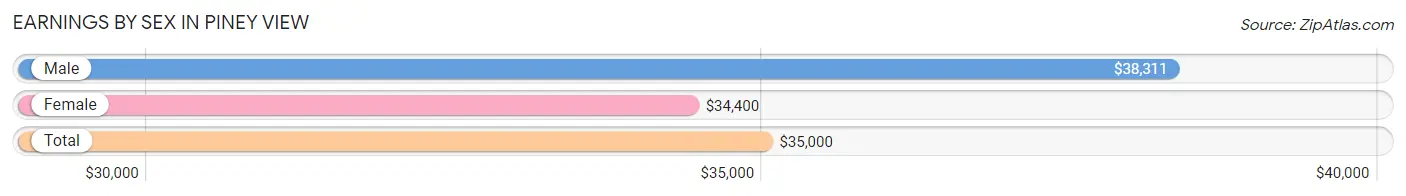
Earnings by Sex in Piney View
Average Earnings in Piney View are $35,000, $38,311 for men and $34,400 for women, a difference of 10.2%.
| Sex | Number | Average Earnings |
| Male | 124 (43.1%) | $38,311 |
| Female | 164 (56.9%) | $34,400 |
| Total | 288 (100.0%) | $35,000 |
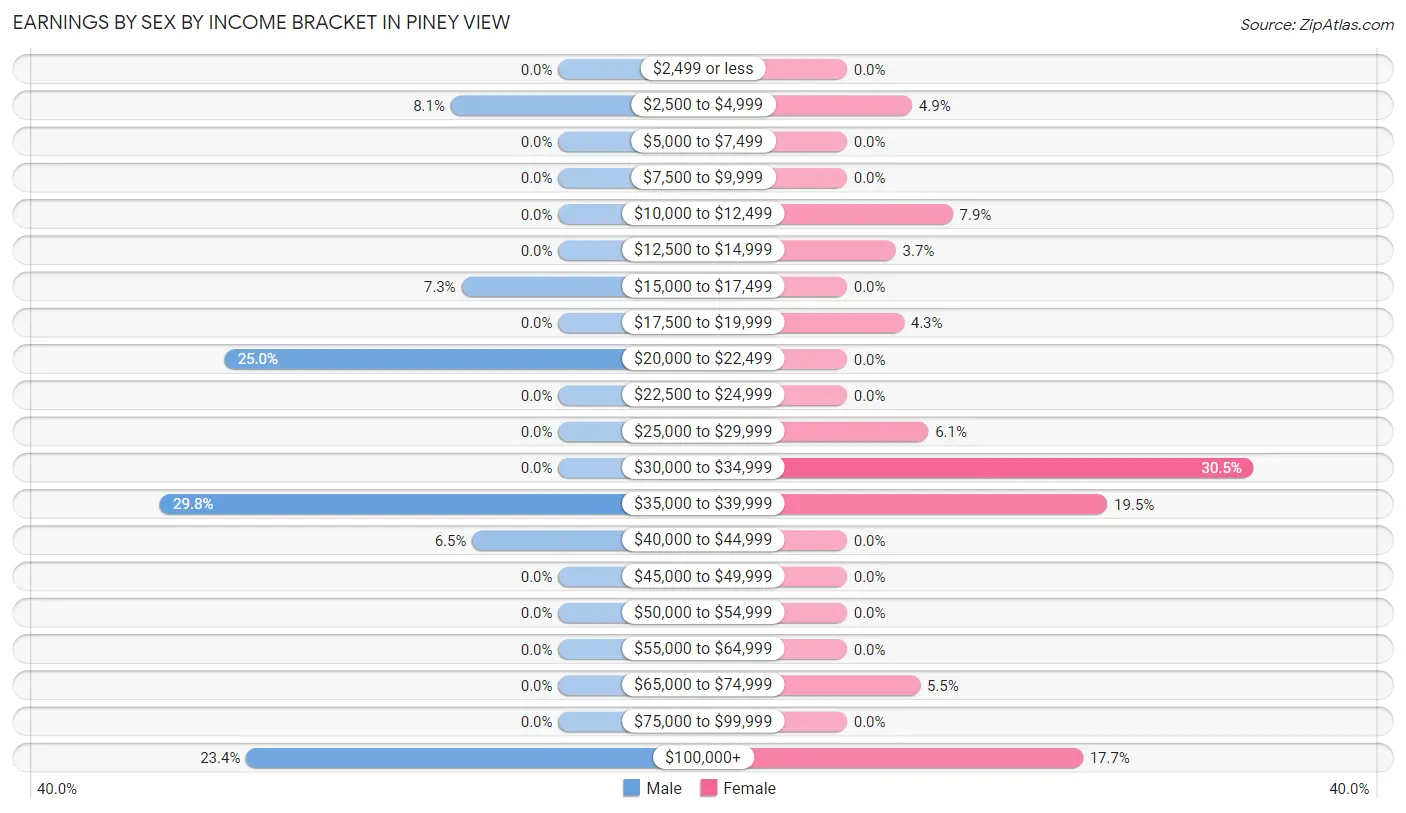
Earnings by Sex by Income Bracket in Piney View
The most common earnings brackets in Piney View are $35,000 to $39,999 for men (37 | 29.8%) and $30,000 to $34,999 for women (50 | 30.5%).
| Income | Male | Female |
| $2,499 or less | 0 (0.0%) | 0 (0.0%) |
| $2,500 to $4,999 | 10 (8.1%) | 8 (4.9%) |
| $5,000 to $7,499 | 0 (0.0%) | 0 (0.0%) |
| $7,500 to $9,999 | 0 (0.0%) | 0 (0.0%) |
| $10,000 to $12,499 | 0 (0.0%) | 13 (7.9%) |
| $12,500 to $14,999 | 0 (0.0%) | 6 (3.7%) |
| $15,000 to $17,499 | 9 (7.3%) | 0 (0.0%) |
| $17,500 to $19,999 | 0 (0.0%) | 7 (4.3%) |
| $20,000 to $22,499 | 31 (25.0%) | 0 (0.0%) |
| $22,500 to $24,999 | 0 (0.0%) | 0 (0.0%) |
| $25,000 to $29,999 | 0 (0.0%) | 10 (6.1%) |
| $30,000 to $34,999 | 0 (0.0%) | 50 (30.5%) |
| $35,000 to $39,999 | 37 (29.8%) | 32 (19.5%) |
| $40,000 to $44,999 | 8 (6.5%) | 0 (0.0%) |
| $45,000 to $49,999 | 0 (0.0%) | 0 (0.0%) |
| $50,000 to $54,999 | 0 (0.0%) | 0 (0.0%) |
| $55,000 to $64,999 | 0 (0.0%) | 0 (0.0%) |
| $65,000 to $74,999 | 0 (0.0%) | 9 (5.5%) |
| $75,000 to $99,999 | 0 (0.0%) | 0 (0.0%) |
| $100,000+ | 29 (23.4%) | 29 (17.7%) |
| Total | 124 (100.0%) | 164 (100.0%) |
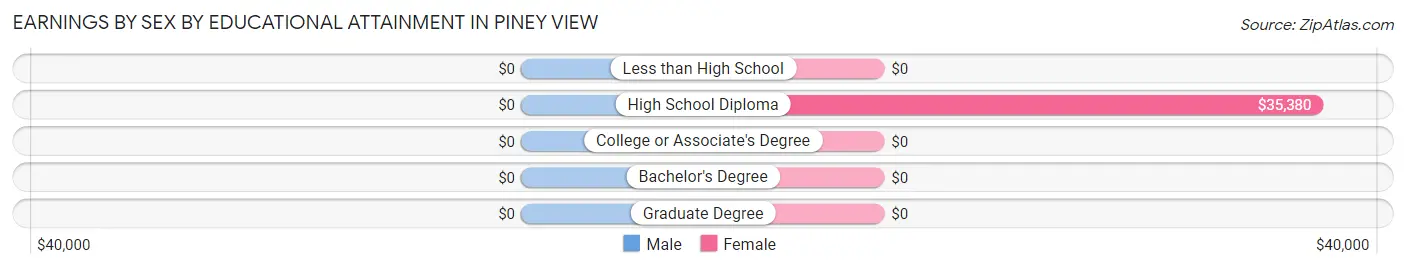
Earnings by Sex by Educational Attainment in Piney View
| Educational Attainment | Male Income | Female Income |
| Less than High School | - | - |
| High School Diploma | - | - |
| College or Associate's Degree | - | - |
| Bachelor's Degree | - | - |
| Graduate Degree | - | - |
| Total | $38,615 | $34,925 |
Family Income in Piney View
Family Income Brackets in Piney View
According to the Piney View family income data, there are 50 families falling into the $75,000 to $99,999 income range, which is the most common income bracket and makes up 24.9% of all families.
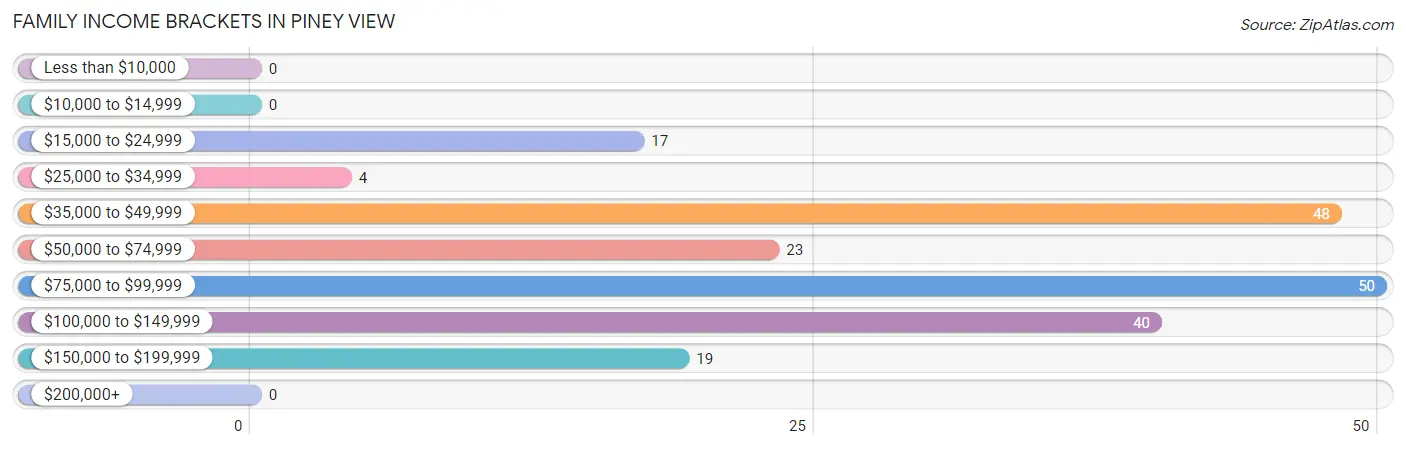
| Income Bracket | # Families | % Families |
| Less than $10,000 | 0 | 0.0% |
| $10,000 to $14,999 | 0 | 0.0% |
| $15,000 to $24,999 | 17 | 8.5% |
| $25,000 to $34,999 | 4 | 2.0% |
| $35,000 to $49,999 | 48 | 23.9% |
| $50,000 to $74,999 | 23 | 11.4% |
| $75,000 to $99,999 | 50 | 24.9% |
| $100,000 to $149,999 | 40 | 19.9% |
| $150,000 to $199,999 | 19 | 9.5% |
| $200,000+ | 0 | 0.0% |
Family Income by Famaliy Size in Piney View
3-person families (57 | 28.4%) account for the highest median family income in Piney View with $102,543 per family, while 3-person families (57 | 28.4%) have the highest median income of $34,181 per family member.
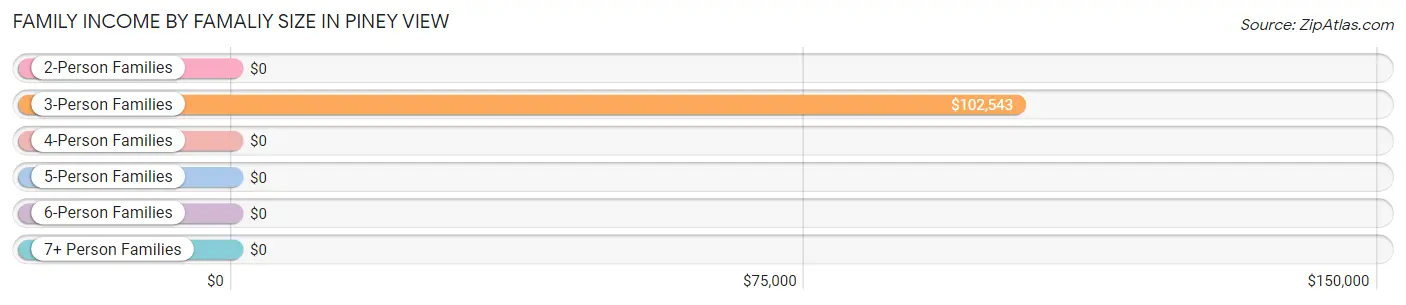
| Income Bracket | # Families | Median Income |
| 2-Person Families | 121 (60.2%) | $0 |
| 3-Person Families | 57 (28.4%) | $102,543 |
| 4-Person Families | 4 (2.0%) | $0 |
| 5-Person Families | 19 (9.5%) | $0 |
| 6-Person Families | 0 (0.0%) | $0 |
| 7+ Person Families | 0 (0.0%) | $0 |
| Total | 201 (100.0%) | $90,425 |
Family Income by Number of Earners in Piney View
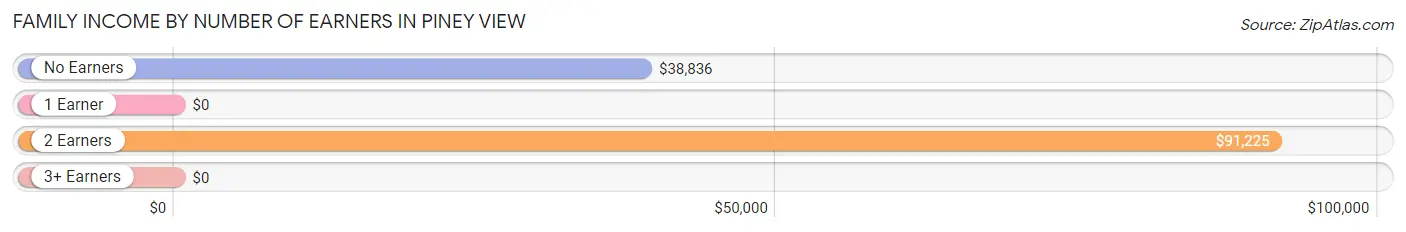
| Number of Earners | # Families | Median Income |
| No Earners | 49 (24.4%) | $38,836 |
| 1 Earner | 63 (31.3%) | $0 |
| 2 Earners | 89 (44.3%) | $91,225 |
| 3+ Earners | 0 (0.0%) | $0 |
| Total | 201 (100.0%) | $90,425 |
Household Income in Piney View
Household Income Brackets in Piney View
With 81 households falling in the category, the $15,000 to $24,999 income range is the most frequent in Piney View, accounting for 22.9% of all households.
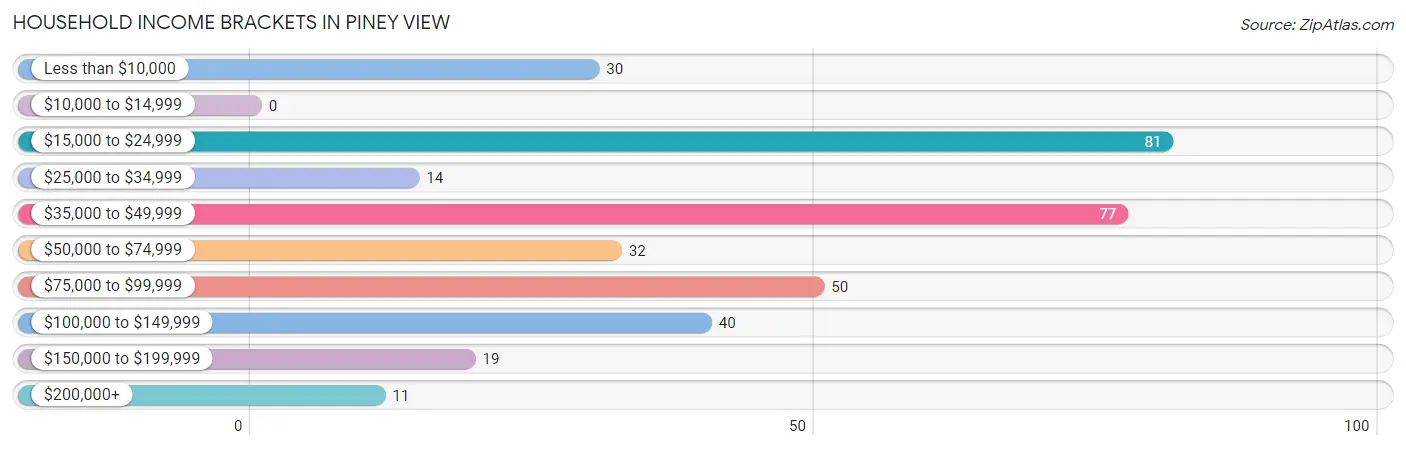
| Income Bracket | # Households | % Households |
| Less than $10,000 | 30 | 8.5% |
| $10,000 to $14,999 | 0 | 0.0% |
| $15,000 to $24,999 | 81 | 22.9% |
| $25,000 to $34,999 | 14 | 4.0% |
| $35,000 to $49,999 | 77 | 21.8% |
| $50,000 to $74,999 | 32 | 9.0% |
| $75,000 to $99,999 | 50 | 14.1% |
| $100,000 to $149,999 | 40 | 11.3% |
| $150,000 to $199,999 | 19 | 5.4% |
| $200,000+ | 11 | 3.1% |
Household Income by Householder Age in Piney View
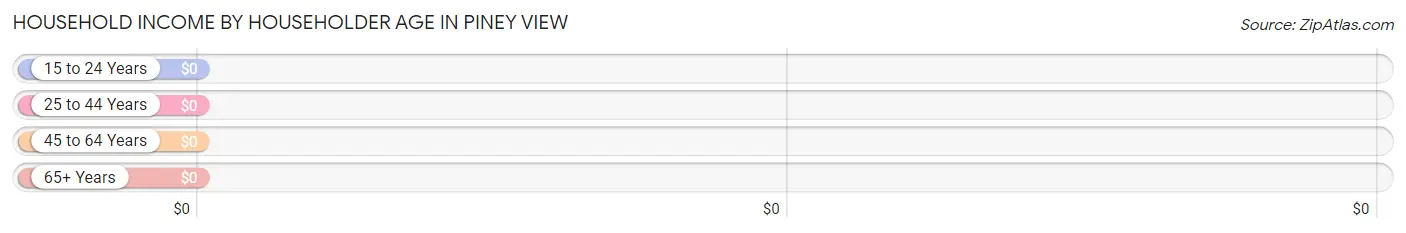
| Income Bracket | # Households | Median Income |
| 15 to 24 Years | 8 (2.3%) | $0 |
| 25 to 44 Years | 59 (16.7%) | $0 |
| 45 to 64 Years | 105 (29.7%) | $0 |
| 65+ Years | 182 (51.4%) | $0 |
| Total | 354 (100.0%) | $39,781 |
Poverty in Piney View
Income Below Poverty by Sex and Age in Piney View
With 13.6% poverty level for males and 8.1% for females among the residents of Piney View, 18 to 24 year old males and under 5 year old females are the most vulnerable to poverty, with 9 males (100.0%) and 11 females (100.0%) in their respective age groups living below the poverty level.
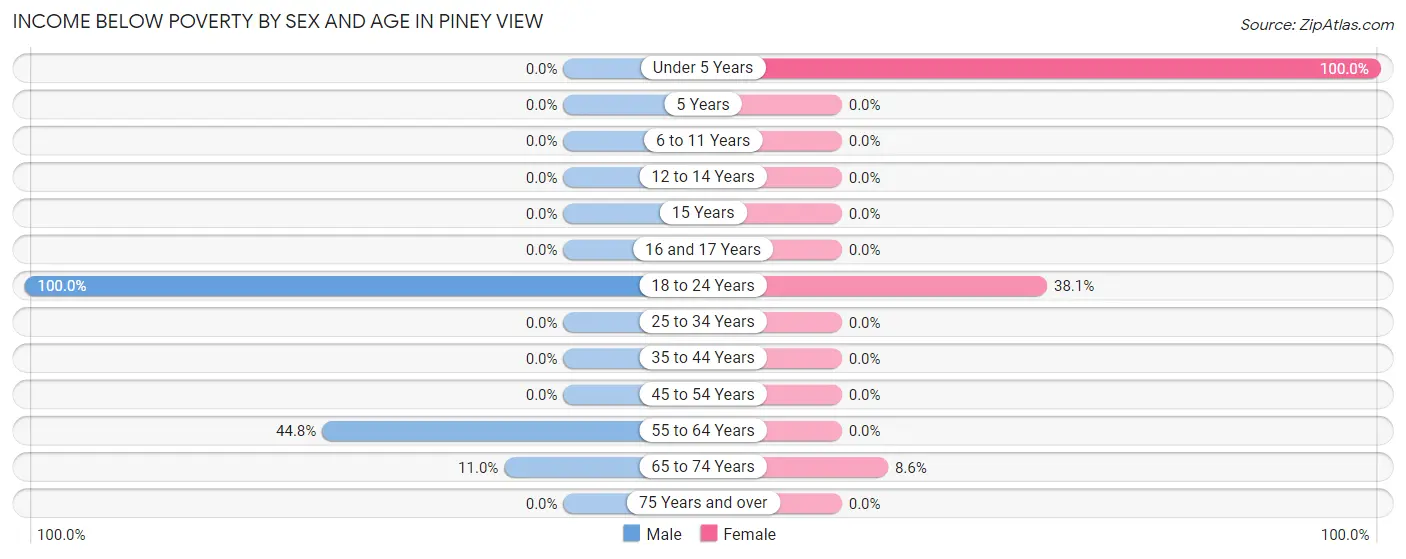
| Age Bracket | Male | Female |
| Under 5 Years | 0 (0.0%) | 11 (100.0%) |
| 5 Years | 0 (0.0%) | 0 (0.0%) |
| 6 to 11 Years | 0 (0.0%) | 0 (0.0%) |
| 12 to 14 Years | 0 (0.0%) | 0 (0.0%) |
| 15 Years | 0 (0.0%) | 0 (0.0%) |
| 16 and 17 Years | 0 (0.0%) | 0 (0.0%) |
| 18 to 24 Years | 9 (100.0%) | 8 (38.1%) |
| 25 to 34 Years | 0 (0.0%) | 0 (0.0%) |
| 35 to 44 Years | 0 (0.0%) | 0 (0.0%) |
| 45 to 54 Years | 0 (0.0%) | 0 (0.0%) |
| 55 to 64 Years | 30 (44.8%) | 0 (0.0%) |
| 65 to 74 Years | 10 (11.0%) | 9 (8.6%) |
| 75 Years and over | 0 (0.0%) | 0 (0.0%) |
| Total | 49 (13.6%) | 28 (8.1%) |
Income Above Poverty by Sex and Age in Piney View
According to the poverty statistics in Piney View, males aged 6 to 11 years and females aged 5 years are the age groups that are most secure financially, with 100.0% of males and 100.0% of females in these age groups living above the poverty line.
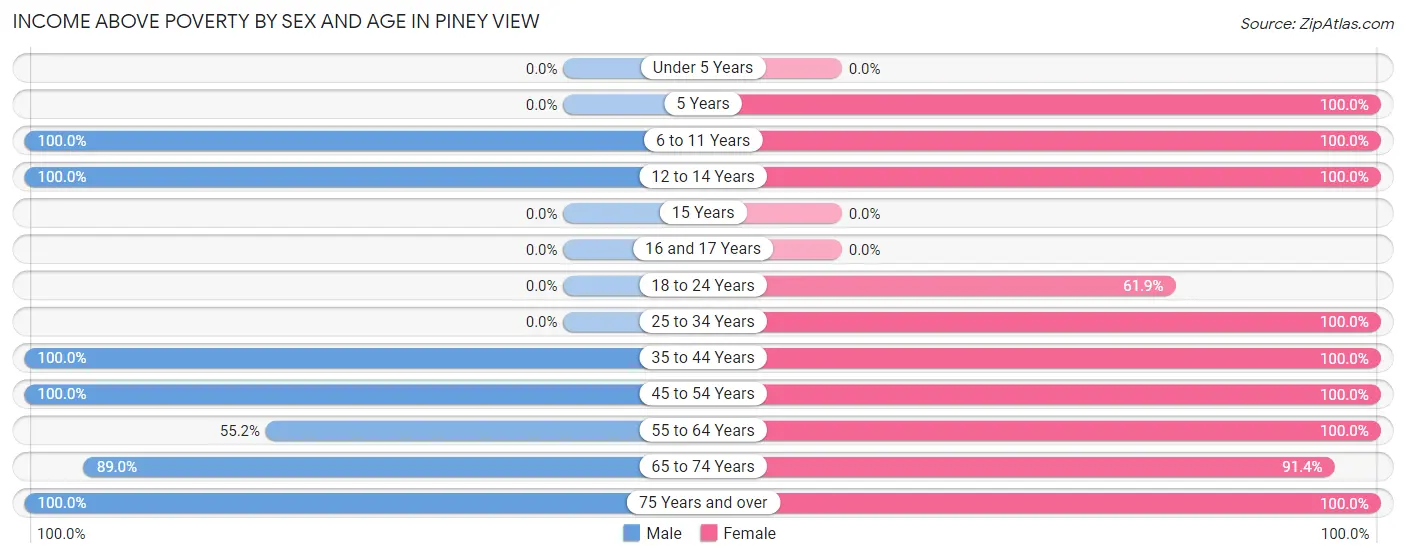
| Age Bracket | Male | Female |
| Under 5 Years | 0 (0.0%) | 0 (0.0%) |
| 5 Years | 0 (0.0%) | 52 (100.0%) |
| 6 to 11 Years | 29 (100.0%) | 24 (100.0%) |
| 12 to 14 Years | 9 (100.0%) | 5 (100.0%) |
| 15 Years | 0 (0.0%) | 0 (0.0%) |
| 16 and 17 Years | 0 (0.0%) | 0 (0.0%) |
| 18 to 24 Years | 0 (0.0%) | 13 (61.9%) |
| 25 to 34 Years | 0 (0.0%) | 35 (100.0%) |
| 35 to 44 Years | 49 (100.0%) | 40 (100.0%) |
| 45 to 54 Years | 44 (100.0%) | 23 (100.0%) |
| 55 to 64 Years | 37 (55.2%) | 18 (100.0%) |
| 65 to 74 Years | 81 (89.0%) | 96 (91.4%) |
| 75 Years and over | 63 (100.0%) | 13 (100.0%) |
| Total | 312 (86.4%) | 319 (91.9%) |
Income Below Poverty Among Married-Couple Families in Piney View
The poverty statistics for married-couple families in Piney View show that 8.6% or 17 of the total 198 families live below the poverty line. Families with 1 or 2 children have the highest poverty rate of 16.3%, comprising of 8 families. On the other hand, families with 3 or 4 children have the lowest poverty rate of 0.0%, which includes 0 families.
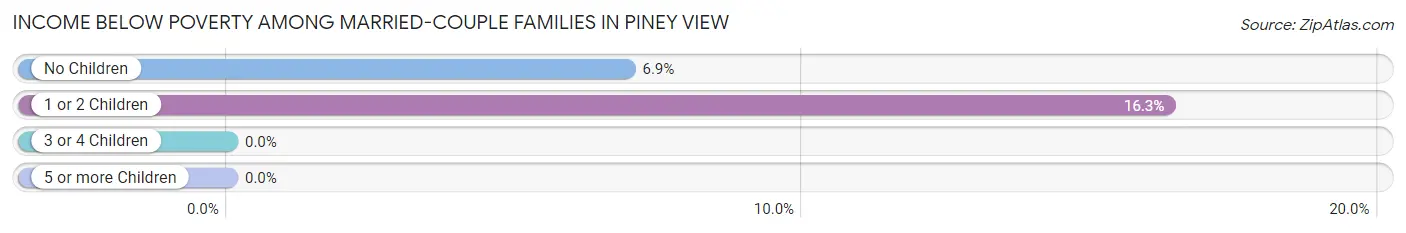
| Children | Above Poverty | Below Poverty |
| No Children | 121 (93.1%) | 9 (6.9%) |
| 1 or 2 Children | 41 (83.7%) | 8 (16.3%) |
| 3 or 4 Children | 19 (100.0%) | 0 (0.0%) |
| 5 or more Children | 0 (0.0%) | 0 (0.0%) |
| Total | 181 (91.4%) | 17 (8.6%) |
Income Below Poverty Among Single-Parent Households in Piney View
| Children | Single Father | Single Mother |
| No Children | 0 (0.0%) | 0 (0.0%) |
| 1 or 2 Children | 0 (0.0%) | 0 (0.0%) |
| 3 or 4 Children | 0 (0.0%) | 0 (0.0%) |
| 5 or more Children | 0 (0.0%) | 0 (0.0%) |
| Total | 0 (0.0%) | 0 (0.0%) |
Income Below Poverty Among Married-Couple vs Single-Parent Households in Piney View
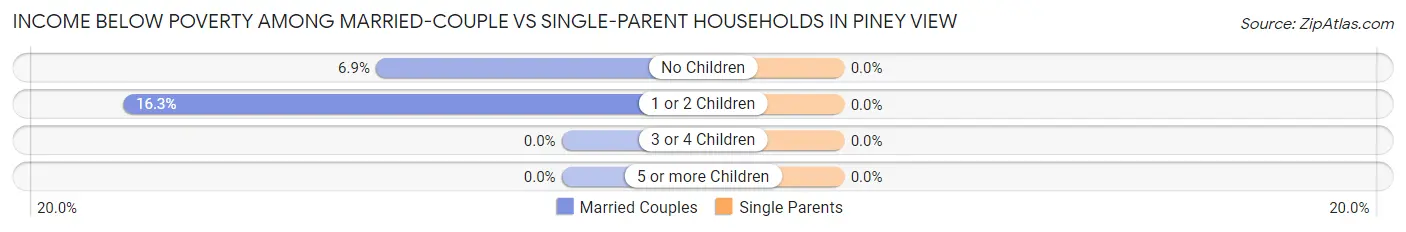
| Children | Married-Couple Families | Single-Parent Households |
| No Children | 9 (6.9%) | 0 (0.0%) |
| 1 or 2 Children | 8 (16.3%) | 0 (0.0%) |
| 3 or 4 Children | 0 (0.0%) | 0 (0.0%) |
| 5 or more Children | 0 (0.0%) | 0 (0.0%) |
| Total | 17 (8.6%) | 0 (0.0%) |
Race in Piney View
The most populous races in Piney View are , and White / Caucasian (708 | 100.0%).
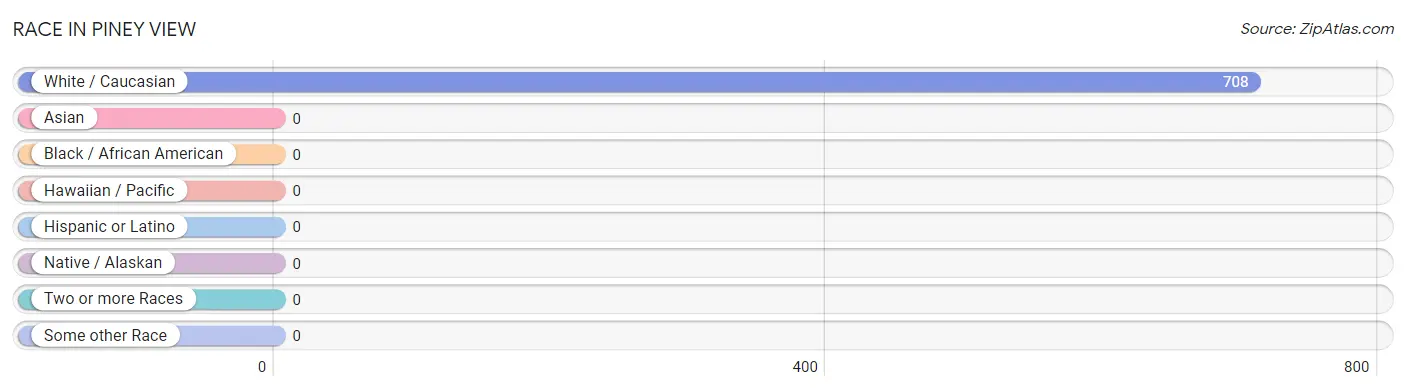
| Race | # Population | % Population |
| Asian | 0 | 0.0% |
| Black / African American | 0 | 0.0% |
| Hawaiian / Pacific | 0 | 0.0% |
| Hispanic or Latino | 0 | 0.0% |
| Native / Alaskan | 0 | 0.0% |
| White / Caucasian | 708 | 100.0% |
| Two or more Races | 0 | 0.0% |
| Some other Race | 0 | 0.0% |
| Total | 708 | 100.0% |
Ancestry in Piney View
The most populous ancestries reported in Piney View are English (393 | 55.5%), Irish (126 | 17.8%), American (78 | 11.0%), German (37 | 5.2%), and Welsh (37 | 5.2%), together accounting for 94.8% of all Piney View residents.
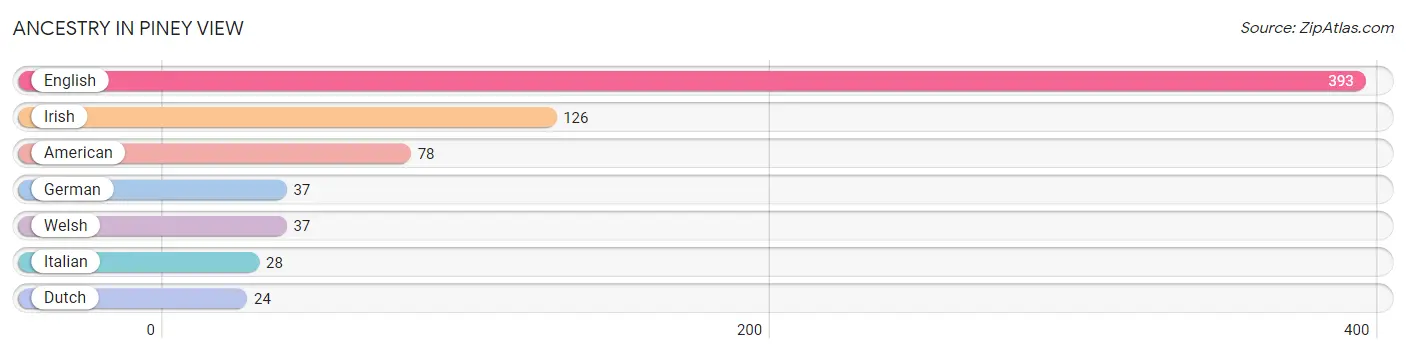
| Ancestry | # Population | % Population |
| American | 78 | 11.0% |
| Dutch | 24 | 3.4% |
| English | 393 | 55.5% |
| German | 37 | 5.2% |
| Irish | 126 | 17.8% |
| Italian | 28 | 4.0% |
| Welsh | 37 | 5.2% | View All 7 Rows |
Immigrants in Piney View

| Immigration Origin | # Population | % Population | View All 0 Rows |
Sex and Age in Piney View
Sex and Age in Piney View
The most populous age groups in Piney View are 70 to 74 Years (80 | 22.2%) for men and 70 to 74 Years (70 | 20.2%) for women.
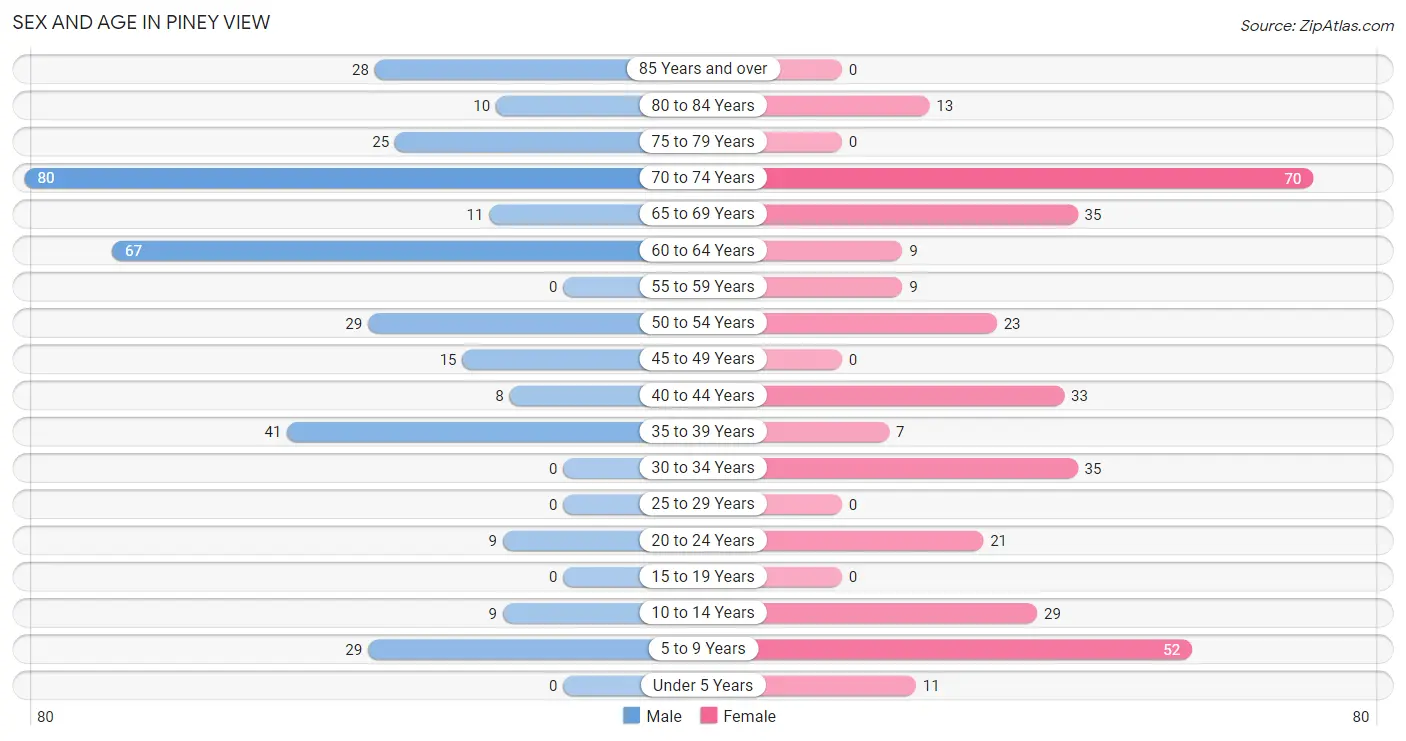
| Age Bracket | Male | Female |
| Under 5 Years | 0 (0.0%) | 11 (3.2%) |
| 5 to 9 Years | 29 (8.0%) | 52 (15.0%) |
| 10 to 14 Years | 9 (2.5%) | 29 (8.4%) |
| 15 to 19 Years | 0 (0.0%) | 0 (0.0%) |
| 20 to 24 Years | 9 (2.5%) | 21 (6.0%) |
| 25 to 29 Years | 0 (0.0%) | 0 (0.0%) |
| 30 to 34 Years | 0 (0.0%) | 35 (10.1%) |
| 35 to 39 Years | 41 (11.4%) | 7 (2.0%) |
| 40 to 44 Years | 8 (2.2%) | 33 (9.5%) |
| 45 to 49 Years | 15 (4.2%) | 0 (0.0%) |
| 50 to 54 Years | 29 (8.0%) | 23 (6.6%) |
| 55 to 59 Years | 0 (0.0%) | 9 (2.6%) |
| 60 to 64 Years | 67 (18.6%) | 9 (2.6%) |
| 65 to 69 Years | 11 (3.0%) | 35 (10.1%) |
| 70 to 74 Years | 80 (22.2%) | 70 (20.2%) |
| 75 to 79 Years | 25 (6.9%) | 0 (0.0%) |
| 80 to 84 Years | 10 (2.8%) | 13 (3.7%) |
| 85 Years and over | 28 (7.8%) | 0 (0.0%) |
| Total | 361 (100.0%) | 347 (100.0%) |
Families and Households in Piney View
Median Family Size in Piney View
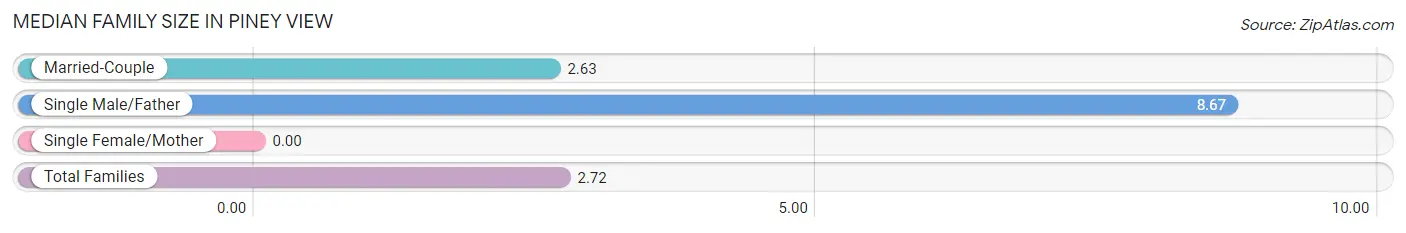
| Family Type | # Families | Family Size |
| Married-Couple | 198 (98.5%) | 2.63 |
| Single Male/Father | 3 (1.5%) | 8.67 |
| Single Female/Mother | 0 (0.0%) | - |
| Total Families | 201 (100.0%) | 2.72 |
Median Household Size in Piney View
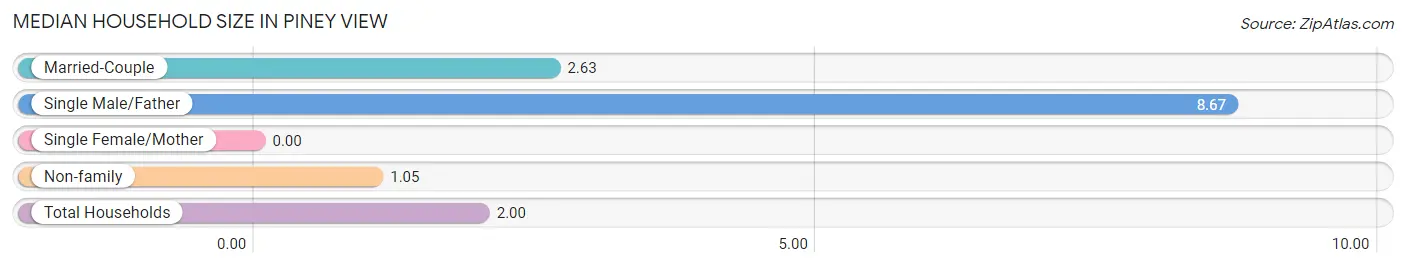
| Household Type | # Households | Household Size |
| Married-Couple | 198 (55.9%) | 2.63 |
| Single Male/Father | 3 (0.9%) | 8.67 |
| Single Female/Mother | 0 (0.0%) | - |
| Non-family | 153 (43.2%) | 1.05 |
| Total Households | 354 (100.0%) | 2.00 |
Household Size by Marriage Status in Piney View
Out of a total of 354 households in Piney View, 201 (56.8%) are family households, while 153 (43.2%) are nonfamily households. The most numerous type of family households are 2-person households, comprising 121, and the most common type of nonfamily households are 1-person households, comprising 142.
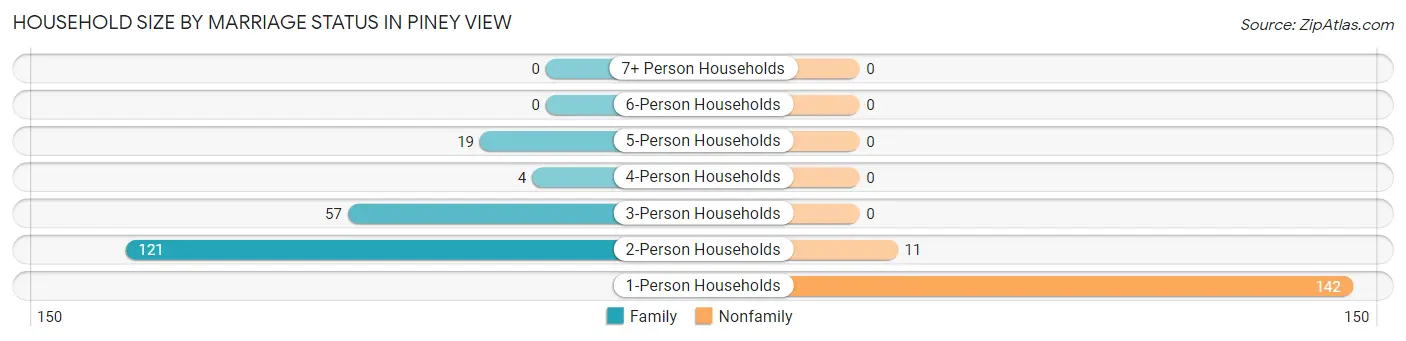
| Household Size | Family Households | Nonfamily Households |
| 1-Person Households | - | 142 (40.1%) |
| 2-Person Households | 121 (34.2%) | 11 (3.1%) |
| 3-Person Households | 57 (16.1%) | 0 (0.0%) |
| 4-Person Households | 4 (1.1%) | 0 (0.0%) |
| 5-Person Households | 19 (5.4%) | 0 (0.0%) |
| 6-Person Households | 0 (0.0%) | 0 (0.0%) |
| 7+ Person Households | 0 (0.0%) | 0 (0.0%) |
| Total | 201 (56.8%) | 153 (43.2%) |
Female Fertility in Piney View
Fertility by Age in Piney View
| Age Bracket | Women with Births | Births / 1,000 Women |
| 15 to 19 years | 0 (0.0%) | 0.0 |
| 20 to 34 years | 0 (0.0%) | 0.0 |
| 35 to 50 years | 0 (0.0%) | 0.0 |
| Total | 0 (0.0%) | 0.0 |
Fertility by Age by Marriage Status in Piney View
| Age Bracket | Married | Unmarried |
| 15 to 19 years | 0 (0.0%) | 0 (0.0%) |
| 20 to 34 years | 0 (0.0%) | 0 (0.0%) |
| 35 to 50 years | 0 (0.0%) | 0 (0.0%) |
| Total | 0 (0.0%) | 0 (0.0%) |
Fertility by Education in Piney View
| Educational Attainment | Women with Births | Births / 1,000 Women |
| Less than High School | 0 (0.0%) | 0.0 |
| High School Diploma | 0 (0.0%) | 0.0 |
| College or Associate's Degree | 0 (0.0%) | 0.0 |
| Bachelor's Degree | 0 (0.0%) | 0.0 |
| Graduate Degree | 0 (0.0%) | 0.0 |
| Total | 0 (0.0%) | 0.0 |
Fertility by Education by Marriage Status in Piney View
| Educational Attainment | Married | Unmarried |
| Less than High School | 0 (0.0%) | 0 (0.0%) |
| High School Diploma | 0 (0.0%) | 0 (0.0%) |
| College or Associate's Degree | 0 (0.0%) | 0 (0.0%) |
| Bachelor's Degree | 0 (0.0%) | 0 (0.0%) |
| Graduate Degree | 0 (0.0%) | 0 (0.0%) |
| Total | 0 (0.0%) | 0 (0.0%) |
Employment Characteristics in Piney View
Employment by Class of Employer in Piney View
Among the 260 employed individuals in Piney View, private company employees (221 | 85.0%), state government employees (19 | 7.3%), and not-for-profit organizations (9 | 3.5%) make up the most common classes of employment.
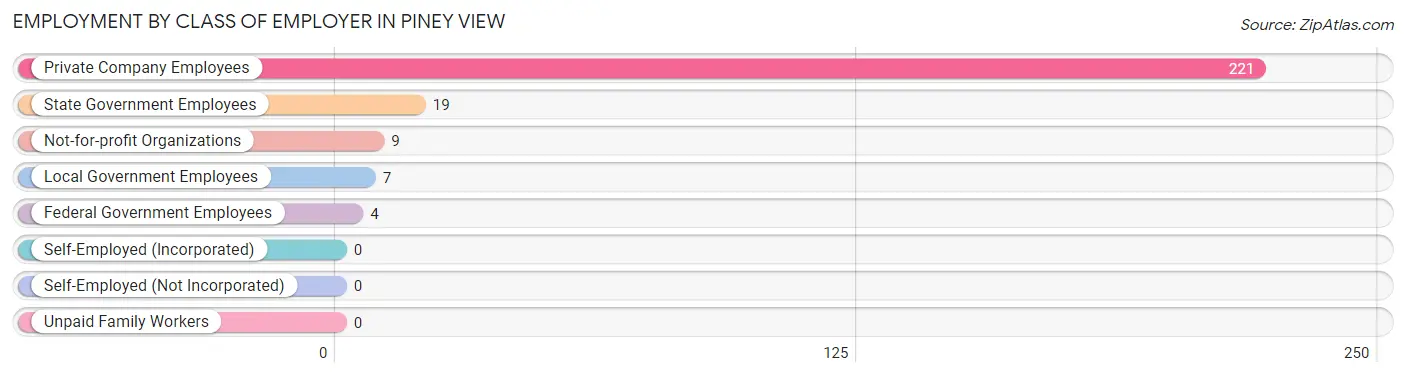
| Employer Class | # Employees | % Employees |
| Private Company Employees | 221 | 85.0% |
| Self-Employed (Incorporated) | 0 | 0.0% |
| Self-Employed (Not Incorporated) | 0 | 0.0% |
| Not-for-profit Organizations | 9 | 3.5% |
| Local Government Employees | 7 | 2.7% |
| State Government Employees | 19 | 7.3% |
| Federal Government Employees | 4 | 1.5% |
| Unpaid Family Workers | 0 | 0.0% |
| Total | 260 | 100.0% |
Employment Status by Age in Piney View
According to the labor force statistics for Piney View, out of the total population over 16 years of age (578), 46.7% or 270 individuals are in the labor force, with 3.7% or 10 of them unemployed. The age group with the highest labor force participation rate is 30 to 34 years, with 100.0% or 35 individuals in the labor force. Within the labor force, the 35 to 44 years age range has the highest percentage of unemployed individuals, with 15.2% or 10 of them being unemployed.
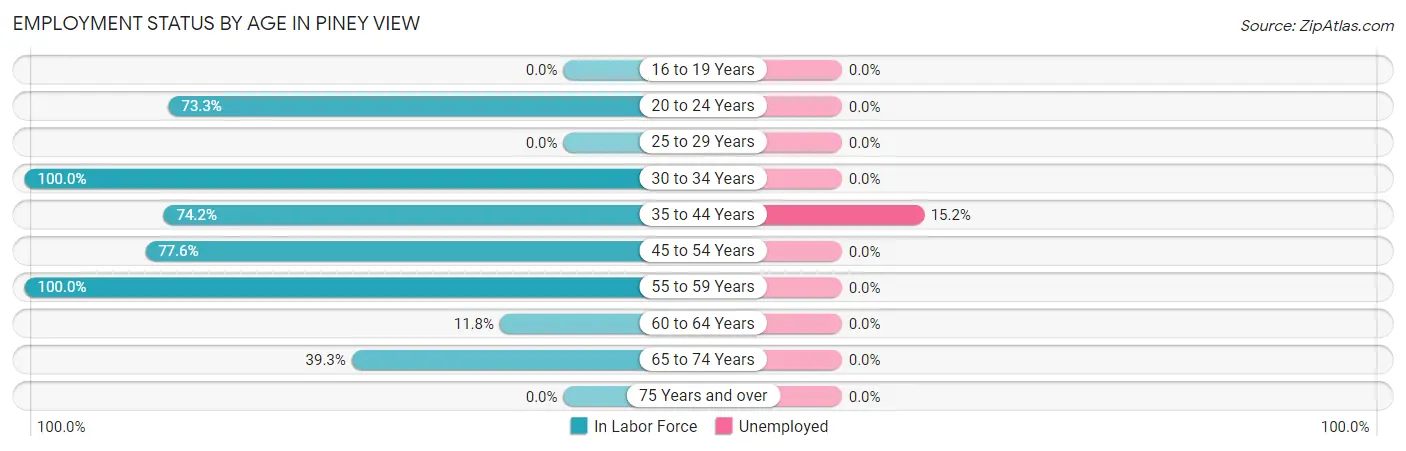
| Age Bracket | In Labor Force | Unemployed |
| 16 to 19 Years | 0 (0.0%) | 0 (0.0%) |
| 20 to 24 Years | 22 (73.3%) | 0 (0.0%) |
| 25 to 29 Years | 0 (0.0%) | 0 (0.0%) |
| 30 to 34 Years | 35 (100.0%) | 0 (0.0%) |
| 35 to 44 Years | 66 (74.2%) | 10 (15.2%) |
| 45 to 54 Years | 52 (77.6%) | 0 (0.0%) |
| 55 to 59 Years | 9 (100.0%) | 0 (0.0%) |
| 60 to 64 Years | 9 (11.8%) | 0 (0.0%) |
| 65 to 74 Years | 77 (39.3%) | 0 (0.0%) |
| 75 Years and over | 0 (0.0%) | 0 (0.0%) |
| Total | 270 (46.7%) | 10 (3.7%) |
Employment Status by Educational Attainment in Piney View
According to labor force statistics for Piney View, 62.0% of individuals (171) out of the total population between 25 and 64 years of age (276) are in the labor force, with 5.8% or 10 of them being unemployed. The group with the highest labor force participation rate are those with the educational attainment of bachelor's degree or higher, with 100.0% or 38 individuals in the labor force. Within the labor force, individuals with high school diploma education have the highest percentage of unemployment, with 10.6% or 10 of them being unemployed.
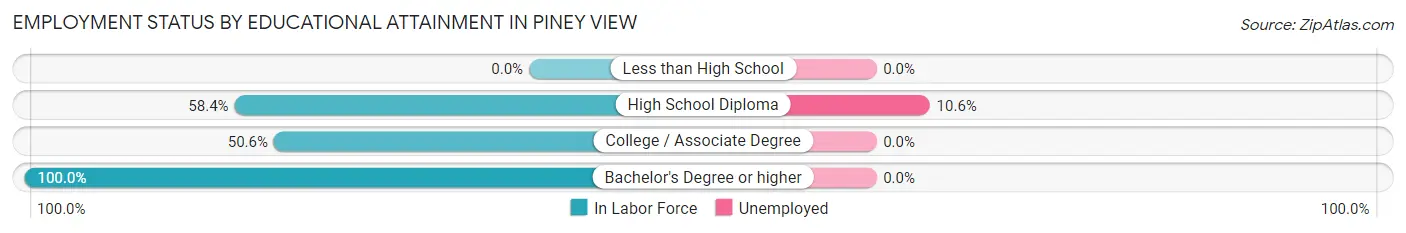
| Educational Attainment | In Labor Force | Unemployed |
| Less than High School | 0 (0.0%) | 0 (0.0%) |
| High School Diploma | 94 (58.4%) | 17 (10.6%) |
| College / Associate Degree | 39 (50.6%) | 0 (0.0%) |
| Bachelor's Degree or higher | 38 (100.0%) | 0 (0.0%) |
| Total | 171 (62.0%) | 16 (5.8%) |
Employment Occupations by Sex in Piney View
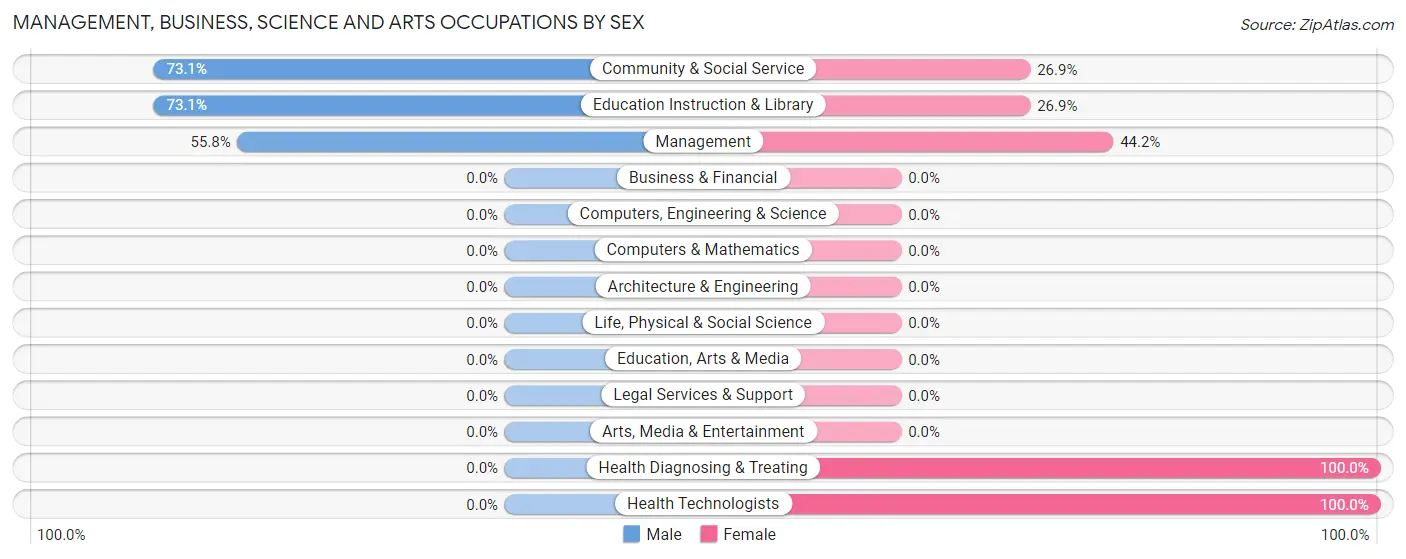
Management, Business, Science and Arts Occupations
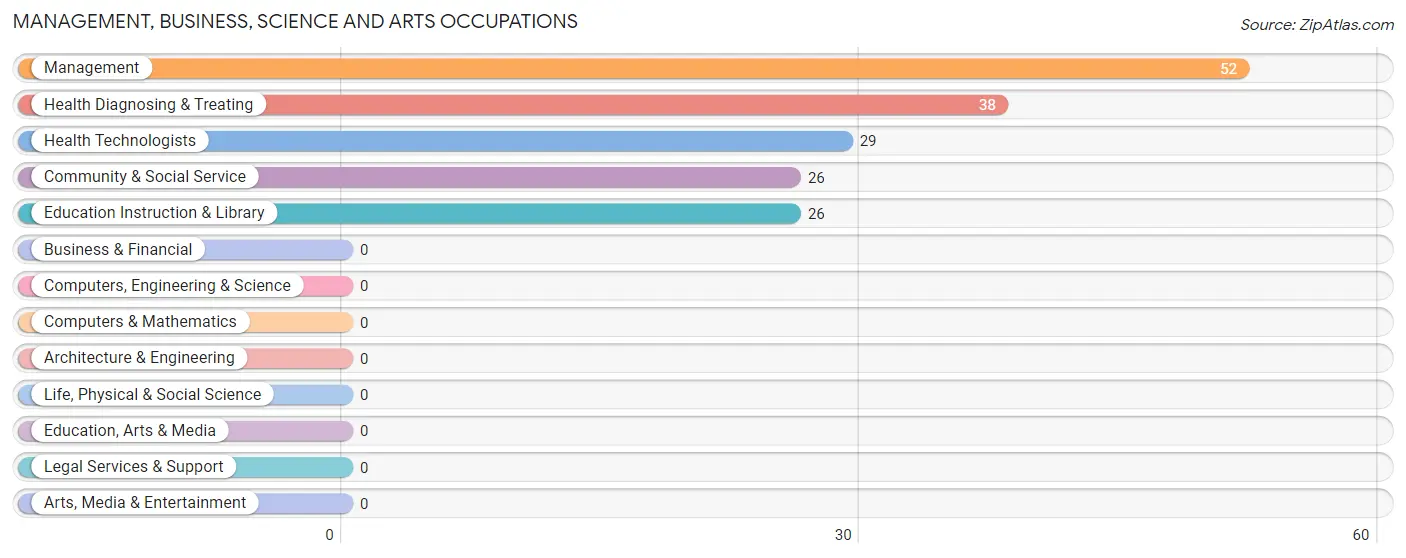
The most common Management, Business, Science and Arts occupations in Piney View are Management (52 | 20.0%), Health Diagnosing & Treating (38 | 14.6%), Health Technologists (29 | 11.2%), Community & Social Service (26 | 10.0%), and Education Instruction & Library (26 | 10.0%).
Management, Business, Science and Arts Occupations by Sex
Within the Management, Business, Science and Arts occupations in Piney View, the most male-oriented occupations are Community & Social Service (73.1%), Education Instruction & Library (73.1%), and Management (55.8%), while the most female-oriented occupations are Health Diagnosing & Treating (100.0%), Health Technologists (100.0%), and Management (44.2%).
| Occupation | Male | Female |
| Management | 29 (55.8%) | 23 (44.2%) |
| Business & Financial | 0 (0.0%) | 0 (0.0%) |
| Computers, Engineering & Science | 0 (0.0%) | 0 (0.0%) |
| Computers & Mathematics | 0 (0.0%) | 0 (0.0%) |
| Architecture & Engineering | 0 (0.0%) | 0 (0.0%) |
| Life, Physical & Social Science | 0 (0.0%) | 0 (0.0%) |
| Community & Social Service | 19 (73.1%) | 7 (26.9%) |
| Education, Arts & Media | 0 (0.0%) | 0 (0.0%) |
| Legal Services & Support | 0 (0.0%) | 0 (0.0%) |
| Education Instruction & Library | 19 (73.1%) | 7 (26.9%) |
| Arts, Media & Entertainment | 0 (0.0%) | 0 (0.0%) |
| Health Diagnosing & Treating | 0 (0.0%) | 38 (100.0%) |
| Health Technologists | 0 (0.0%) | 29 (100.0%) |
| Total (Category) | 48 (41.4%) | 68 (58.6%) |
| Total (Overall) | 114 (43.9%) | 146 (56.1%) |
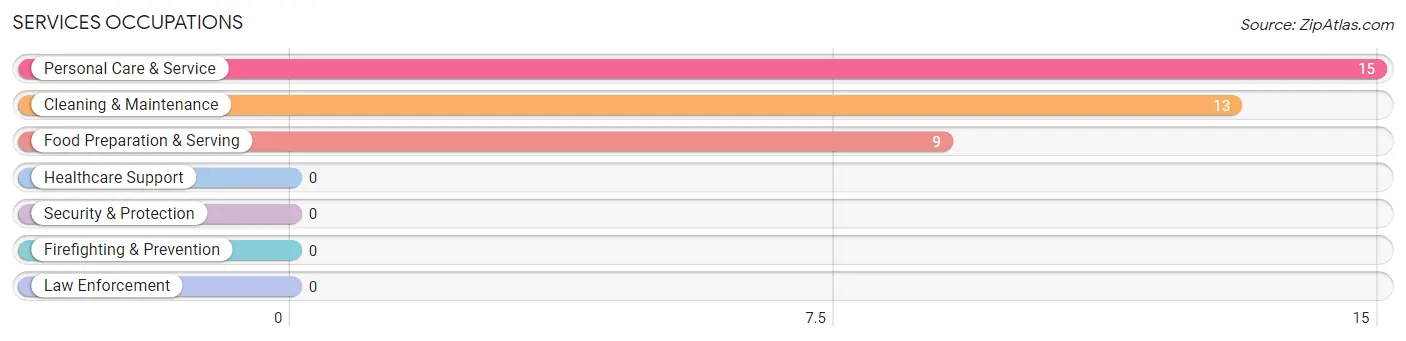
Services Occupations
The most common Services occupations in Piney View are Personal Care & Service (15 | 5.8%), Cleaning & Maintenance (13 | 5.0%), and Food Preparation & Serving (9 | 3.5%).
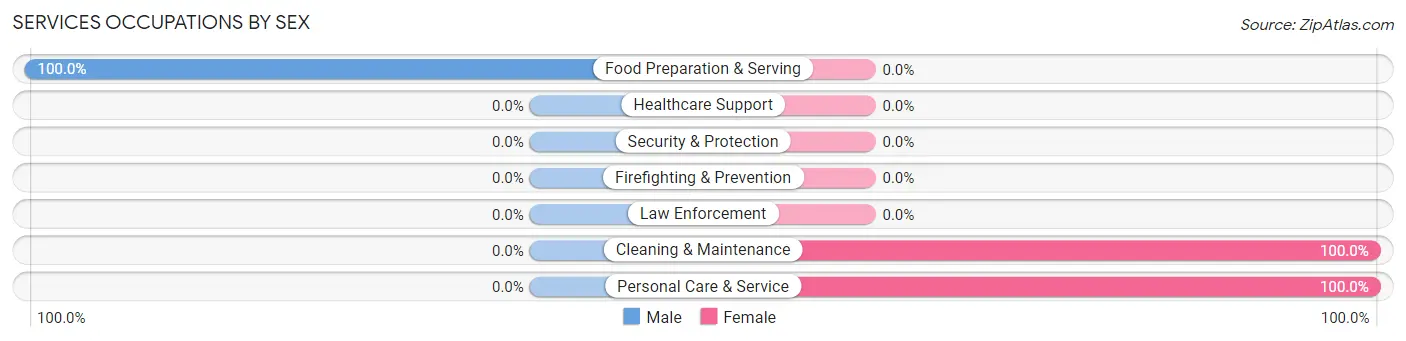
Services Occupations by Sex
| Occupation | Male | Female |
| Healthcare Support | 0 (0.0%) | 0 (0.0%) |
| Security & Protection | 0 (0.0%) | 0 (0.0%) |
| Firefighting & Prevention | 0 (0.0%) | 0 (0.0%) |
| Law Enforcement | 0 (0.0%) | 0 (0.0%) |
| Food Preparation & Serving | 9 (100.0%) | 0 (0.0%) |
| Cleaning & Maintenance | 0 (0.0%) | 13 (100.0%) |
| Personal Care & Service | 0 (0.0%) | 15 (100.0%) |
| Total (Category) | 9 (24.3%) | 28 (75.7%) |
| Total (Overall) | 114 (43.9%) | 146 (56.1%) |
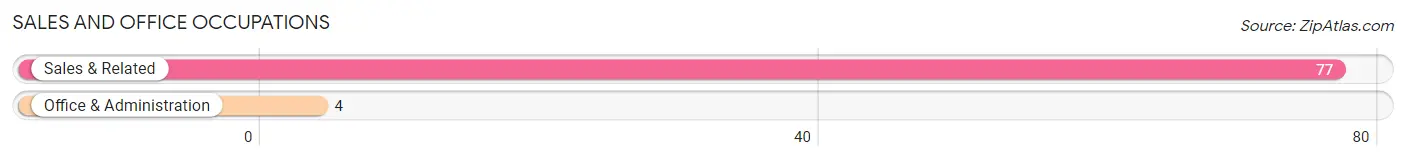
Sales and Office Occupations
The most common Sales and Office occupations in Piney View are Sales & Related (77 | 29.6%), and Office & Administration (4 | 1.5%).
Sales and Office Occupations by Sex

| Occupation | Male | Female |
| Sales & Related | 27 (35.1%) | 50 (64.9%) |
| Office & Administration | 4 (100.0%) | 0 (0.0%) |
| Total (Category) | 31 (38.3%) | 50 (61.7%) |
| Total (Overall) | 114 (43.9%) | 146 (56.1%) |
Natural Resources, Construction and Maintenance Occupations
The most common Natural Resources, Construction and Maintenance occupations in Piney View are , and Installation, Maintenance & Repair (8 | 3.1%).
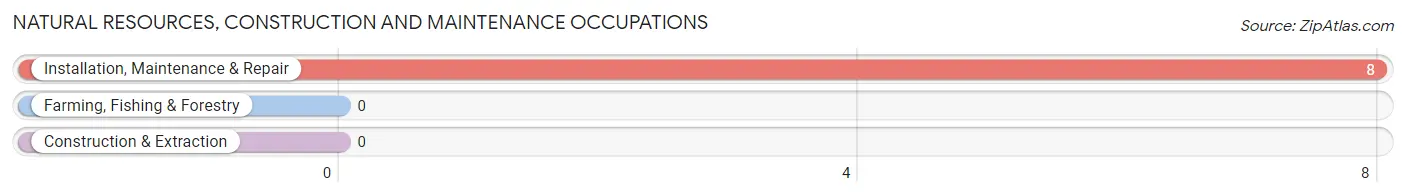
Natural Resources, Construction and Maintenance Occupations by Sex
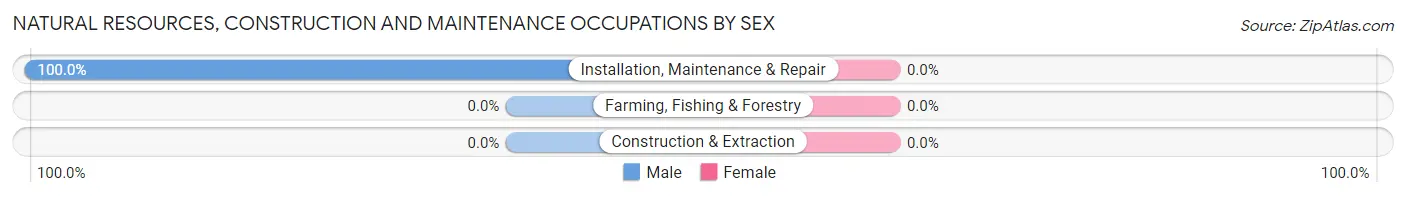
| Occupation | Male | Female |
| Farming, Fishing & Forestry | 0 (0.0%) | 0 (0.0%) |
| Construction & Extraction | 0 (0.0%) | 0 (0.0%) |
| Installation, Maintenance & Repair | 8 (100.0%) | 0 (0.0%) |
| Total (Category) | 8 (100.0%) | 0 (0.0%) |
| Total (Overall) | 114 (43.9%) | 146 (56.1%) |
Production, Transportation and Moving Occupations
The most common Production, Transportation and Moving occupations in Piney View are , and Material Moving (18 | 6.9%).
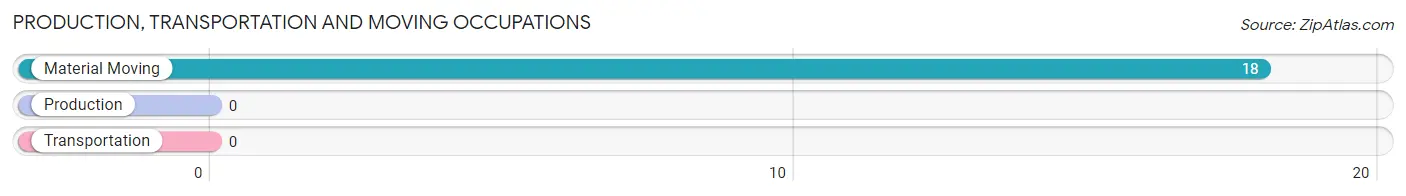
Production, Transportation and Moving Occupations by Sex
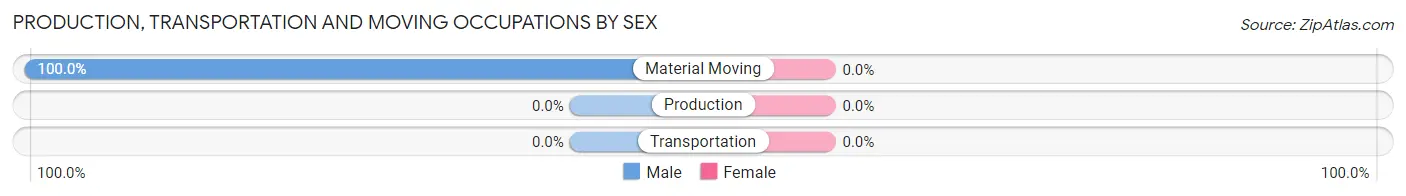
| Occupation | Male | Female |
| Production | 0 (0.0%) | 0 (0.0%) |
| Transportation | 0 (0.0%) | 0 (0.0%) |
| Material Moving | 18 (100.0%) | 0 (0.0%) |
| Total (Category) | 18 (100.0%) | 0 (0.0%) |
| Total (Overall) | 114 (43.9%) | 146 (56.1%) |
Employment Industries by Sex in Piney View
Employment Industries in Piney View
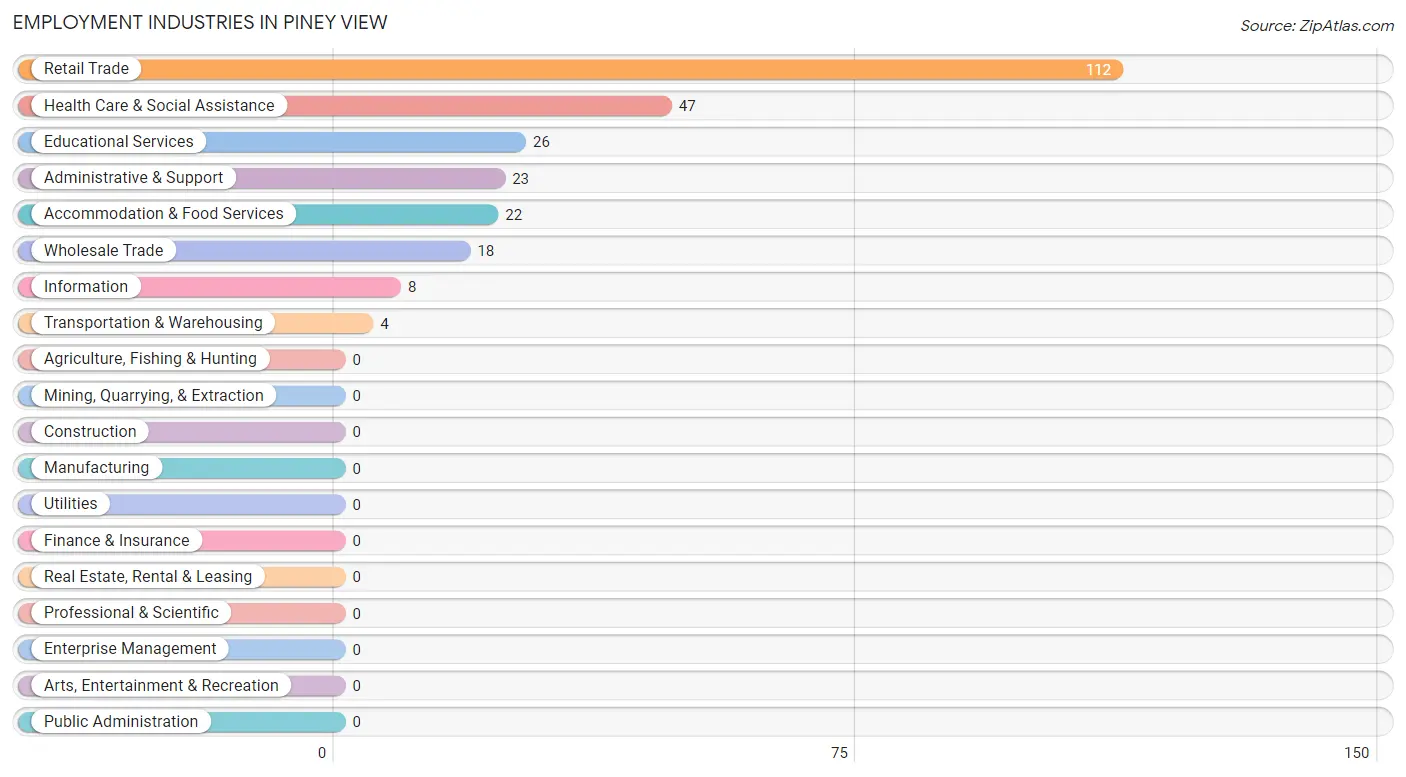
The major employment industries in Piney View include Retail Trade (112 | 43.1%), Health Care & Social Assistance (47 | 18.1%), Educational Services (26 | 10.0%), Administrative & Support (23 | 8.8%), and Accommodation & Food Services (22 | 8.5%).
Employment Industries by Sex in Piney View
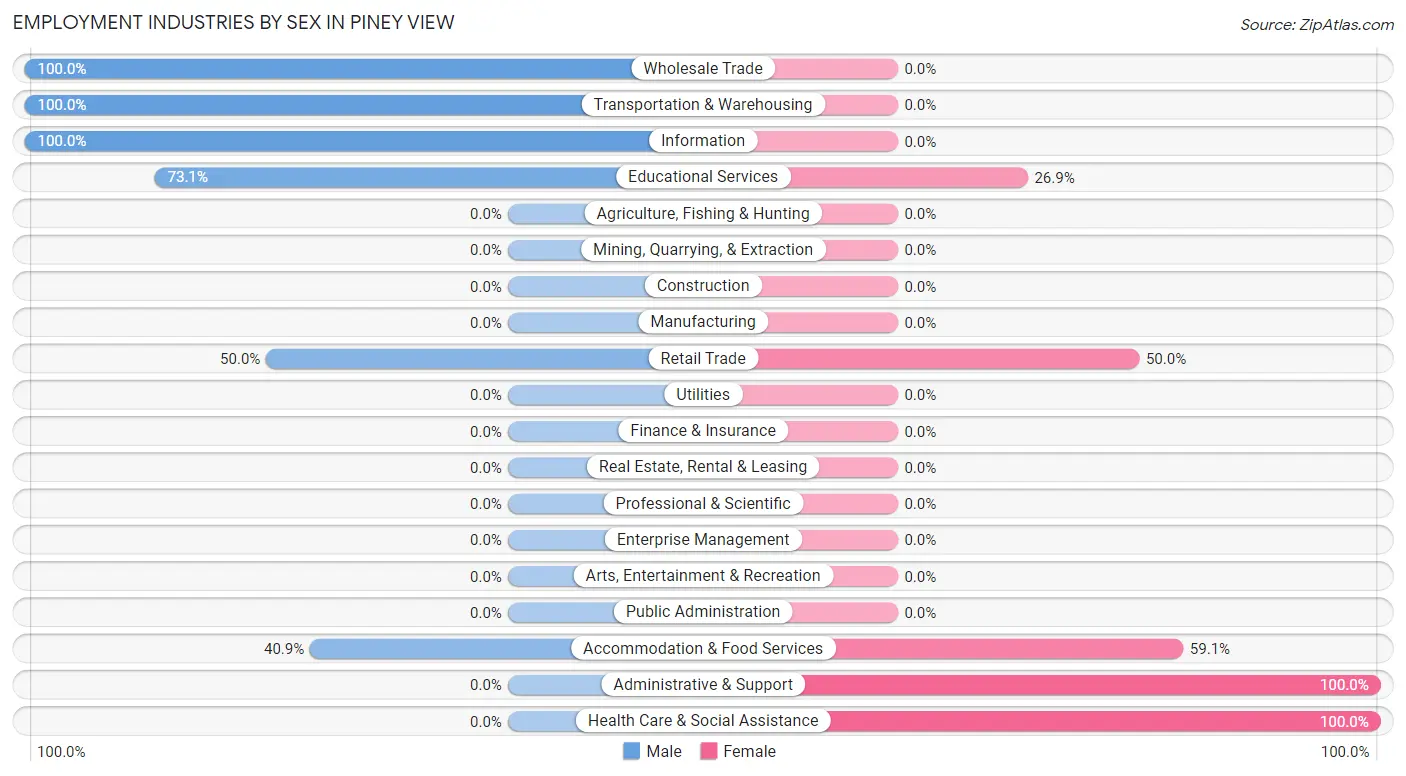
The Piney View industries that see more men than women are Wholesale Trade (100.0%), Transportation & Warehousing (100.0%), and Information (100.0%), whereas the industries that tend to have a higher number of women are Administrative & Support (100.0%), Health Care & Social Assistance (100.0%), and Accommodation & Food Services (59.1%).
| Industry | Male | Female |
| Agriculture, Fishing & Hunting | 0 (0.0%) | 0 (0.0%) |
| Mining, Quarrying, & Extraction | 0 (0.0%) | 0 (0.0%) |
| Construction | 0 (0.0%) | 0 (0.0%) |
| Manufacturing | 0 (0.0%) | 0 (0.0%) |
| Wholesale Trade | 18 (100.0%) | 0 (0.0%) |
| Retail Trade | 56 (50.0%) | 56 (50.0%) |
| Transportation & Warehousing | 4 (100.0%) | 0 (0.0%) |
| Utilities | 0 (0.0%) | 0 (0.0%) |
| Information | 8 (100.0%) | 0 (0.0%) |
| Finance & Insurance | 0 (0.0%) | 0 (0.0%) |
| Real Estate, Rental & Leasing | 0 (0.0%) | 0 (0.0%) |
| Professional & Scientific | 0 (0.0%) | 0 (0.0%) |
| Enterprise Management | 0 (0.0%) | 0 (0.0%) |
| Administrative & Support | 0 (0.0%) | 23 (100.0%) |
| Educational Services | 19 (73.1%) | 7 (26.9%) |
| Health Care & Social Assistance | 0 (0.0%) | 47 (100.0%) |
| Arts, Entertainment & Recreation | 0 (0.0%) | 0 (0.0%) |
| Accommodation & Food Services | 9 (40.9%) | 13 (59.1%) |
| Public Administration | 0 (0.0%) | 0 (0.0%) |
| Total | 114 (43.9%) | 146 (56.1%) |
Education in Piney View
School Enrollment in Piney View
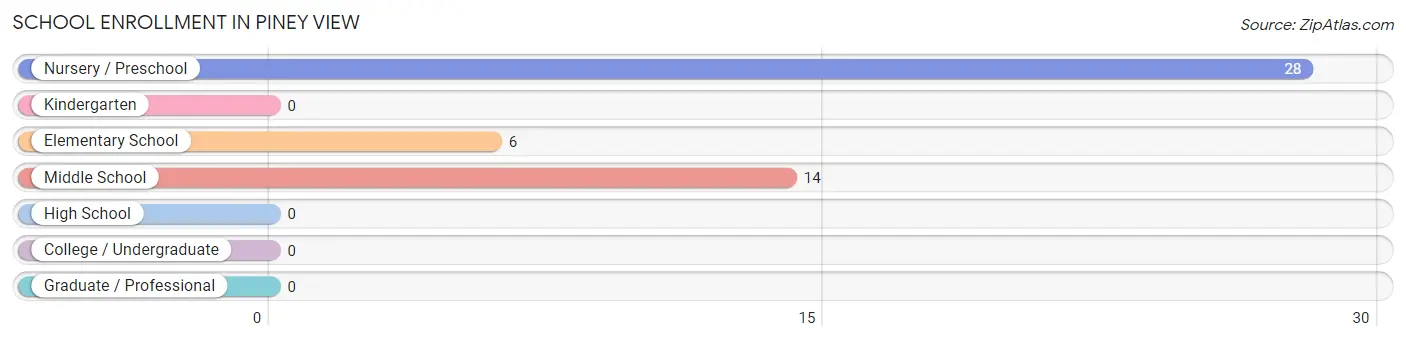
The most common levels of schooling among the 48 students in Piney View are nursery / preschool (28 | 58.3%), middle school (14 | 29.2%), and elementary school (6 | 12.5%).
| School Level | # Students | % Students |
| Nursery / Preschool | 28 | 58.3% |
| Kindergarten | 0 | 0.0% |
| Elementary School | 6 | 12.5% |
| Middle School | 14 | 29.2% |
| High School | 0 | 0.0% |
| College / Undergraduate | 0 | 0.0% |
| Graduate / Professional | 0 | 0.0% |
| Total | 48 | 100.0% |
School Enrollment by Age by Funding Source in Piney View
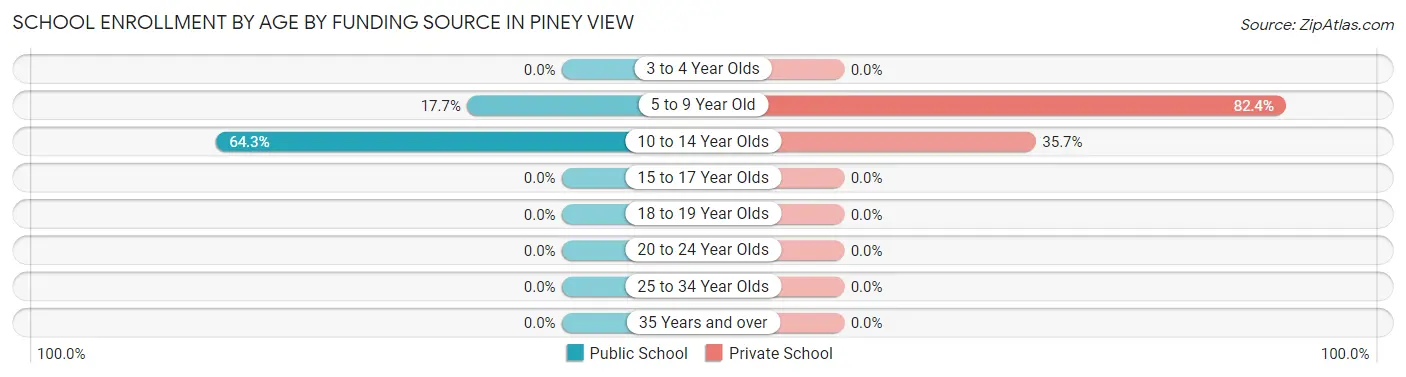
Out of a total of 48 students who are enrolled in schools in Piney View, 33 (68.8%) attend a private institution, while the remaining 15 (31.2%) are enrolled in public schools. The age group of 5 to 9 year old has the highest likelihood of being enrolled in private schools, with 28 (82.4% in the age bracket) enrolled. Conversely, the age group of 10 to 14 year olds has the lowest likelihood of being enrolled in a private school, with 9 (64.3% in the age bracket) attending a public institution.
| Age Bracket | Public School | Private School |
| 3 to 4 Year Olds | 0 (0.0%) | 0 (0.0%) |
| 5 to 9 Year Old | 6 (17.6%) | 28 (82.4%) |
| 10 to 14 Year Olds | 9 (64.3%) | 5 (35.7%) |
| 15 to 17 Year Olds | 0 (0.0%) | 0 (0.0%) |
| 18 to 19 Year Olds | 0 (0.0%) | 0 (0.0%) |
| 20 to 24 Year Olds | 0 (0.0%) | 0 (0.0%) |
| 25 to 34 Year Olds | 0 (0.0%) | 0 (0.0%) |
| 35 Years and over | 0 (0.0%) | 0 (0.0%) |
| Total | 15 (31.3%) | 33 (68.8%) |
Educational Attainment by Field of Study in Piney View
Education (50 | 36.5%), business (36 | 26.3%), science & technology (29 | 21.2%), computers & mathematics (11 | 8.0%), and engineering (11 | 8.0%) are the most common fields of study among 137 individuals in Piney View who have obtained a bachelor's degree or higher.
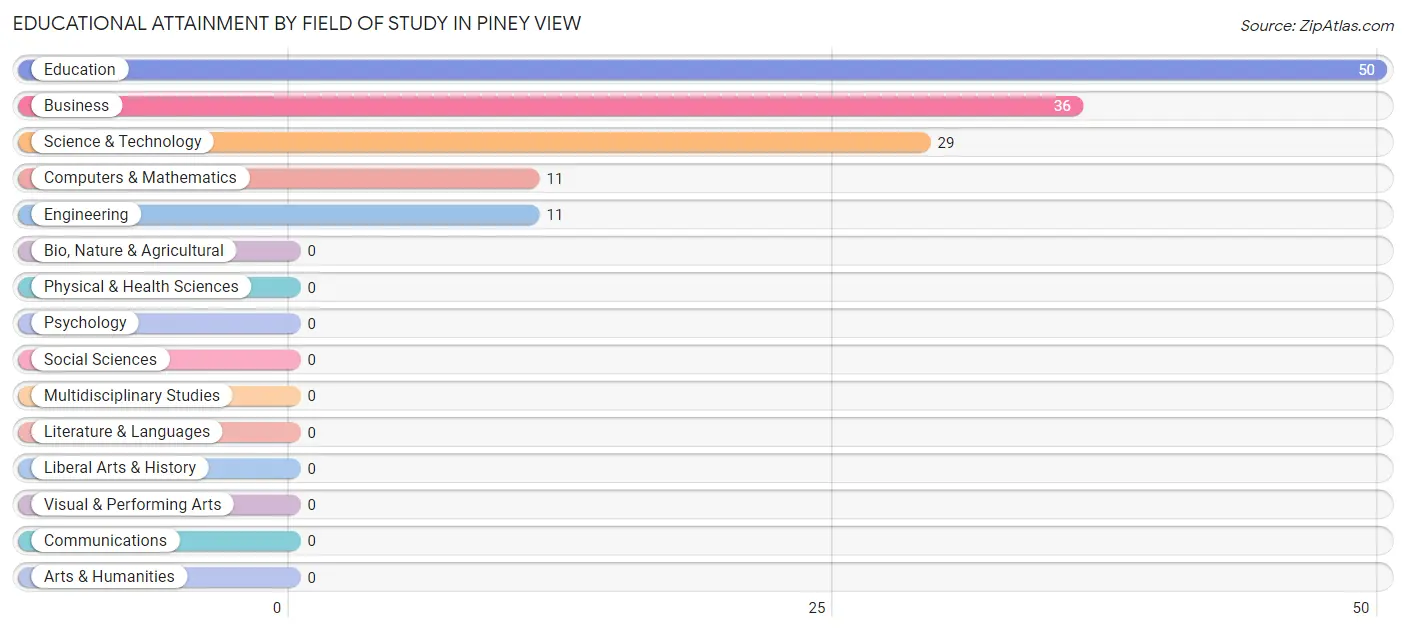
| Field of Study | # Graduates | % Graduates |
| Computers & Mathematics | 11 | 8.0% |
| Bio, Nature & Agricultural | 0 | 0.0% |
| Physical & Health Sciences | 0 | 0.0% |
| Psychology | 0 | 0.0% |
| Social Sciences | 0 | 0.0% |
| Engineering | 11 | 8.0% |
| Multidisciplinary Studies | 0 | 0.0% |
| Science & Technology | 29 | 21.2% |
| Business | 36 | 26.3% |
| Education | 50 | 36.5% |
| Literature & Languages | 0 | 0.0% |
| Liberal Arts & History | 0 | 0.0% |
| Visual & Performing Arts | 0 | 0.0% |
| Communications | 0 | 0.0% |
| Arts & Humanities | 0 | 0.0% |
| Total | 137 | 100.0% |
Transportation & Commute in Piney View
Vehicle Availability by Sex in Piney View
The most prevalent vehicle ownership categories in Piney View are males with 2 vehicles (68, accounting for 59.7%) and females with 2 vehicles (95, making up 46.6%).
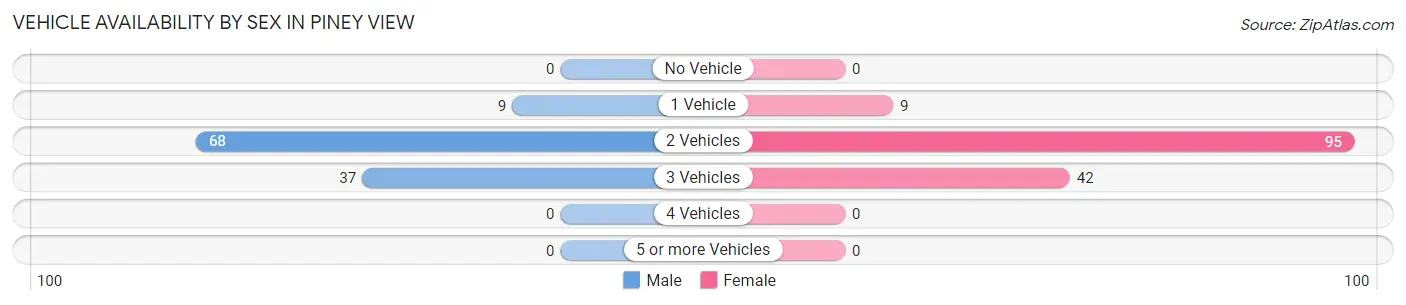
| Vehicles Available | Male | Female |
| No Vehicle | 0 (0.0%) | 0 (0.0%) |
| 1 Vehicle | 9 (7.9%) | 9 (6.2%) |
| 2 Vehicles | 68 (59.7%) | 95 (65.1%) |
| 3 Vehicles | 37 (32.5%) | 42 (28.8%) |
| 4 Vehicles | 0 (0.0%) | 0 (0.0%) |
| 5 or more Vehicles | 0 (0.0%) | 0 (0.0%) |
| Total | 114 (100.0%) | 146 (100.0%) |
Commute Time in Piney View
The most frequently occuring commute durations in Piney View are 15 to 19 minutes (134 commuters, 51.5%), 30 to 34 minutes (70 commuters, 26.9%), and 5 to 9 minutes (19 commuters, 7.3%).
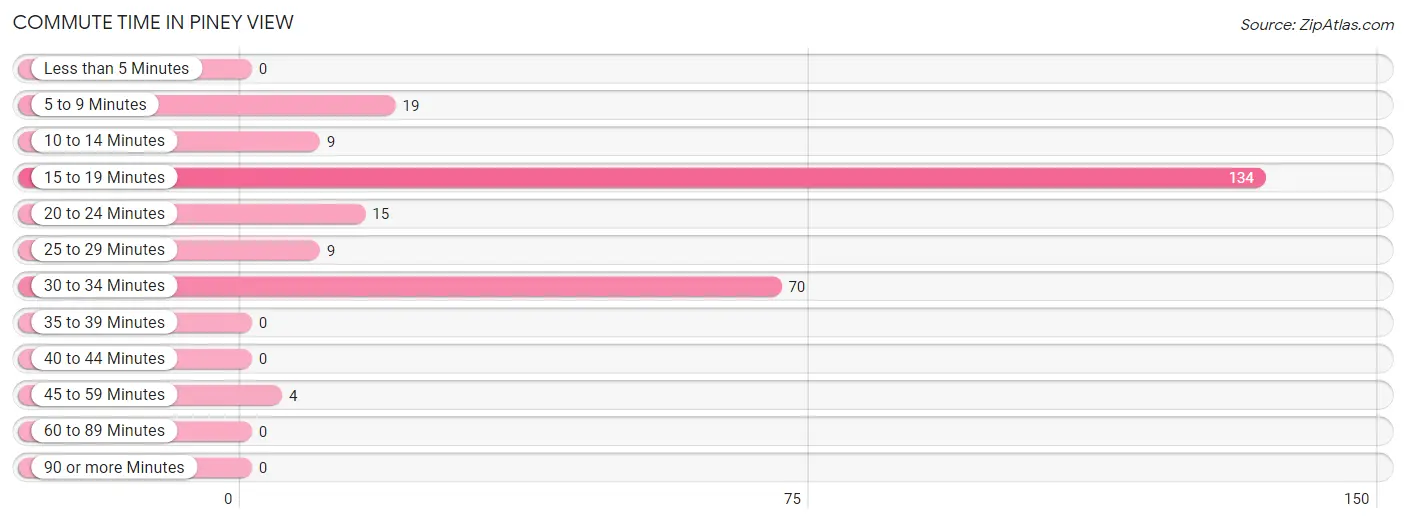
| Commute Time | # Commuters | % Commuters |
| Less than 5 Minutes | 0 | 0.0% |
| 5 to 9 Minutes | 19 | 7.3% |
| 10 to 14 Minutes | 9 | 3.5% |
| 15 to 19 Minutes | 134 | 51.5% |
| 20 to 24 Minutes | 15 | 5.8% |
| 25 to 29 Minutes | 9 | 3.5% |
| 30 to 34 Minutes | 70 | 26.9% |
| 35 to 39 Minutes | 0 | 0.0% |
| 40 to 44 Minutes | 0 | 0.0% |
| 45 to 59 Minutes | 4 | 1.5% |
| 60 to 89 Minutes | 0 | 0.0% |
| 90 or more Minutes | 0 | 0.0% |
Commute Time by Sex in Piney View
The most common commute times in Piney View are 15 to 19 minutes (55 commuters, 48.2%) for males and 15 to 19 minutes (79 commuters, 54.1%) for females.
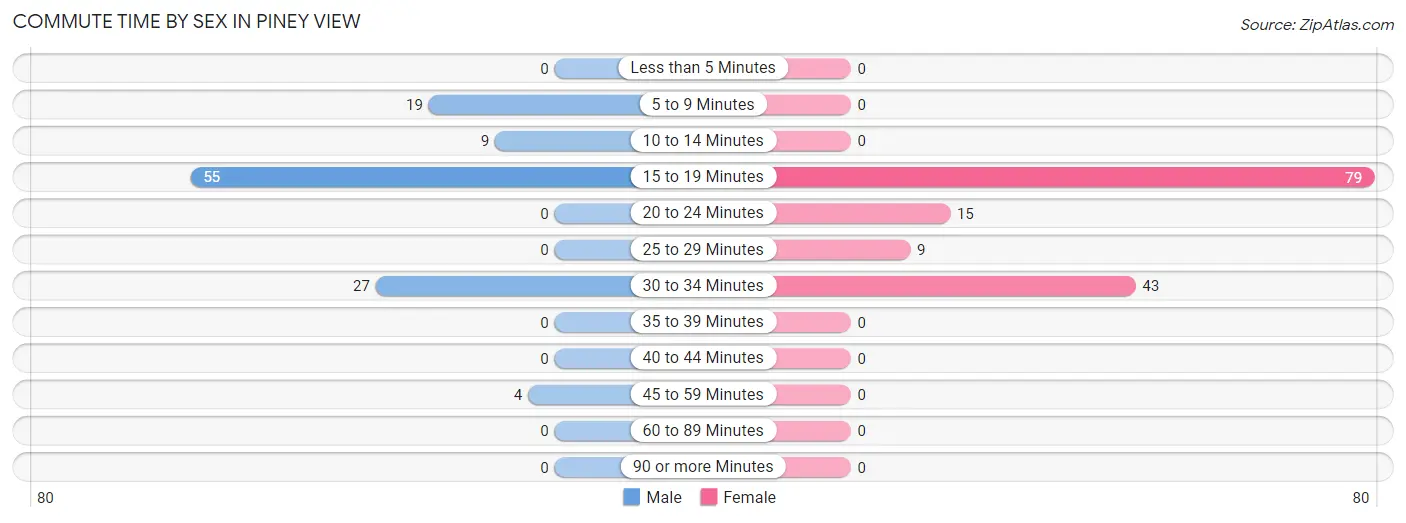
| Commute Time | Male | Female |
| Less than 5 Minutes | 0 (0.0%) | 0 (0.0%) |
| 5 to 9 Minutes | 19 (16.7%) | 0 (0.0%) |
| 10 to 14 Minutes | 9 (7.9%) | 0 (0.0%) |
| 15 to 19 Minutes | 55 (48.2%) | 79 (54.1%) |
| 20 to 24 Minutes | 0 (0.0%) | 15 (10.3%) |
| 25 to 29 Minutes | 0 (0.0%) | 9 (6.2%) |
| 30 to 34 Minutes | 27 (23.7%) | 43 (29.4%) |
| 35 to 39 Minutes | 0 (0.0%) | 0 (0.0%) |
| 40 to 44 Minutes | 0 (0.0%) | 0 (0.0%) |
| 45 to 59 Minutes | 4 (3.5%) | 0 (0.0%) |
| 60 to 89 Minutes | 0 (0.0%) | 0 (0.0%) |
| 90 or more Minutes | 0 (0.0%) | 0 (0.0%) |
Time of Departure to Work by Sex in Piney View
The most frequent times of departure to work in Piney View are 7:30 AM to 7:59 AM (37, 32.5%) for males and 9:00 AM to 9:59 AM (50, 34.3%) for females.
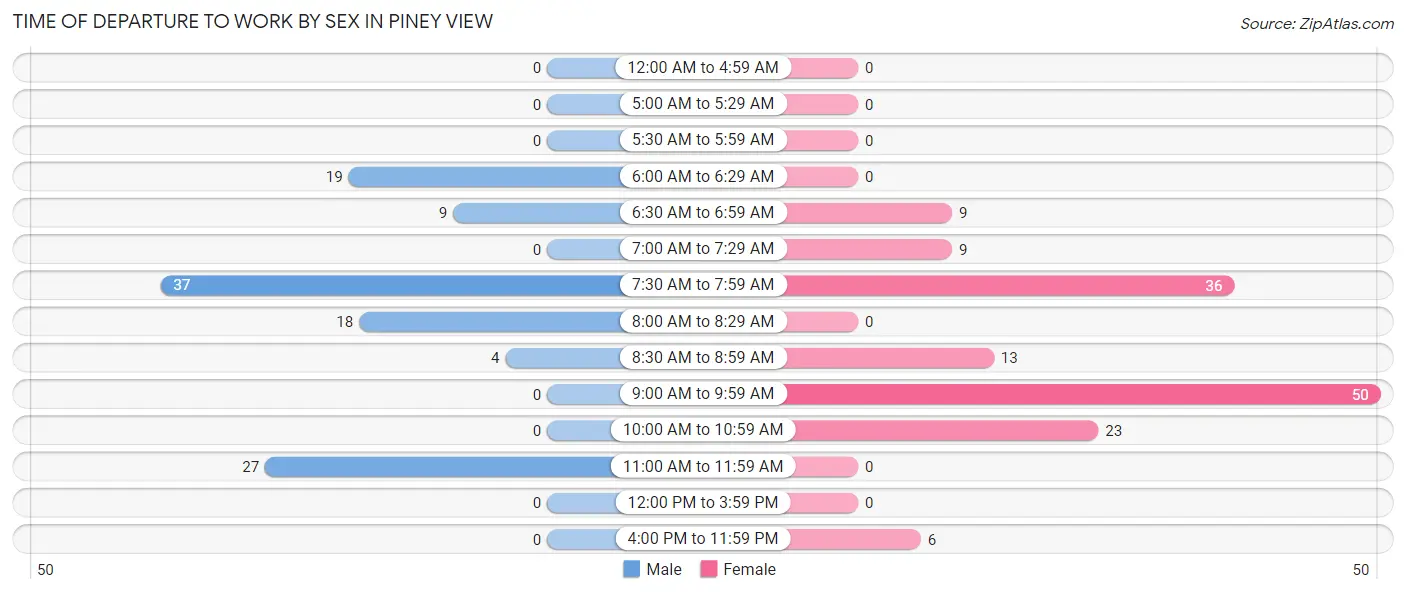
| Time of Departure | Male | Female |
| 12:00 AM to 4:59 AM | 0 (0.0%) | 0 (0.0%) |
| 5:00 AM to 5:29 AM | 0 (0.0%) | 0 (0.0%) |
| 5:30 AM to 5:59 AM | 0 (0.0%) | 0 (0.0%) |
| 6:00 AM to 6:29 AM | 19 (16.7%) | 0 (0.0%) |
| 6:30 AM to 6:59 AM | 9 (7.9%) | 9 (6.2%) |
| 7:00 AM to 7:29 AM | 0 (0.0%) | 9 (6.2%) |
| 7:30 AM to 7:59 AM | 37 (32.5%) | 36 (24.7%) |
| 8:00 AM to 8:29 AM | 18 (15.8%) | 0 (0.0%) |
| 8:30 AM to 8:59 AM | 4 (3.5%) | 13 (8.9%) |
| 9:00 AM to 9:59 AM | 0 (0.0%) | 50 (34.3%) |
| 10:00 AM to 10:59 AM | 0 (0.0%) | 23 (15.8%) |
| 11:00 AM to 11:59 AM | 27 (23.7%) | 0 (0.0%) |
| 12:00 PM to 3:59 PM | 0 (0.0%) | 0 (0.0%) |
| 4:00 PM to 11:59 PM | 0 (0.0%) | 6 (4.1%) |
| Total | 114 (100.0%) | 146 (100.0%) |
Housing Occupancy in Piney View
Occupancy by Ownership in Piney View
Of the total 354 dwellings in Piney View, owner-occupied units account for 314 (88.7%), while renter-occupied units make up 40 (11.3%).
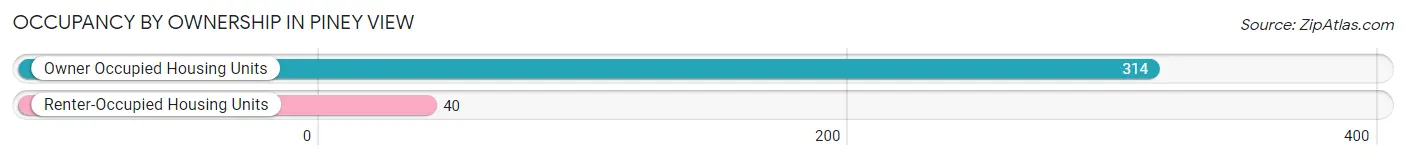
| Occupancy | # Housing Units | % Housing Units |
| Owner Occupied Housing Units | 314 | 88.7% |
| Renter-Occupied Housing Units | 40 | 11.3% |
| Total Occupied Housing Units | 354 | 100.0% |
Occupancy by Household Size in Piney View
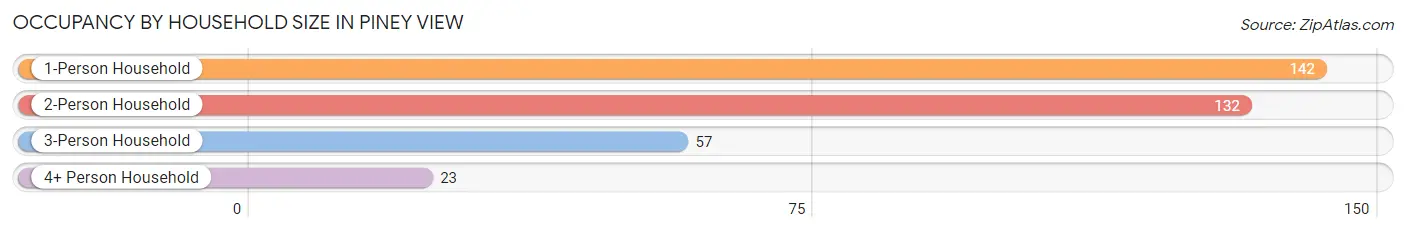
| Household Size | # Housing Units | % Housing Units |
| 1-Person Household | 142 | 40.1% |
| 2-Person Household | 132 | 37.3% |
| 3-Person Household | 57 | 16.1% |
| 4+ Person Household | 23 | 6.5% |
| Total Housing Units | 354 | 100.0% |
Occupancy by Ownership by Household Size in Piney View
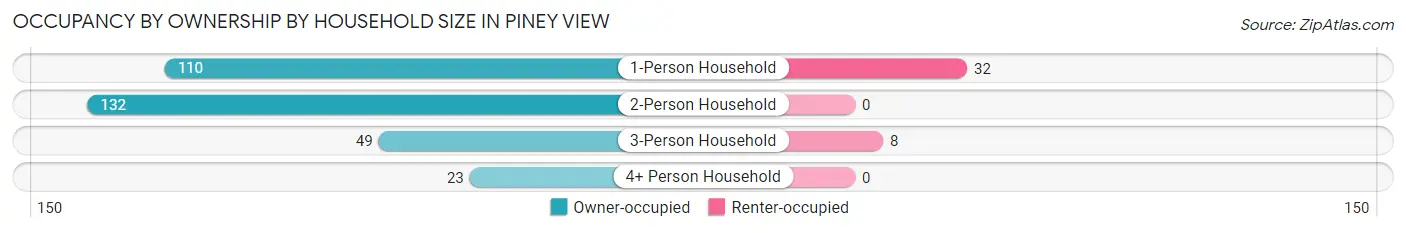
| Household Size | Owner-occupied | Renter-occupied |
| 1-Person Household | 110 (77.5%) | 32 (22.5%) |
| 2-Person Household | 132 (100.0%) | 0 (0.0%) |
| 3-Person Household | 49 (86.0%) | 8 (14.0%) |
| 4+ Person Household | 23 (100.0%) | 0 (0.0%) |
| Total Housing Units | 314 (88.7%) | 40 (11.3%) |
Occupancy by Educational Attainment in Piney View
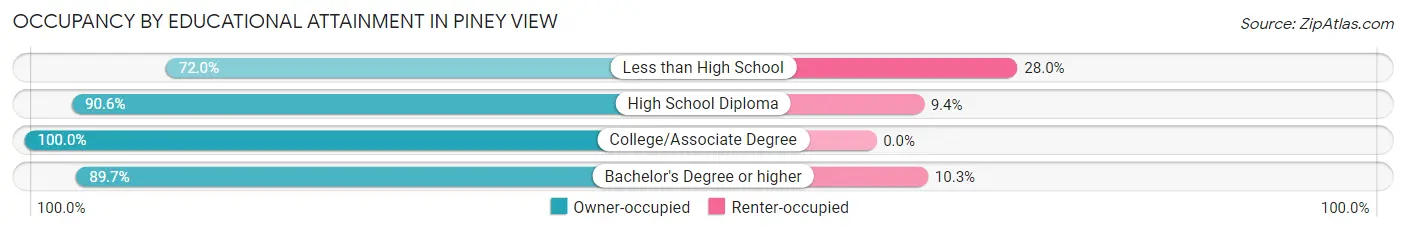
| Household Size | Owner-occupied | Renter-occupied |
| Less than High School | 36 (72.0%) | 14 (28.0%) |
| High School Diploma | 173 (90.6%) | 18 (9.4%) |
| College/Associate Degree | 35 (100.0%) | 0 (0.0%) |
| Bachelor's Degree or higher | 70 (89.7%) | 8 (10.3%) |
Occupancy by Age of Householder in Piney View
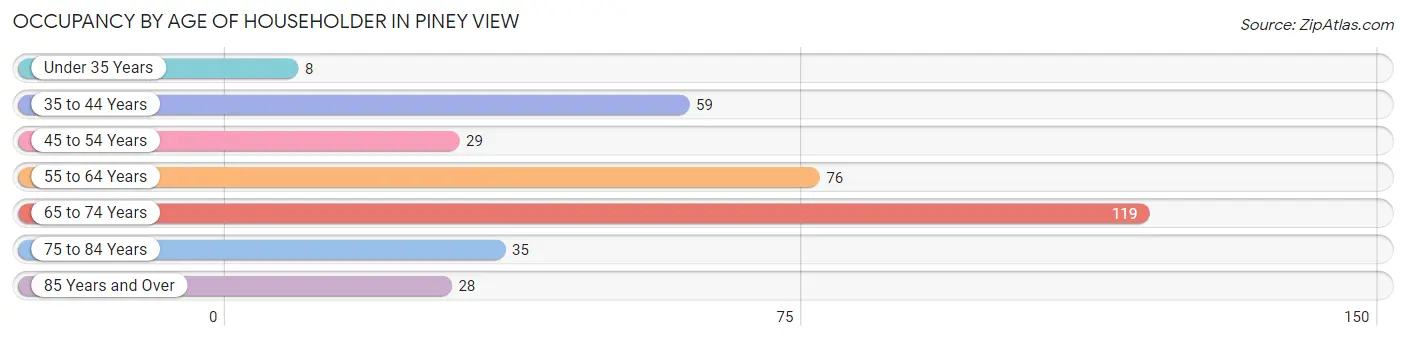
| Age Bracket | # Households | % Households |
| Under 35 Years | 8 | 2.3% |
| 35 to 44 Years | 59 | 16.7% |
| 45 to 54 Years | 29 | 8.2% |
| 55 to 64 Years | 76 | 21.5% |
| 65 to 74 Years | 119 | 33.6% |
| 75 to 84 Years | 35 | 9.9% |
| 85 Years and Over | 28 | 7.9% |
| Total | 354 | 100.0% |
Housing Finances in Piney View
Median Income by Occupancy in Piney View
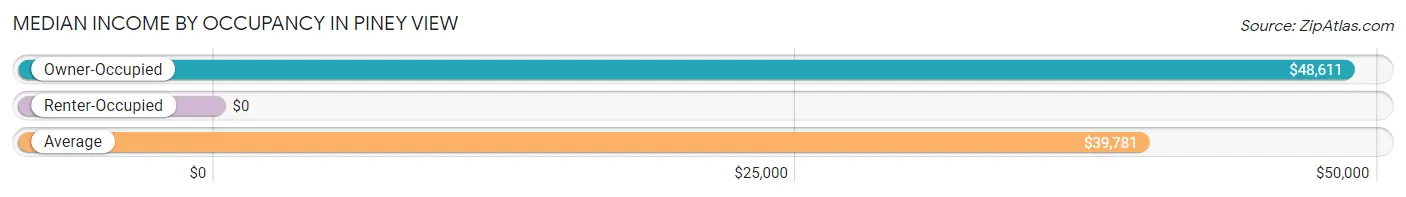
| Occupancy Type | # Households | Median Income |
| Owner-Occupied | 314 (88.7%) | $48,611 |
| Renter-Occupied | 40 (11.3%) | $0 |
| Average | 354 (100.0%) | $39,781 |
Occupancy by Householder Income Bracket in Piney View
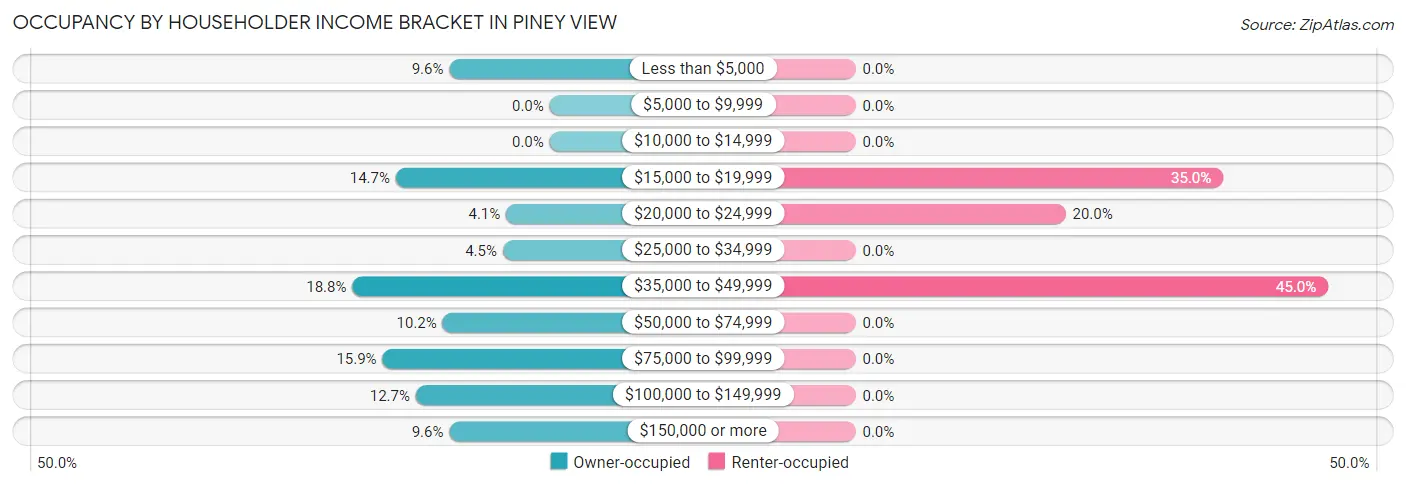
| Income Bracket | Owner-occupied | Renter-occupied |
| Less than $5,000 | 30 (9.6%) | 0 (0.0%) |
| $5,000 to $9,999 | 0 (0.0%) | 0 (0.0%) |
| $10,000 to $14,999 | 0 (0.0%) | 0 (0.0%) |
| $15,000 to $19,999 | 46 (14.6%) | 14 (35.0%) |
| $20,000 to $24,999 | 13 (4.1%) | 8 (20.0%) |
| $25,000 to $34,999 | 14 (4.5%) | 0 (0.0%) |
| $35,000 to $49,999 | 59 (18.8%) | 18 (45.0%) |
| $50,000 to $74,999 | 32 (10.2%) | 0 (0.0%) |
| $75,000 to $99,999 | 50 (15.9%) | 0 (0.0%) |
| $100,000 to $149,999 | 40 (12.7%) | 0 (0.0%) |
| $150,000 or more | 30 (9.6%) | 0 (0.0%) |
| Total | 314 (100.0%) | 40 (100.0%) |
Monthly Housing Cost Tiers in Piney View
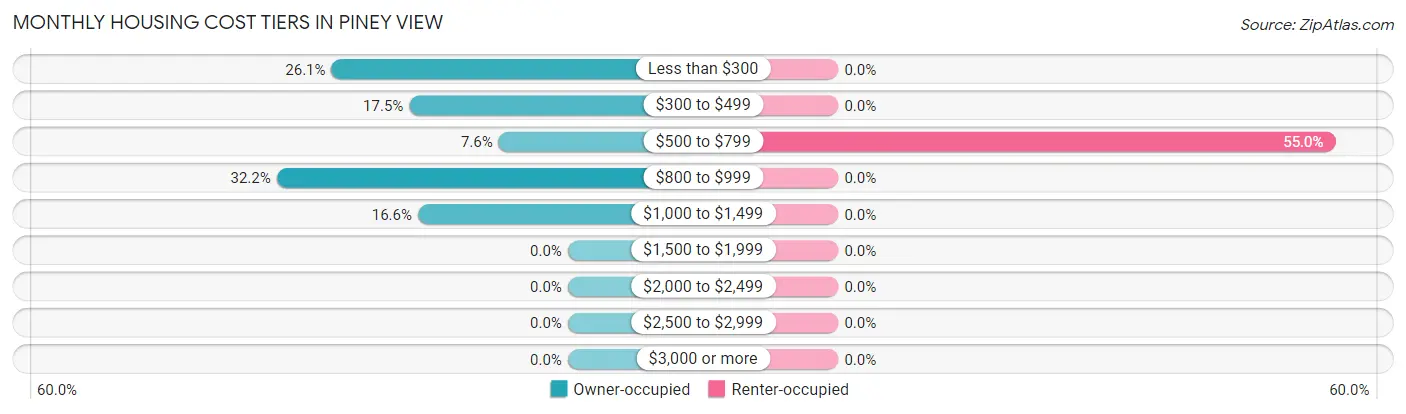
| Monthly Cost | Owner-occupied | Renter-occupied |
| Less than $300 | 82 (26.1%) | 0 (0.0%) |
| $300 to $499 | 55 (17.5%) | 0 (0.0%) |
| $500 to $799 | 24 (7.6%) | 22 (55.0%) |
| $800 to $999 | 101 (32.2%) | 0 (0.0%) |
| $1,000 to $1,499 | 52 (16.6%) | 0 (0.0%) |
| $1,500 to $1,999 | 0 (0.0%) | 0 (0.0%) |
| $2,000 to $2,499 | 0 (0.0%) | 0 (0.0%) |
| $2,500 to $2,999 | 0 (0.0%) | 0 (0.0%) |
| $3,000 or more | 0 (0.0%) | 0 (0.0%) |
| Total | 314 (100.0%) | 40 (100.0%) |
Physical Housing Characteristics in Piney View
Housing Structures in Piney View
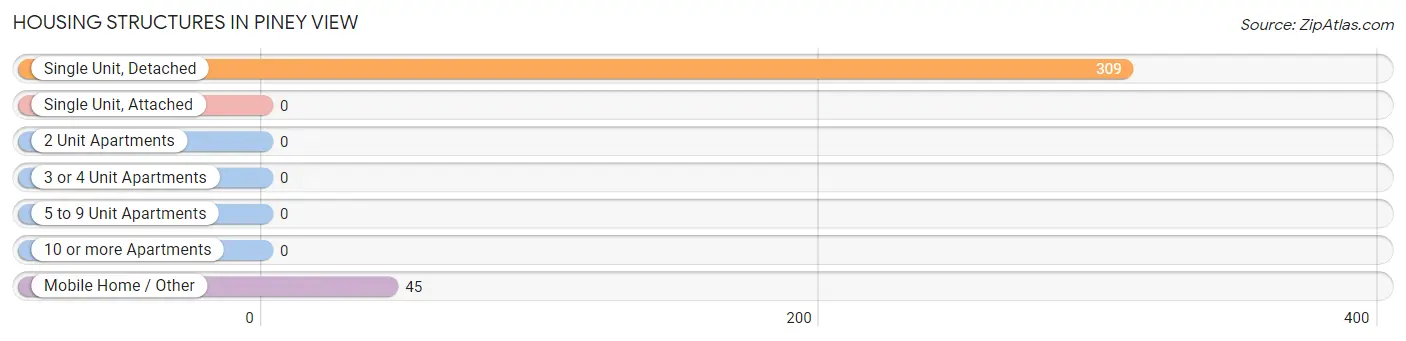
| Structure Type | # Housing Units | % Housing Units |
| Single Unit, Detached | 309 | 87.3% |
| Single Unit, Attached | 0 | 0.0% |
| 2 Unit Apartments | 0 | 0.0% |
| 3 or 4 Unit Apartments | 0 | 0.0% |
| 5 to 9 Unit Apartments | 0 | 0.0% |
| 10 or more Apartments | 0 | 0.0% |
| Mobile Home / Other | 45 | 12.7% |
| Total | 354 | 100.0% |
Housing Structures by Occupancy in Piney View
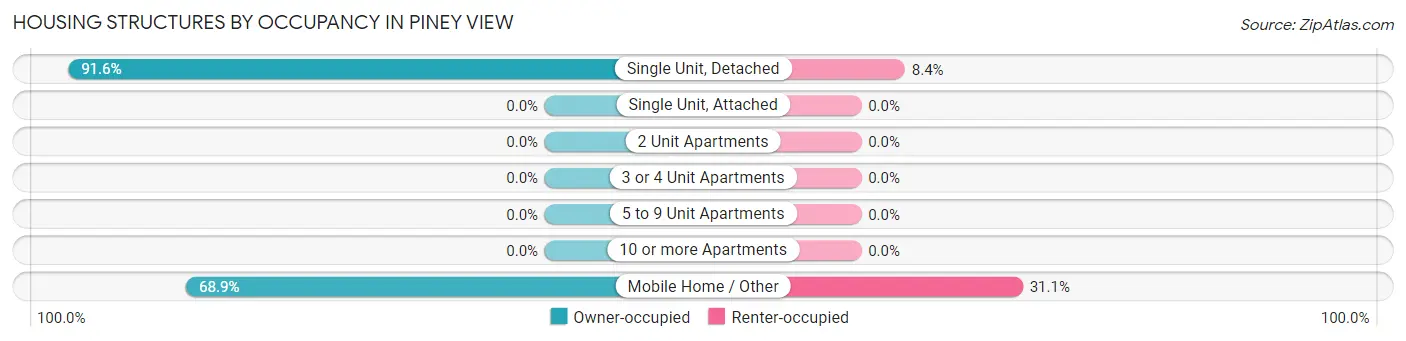
| Structure Type | Owner-occupied | Renter-occupied |
| Single Unit, Detached | 283 (91.6%) | 26 (8.4%) |
| Single Unit, Attached | 0 (0.0%) | 0 (0.0%) |
| 2 Unit Apartments | 0 (0.0%) | 0 (0.0%) |
| 3 or 4 Unit Apartments | 0 (0.0%) | 0 (0.0%) |
| 5 to 9 Unit Apartments | 0 (0.0%) | 0 (0.0%) |
| 10 or more Apartments | 0 (0.0%) | 0 (0.0%) |
| Mobile Home / Other | 31 (68.9%) | 14 (31.1%) |
| Total | 314 (88.7%) | 40 (11.3%) |
Housing Structures by Number of Rooms in Piney View
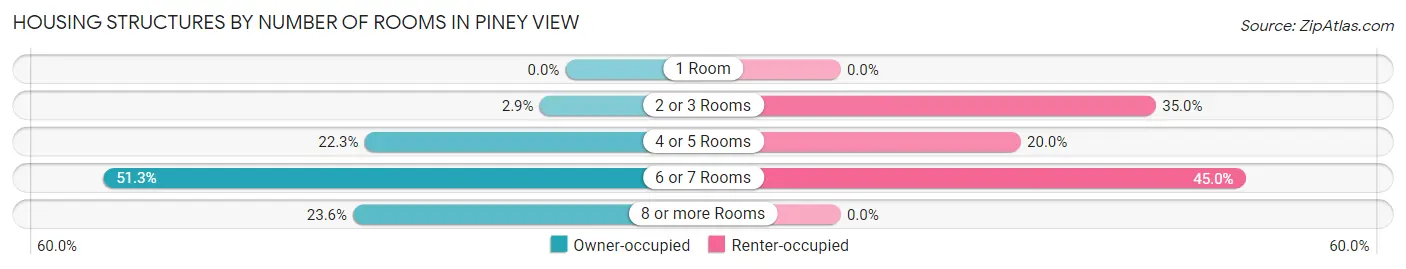
| Number of Rooms | Owner-occupied | Renter-occupied |
| 1 Room | 0 (0.0%) | 0 (0.0%) |
| 2 or 3 Rooms | 9 (2.9%) | 14 (35.0%) |
| 4 or 5 Rooms | 70 (22.3%) | 8 (20.0%) |
| 6 or 7 Rooms | 161 (51.3%) | 18 (45.0%) |
| 8 or more Rooms | 74 (23.6%) | 0 (0.0%) |
| Total | 314 (100.0%) | 40 (100.0%) |
Housing Structure by Heating Type in Piney View
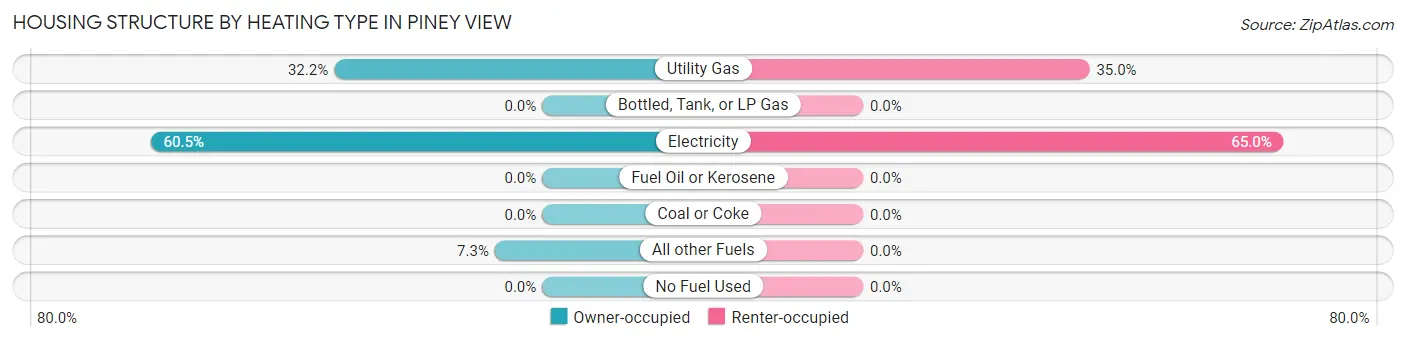
| Heating Type | Owner-occupied | Renter-occupied |
| Utility Gas | 101 (32.2%) | 14 (35.0%) |
| Bottled, Tank, or LP Gas | 0 (0.0%) | 0 (0.0%) |
| Electricity | 190 (60.5%) | 26 (65.0%) |
| Fuel Oil or Kerosene | 0 (0.0%) | 0 (0.0%) |
| Coal or Coke | 0 (0.0%) | 0 (0.0%) |
| All other Fuels | 23 (7.3%) | 0 (0.0%) |
| No Fuel Used | 0 (0.0%) | 0 (0.0%) |
| Total | 314 (100.0%) | 40 (100.0%) |
Household Vehicle Usage in Piney View
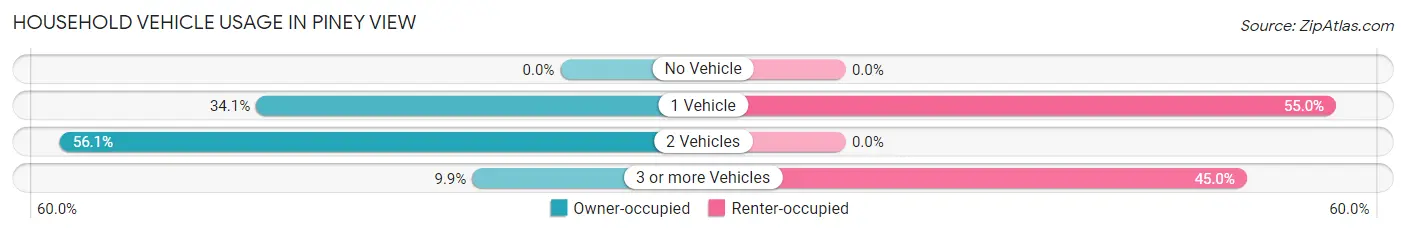
| Vehicles per Household | Owner-occupied | Renter-occupied |
| No Vehicle | 0 (0.0%) | 0 (0.0%) |
| 1 Vehicle | 107 (34.1%) | 22 (55.0%) |
| 2 Vehicles | 176 (56.0%) | 0 (0.0%) |
| 3 or more Vehicles | 31 (9.9%) | 18 (45.0%) |
| Total | 314 (100.0%) | 40 (100.0%) |
Real Estate & Mortgages in Piney View
Real Estate and Mortgage Overview in Piney View
| Characteristic | Without Mortgage | With Mortgage |
| Housing Units | 211 | 103 |
| Median Property Value | $127,100 | $197,100 |
| Median Household Income | $41,705 | $30 |
| Monthly Housing Costs | $321 | $0 |
| Real Estate Taxes | $394 | $0 |
Property Value by Mortgage Status in Piney View
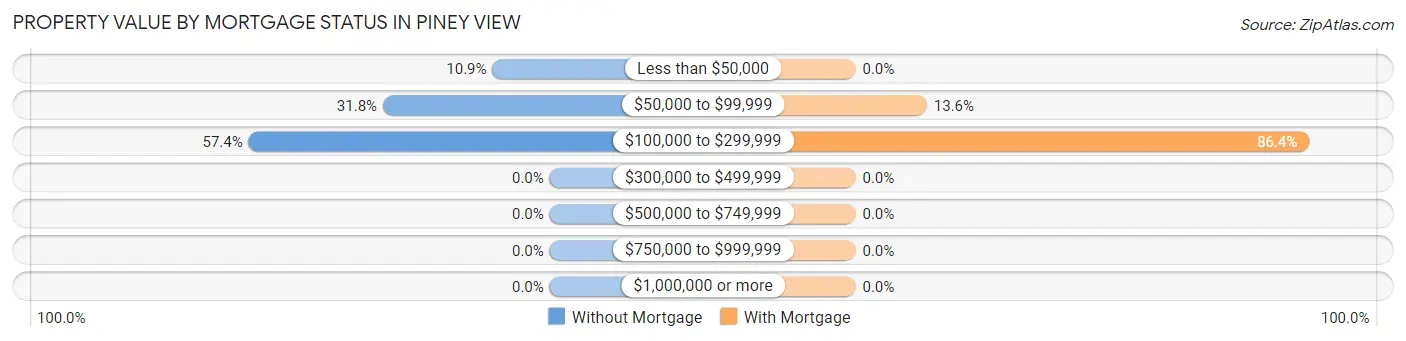
| Property Value | Without Mortgage | With Mortgage |
| Less than $50,000 | 23 (10.9%) | 0 (0.0%) |
| $50,000 to $99,999 | 67 (31.8%) | 14 (13.6%) |
| $100,000 to $299,999 | 121 (57.4%) | 89 (86.4%) |
| $300,000 to $499,999 | 0 (0.0%) | 0 (0.0%) |
| $500,000 to $749,999 | 0 (0.0%) | 0 (0.0%) |
| $750,000 to $999,999 | 0 (0.0%) | 0 (0.0%) |
| $1,000,000 or more | 0 (0.0%) | 0 (0.0%) |
| Total | 211 (100.0%) | 103 (100.0%) |
Household Income by Mortgage Status in Piney View
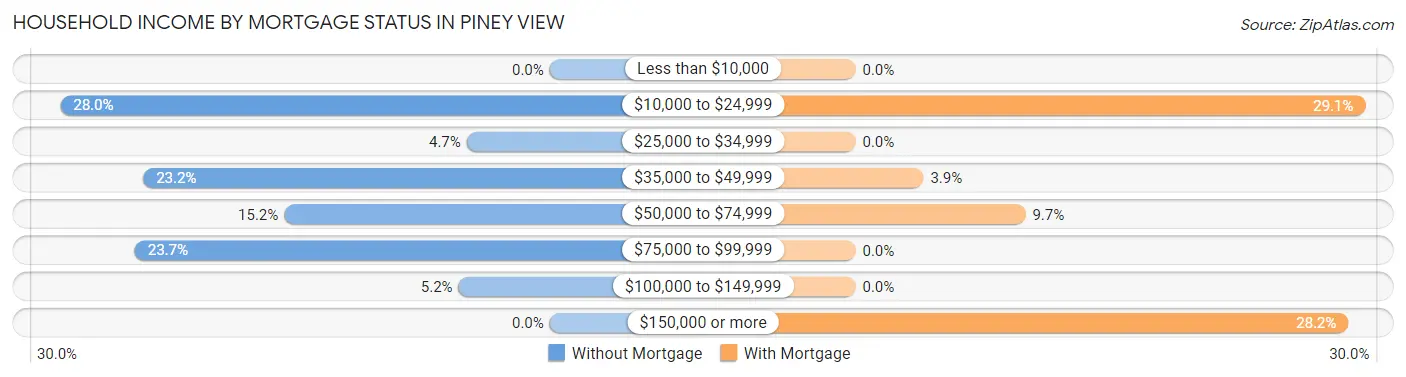
| Household Income | Without Mortgage | With Mortgage |
| Less than $10,000 | 0 (0.0%) | 0 (0.0%) |
| $10,000 to $24,999 | 59 (28.0%) | 30 (29.1%) |
| $25,000 to $34,999 | 10 (4.7%) | 0 (0.0%) |
| $35,000 to $49,999 | 49 (23.2%) | 4 (3.9%) |
| $50,000 to $74,999 | 32 (15.2%) | 10 (9.7%) |
| $75,000 to $99,999 | 50 (23.7%) | 0 (0.0%) |
| $100,000 to $149,999 | 11 (5.2%) | 0 (0.0%) |
| $150,000 or more | 0 (0.0%) | 29 (28.2%) |
| Total | 211 (100.0%) | 103 (100.0%) |
Property Value to Household Income Ratio in Piney View
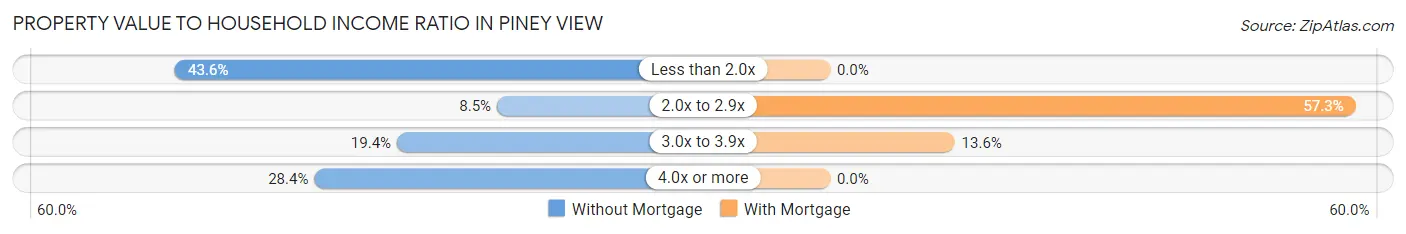
| Value-to-Income Ratio | Without Mortgage | With Mortgage |
| Less than 2.0x | 92 (43.6%) | 0 (0.0%) |
| 2.0x to 2.9x | 18 (8.5%) | 59 (57.3%) |
| 3.0x to 3.9x | 41 (19.4%) | 14 (13.6%) |
| 4.0x or more | 60 (28.4%) | 0 (0.0%) |
| Total | 211 (100.0%) | 103 (100.0%) |
Real Estate Taxes by Mortgage Status in Piney View
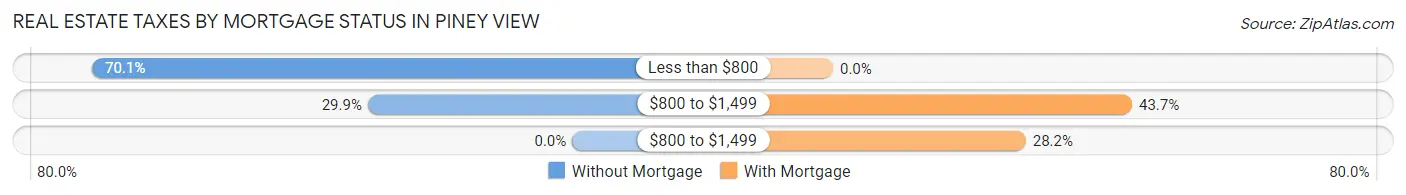
| Property Taxes | Without Mortgage | With Mortgage |
| Less than $800 | 148 (70.1%) | 0 (0.0%) |
| $800 to $1,499 | 63 (29.9%) | 45 (43.7%) |
| $800 to $1,499 | 0 (0.0%) | 29 (28.2%) |
| Total | 211 (100.0%) | 103 (100.0%) |
Health & Disability in Piney View
Health Insurance Coverage by Age in Piney View
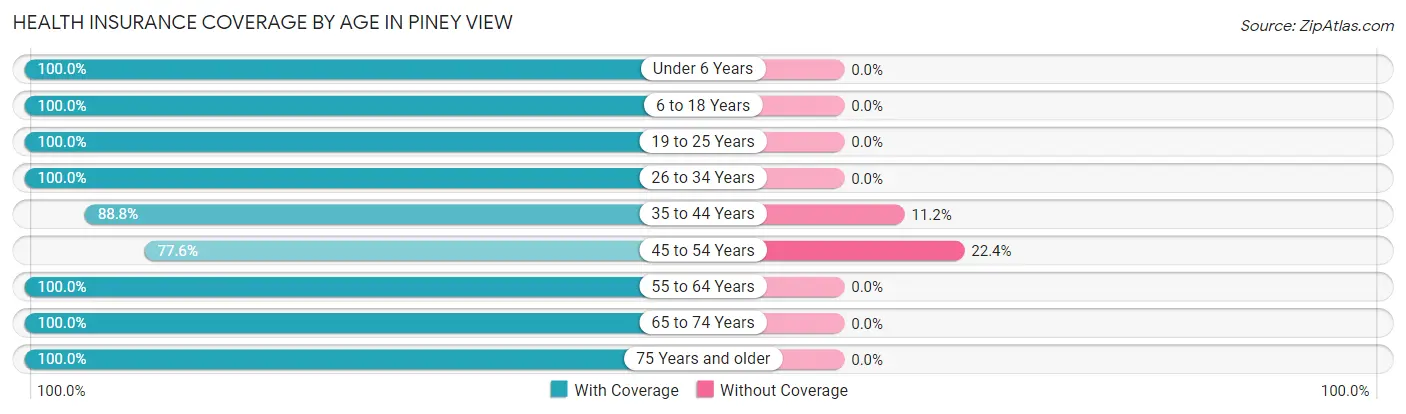
| Age Bracket | With Coverage | Without Coverage |
| Under 6 Years | 63 (100.0%) | 0 (0.0%) |
| 6 to 18 Years | 67 (100.0%) | 0 (0.0%) |
| 19 to 25 Years | 30 (100.0%) | 0 (0.0%) |
| 26 to 34 Years | 35 (100.0%) | 0 (0.0%) |
| 35 to 44 Years | 79 (88.8%) | 10 (11.2%) |
| 45 to 54 Years | 52 (77.6%) | 15 (22.4%) |
| 55 to 64 Years | 85 (100.0%) | 0 (0.0%) |
| 65 to 74 Years | 196 (100.0%) | 0 (0.0%) |
| 75 Years and older | 76 (100.0%) | 0 (0.0%) |
| Total | 683 (96.5%) | 25 (3.5%) |
Health Insurance Coverage by Citizenship Status in Piney View
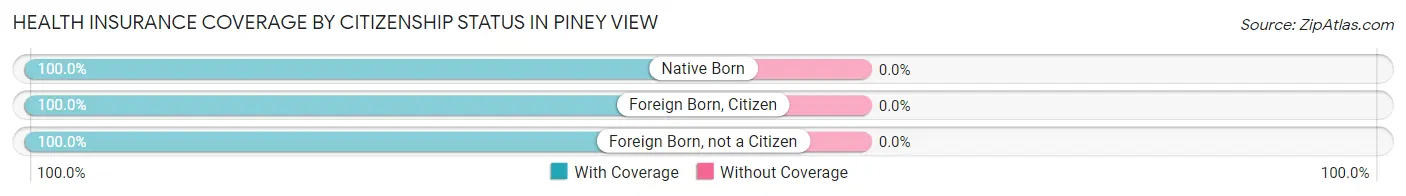
| Citizenship Status | With Coverage | Without Coverage |
| Native Born | 63 (100.0%) | 0 (0.0%) |
| Foreign Born, Citizen | 67 (100.0%) | 0 (0.0%) |
| Foreign Born, not a Citizen | 30 (100.0%) | 0 (0.0%) |
Health Insurance Coverage by Household Income in Piney View
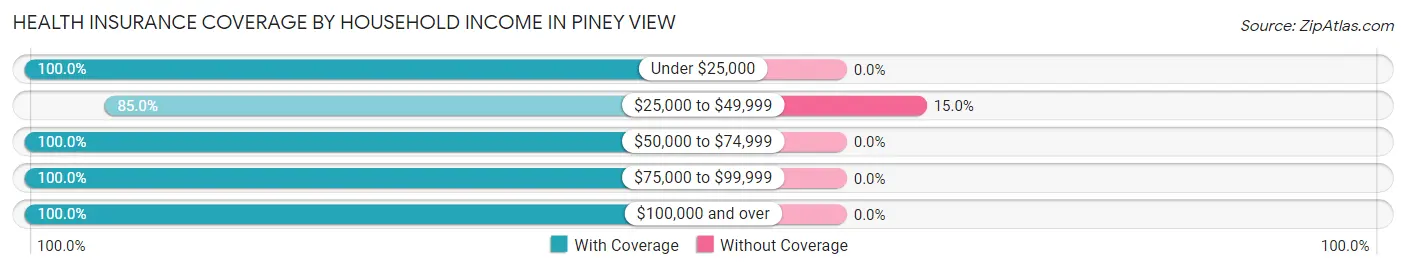
| Household Income | With Coverage | Without Coverage |
| Under $25,000 | 141 (100.0%) | 0 (0.0%) |
| $25,000 to $49,999 | 142 (85.0%) | 25 (15.0%) |
| $50,000 to $74,999 | 97 (100.0%) | 0 (0.0%) |
| $75,000 to $99,999 | 77 (100.0%) | 0 (0.0%) |
| $100,000 and over | 226 (100.0%) | 0 (0.0%) |
Public vs Private Health Insurance Coverage by Age in Piney View
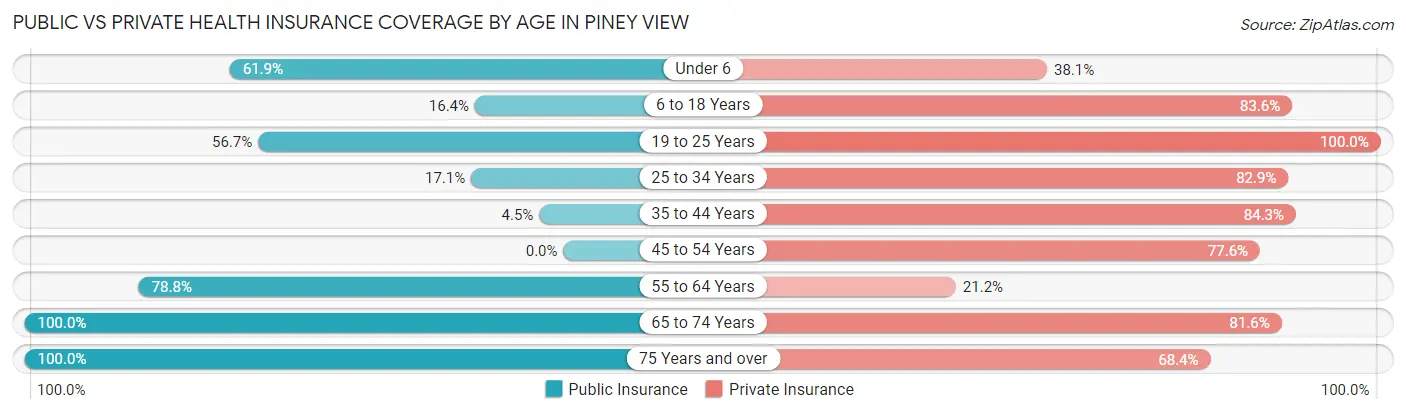
| Age Bracket | Public Insurance | Private Insurance |
| Under 6 | 39 (61.9%) | 24 (38.1%) |
| 6 to 18 Years | 11 (16.4%) | 56 (83.6%) |
| 19 to 25 Years | 17 (56.7%) | 30 (100.0%) |
| 25 to 34 Years | 6 (17.1%) | 29 (82.9%) |
| 35 to 44 Years | 4 (4.5%) | 75 (84.3%) |
| 45 to 54 Years | 0 (0.0%) | 52 (77.6%) |
| 55 to 64 Years | 67 (78.8%) | 18 (21.2%) |
| 65 to 74 Years | 196 (100.0%) | 160 (81.6%) |
| 75 Years and over | 76 (100.0%) | 52 (68.4%) |
| Total | 416 (58.8%) | 496 (70.1%) |
Disability Status by Sex by Age in Piney View
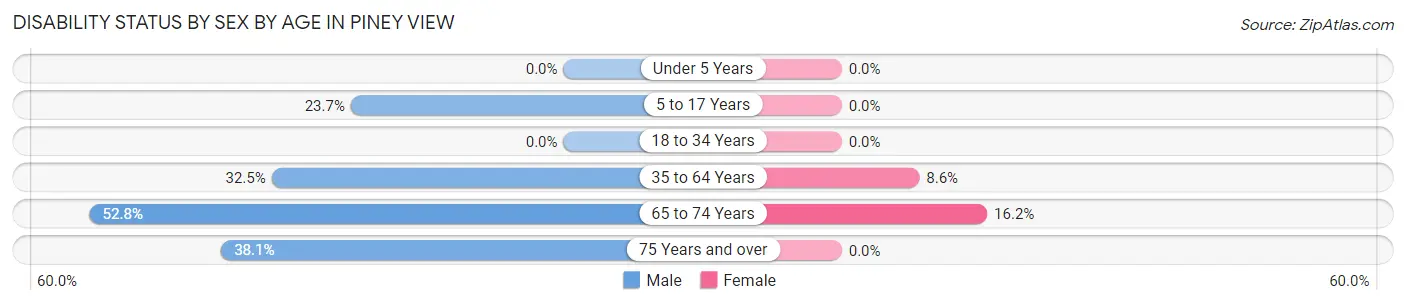
| Age Bracket | Male | Female |
| Under 5 Years | 0 (0.0%) | 0 (0.0%) |
| 5 to 17 Years | 9 (23.7%) | 0 (0.0%) |
| 18 to 34 Years | 0 (0.0%) | 0 (0.0%) |
| 35 to 64 Years | 52 (32.5%) | 7 (8.6%) |
| 65 to 74 Years | 48 (52.7%) | 17 (16.2%) |
| 75 Years and over | 24 (38.1%) | 0 (0.0%) |
Disability Class by Sex by Age in Piney View
Disability Class: Hearing Difficulty
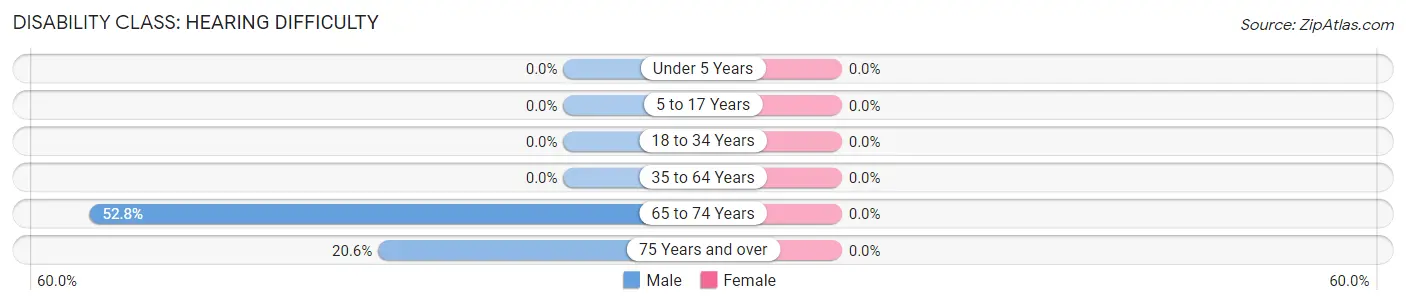
| Age Bracket | Male | Female |
| Under 5 Years | 0 (0.0%) | 0 (0.0%) |
| 5 to 17 Years | 0 (0.0%) | 0 (0.0%) |
| 18 to 34 Years | 0 (0.0%) | 0 (0.0%) |
| 35 to 64 Years | 0 (0.0%) | 0 (0.0%) |
| 65 to 74 Years | 48 (52.7%) | 0 (0.0%) |
| 75 Years and over | 13 (20.6%) | 0 (0.0%) |
Disability Class: Vision Difficulty
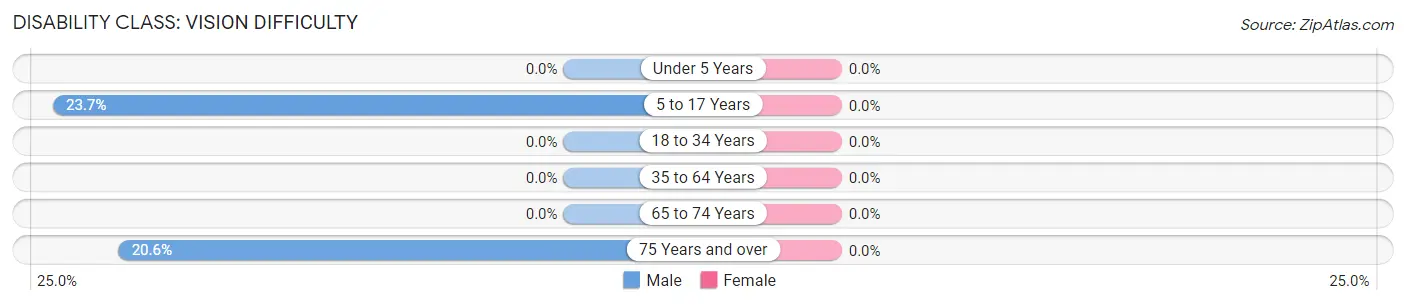
| Age Bracket | Male | Female |
| Under 5 Years | 0 (0.0%) | 0 (0.0%) |
| 5 to 17 Years | 9 (23.7%) | 0 (0.0%) |
| 18 to 34 Years | 0 (0.0%) | 0 (0.0%) |
| 35 to 64 Years | 0 (0.0%) | 0 (0.0%) |
| 65 to 74 Years | 0 (0.0%) | 0 (0.0%) |
| 75 Years and over | 13 (20.6%) | 0 (0.0%) |
Disability Class: Cognitive Difficulty
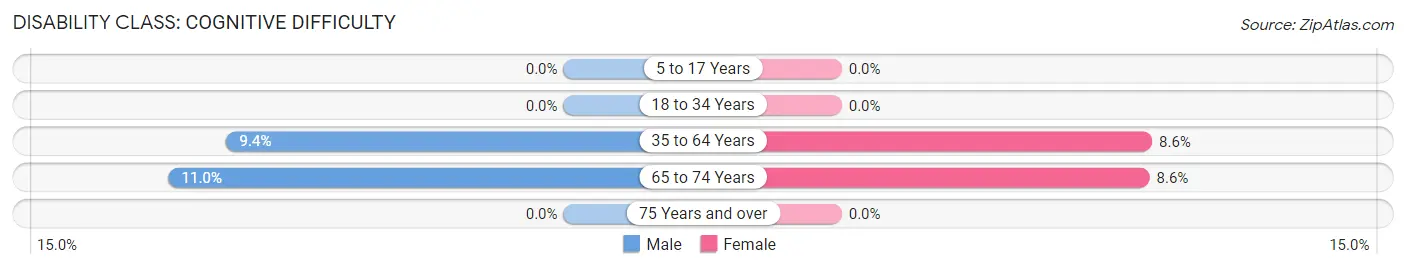
| Age Bracket | Male | Female |
| 5 to 17 Years | 0 (0.0%) | 0 (0.0%) |
| 18 to 34 Years | 0 (0.0%) | 0 (0.0%) |
| 35 to 64 Years | 15 (9.4%) | 7 (8.6%) |
| 65 to 74 Years | 10 (11.0%) | 9 (8.6%) |
| 75 Years and over | 0 (0.0%) | 0 (0.0%) |
Disability Class: Ambulatory Difficulty
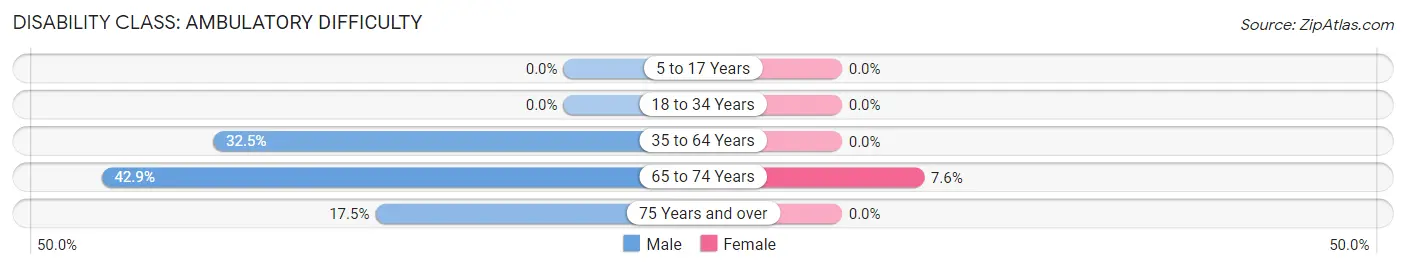
| Age Bracket | Male | Female |
| 5 to 17 Years | 0 (0.0%) | 0 (0.0%) |
| 18 to 34 Years | 0 (0.0%) | 0 (0.0%) |
| 35 to 64 Years | 52 (32.5%) | 0 (0.0%) |
| 65 to 74 Years | 39 (42.9%) | 8 (7.6%) |
| 75 Years and over | 11 (17.5%) | 0 (0.0%) |
Disability Class: Self-Care Difficulty
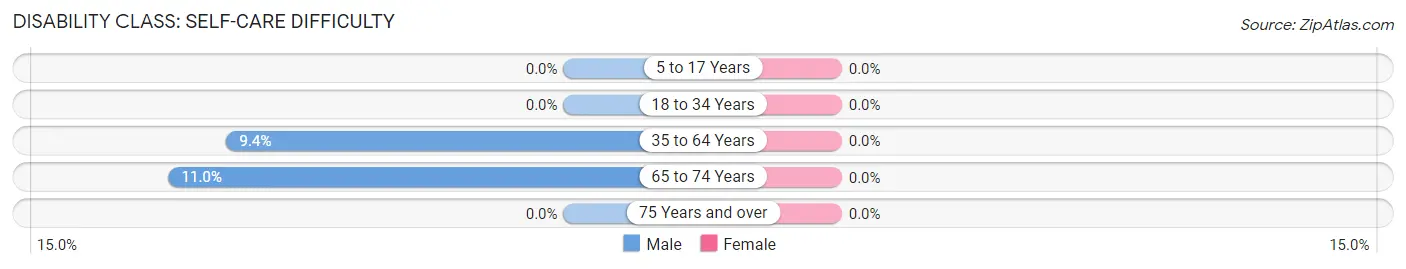
| Age Bracket | Male | Female |
| 5 to 17 Years | 0 (0.0%) | 0 (0.0%) |
| 18 to 34 Years | 0 (0.0%) | 0 (0.0%) |
| 35 to 64 Years | 15 (9.4%) | 0 (0.0%) |
| 65 to 74 Years | 10 (11.0%) | 0 (0.0%) |
| 75 Years and over | 0 (0.0%) | 0 (0.0%) |
Technology Access in Piney View
Computing Device Access in Piney View
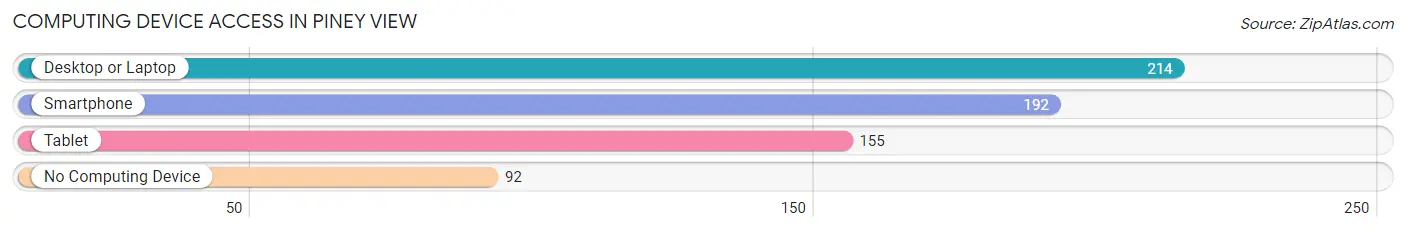
| Device Type | # Households | % Households |
| Desktop or Laptop | 214 | 60.5% |
| Smartphone | 192 | 54.2% |
| Tablet | 155 | 43.8% |
| No Computing Device | 92 | 26.0% |
| Total | 354 | 100.0% |
Internet Access in Piney View
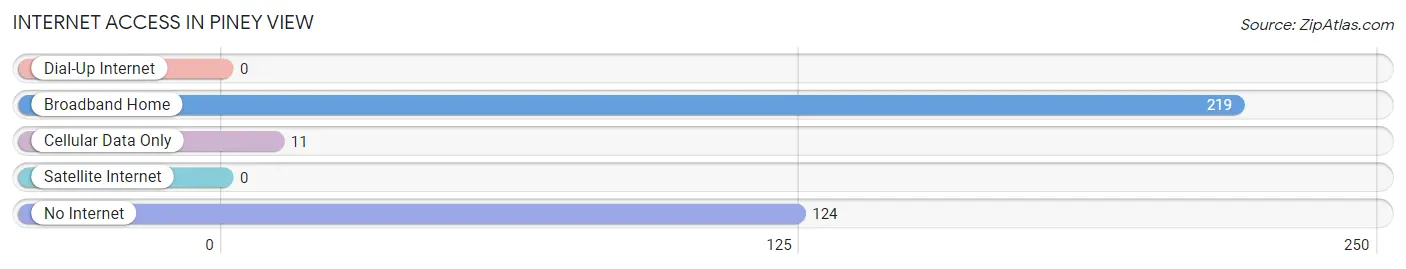
| Internet Type | # Households | % Households |
| Dial-Up Internet | 0 | 0.0% |
| Broadband Home | 219 | 61.9% |
| Cellular Data Only | 11 | 3.1% |
| Satellite Internet | 0 | 0.0% |
| No Internet | 124 | 35.0% |
| Total | 354 | 100.0% |
Piney View Summary
Piney View is an unincorporated community located in Raleigh County, West Virginia. It is situated in the Appalachian Mountains, and is part of the Beckley metropolitan area. The population of Piney View was 1,845 at the 2010 census.
History
Piney View was first settled in the late 1700s by settlers from the nearby town of Beckley. The town was originally known as "Piney Grove" and was named for the abundance of pine trees in the area. The town was officially incorporated in 1891.
In the early 1900s, the town was a major coal mining center. The coal industry provided jobs for many of the town's residents, and the town grew rapidly. By the mid-1900s, the coal industry had declined and the town's population began to decline as well.
Geography
Piney View is located in the Appalachian Mountains of West Virginia. It is situated in Raleigh County, and is part of the Beckley metropolitan area. The town is located at an elevation of 1,845 feet above sea level.
The town is located near the New River, which is a major tributary of the Kanawha River. The town is also located near the Bluestone River, which is a tributary of the New River.
Economy
The economy of Piney View is largely based on the coal industry. The town is home to several coal mines, and many of the town's residents are employed in the coal industry.
In addition to the coal industry, the town is also home to several small businesses. These businesses include restaurants, convenience stores, and other retail establishments.
Demographics
As of the 2010 census, the population of Piney View was 1,845. The racial makeup of the town was 97.3% White, 0.7% African American, 0.2% Native American, 0.2% Asian, 0.1% Pacific Islander, 0.2% from other races, and 1.3% from two or more races. Hispanic or Latino of any race were 0.7% of the population.
The median household income in Piney View was $30,938, and the median family income was $37,813. The per capita income for the town was $15,945. About 17.2% of the population was below the poverty line.
Common Questions
What is Per Capita Income in Piney View?
Per Capita income in Piney View is $34,937.
What is the Median Family Income in Piney View?
Median Family Income in Piney View is $90,425.
What is the Median Household income in Piney View?
Median Household Income in Piney View is $39,781.
What is Income or Wage Gap in Piney View?
Income or Wage Gap in Piney View is 10.2%.
Women in Piney View earn 89.8 cents for every dollar earned by a man.
What is Inequality or Gini Index in Piney View?
Inequality or Gini Index in Piney View is 0.49.
What is the Total Population of Piney View?
Total Population of Piney View is 708.
What is the Total Male Population of Piney View?
Total Male Population of Piney View is 361.
What is the Total Female Population of Piney View?
Total Female Population of Piney View is 347.
What is the Ratio of Males per 100 Females in Piney View?
There are 104.03 Males per 100 Females in Piney View.
What is the Ratio of Females per 100 Males in Piney View?
There are 96.12 Females per 100 Males in Piney View.
What is the Median Population Age in Piney View?
Median Population Age in Piney View is 58.3 Years.
What is the Average Family Size in Piney View
Average Family Size in Piney View is 2.7 People.
What is the Average Household Size in Piney View
Average Household Size in Piney View is 2.0 People.
How Large is the Labor Force in Piney View?
There are 270 People in the Labor Forcein in Piney View.
What is the Percentage of People in the Labor Force in Piney View?
46.7% of People are in the Labor Force in Piney View.
What is the Unemployment Rate in Piney View?
Unemployment Rate in Piney View is 3.7%.