Bayard, WV Map & Demographics
Bayard Map
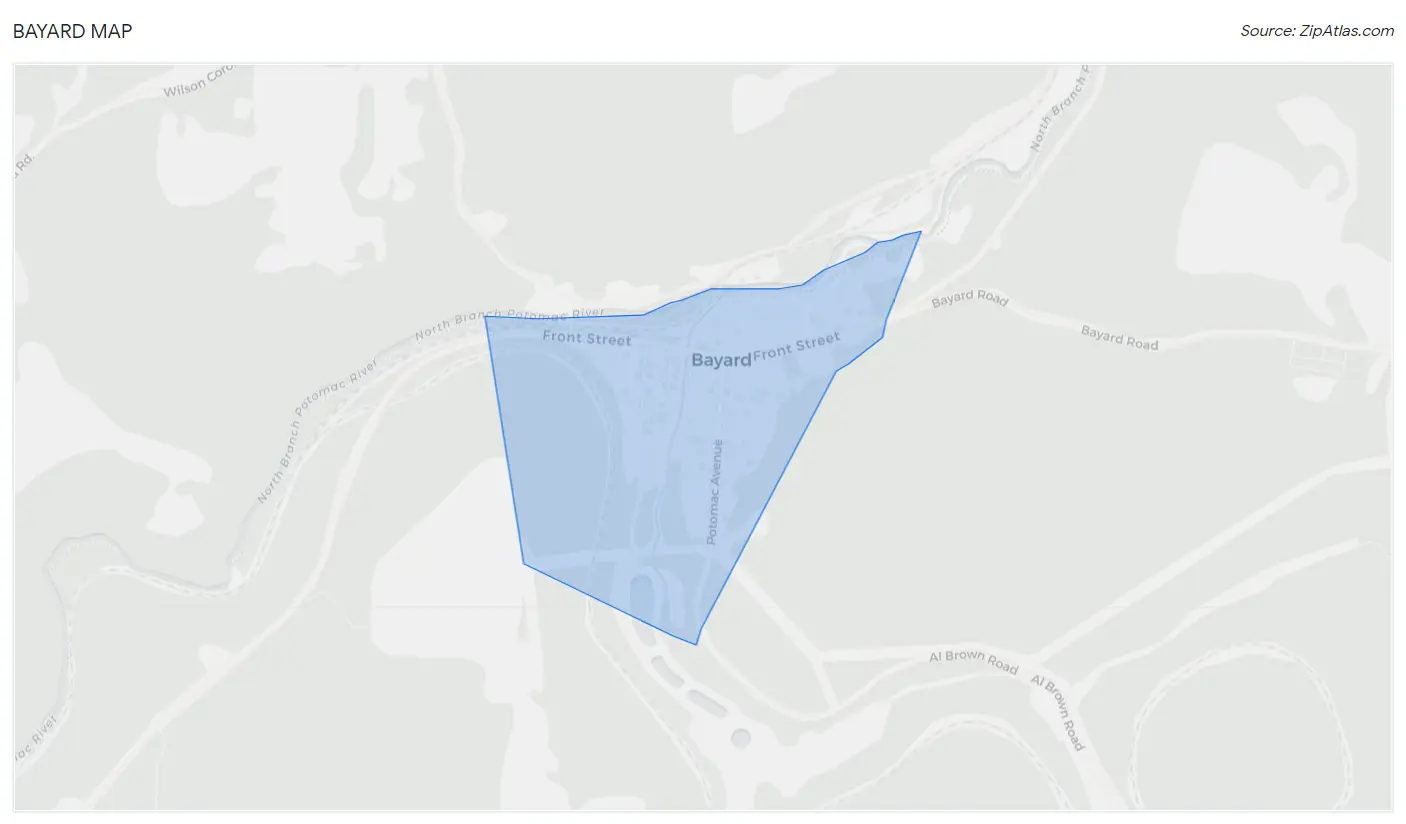
Bayard Overview
$22,870
PER CAPITA INCOME
$65,313
AVG FAMILY INCOME
$26,250
AVG HOUSEHOLD INCOME
0.43
INEQUALITY / GINI INDEX
263
TOTAL POPULATION
136
MALE POPULATION
127
FEMALE POPULATION
107.09
MALES / 100 FEMALES
93.38
FEMALES / 100 MALES
40.6
MEDIAN AGE
3.6
AVG FAMILY SIZE
2.4
AVG HOUSEHOLD SIZE
123
LABOR FORCE [ PEOPLE ]
52.1%
PERCENT IN LABOR FORCE
4.9%
UNEMPLOYMENT RATE
Bayard Zip Codes
Bayard Area Codes
Income in Bayard
Income Overview in Bayard
Per Capita Income in Bayard is $22,870, while median incomes of families and households are $65,313 and $26,250 respectively.
| Characteristic | Number | Measure |
| Per Capita Income | 263 | $22,870 |
| Median Family Income | 49 | $65,313 |
| Mean Family Income | 49 | $67,457 |
| Median Household Income | 109 | $26,250 |
| Mean Household Income | 109 | $43,553 |
| Income Deficit | 49 | $0 |
| Wage / Income Gap (%) | 263 | 0.00% |
| Wage / Income Gap ($) | 263 | 100.00¢ per $1 |
| Gini / Inequality Index | 263 | 0.43 |
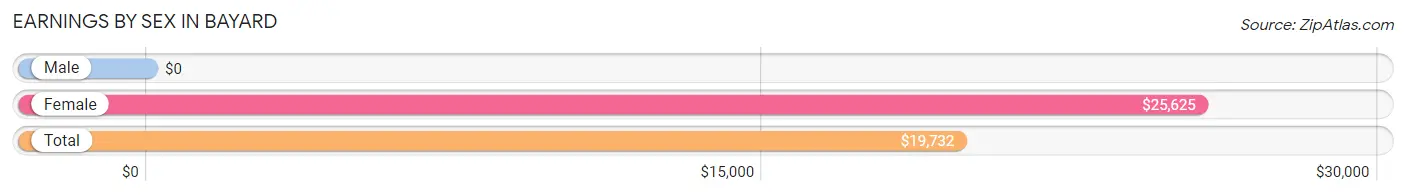
Earnings by Sex in Bayard
| Sex | Number | Average Earnings |
| Male | 91 (71.7%) | $0 |
| Female | 36 (28.3%) | $25,625 |
| Total | 127 (100.0%) | $19,732 |
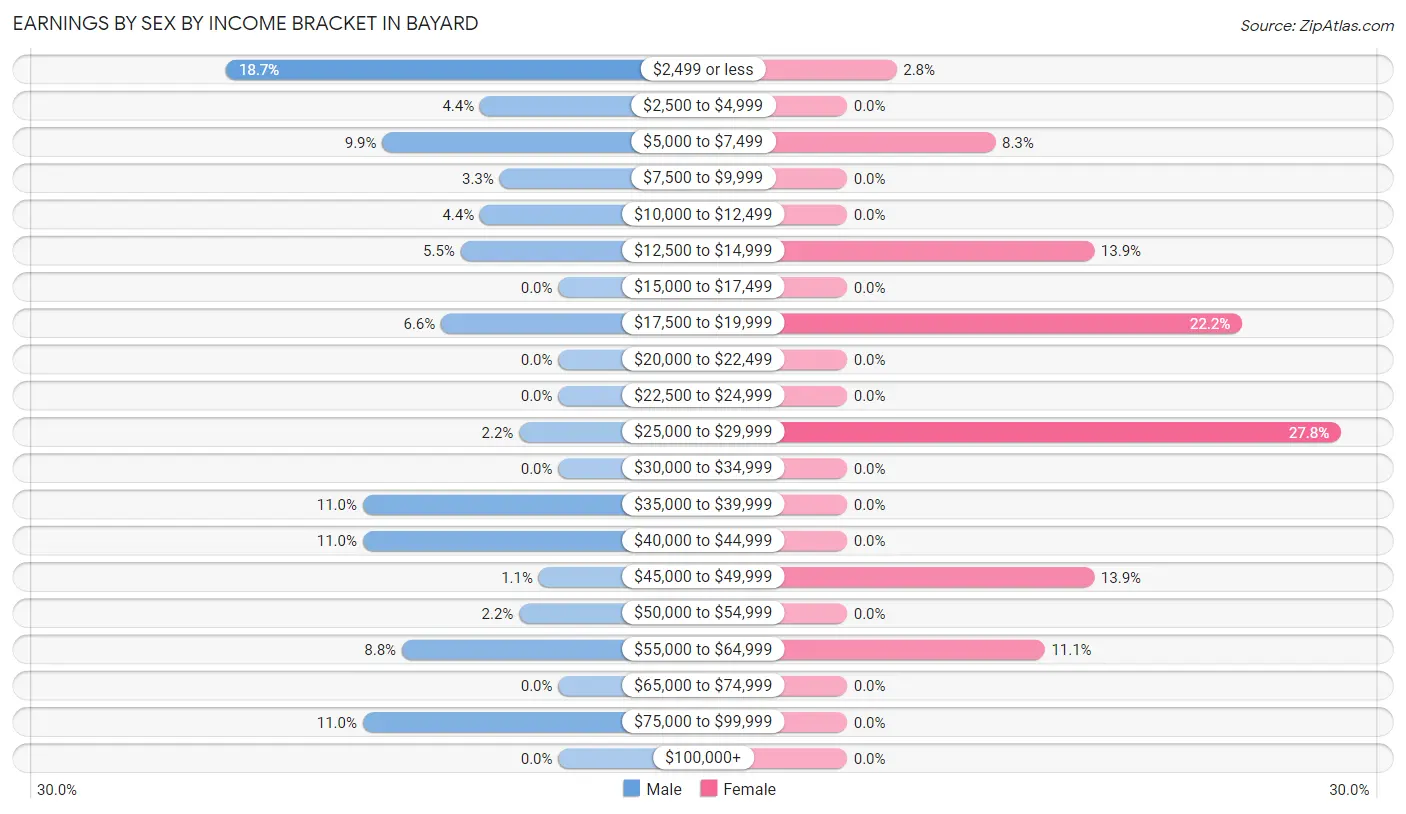
Earnings by Sex by Income Bracket in Bayard
The most common earnings brackets in Bayard are $2,499 or less for men (17 | 18.7%) and $25,000 to $29,999 for women (10 | 27.8%).
| Income | Male | Female |
| $2,499 or less | 17 (18.7%) | 1 (2.8%) |
| $2,500 to $4,999 | 4 (4.4%) | 0 (0.0%) |
| $5,000 to $7,499 | 9 (9.9%) | 3 (8.3%) |
| $7,500 to $9,999 | 3 (3.3%) | 0 (0.0%) |
| $10,000 to $12,499 | 4 (4.4%) | 0 (0.0%) |
| $12,500 to $14,999 | 5 (5.5%) | 5 (13.9%) |
| $15,000 to $17,499 | 0 (0.0%) | 0 (0.0%) |
| $17,500 to $19,999 | 6 (6.6%) | 8 (22.2%) |
| $20,000 to $22,499 | 0 (0.0%) | 0 (0.0%) |
| $22,500 to $24,999 | 0 (0.0%) | 0 (0.0%) |
| $25,000 to $29,999 | 2 (2.2%) | 10 (27.8%) |
| $30,000 to $34,999 | 0 (0.0%) | 0 (0.0%) |
| $35,000 to $39,999 | 10 (11.0%) | 0 (0.0%) |
| $40,000 to $44,999 | 10 (11.0%) | 0 (0.0%) |
| $45,000 to $49,999 | 1 (1.1%) | 5 (13.9%) |
| $50,000 to $54,999 | 2 (2.2%) | 0 (0.0%) |
| $55,000 to $64,999 | 8 (8.8%) | 4 (11.1%) |
| $65,000 to $74,999 | 0 (0.0%) | 0 (0.0%) |
| $75,000 to $99,999 | 10 (11.0%) | 0 (0.0%) |
| $100,000+ | 0 (0.0%) | 0 (0.0%) |
| Total | 91 (100.0%) | 36 (100.0%) |
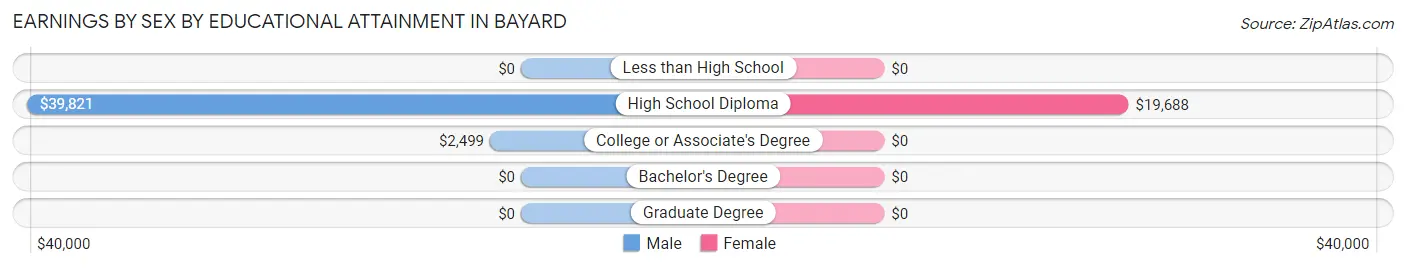
Earnings by Sex by Educational Attainment in Bayard
| Educational Attainment | Male Income | Female Income |
| Less than High School | - | - |
| High School Diploma | $39,821 | $19,688 |
| College or Associate's Degree | $2,499 | $0 |
| Bachelor's Degree | - | - |
| Graduate Degree | - | - |
| Total | - | - |
Family Income in Bayard
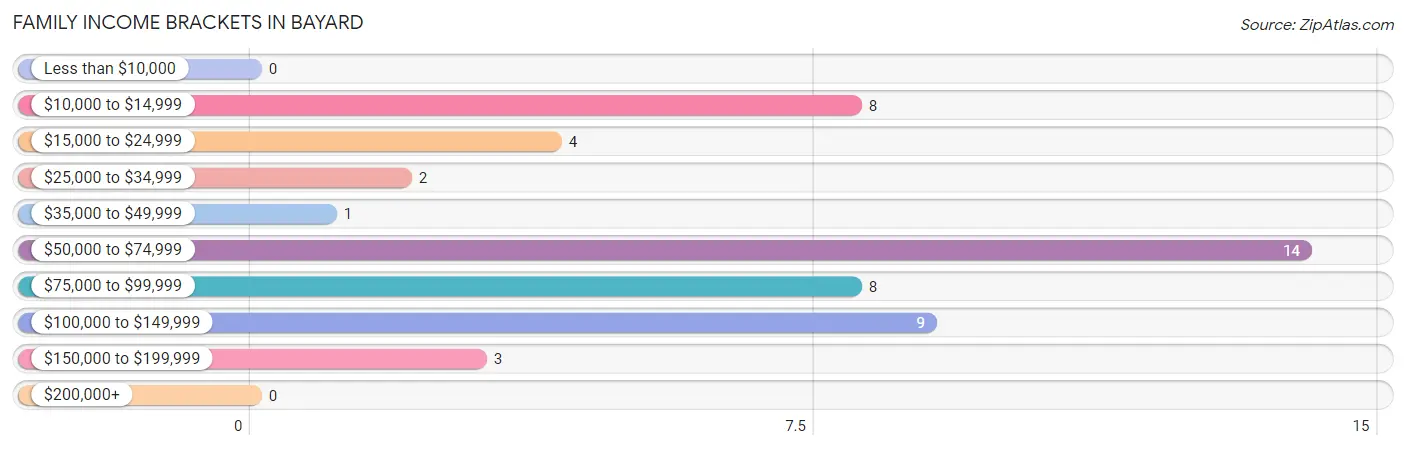
Family Income Brackets in Bayard
According to the Bayard family income data, there are 14 families falling into the $50,000 to $74,999 income range, which is the most common income bracket and makes up 28.6% of all families.
| Income Bracket | # Families | % Families |
| Less than $10,000 | 0 | 0.0% |
| $10,000 to $14,999 | 8 | 16.3% |
| $15,000 to $24,999 | 4 | 8.2% |
| $25,000 to $34,999 | 2 | 4.1% |
| $35,000 to $49,999 | 1 | 2.0% |
| $50,000 to $74,999 | 14 | 28.6% |
| $75,000 to $99,999 | 8 | 16.3% |
| $100,000 to $149,999 | 9 | 18.4% |
| $150,000 to $199,999 | 3 | 6.1% |
| $200,000+ | 0 | 0.0% |
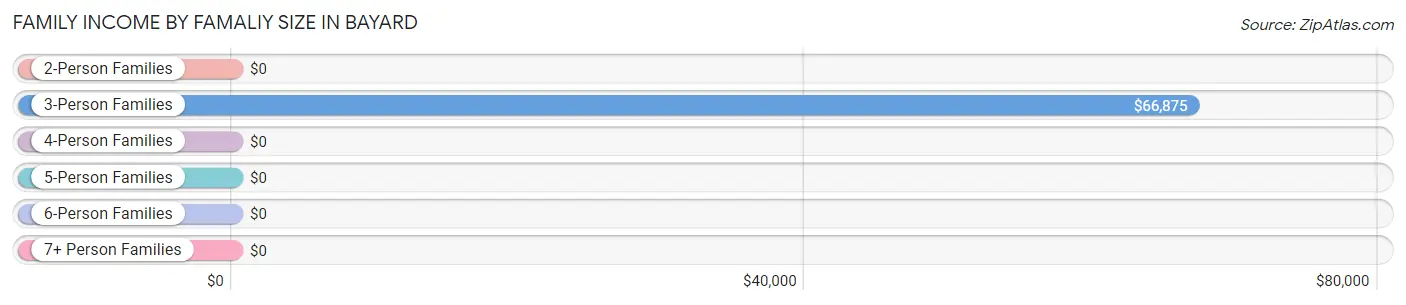
Family Income by Famaliy Size in Bayard
3-person families (16 | 32.7%) account for the highest median family income in Bayard with $66,875 per family, while 3-person families (16 | 32.7%) have the highest median income of $22,292 per family member.
| Income Bracket | # Families | Median Income |
| 2-Person Families | 24 (49.0%) | $0 |
| 3-Person Families | 16 (32.7%) | $66,875 |
| 4-Person Families | 6 (12.2%) | $0 |
| 5-Person Families | 3 (6.1%) | $0 |
| 6-Person Families | 0 (0.0%) | $0 |
| 7+ Person Families | 0 (0.0%) | $0 |
| Total | 49 (100.0%) | $65,313 |
Family Income by Number of Earners in Bayard
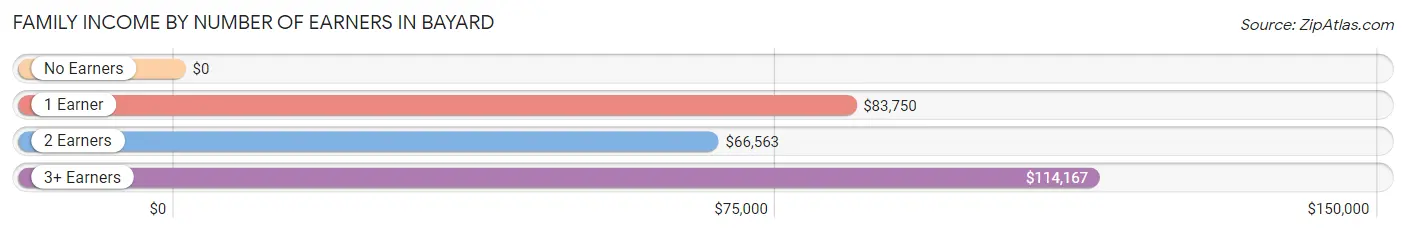
| Number of Earners | # Families | Median Income |
| No Earners | 16 (32.7%) | $0 |
| 1 Earner | 10 (20.4%) | $83,750 |
| 2 Earners | 15 (30.6%) | $66,563 |
| 3+ Earners | 8 (16.3%) | $114,167 |
| Total | 49 (100.0%) | $65,313 |
Household Income in Bayard
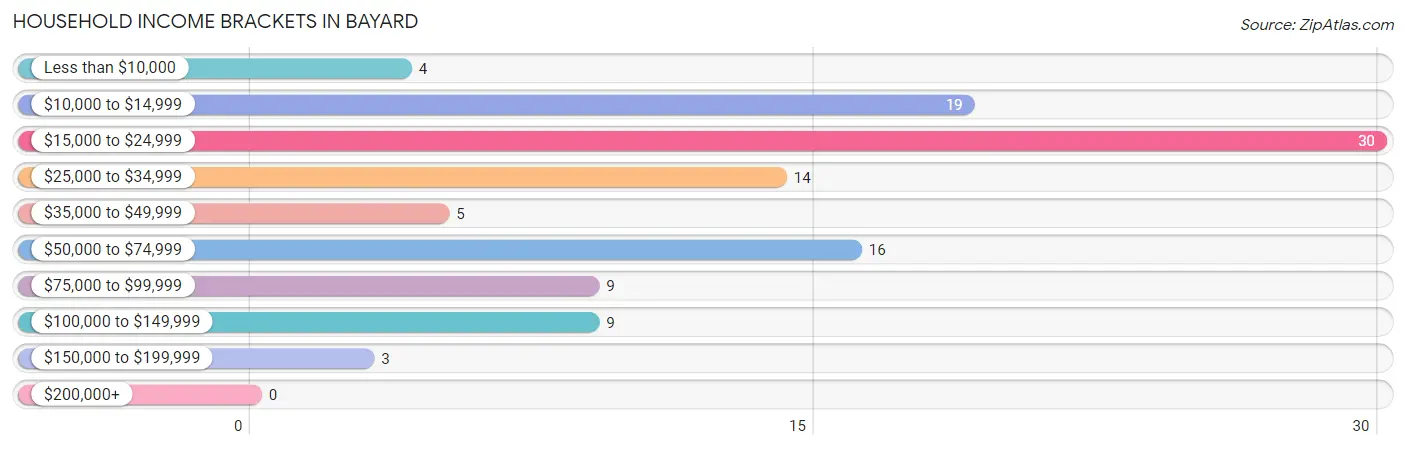
Household Income Brackets in Bayard
With 30 households falling in the category, the $15,000 to $24,999 income range is the most frequent in Bayard, accounting for 27.5% of all households.
| Income Bracket | # Households | % Households |
| Less than $10,000 | 4 | 3.7% |
| $10,000 to $14,999 | 19 | 17.4% |
| $15,000 to $24,999 | 30 | 27.5% |
| $25,000 to $34,999 | 14 | 12.8% |
| $35,000 to $49,999 | 5 | 4.6% |
| $50,000 to $74,999 | 16 | 14.7% |
| $75,000 to $99,999 | 9 | 8.3% |
| $100,000 to $149,999 | 9 | 8.3% |
| $150,000 to $199,999 | 3 | 2.8% |
| $200,000+ | 0 | 0.0% |
Household Income by Householder Age in Bayard
The median household income in Bayard is $26,250, with the highest median household income of $58,250 found in the 25 to 44 years age bracket for the primary householder. A total of 21 households (19.3%) fall into this category. Meanwhile, the 15 to 24 years age bracket for the primary householder has the lowest median household income of $0, with 5 households (4.6%) in this group.
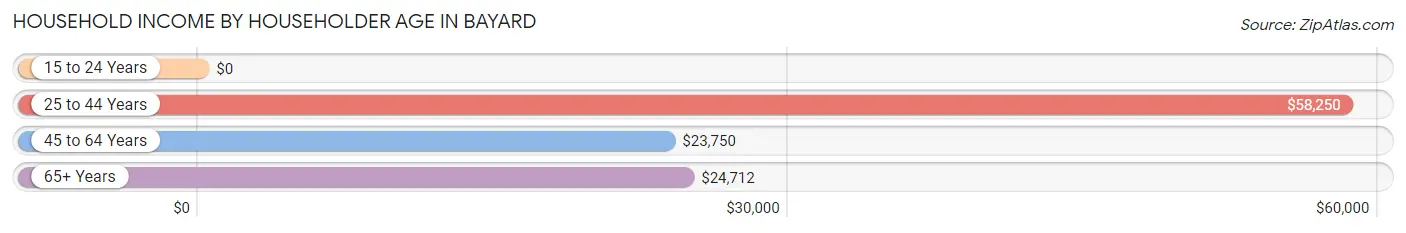
| Income Bracket | # Households | Median Income |
| 15 to 24 Years | 5 (4.6%) | $0 |
| 25 to 44 Years | 21 (19.3%) | $58,250 |
| 45 to 64 Years | 44 (40.4%) | $23,750 |
| 65+ Years | 39 (35.8%) | $24,712 |
| Total | 109 (100.0%) | $26,250 |
Poverty in Bayard
Income Below Poverty by Sex and Age in Bayard
With 32.4% poverty level for males and 38.6% for females among the residents of Bayard, 6 to 11 year old males and 18 to 24 year old females are the most vulnerable to poverty, with 6 males (100.0%) and 12 females (80.0%) in their respective age groups living below the poverty level.
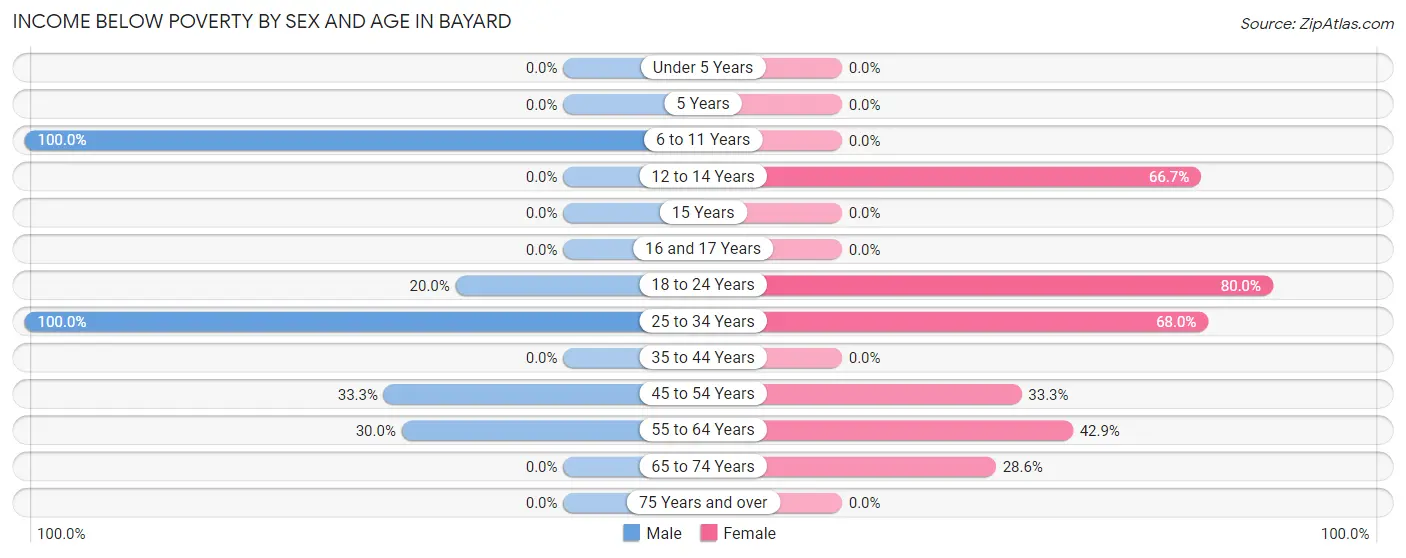
| Age Bracket | Male | Female |
| Under 5 Years | 0 (0.0%) | 0 (0.0%) |
| 5 Years | 0 (0.0%) | 0 (0.0%) |
| 6 to 11 Years | 6 (100.0%) | 0 (0.0%) |
| 12 to 14 Years | 0 (0.0%) | 8 (66.7%) |
| 15 Years | 0 (0.0%) | 0 (0.0%) |
| 16 and 17 Years | 0 (0.0%) | 0 (0.0%) |
| 18 to 24 Years | 2 (20.0%) | 12 (80.0%) |
| 25 to 34 Years | 23 (100.0%) | 17 (68.0%) |
| 35 to 44 Years | 0 (0.0%) | 0 (0.0%) |
| 45 to 54 Years | 7 (33.3%) | 4 (33.3%) |
| 55 to 64 Years | 6 (30.0%) | 6 (42.9%) |
| 65 to 74 Years | 0 (0.0%) | 2 (28.6%) |
| 75 Years and over | 0 (0.0%) | 0 (0.0%) |
| Total | 44 (32.4%) | 49 (38.6%) |
Income Above Poverty by Sex and Age in Bayard
According to the poverty statistics in Bayard, males aged 5 years and females aged 15 years are the age groups that are most secure financially, with 100.0% of males and 100.0% of females in these age groups living above the poverty line.
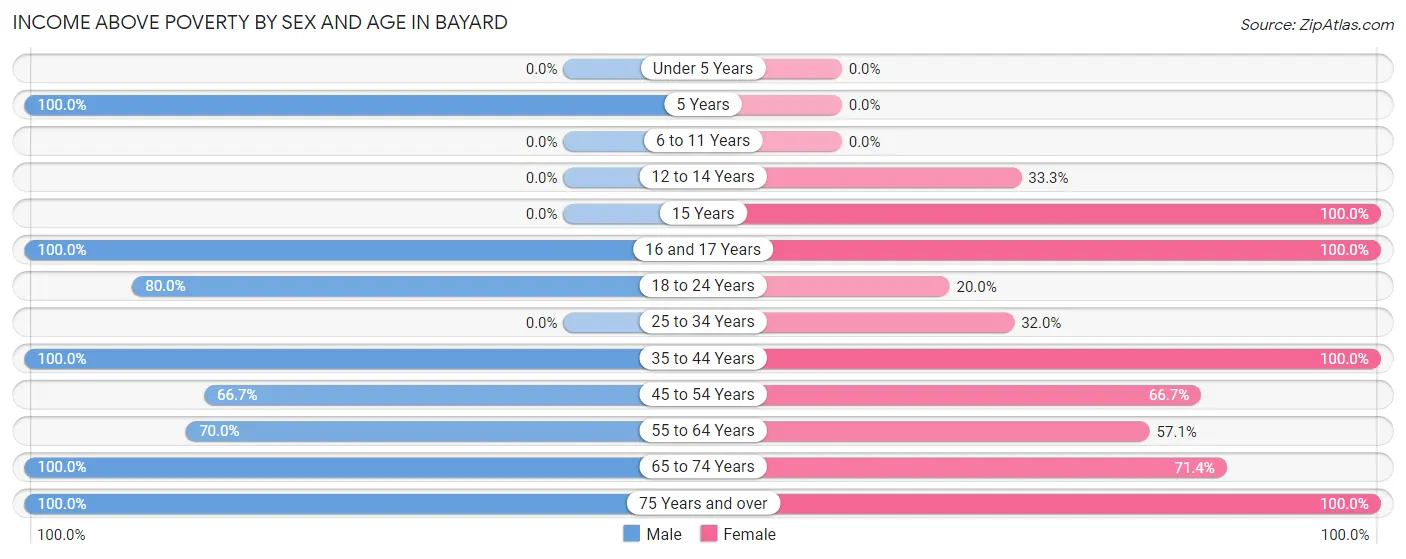
| Age Bracket | Male | Female |
| Under 5 Years | 0 (0.0%) | 0 (0.0%) |
| 5 Years | 5 (100.0%) | 0 (0.0%) |
| 6 to 11 Years | 0 (0.0%) | 0 (0.0%) |
| 12 to 14 Years | 0 (0.0%) | 4 (33.3%) |
| 15 Years | 0 (0.0%) | 4 (100.0%) |
| 16 and 17 Years | 4 (100.0%) | 2 (100.0%) |
| 18 to 24 Years | 8 (80.0%) | 3 (20.0%) |
| 25 to 34 Years | 0 (0.0%) | 8 (32.0%) |
| 35 to 44 Years | 28 (100.0%) | 11 (100.0%) |
| 45 to 54 Years | 14 (66.7%) | 8 (66.7%) |
| 55 to 64 Years | 14 (70.0%) | 8 (57.1%) |
| 65 to 74 Years | 8 (100.0%) | 5 (71.4%) |
| 75 Years and over | 11 (100.0%) | 25 (100.0%) |
| Total | 92 (67.6%) | 78 (61.4%) |
Income Below Poverty Among Married-Couple Families in Bayard
The poverty statistics for married-couple families in Bayard show that 6.1% or 2 of the total 33 families live below the poverty line. Families with no children have the highest poverty rate of 9.5%, comprising of 2 families. On the other hand, families with 1 or 2 children have the lowest poverty rate of 0.0%, which includes 0 families.
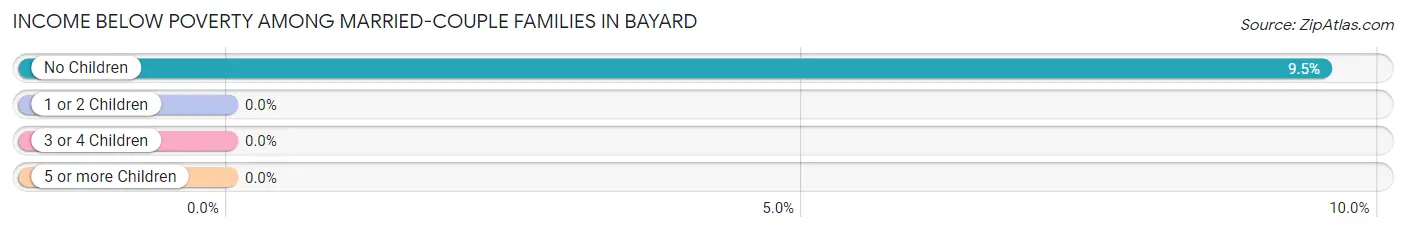
| Children | Above Poverty | Below Poverty |
| No Children | 19 (90.5%) | 2 (9.5%) |
| 1 or 2 Children | 9 (100.0%) | 0 (0.0%) |
| 3 or 4 Children | 3 (100.0%) | 0 (0.0%) |
| 5 or more Children | 0 (0.0%) | 0 (0.0%) |
| Total | 31 (93.9%) | 2 (6.1%) |
Income Below Poverty Among Single-Parent Households in Bayard
According to the poverty data in Bayard, 80.0% or 8 single-father households and 33.3% or 2 single-mother households are living below the poverty line. Among single-father households, those with 3 or 4 children have the highest poverty rate, with 4 households (100.0%) experiencing poverty. Likewise, among single-mother households, those with 1 or 2 children have the highest poverty rate, with 2 households (100.0%) falling below the poverty line.
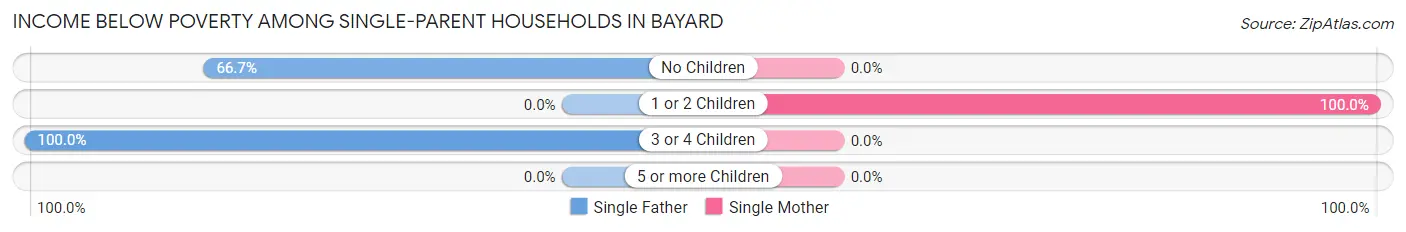
| Children | Single Father | Single Mother |
| No Children | 4 (66.7%) | 0 (0.0%) |
| 1 or 2 Children | 0 (0.0%) | 2 (100.0%) |
| 3 or 4 Children | 4 (100.0%) | 0 (0.0%) |
| 5 or more Children | 0 (0.0%) | 0 (0.0%) |
| Total | 8 (80.0%) | 2 (33.3%) |
Income Below Poverty Among Married-Couple vs Single-Parent Households in Bayard
The poverty data for Bayard shows that 2 of the married-couple family households (6.1%) and 10 of the single-parent households (62.5%) are living below the poverty level. Within the married-couple family households, those with no children have the highest poverty rate, with 2 households (9.5%) falling below the poverty line. Among the single-parent households, those with 1 or 2 children have the highest poverty rate, with 2 household (100.0%) living below poverty.
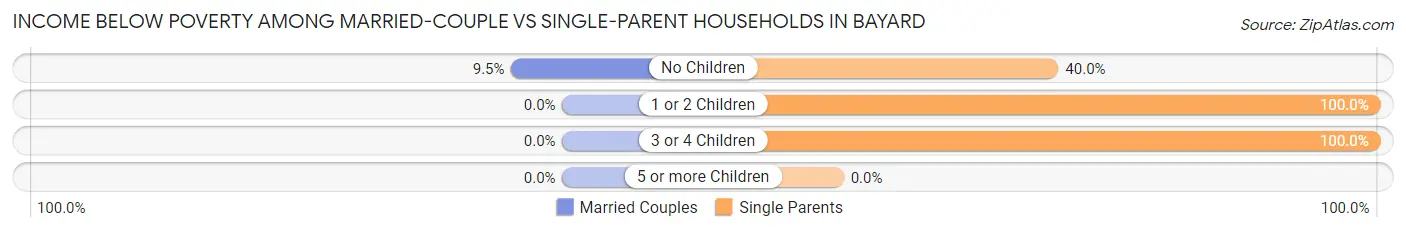
| Children | Married-Couple Families | Single-Parent Households |
| No Children | 2 (9.5%) | 4 (40.0%) |
| 1 or 2 Children | 0 (0.0%) | 2 (100.0%) |
| 3 or 4 Children | 0 (0.0%) | 4 (100.0%) |
| 5 or more Children | 0 (0.0%) | 0 (0.0%) |
| Total | 2 (6.1%) | 10 (62.5%) |
Race in Bayard
The most populous races in Bayard are White / Caucasian (241 | 91.6%), Black / African American (16 | 6.1%), and Two or more Races (4 | 1.5%).
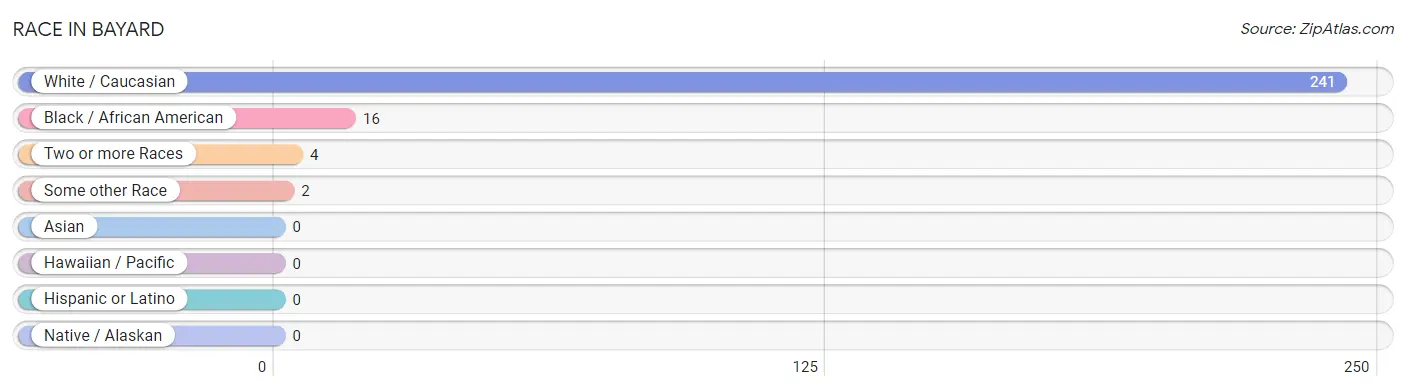
| Race | # Population | % Population |
| Asian | 0 | 0.0% |
| Black / African American | 16 | 6.1% |
| Hawaiian / Pacific | 0 | 0.0% |
| Hispanic or Latino | 0 | 0.0% |
| Native / Alaskan | 0 | 0.0% |
| White / Caucasian | 241 | 91.6% |
| Two or more Races | 4 | 1.5% |
| Some other Race | 2 | 0.8% |
| Total | 263 | 100.0% |
Ancestry in Bayard
The most populous ancestries reported in Bayard are German (119 | 45.3%), American (28 | 10.6%), English (17 | 6.5%), European (13 | 4.9%), and Irish (9 | 3.4%), together accounting for 70.7% of all Bayard residents.
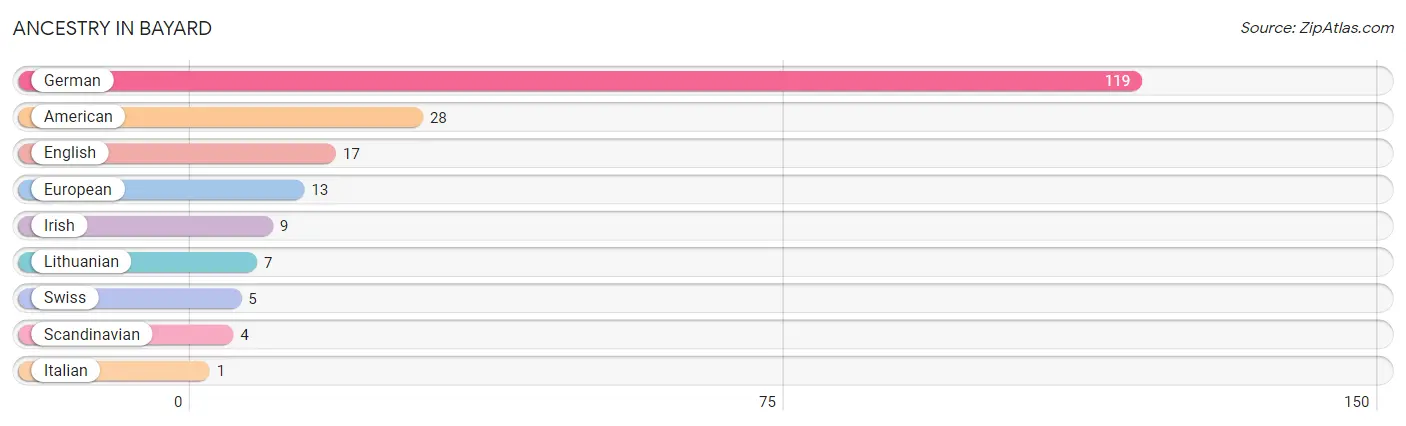
| Ancestry | # Population | % Population |
| American | 28 | 10.6% |
| English | 17 | 6.5% |
| European | 13 | 4.9% |
| German | 119 | 45.3% |
| Irish | 9 | 3.4% |
| Italian | 1 | 0.4% |
| Lithuanian | 7 | 2.7% |
| Scandinavian | 4 | 1.5% |
| Swiss | 5 | 1.9% | View All 9 Rows |
Immigrants in Bayard

| Immigration Origin | # Population | % Population | View All 0 Rows |
Sex and Age in Bayard
Sex and Age in Bayard
The most populous age groups in Bayard are 25 to 29 Years (23 | 16.9%) for men and 30 to 34 Years (25 | 19.7%) for women.
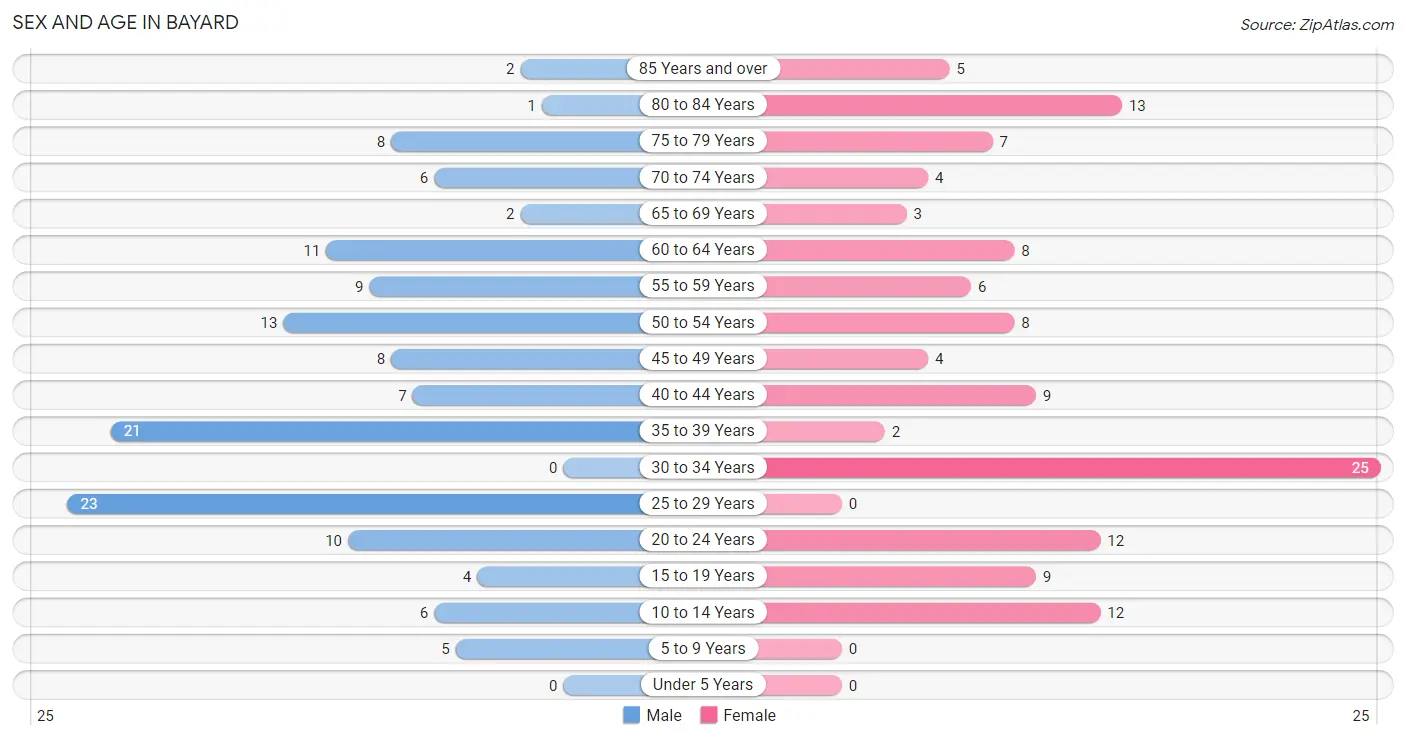
| Age Bracket | Male | Female |
| Under 5 Years | 0 (0.0%) | 0 (0.0%) |
| 5 to 9 Years | 5 (3.7%) | 0 (0.0%) |
| 10 to 14 Years | 6 (4.4%) | 12 (9.5%) |
| 15 to 19 Years | 4 (2.9%) | 9 (7.1%) |
| 20 to 24 Years | 10 (7.3%) | 12 (9.5%) |
| 25 to 29 Years | 23 (16.9%) | 0 (0.0%) |
| 30 to 34 Years | 0 (0.0%) | 25 (19.7%) |
| 35 to 39 Years | 21 (15.4%) | 2 (1.6%) |
| 40 to 44 Years | 7 (5.1%) | 9 (7.1%) |
| 45 to 49 Years | 8 (5.9%) | 4 (3.2%) |
| 50 to 54 Years | 13 (9.6%) | 8 (6.3%) |
| 55 to 59 Years | 9 (6.6%) | 6 (4.7%) |
| 60 to 64 Years | 11 (8.1%) | 8 (6.3%) |
| 65 to 69 Years | 2 (1.5%) | 3 (2.4%) |
| 70 to 74 Years | 6 (4.4%) | 4 (3.2%) |
| 75 to 79 Years | 8 (5.9%) | 7 (5.5%) |
| 80 to 84 Years | 1 (0.7%) | 13 (10.2%) |
| 85 Years and over | 2 (1.5%) | 5 (3.9%) |
| Total | 136 (100.0%) | 127 (100.0%) |
Families and Households in Bayard
Median Family Size in Bayard
The median family size in Bayard is 3.57 persons per family, with single male/father families (10 | 20.4%) accounting for the largest median family size of 4.5 persons per family. On the other hand, single female/mother families (6 | 12.2%) represent the smallest median family size with 3.00 persons per family.
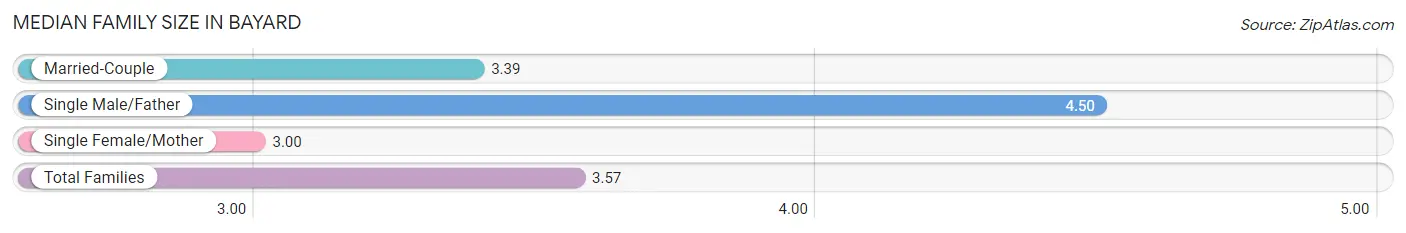
| Family Type | # Families | Family Size |
| Married-Couple | 33 (67.3%) | 3.39 |
| Single Male/Father | 10 (20.4%) | 4.50 |
| Single Female/Mother | 6 (12.2%) | 3.00 |
| Total Families | 49 (100.0%) | 3.57 |
Median Household Size in Bayard
The median household size in Bayard is 2.41 persons per household, with single male/father households (10 | 9.2%) accounting for the largest median household size of 4.8 persons per household. non-family households (60 | 55.0%) represent the smallest median household size with 1.42 persons per household.
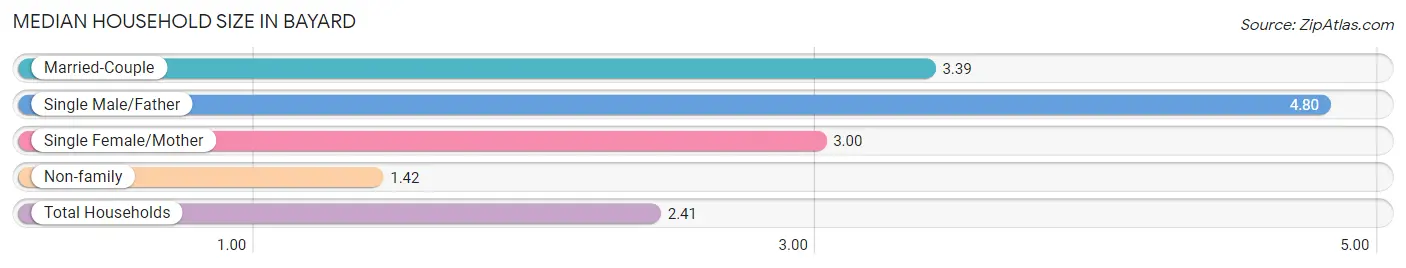
| Household Type | # Households | Household Size |
| Married-Couple | 33 (30.3%) | 3.39 |
| Single Male/Father | 10 (9.2%) | 4.80 |
| Single Female/Mother | 6 (5.5%) | 3.00 |
| Non-family | 60 (55.0%) | 1.42 |
| Total Households | 109 (100.0%) | 2.41 |
Household Size by Marriage Status in Bayard
Out of a total of 109 households in Bayard, 49 (45.0%) are family households, while 60 (55.0%) are nonfamily households. The most numerous type of family households are 2-person households, comprising 20, and the most common type of nonfamily households are 1-person households, comprising 49.
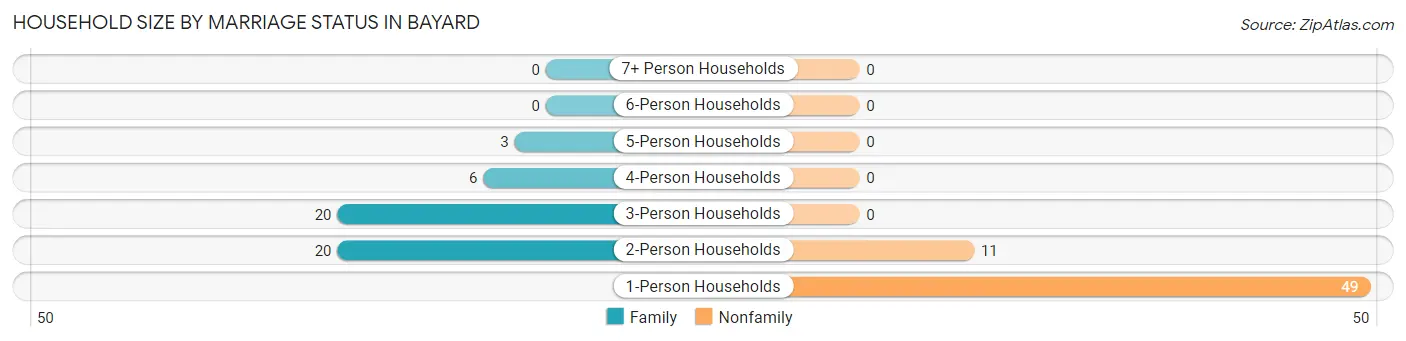
| Household Size | Family Households | Nonfamily Households |
| 1-Person Households | - | 49 (45.0%) |
| 2-Person Households | 20 (18.3%) | 11 (10.1%) |
| 3-Person Households | 20 (18.3%) | 0 (0.0%) |
| 4-Person Households | 6 (5.5%) | 0 (0.0%) |
| 5-Person Households | 3 (2.8%) | 0 (0.0%) |
| 6-Person Households | 0 (0.0%) | 0 (0.0%) |
| 7+ Person Households | 0 (0.0%) | 0 (0.0%) |
| Total | 49 (45.0%) | 60 (55.0%) |
Female Fertility in Bayard
Fertility by Age in Bayard
Average fertility rate in Bayard is 115.0 births per 1,000 women. Women in the age bracket of 20 to 34 years have the highest fertility rate with 189.0 births per 1,000 women. Women in the age bracket of 20 to 34 years acount for 100.0% of all women with births.
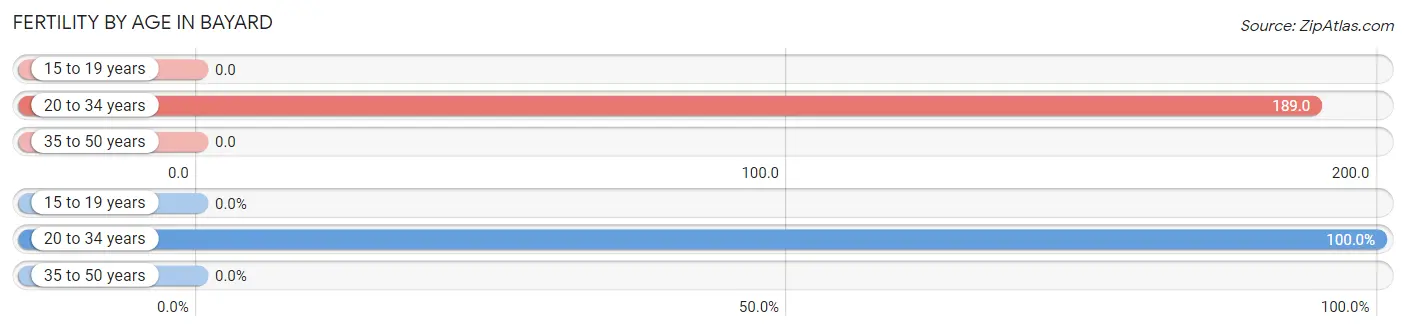
| Age Bracket | Women with Births | Births / 1,000 Women |
| 15 to 19 years | 0 (0.0%) | 0.0 |
| 20 to 34 years | 7 (100.0%) | 189.0 |
| 35 to 50 years | 0 (0.0%) | 0.0 |
| Total | 7 (100.0%) | 115.0 |
Fertility by Age by Marriage Status in Bayard
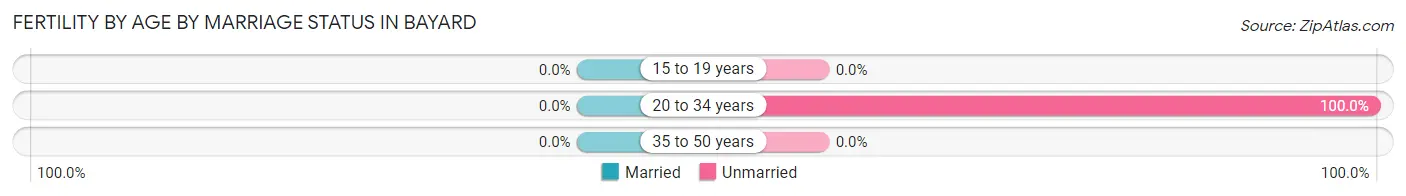
| Age Bracket | Married | Unmarried |
| 15 to 19 years | 0 (0.0%) | 0 (0.0%) |
| 20 to 34 years | 0 (0.0%) | 7 (100.0%) |
| 35 to 50 years | 0 (0.0%) | 0 (0.0%) |
| Total | 0 (0.0%) | 7 (100.0%) |
Fertility by Education in Bayard
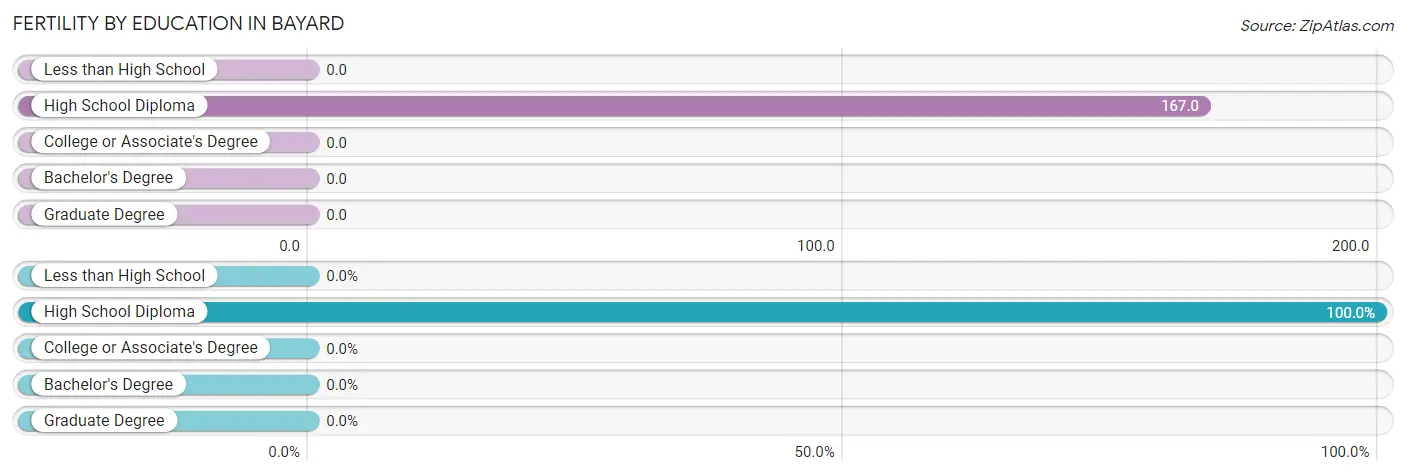
| Educational Attainment | Women with Births | Births / 1,000 Women |
| Less than High School | 0 (0.0%) | 0.0 |
| High School Diploma | 7 (100.0%) | 167.0 |
| College or Associate's Degree | 0 (0.0%) | 0.0 |
| Bachelor's Degree | 0 (0.0%) | 0.0 |
| Graduate Degree | 0 (0.0%) | 0.0 |
| Total | 7 (100.0%) | 115.0 |
Fertility by Education by Marriage Status in Bayard
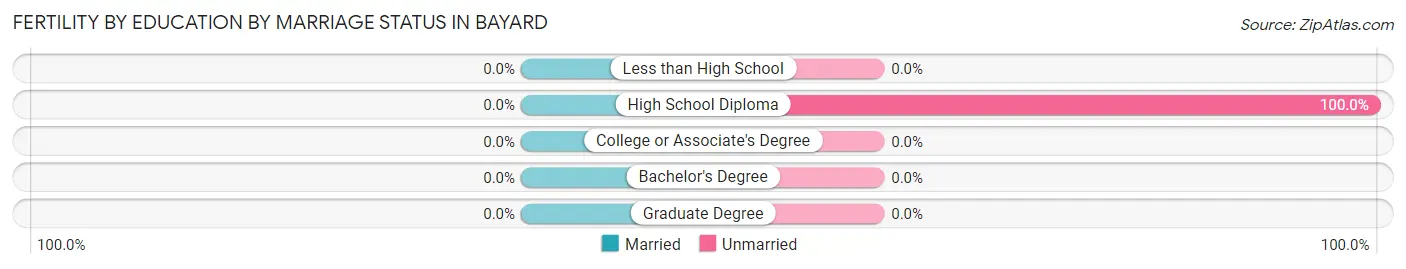
| Educational Attainment | Married | Unmarried |
| Less than High School | 0 (0.0%) | 0 (0.0%) |
| High School Diploma | 0 (0.0%) | 7 (100.0%) |
| College or Associate's Degree | 0 (0.0%) | 0 (0.0%) |
| Bachelor's Degree | 0 (0.0%) | 0 (0.0%) |
| Graduate Degree | 0 (0.0%) | 0 (0.0%) |
| Total | 0 (0.0%) | 7 (100.0%) |
Employment Characteristics in Bayard
Employment by Class of Employer in Bayard
Among the 117 employed individuals in Bayard, private company employees (90 | 76.9%), state government employees (22 | 18.8%), and self-employed (not incorporated) (4 | 3.4%) make up the most common classes of employment.
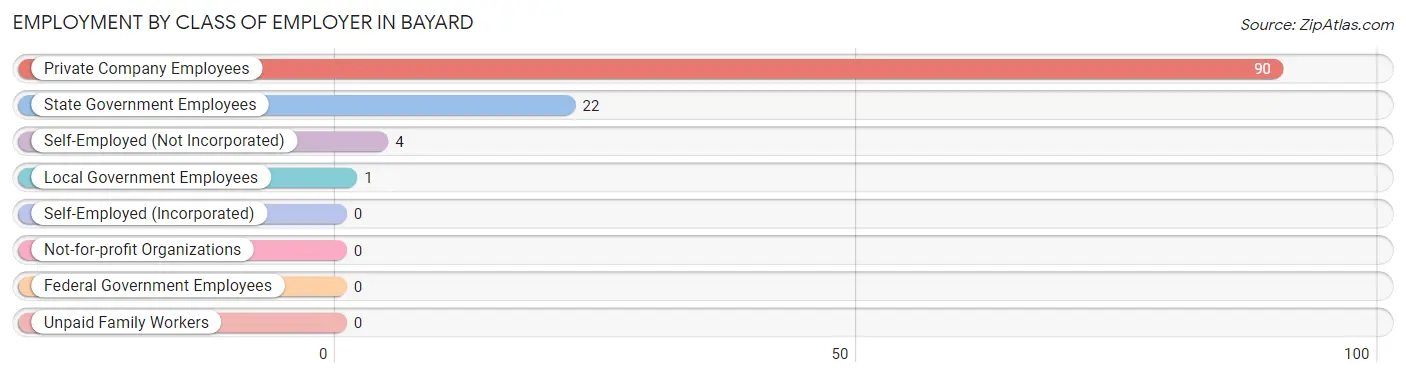
| Employer Class | # Employees | % Employees |
| Private Company Employees | 90 | 76.9% |
| Self-Employed (Incorporated) | 0 | 0.0% |
| Self-Employed (Not Incorporated) | 4 | 3.4% |
| Not-for-profit Organizations | 0 | 0.0% |
| Local Government Employees | 1 | 0.9% |
| State Government Employees | 22 | 18.8% |
| Federal Government Employees | 0 | 0.0% |
| Unpaid Family Workers | 0 | 0.0% |
| Total | 117 | 100.0% |
Employment Status by Age in Bayard
According to the labor force statistics for Bayard, out of the total population over 16 years of age (236), 52.1% or 123 individuals are in the labor force, with 4.9% or 6 of them unemployed. The age group with the highest labor force participation rate is 25 to 29 years, with 100.0% or 23 individuals in the labor force. Within the labor force, the 20 to 24 years age range has the highest percentage of unemployed individuals, with 46.2% or 6 of them being unemployed.
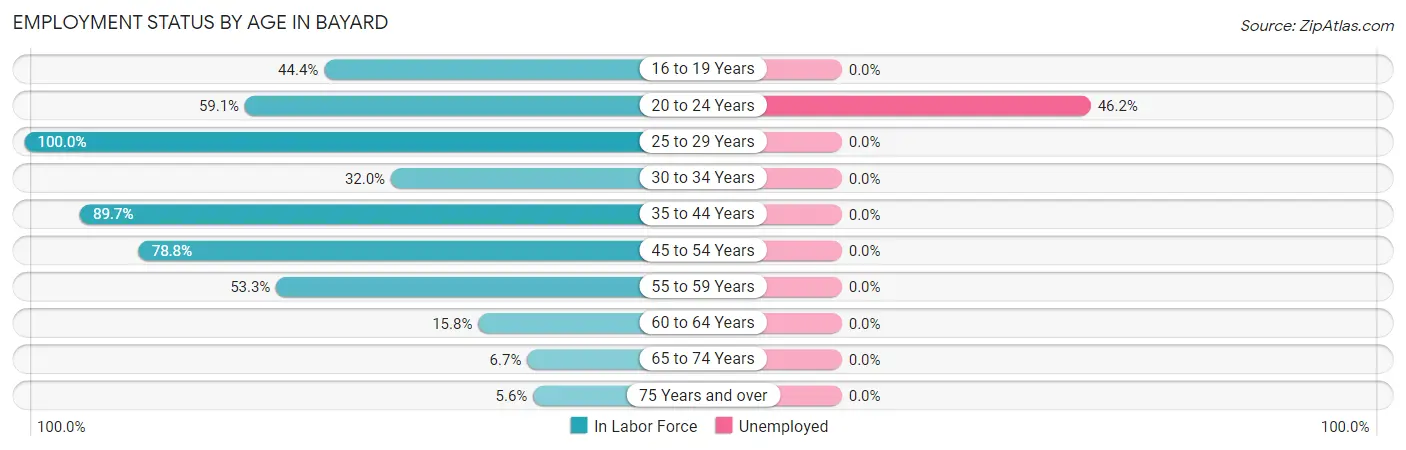
| Age Bracket | In Labor Force | Unemployed |
| 16 to 19 Years | 4 (44.4%) | 0 (0.0%) |
| 20 to 24 Years | 13 (59.1%) | 6 (46.2%) |
| 25 to 29 Years | 23 (100.0%) | 0 (0.0%) |
| 30 to 34 Years | 8 (32.0%) | 0 (0.0%) |
| 35 to 44 Years | 35 (89.7%) | 0 (0.0%) |
| 45 to 54 Years | 26 (78.8%) | 0 (0.0%) |
| 55 to 59 Years | 8 (53.3%) | 0 (0.0%) |
| 60 to 64 Years | 3 (15.8%) | 0 (0.0%) |
| 65 to 74 Years | 1 (6.7%) | 0 (0.0%) |
| 75 Years and over | 2 (5.6%) | 0 (0.0%) |
| Total | 123 (52.1%) | 6 (4.9%) |
Employment Status by Educational Attainment in Bayard
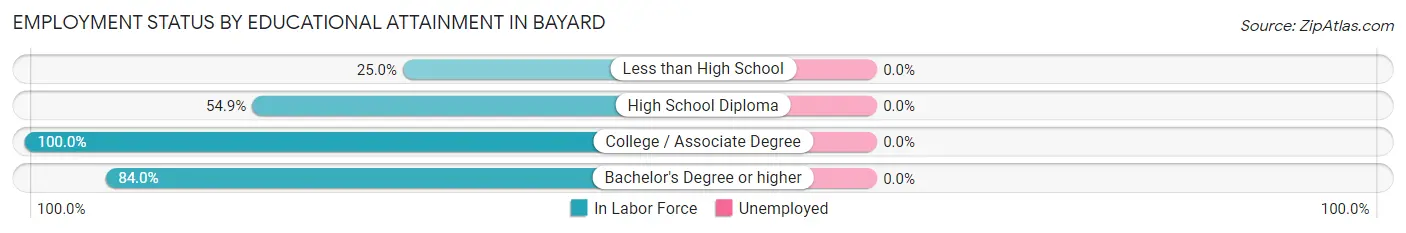
| Educational Attainment | In Labor Force | Unemployed |
| Less than High School | 2 (25.0%) | 0 (0.0%) |
| High School Diploma | 50 (54.9%) | 0 (0.0%) |
| College / Associate Degree | 30 (100.0%) | 0 (0.0%) |
| Bachelor's Degree or higher | 21 (84.0%) | 0 (0.0%) |
| Total | 103 (66.9%) | 0 (0.0%) |
Employment Occupations by Sex in Bayard
Management, Business, Science and Arts Occupations
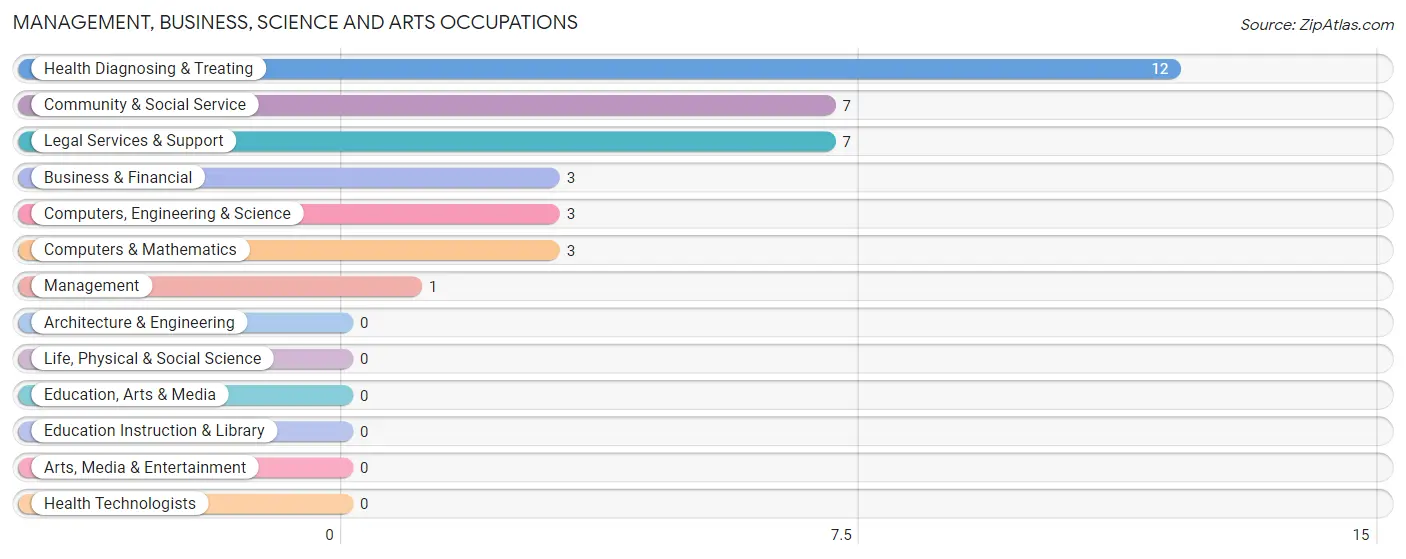
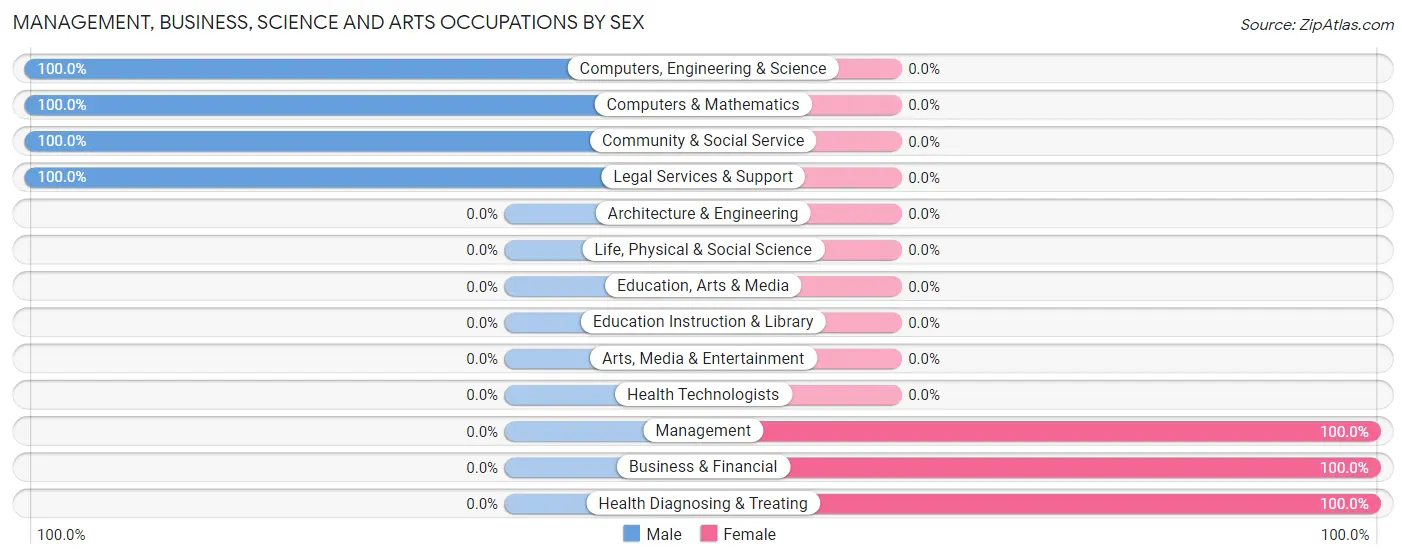
The most common Management, Business, Science and Arts occupations in Bayard are Health Diagnosing & Treating (12 | 10.3%), Community & Social Service (7 | 6.0%), Legal Services & Support (7 | 6.0%), Business & Financial (3 | 2.6%), and Computers, Engineering & Science (3 | 2.6%).
Management, Business, Science and Arts Occupations by Sex
Within the Management, Business, Science and Arts occupations in Bayard, the most male-oriented occupations are Computers, Engineering & Science (100.0%), Computers & Mathematics (100.0%), and Community & Social Service (100.0%), while the most female-oriented occupations are Management (100.0%), Business & Financial (100.0%), and Health Diagnosing & Treating (100.0%).
| Occupation | Male | Female |
| Management | 0 (0.0%) | 1 (100.0%) |
| Business & Financial | 0 (0.0%) | 3 (100.0%) |
| Computers, Engineering & Science | 3 (100.0%) | 0 (0.0%) |
| Computers & Mathematics | 3 (100.0%) | 0 (0.0%) |
| Architecture & Engineering | 0 (0.0%) | 0 (0.0%) |
| Life, Physical & Social Science | 0 (0.0%) | 0 (0.0%) |
| Community & Social Service | 7 (100.0%) | 0 (0.0%) |
| Education, Arts & Media | 0 (0.0%) | 0 (0.0%) |
| Legal Services & Support | 7 (100.0%) | 0 (0.0%) |
| Education Instruction & Library | 0 (0.0%) | 0 (0.0%) |
| Arts, Media & Entertainment | 0 (0.0%) | 0 (0.0%) |
| Health Diagnosing & Treating | 0 (0.0%) | 12 (100.0%) |
| Health Technologists | 0 (0.0%) | 0 (0.0%) |
| Total (Category) | 10 (38.5%) | 16 (61.5%) |
| Total (Overall) | 81 (69.2%) | 36 (30.8%) |
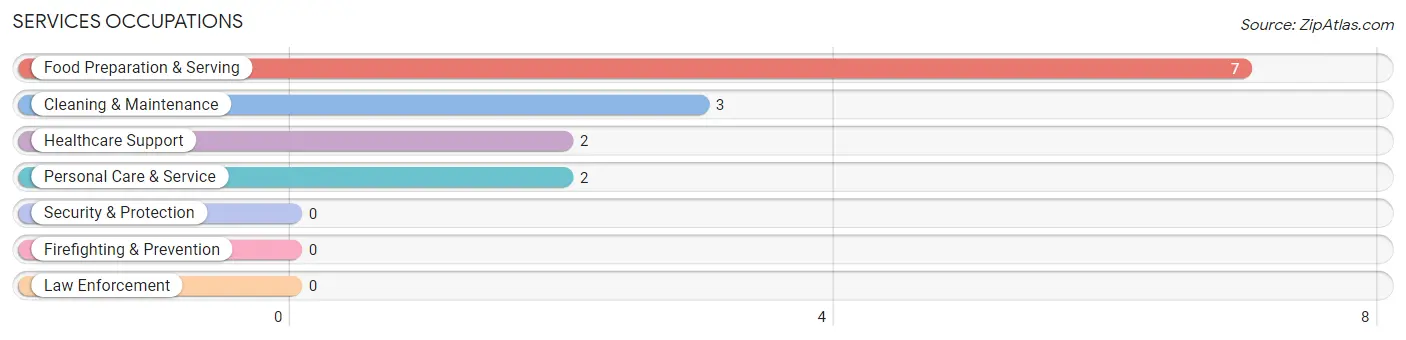
Services Occupations
The most common Services occupations in Bayard are Food Preparation & Serving (7 | 6.0%), Cleaning & Maintenance (3 | 2.6%), Healthcare Support (2 | 1.7%), and Personal Care & Service (2 | 1.7%).
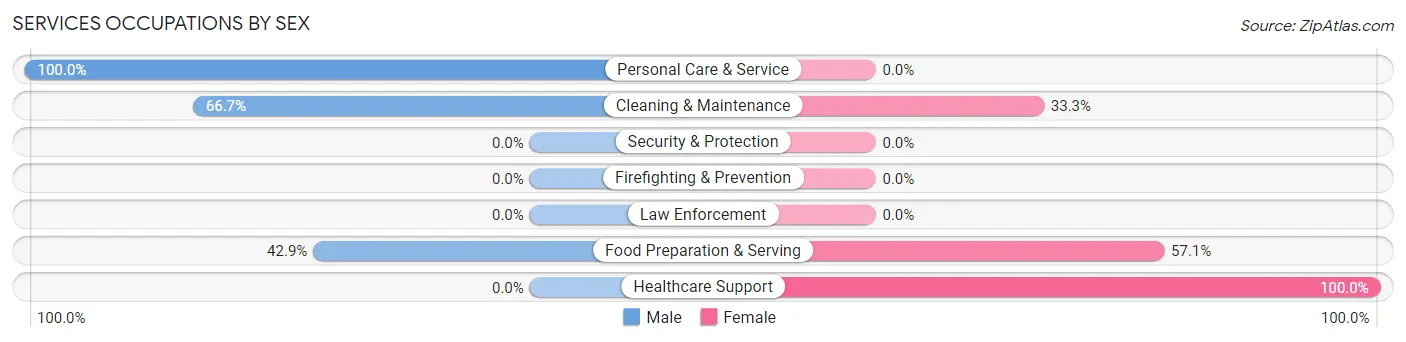
Services Occupations by Sex
Within the Services occupations in Bayard, the most male-oriented occupations are Personal Care & Service (100.0%), Cleaning & Maintenance (66.7%), and Food Preparation & Serving (42.9%), while the most female-oriented occupations are Healthcare Support (100.0%), Food Preparation & Serving (57.1%), and Cleaning & Maintenance (33.3%).
| Occupation | Male | Female |
| Healthcare Support | 0 (0.0%) | 2 (100.0%) |
| Security & Protection | 0 (0.0%) | 0 (0.0%) |
| Firefighting & Prevention | 0 (0.0%) | 0 (0.0%) |
| Law Enforcement | 0 (0.0%) | 0 (0.0%) |
| Food Preparation & Serving | 3 (42.9%) | 4 (57.1%) |
| Cleaning & Maintenance | 2 (66.7%) | 1 (33.3%) |
| Personal Care & Service | 2 (100.0%) | 0 (0.0%) |
| Total (Category) | 7 (50.0%) | 7 (50.0%) |
| Total (Overall) | 81 (69.2%) | 36 (30.8%) |
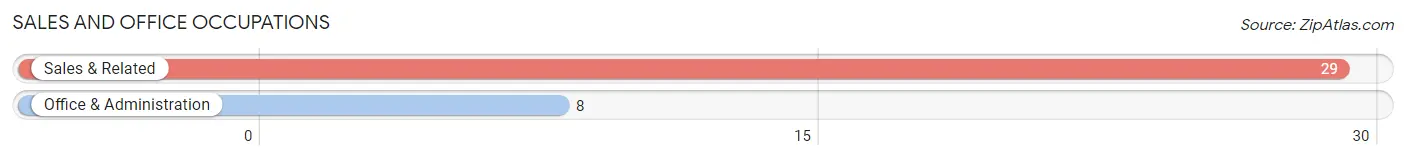
Sales and Office Occupations
The most common Sales and Office occupations in Bayard are Sales & Related (29 | 24.8%), and Office & Administration (8 | 6.8%).
Sales and Office Occupations by Sex
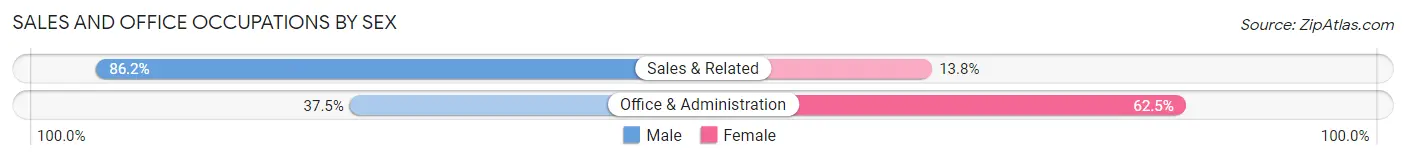
| Occupation | Male | Female |
| Sales & Related | 25 (86.2%) | 4 (13.8%) |
| Office & Administration | 3 (37.5%) | 5 (62.5%) |
| Total (Category) | 28 (75.7%) | 9 (24.3%) |
| Total (Overall) | 81 (69.2%) | 36 (30.8%) |
Natural Resources, Construction and Maintenance Occupations
The most common Natural Resources, Construction and Maintenance occupations in Bayard are , and Construction & Extraction (7 | 6.0%).
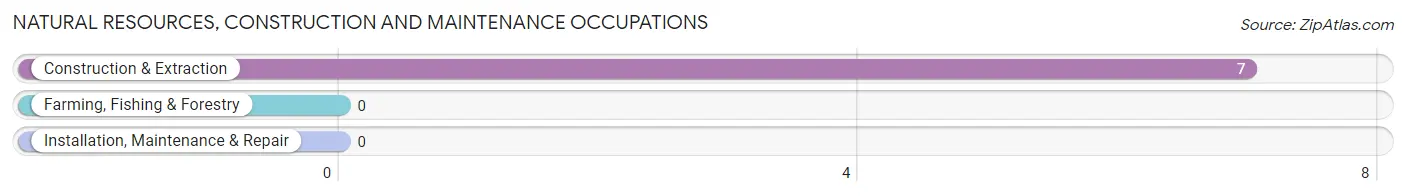
Natural Resources, Construction and Maintenance Occupations by Sex
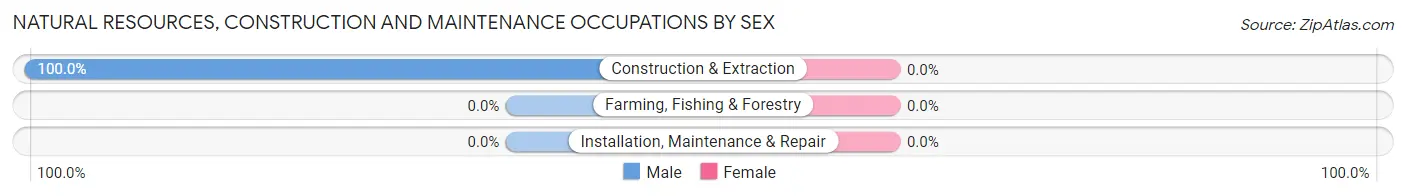
| Occupation | Male | Female |
| Farming, Fishing & Forestry | 0 (0.0%) | 0 (0.0%) |
| Construction & Extraction | 7 (100.0%) | 0 (0.0%) |
| Installation, Maintenance & Repair | 0 (0.0%) | 0 (0.0%) |
| Total (Category) | 7 (100.0%) | 0 (0.0%) |
| Total (Overall) | 81 (69.2%) | 36 (30.8%) |
Production, Transportation and Moving Occupations
The most common Production, Transportation and Moving occupations in Bayard are Production (12 | 10.3%), Transportation (12 | 10.3%), and Material Moving (9 | 7.7%).
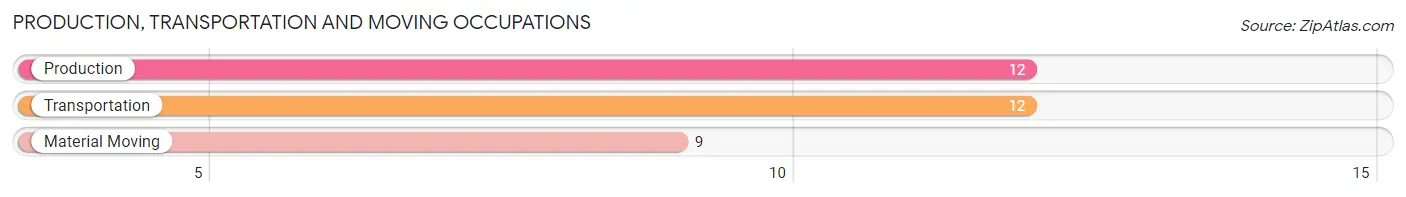
Production, Transportation and Moving Occupations by Sex
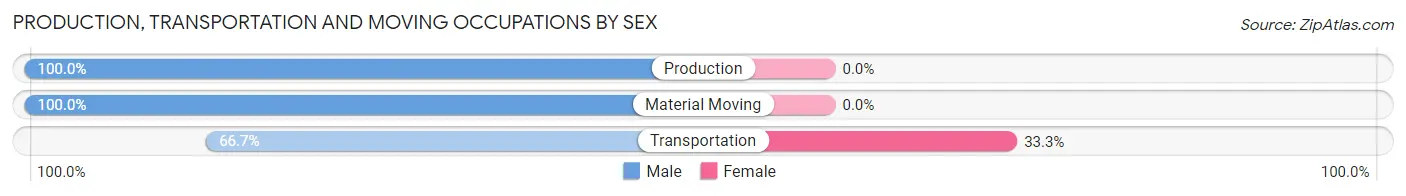
| Occupation | Male | Female |
| Production | 12 (100.0%) | 0 (0.0%) |
| Transportation | 8 (66.7%) | 4 (33.3%) |
| Material Moving | 9 (100.0%) | 0 (0.0%) |
| Total (Category) | 29 (87.9%) | 4 (12.1%) |
| Total (Overall) | 81 (69.2%) | 36 (30.8%) |
Employment Industries by Sex in Bayard
Employment Industries in Bayard
The major employment industries in Bayard include Retail Trade (20 | 17.1%), Administrative & Support (18 | 15.4%), Construction (17 | 14.5%), Manufacturing (12 | 10.3%), and Educational Services (11 | 9.4%).
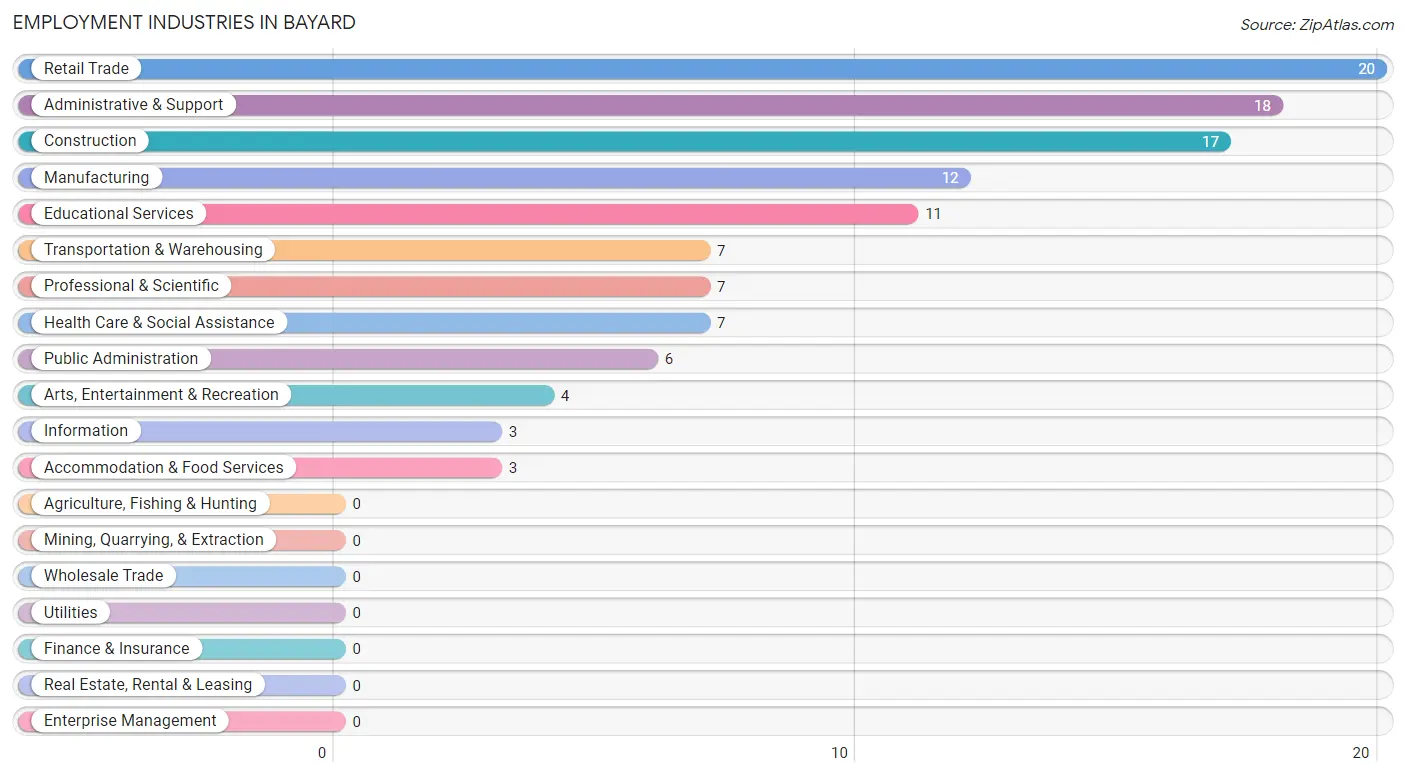
Employment Industries by Sex in Bayard
The Bayard industries that see more men than women are Construction (100.0%), Manufacturing (100.0%), and Transportation & Warehousing (100.0%), whereas the industries that tend to have a higher number of women are Educational Services (100.0%), Health Care & Social Assistance (100.0%), and Public Administration (100.0%).
| Industry | Male | Female |
| Agriculture, Fishing & Hunting | 0 (0.0%) | 0 (0.0%) |
| Mining, Quarrying, & Extraction | 0 (0.0%) | 0 (0.0%) |
| Construction | 17 (100.0%) | 0 (0.0%) |
| Manufacturing | 12 (100.0%) | 0 (0.0%) |
| Wholesale Trade | 0 (0.0%) | 0 (0.0%) |
| Retail Trade | 10 (50.0%) | 10 (50.0%) |
| Transportation & Warehousing | 7 (100.0%) | 0 (0.0%) |
| Utilities | 0 (0.0%) | 0 (0.0%) |
| Information | 3 (100.0%) | 0 (0.0%) |
| Finance & Insurance | 0 (0.0%) | 0 (0.0%) |
| Real Estate, Rental & Leasing | 0 (0.0%) | 0 (0.0%) |
| Professional & Scientific | 7 (100.0%) | 0 (0.0%) |
| Enterprise Management | 0 (0.0%) | 0 (0.0%) |
| Administrative & Support | 16 (88.9%) | 2 (11.1%) |
| Educational Services | 0 (0.0%) | 11 (100.0%) |
| Health Care & Social Assistance | 0 (0.0%) | 7 (100.0%) |
| Arts, Entertainment & Recreation | 4 (100.0%) | 0 (0.0%) |
| Accommodation & Food Services | 3 (100.0%) | 0 (0.0%) |
| Public Administration | 0 (0.0%) | 6 (100.0%) |
| Total | 81 (69.2%) | 36 (30.8%) |
Education in Bayard
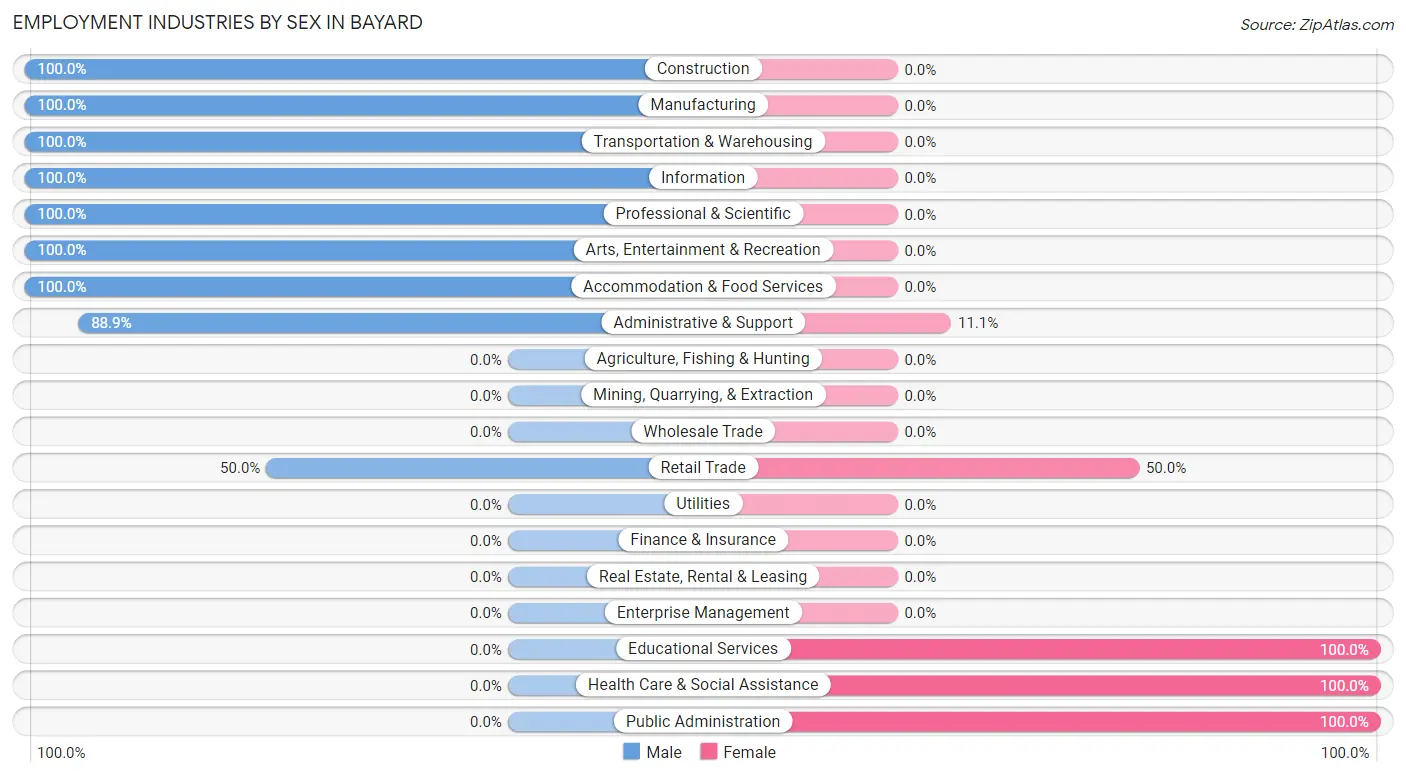
School Enrollment in Bayard
The most common levels of schooling among the 33 students in Bayard are middle school (14 | 42.4%), high school (14 | 42.4%), and kindergarten (5 | 15.1%).
| School Level | # Students | % Students |
| Nursery / Preschool | 0 | 0.0% |
| Kindergarten | 5 | 15.1% |
| Elementary School | 0 | 0.0% |
| Middle School | 14 | 42.4% |
| High School | 14 | 42.4% |
| College / Undergraduate | 0 | 0.0% |
| Graduate / Professional | 0 | 0.0% |
| Total | 33 | 100.0% |
School Enrollment by Age by Funding Source in Bayard
Out of a total of 33 students who are enrolled in schools in Bayard, 5 (15.2%) attend a private institution, while the remaining 28 (84.8%) are enrolled in public schools. The age group of 5 to 9 year old has the highest likelihood of being enrolled in private schools, with 5 (100.0% in the age bracket) enrolled. Conversely, the age group of 10 to 14 year olds has the lowest likelihood of being enrolled in a private school, with 18 (100.0% in the age bracket) attending a public institution.
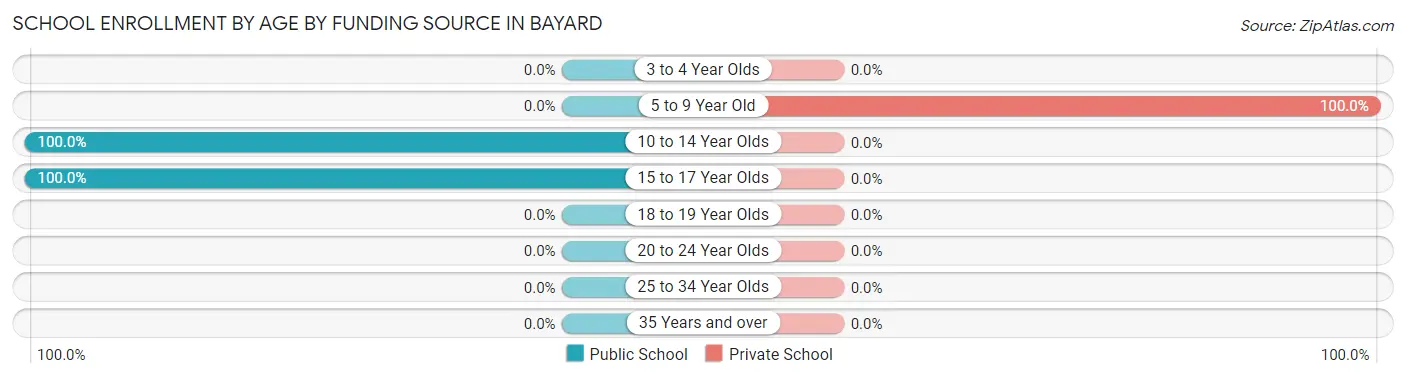
| Age Bracket | Public School | Private School |
| 3 to 4 Year Olds | 0 (0.0%) | 0 (0.0%) |
| 5 to 9 Year Old | 0 (0.0%) | 5 (100.0%) |
| 10 to 14 Year Olds | 18 (100.0%) | 0 (0.0%) |
| 15 to 17 Year Olds | 10 (100.0%) | 0 (0.0%) |
| 18 to 19 Year Olds | 0 (0.0%) | 0 (0.0%) |
| 20 to 24 Year Olds | 0 (0.0%) | 0 (0.0%) |
| 25 to 34 Year Olds | 0 (0.0%) | 0 (0.0%) |
| 35 Years and over | 0 (0.0%) | 0 (0.0%) |
| Total | 28 (84.8%) | 5 (15.2%) |
Educational Attainment by Field of Study in Bayard
Business (11 | 40.7%), computers & mathematics (10 | 37.0%), psychology (4 | 14.8%), and education (2 | 7.4%) are the most common fields of study among 27 individuals in Bayard who have obtained a bachelor's degree or higher.
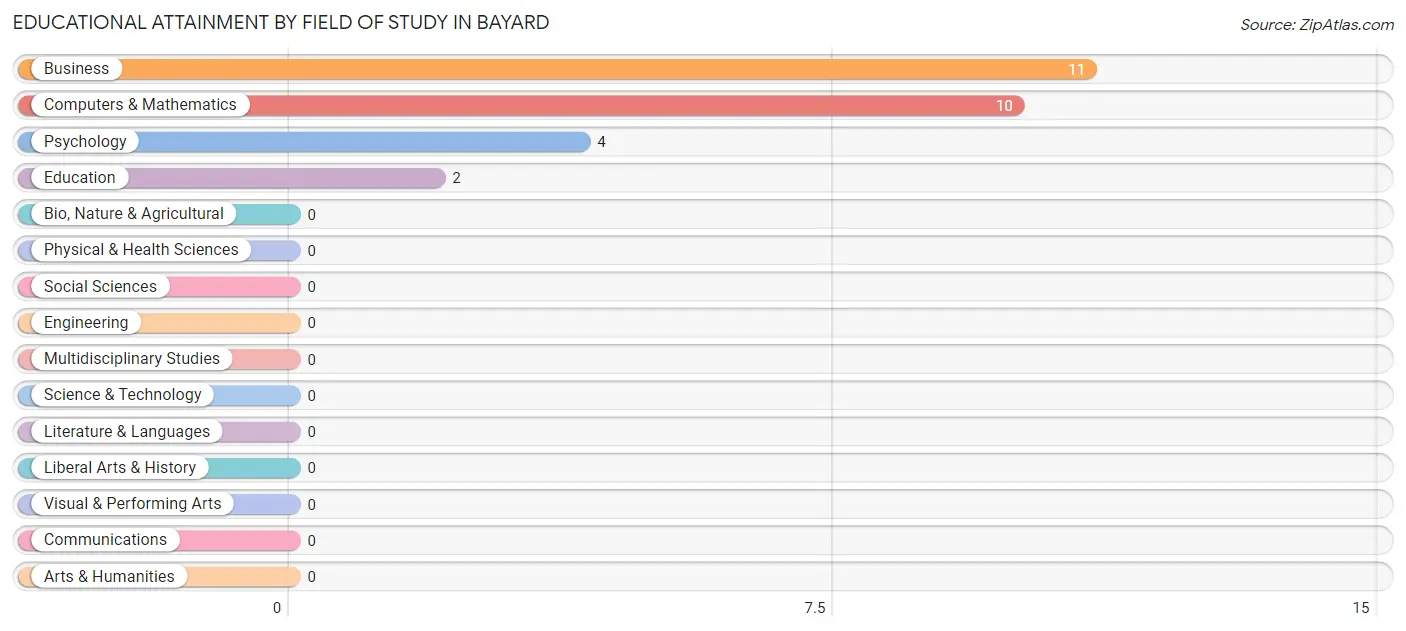
| Field of Study | # Graduates | % Graduates |
| Computers & Mathematics | 10 | 37.0% |
| Bio, Nature & Agricultural | 0 | 0.0% |
| Physical & Health Sciences | 0 | 0.0% |
| Psychology | 4 | 14.8% |
| Social Sciences | 0 | 0.0% |
| Engineering | 0 | 0.0% |
| Multidisciplinary Studies | 0 | 0.0% |
| Science & Technology | 0 | 0.0% |
| Business | 11 | 40.7% |
| Education | 2 | 7.4% |
| Literature & Languages | 0 | 0.0% |
| Liberal Arts & History | 0 | 0.0% |
| Visual & Performing Arts | 0 | 0.0% |
| Communications | 0 | 0.0% |
| Arts & Humanities | 0 | 0.0% |
| Total | 27 | 100.0% |
Transportation & Commute in Bayard
Vehicle Availability by Sex in Bayard
The most prevalent vehicle ownership categories in Bayard are males with 1 vehicle (35, accounting for 43.2%) and females with 1 vehicle (7, making up 97.2%).
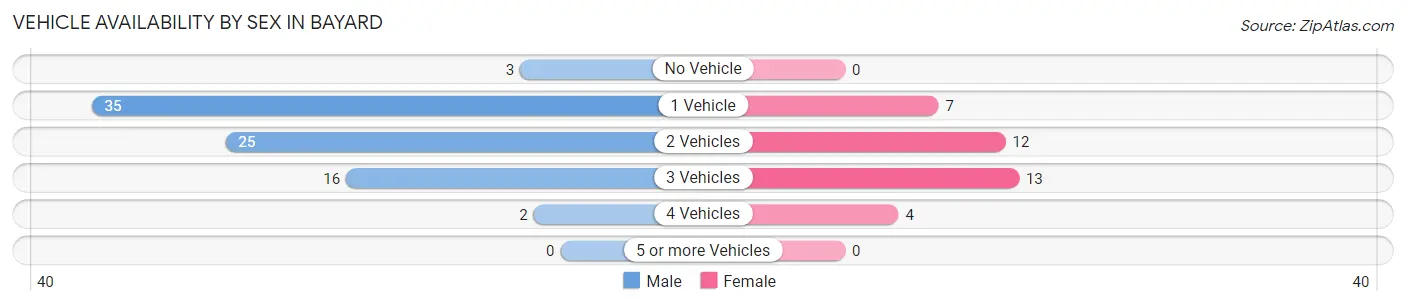
| Vehicles Available | Male | Female |
| No Vehicle | 3 (3.7%) | 0 (0.0%) |
| 1 Vehicle | 35 (43.2%) | 7 (19.4%) |
| 2 Vehicles | 25 (30.9%) | 12 (33.3%) |
| 3 Vehicles | 16 (19.8%) | 13 (36.1%) |
| 4 Vehicles | 2 (2.5%) | 4 (11.1%) |
| 5 or more Vehicles | 0 (0.0%) | 0 (0.0%) |
| Total | 81 (100.0%) | 36 (100.0%) |
Commute Time in Bayard
The most frequently occuring commute durations in Bayard are 25 to 29 minutes (25 commuters, 23.2%), 15 to 19 minutes (20 commuters, 18.5%), and 40 to 44 minutes (16 commuters, 14.8%).
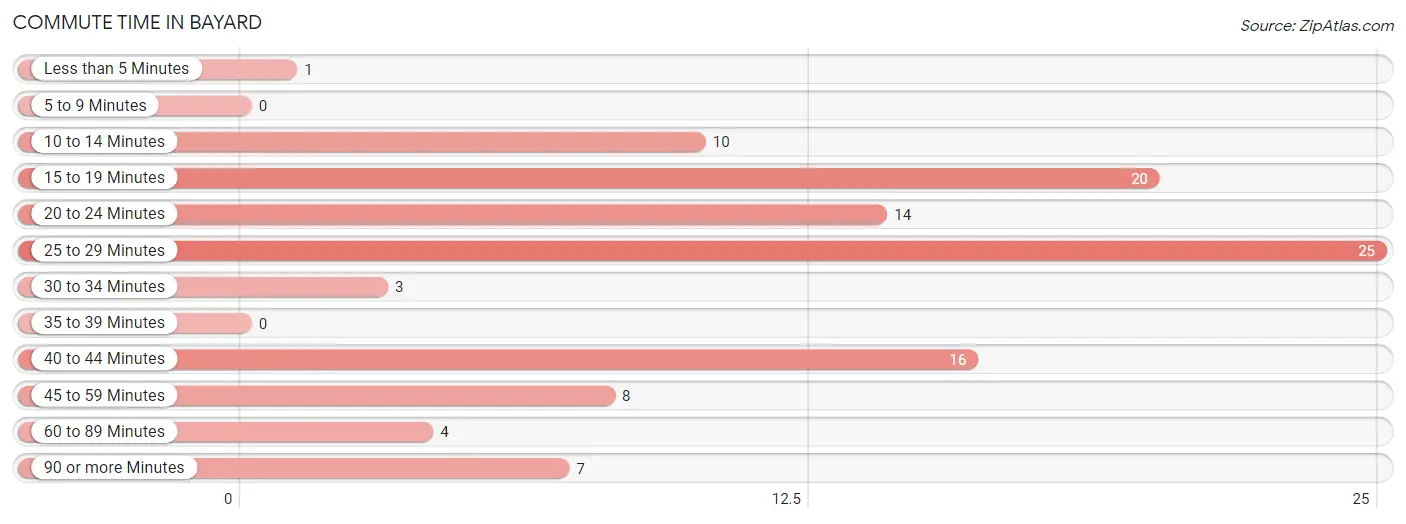
| Commute Time | # Commuters | % Commuters |
| Less than 5 Minutes | 1 | 0.9% |
| 5 to 9 Minutes | 0 | 0.0% |
| 10 to 14 Minutes | 10 | 9.3% |
| 15 to 19 Minutes | 20 | 18.5% |
| 20 to 24 Minutes | 14 | 13.0% |
| 25 to 29 Minutes | 25 | 23.2% |
| 30 to 34 Minutes | 3 | 2.8% |
| 35 to 39 Minutes | 0 | 0.0% |
| 40 to 44 Minutes | 16 | 14.8% |
| 45 to 59 Minutes | 8 | 7.4% |
| 60 to 89 Minutes | 4 | 3.7% |
| 90 or more Minutes | 7 | 6.5% |
Commute Time by Sex in Bayard
The most common commute times in Bayard are 40 to 44 minutes (16 commuters, 22.2%) for males and 25 to 29 minutes (13 commuters, 36.1%) for females.
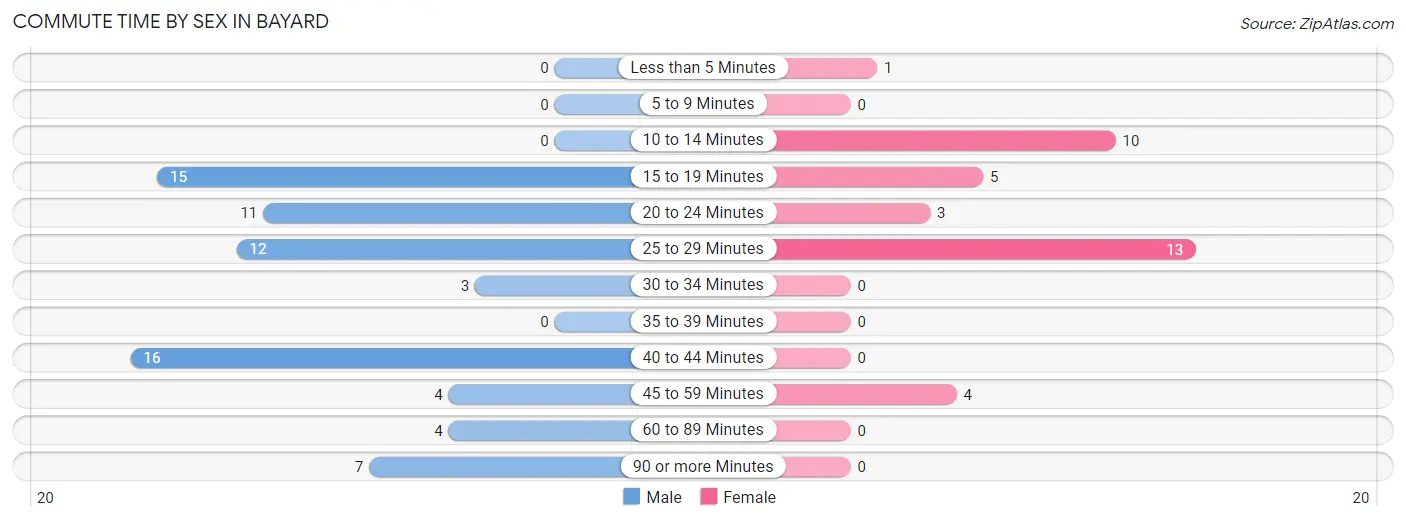
| Commute Time | Male | Female |
| Less than 5 Minutes | 0 (0.0%) | 1 (2.8%) |
| 5 to 9 Minutes | 0 (0.0%) | 0 (0.0%) |
| 10 to 14 Minutes | 0 (0.0%) | 10 (27.8%) |
| 15 to 19 Minutes | 15 (20.8%) | 5 (13.9%) |
| 20 to 24 Minutes | 11 (15.3%) | 3 (8.3%) |
| 25 to 29 Minutes | 12 (16.7%) | 13 (36.1%) |
| 30 to 34 Minutes | 3 (4.2%) | 0 (0.0%) |
| 35 to 39 Minutes | 0 (0.0%) | 0 (0.0%) |
| 40 to 44 Minutes | 16 (22.2%) | 0 (0.0%) |
| 45 to 59 Minutes | 4 (5.6%) | 4 (11.1%) |
| 60 to 89 Minutes | 4 (5.6%) | 0 (0.0%) |
| 90 or more Minutes | 7 (9.7%) | 0 (0.0%) |
Time of Departure to Work by Sex in Bayard
The most frequent times of departure to work in Bayard are 5:30 AM to 5:59 AM (24, 33.3%) for males and 5:30 AM to 5:59 AM (14, 38.9%) for females.
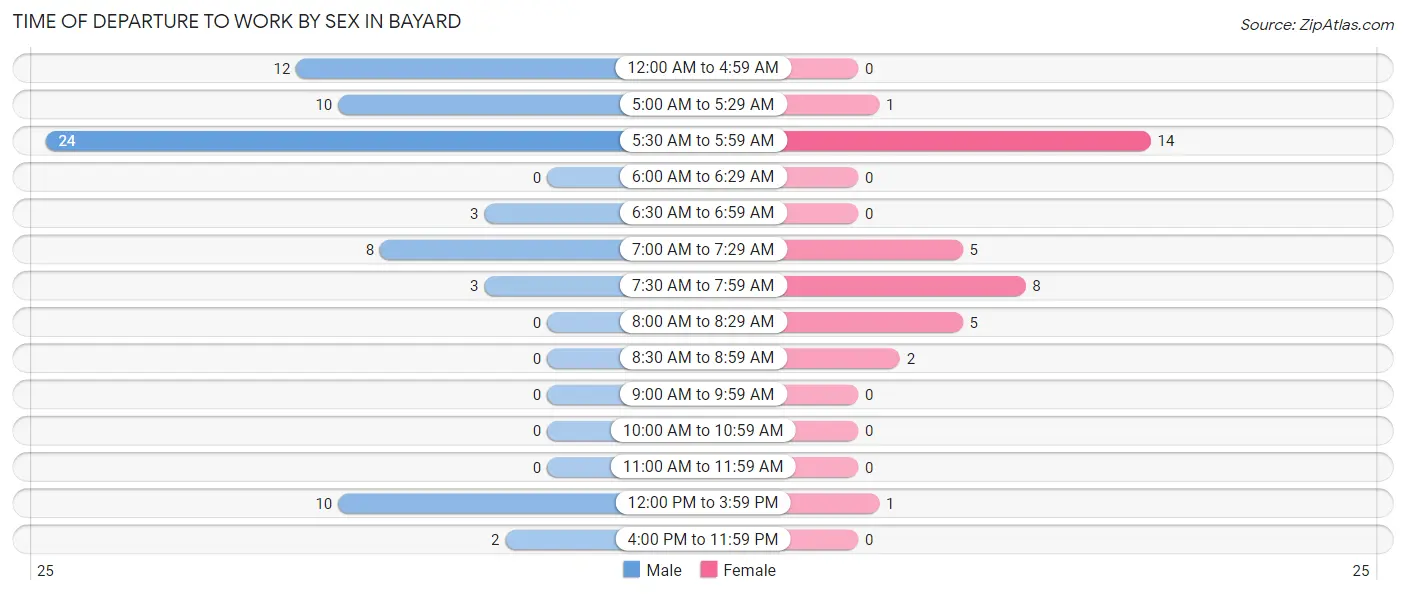
| Time of Departure | Male | Female |
| 12:00 AM to 4:59 AM | 12 (16.7%) | 0 (0.0%) |
| 5:00 AM to 5:29 AM | 10 (13.9%) | 1 (2.8%) |
| 5:30 AM to 5:59 AM | 24 (33.3%) | 14 (38.9%) |
| 6:00 AM to 6:29 AM | 0 (0.0%) | 0 (0.0%) |
| 6:30 AM to 6:59 AM | 3 (4.2%) | 0 (0.0%) |
| 7:00 AM to 7:29 AM | 8 (11.1%) | 5 (13.9%) |
| 7:30 AM to 7:59 AM | 3 (4.2%) | 8 (22.2%) |
| 8:00 AM to 8:29 AM | 0 (0.0%) | 5 (13.9%) |
| 8:30 AM to 8:59 AM | 0 (0.0%) | 2 (5.6%) |
| 9:00 AM to 9:59 AM | 0 (0.0%) | 0 (0.0%) |
| 10:00 AM to 10:59 AM | 0 (0.0%) | 0 (0.0%) |
| 11:00 AM to 11:59 AM | 0 (0.0%) | 0 (0.0%) |
| 12:00 PM to 3:59 PM | 10 (13.9%) | 1 (2.8%) |
| 4:00 PM to 11:59 PM | 2 (2.8%) | 0 (0.0%) |
| Total | 72 (100.0%) | 36 (100.0%) |
Housing Occupancy in Bayard
Occupancy by Ownership in Bayard
Of the total 109 dwellings in Bayard, owner-occupied units account for 87 (79.8%), while renter-occupied units make up 22 (20.2%).
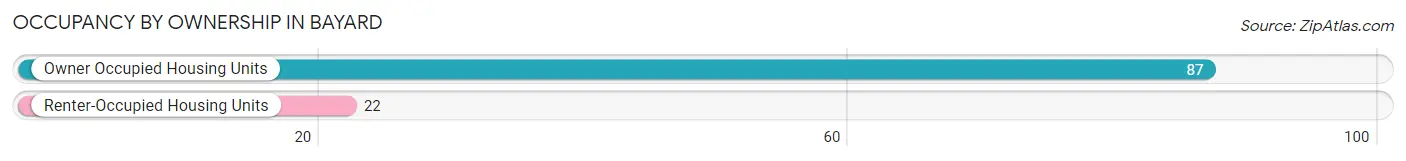
| Occupancy | # Housing Units | % Housing Units |
| Owner Occupied Housing Units | 87 | 79.8% |
| Renter-Occupied Housing Units | 22 | 20.2% |
| Total Occupied Housing Units | 109 | 100.0% |
Occupancy by Household Size in Bayard
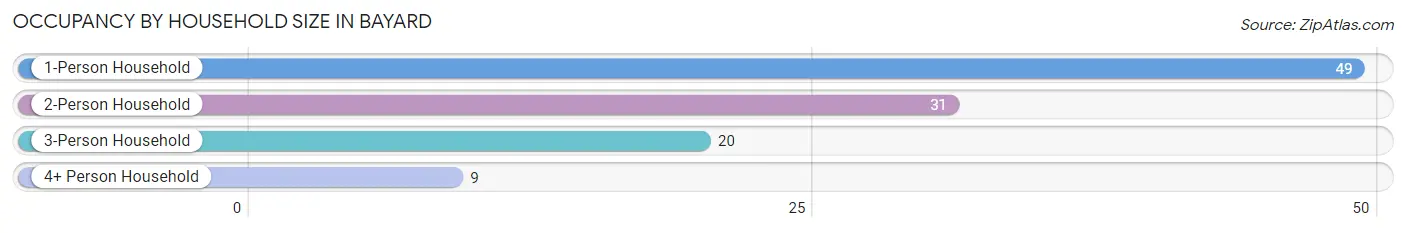
| Household Size | # Housing Units | % Housing Units |
| 1-Person Household | 49 | 45.0% |
| 2-Person Household | 31 | 28.4% |
| 3-Person Household | 20 | 18.3% |
| 4+ Person Household | 9 | 8.3% |
| Total Housing Units | 109 | 100.0% |
Occupancy by Ownership by Household Size in Bayard
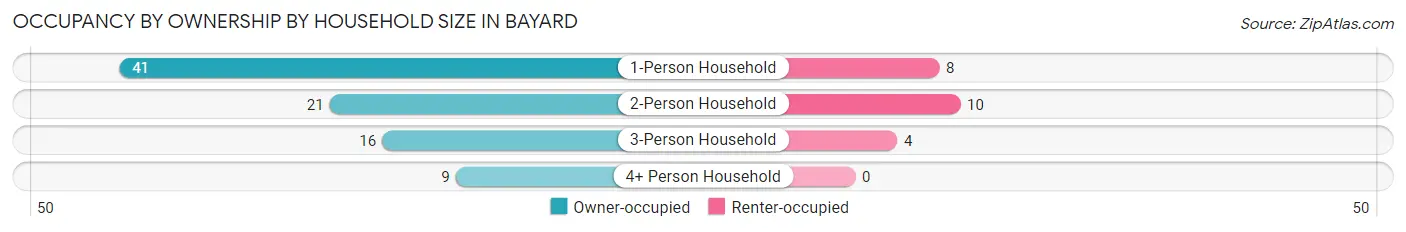
| Household Size | Owner-occupied | Renter-occupied |
| 1-Person Household | 41 (83.7%) | 8 (16.3%) |
| 2-Person Household | 21 (67.7%) | 10 (32.3%) |
| 3-Person Household | 16 (80.0%) | 4 (20.0%) |
| 4+ Person Household | 9 (100.0%) | 0 (0.0%) |
| Total Housing Units | 87 (79.8%) | 22 (20.2%) |
Occupancy by Educational Attainment in Bayard
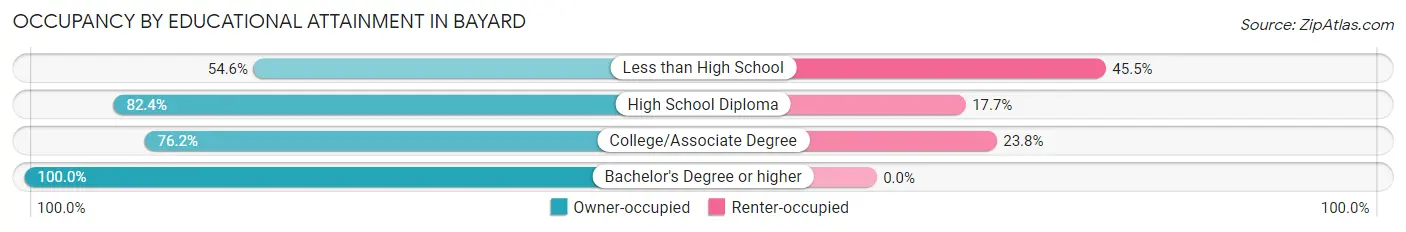
| Household Size | Owner-occupied | Renter-occupied |
| Less than High School | 6 (54.5%) | 5 (45.5%) |
| High School Diploma | 56 (82.4%) | 12 (17.6%) |
| College/Associate Degree | 16 (76.2%) | 5 (23.8%) |
| Bachelor's Degree or higher | 9 (100.0%) | 0 (0.0%) |
Occupancy by Age of Householder in Bayard
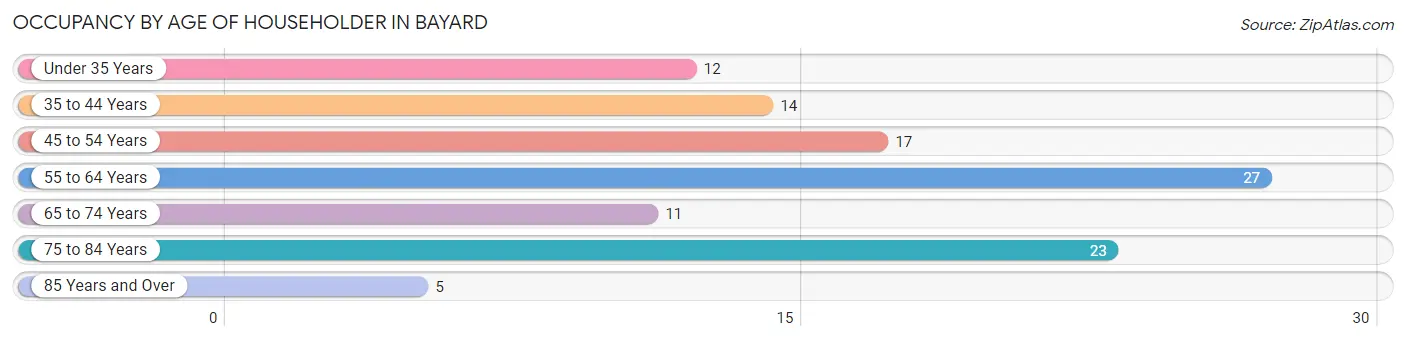
| Age Bracket | # Households | % Households |
| Under 35 Years | 12 | 11.0% |
| 35 to 44 Years | 14 | 12.8% |
| 45 to 54 Years | 17 | 15.6% |
| 55 to 64 Years | 27 | 24.8% |
| 65 to 74 Years | 11 | 10.1% |
| 75 to 84 Years | 23 | 21.1% |
| 85 Years and Over | 5 | 4.6% |
| Total | 109 | 100.0% |
Housing Finances in Bayard
Median Income by Occupancy in Bayard
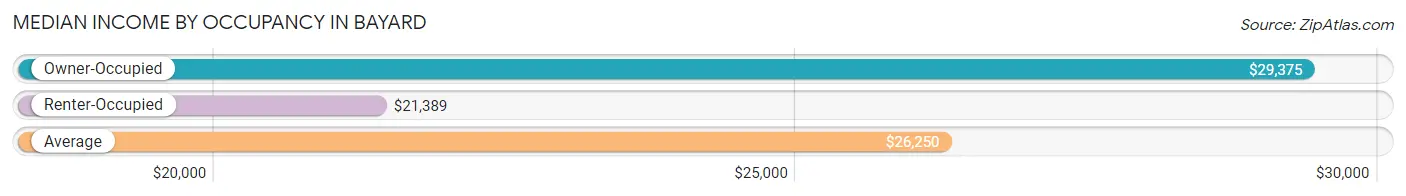
| Occupancy Type | # Households | Median Income |
| Owner-Occupied | 87 (79.8%) | $29,375 |
| Renter-Occupied | 22 (20.2%) | $21,389 |
| Average | 109 (100.0%) | $26,250 |
Occupancy by Householder Income Bracket in Bayard
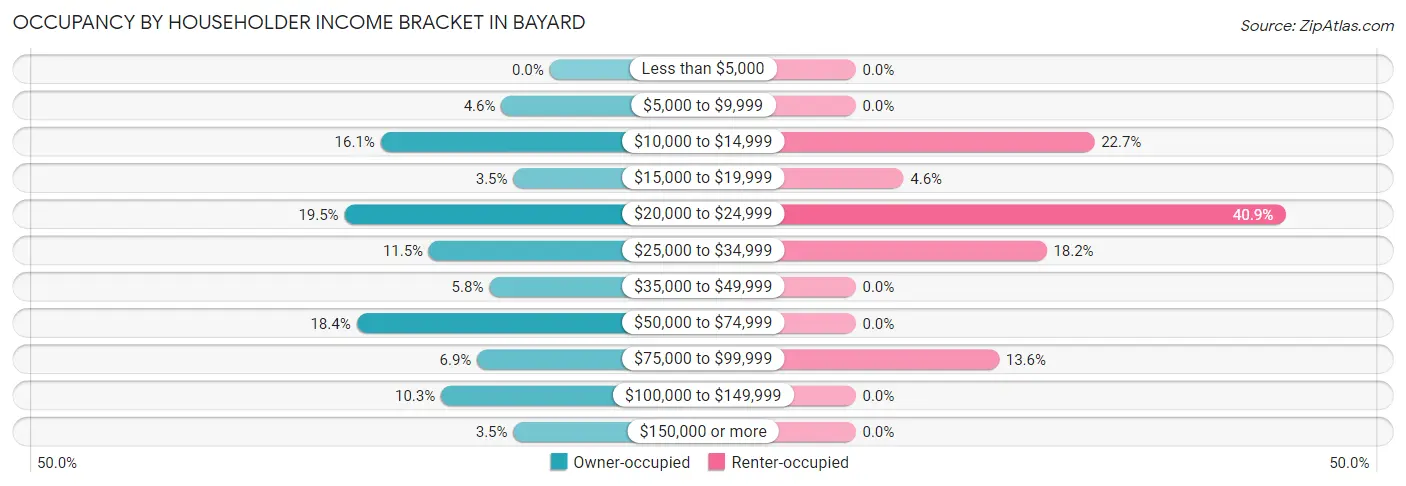
| Income Bracket | Owner-occupied | Renter-occupied |
| Less than $5,000 | 0 (0.0%) | 0 (0.0%) |
| $5,000 to $9,999 | 4 (4.6%) | 0 (0.0%) |
| $10,000 to $14,999 | 14 (16.1%) | 5 (22.7%) |
| $15,000 to $19,999 | 3 (3.5%) | 1 (4.5%) |
| $20,000 to $24,999 | 17 (19.5%) | 9 (40.9%) |
| $25,000 to $34,999 | 10 (11.5%) | 4 (18.2%) |
| $35,000 to $49,999 | 5 (5.8%) | 0 (0.0%) |
| $50,000 to $74,999 | 16 (18.4%) | 0 (0.0%) |
| $75,000 to $99,999 | 6 (6.9%) | 3 (13.6%) |
| $100,000 to $149,999 | 9 (10.3%) | 0 (0.0%) |
| $150,000 or more | 3 (3.5%) | 0 (0.0%) |
| Total | 87 (100.0%) | 22 (100.0%) |
Monthly Housing Cost Tiers in Bayard
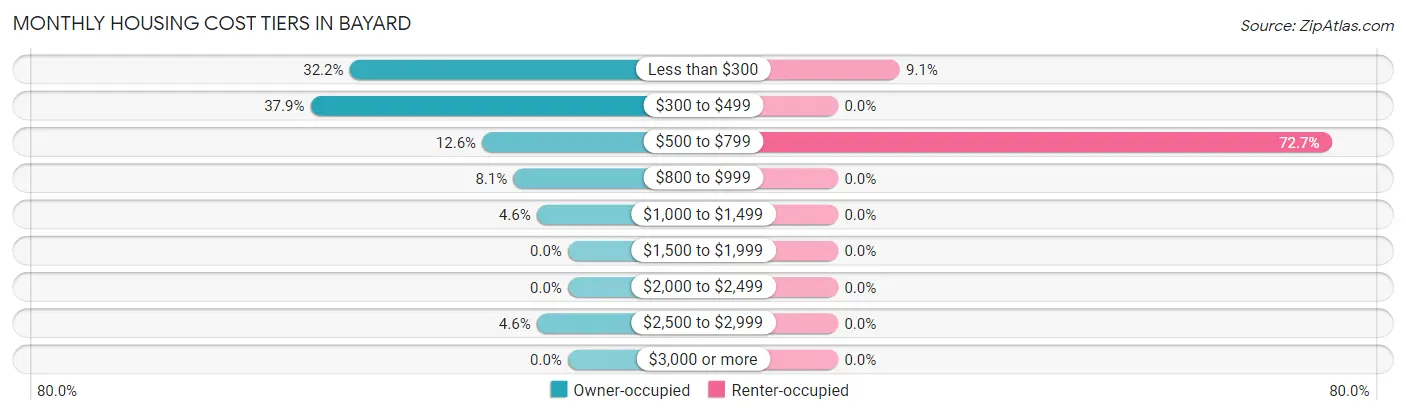
| Monthly Cost | Owner-occupied | Renter-occupied |
| Less than $300 | 28 (32.2%) | 2 (9.1%) |
| $300 to $499 | 33 (37.9%) | 0 (0.0%) |
| $500 to $799 | 11 (12.6%) | 16 (72.7%) |
| $800 to $999 | 7 (8.1%) | 0 (0.0%) |
| $1,000 to $1,499 | 4 (4.6%) | 0 (0.0%) |
| $1,500 to $1,999 | 0 (0.0%) | 0 (0.0%) |
| $2,000 to $2,499 | 0 (0.0%) | 0 (0.0%) |
| $2,500 to $2,999 | 4 (4.6%) | 0 (0.0%) |
| $3,000 or more | 0 (0.0%) | 0 (0.0%) |
| Total | 87 (100.0%) | 22 (100.0%) |
Physical Housing Characteristics in Bayard
Housing Structures in Bayard
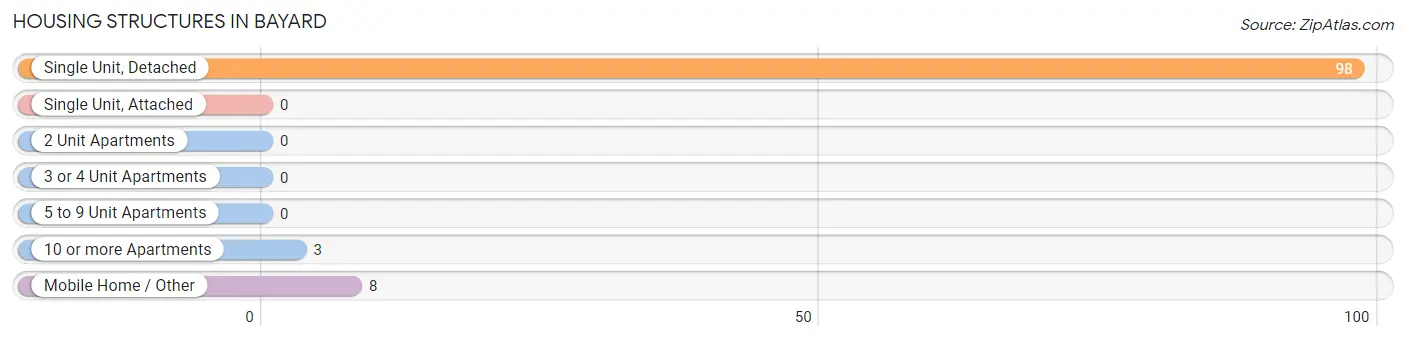
| Structure Type | # Housing Units | % Housing Units |
| Single Unit, Detached | 98 | 89.9% |
| Single Unit, Attached | 0 | 0.0% |
| 2 Unit Apartments | 0 | 0.0% |
| 3 or 4 Unit Apartments | 0 | 0.0% |
| 5 to 9 Unit Apartments | 0 | 0.0% |
| 10 or more Apartments | 3 | 2.8% |
| Mobile Home / Other | 8 | 7.3% |
| Total | 109 | 100.0% |
Housing Structures by Occupancy in Bayard
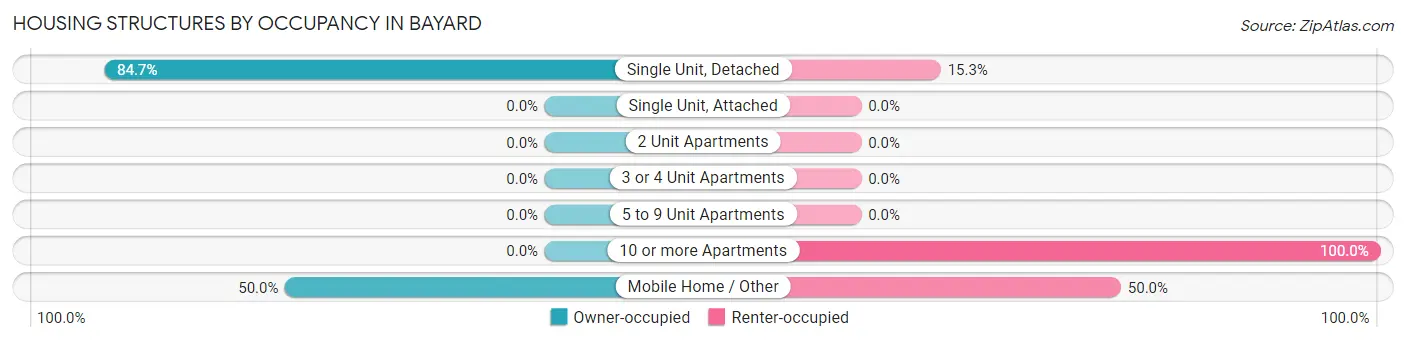
| Structure Type | Owner-occupied | Renter-occupied |
| Single Unit, Detached | 83 (84.7%) | 15 (15.3%) |
| Single Unit, Attached | 0 (0.0%) | 0 (0.0%) |
| 2 Unit Apartments | 0 (0.0%) | 0 (0.0%) |
| 3 or 4 Unit Apartments | 0 (0.0%) | 0 (0.0%) |
| 5 to 9 Unit Apartments | 0 (0.0%) | 0 (0.0%) |
| 10 or more Apartments | 0 (0.0%) | 3 (100.0%) |
| Mobile Home / Other | 4 (50.0%) | 4 (50.0%) |
| Total | 87 (79.8%) | 22 (20.2%) |
Housing Structures by Number of Rooms in Bayard
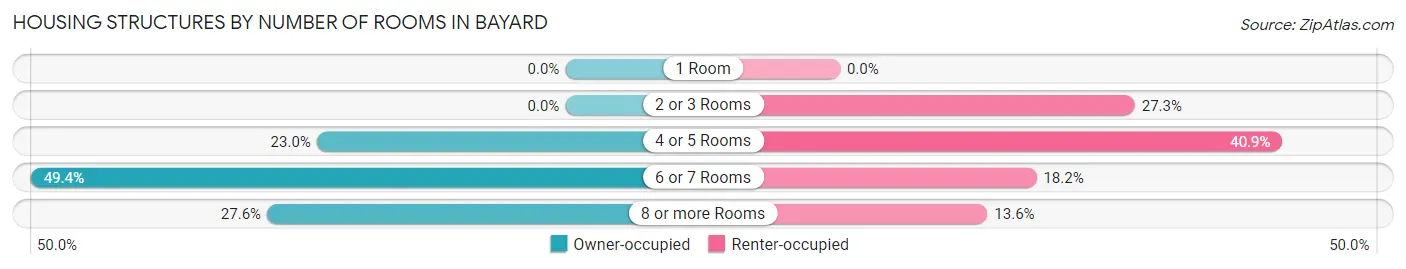
| Number of Rooms | Owner-occupied | Renter-occupied |
| 1 Room | 0 (0.0%) | 0 (0.0%) |
| 2 or 3 Rooms | 0 (0.0%) | 6 (27.3%) |
| 4 or 5 Rooms | 20 (23.0%) | 9 (40.9%) |
| 6 or 7 Rooms | 43 (49.4%) | 4 (18.2%) |
| 8 or more Rooms | 24 (27.6%) | 3 (13.6%) |
| Total | 87 (100.0%) | 22 (100.0%) |
Housing Structure by Heating Type in Bayard
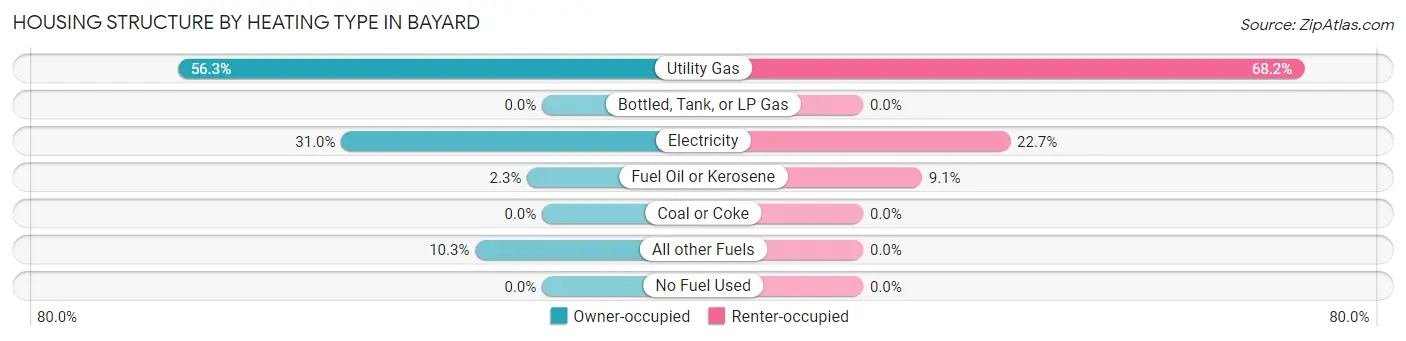
| Heating Type | Owner-occupied | Renter-occupied |
| Utility Gas | 49 (56.3%) | 15 (68.2%) |
| Bottled, Tank, or LP Gas | 0 (0.0%) | 0 (0.0%) |
| Electricity | 27 (31.0%) | 5 (22.7%) |
| Fuel Oil or Kerosene | 2 (2.3%) | 2 (9.1%) |
| Coal or Coke | 0 (0.0%) | 0 (0.0%) |
| All other Fuels | 9 (10.3%) | 0 (0.0%) |
| No Fuel Used | 0 (0.0%) | 0 (0.0%) |
| Total | 87 (100.0%) | 22 (100.0%) |
Household Vehicle Usage in Bayard
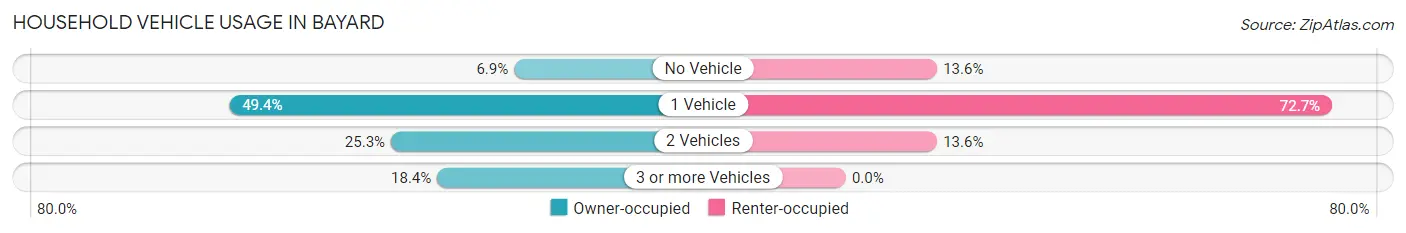
| Vehicles per Household | Owner-occupied | Renter-occupied |
| No Vehicle | 6 (6.9%) | 3 (13.6%) |
| 1 Vehicle | 43 (49.4%) | 16 (72.7%) |
| 2 Vehicles | 22 (25.3%) | 3 (13.6%) |
| 3 or more Vehicles | 16 (18.4%) | 0 (0.0%) |
| Total | 87 (100.0%) | 22 (100.0%) |
Real Estate & Mortgages in Bayard
Real Estate and Mortgage Overview in Bayard
| Characteristic | Without Mortgage | With Mortgage |
| Housing Units | 56 | 31 |
| Median Property Value | $58,900 | $92,100 |
| Median Household Income | $23,846 | $3 |
| Monthly Housing Costs | $300 | $0 |
| Real Estate Taxes | $413 | $1 |
Property Value by Mortgage Status in Bayard
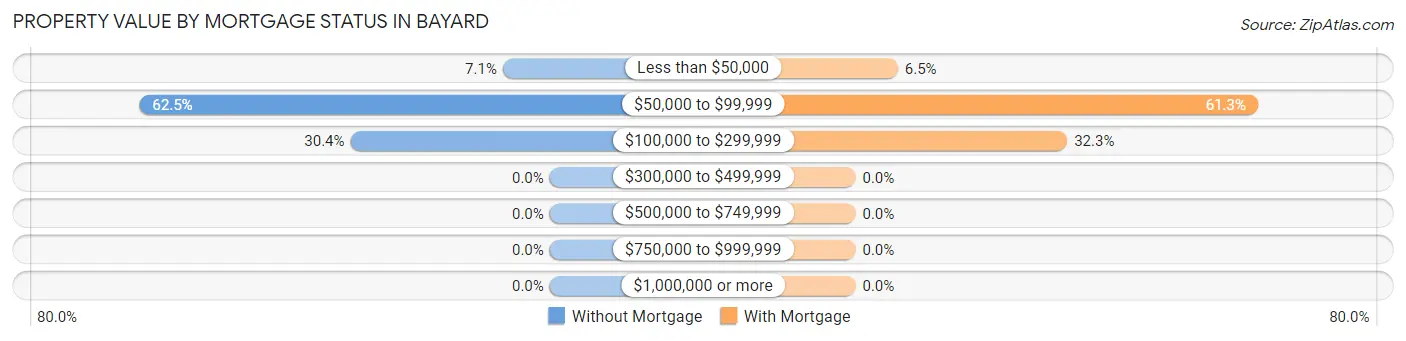
| Property Value | Without Mortgage | With Mortgage |
| Less than $50,000 | 4 (7.1%) | 2 (6.5%) |
| $50,000 to $99,999 | 35 (62.5%) | 19 (61.3%) |
| $100,000 to $299,999 | 17 (30.4%) | 10 (32.3%) |
| $300,000 to $499,999 | 0 (0.0%) | 0 (0.0%) |
| $500,000 to $749,999 | 0 (0.0%) | 0 (0.0%) |
| $750,000 to $999,999 | 0 (0.0%) | 0 (0.0%) |
| $1,000,000 or more | 0 (0.0%) | 0 (0.0%) |
| Total | 56 (100.0%) | 31 (100.0%) |
Household Income by Mortgage Status in Bayard
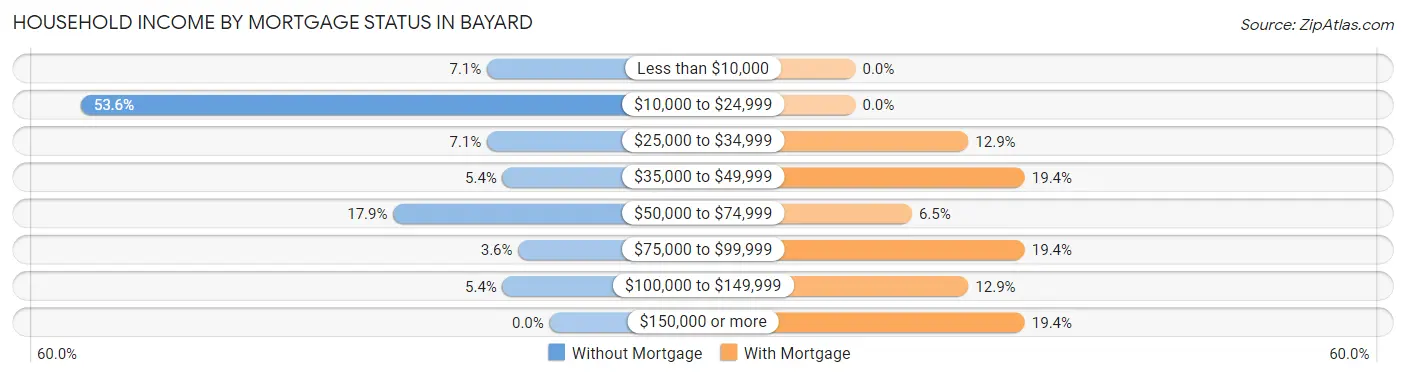
| Household Income | Without Mortgage | With Mortgage |
| Less than $10,000 | 4 (7.1%) | 0 (0.0%) |
| $10,000 to $24,999 | 30 (53.6%) | 0 (0.0%) |
| $25,000 to $34,999 | 4 (7.1%) | 4 (12.9%) |
| $35,000 to $49,999 | 3 (5.4%) | 6 (19.4%) |
| $50,000 to $74,999 | 10 (17.9%) | 2 (6.5%) |
| $75,000 to $99,999 | 2 (3.6%) | 6 (19.4%) |
| $100,000 to $149,999 | 3 (5.4%) | 4 (12.9%) |
| $150,000 or more | 0 (0.0%) | 6 (19.4%) |
| Total | 56 (100.0%) | 31 (100.0%) |
Property Value to Household Income Ratio in Bayard
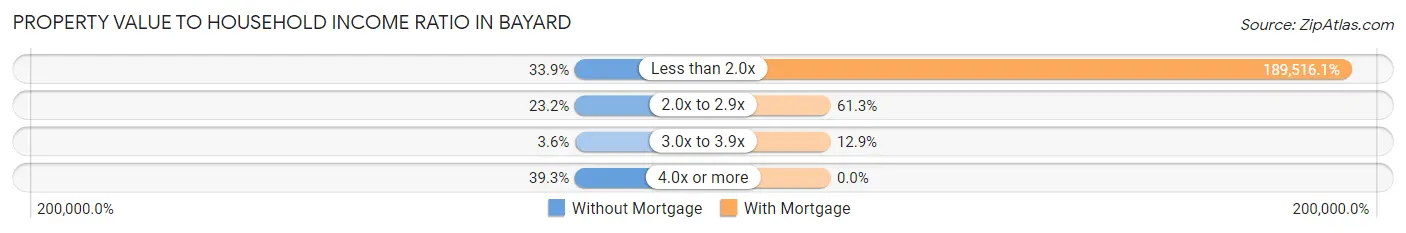
| Value-to-Income Ratio | Without Mortgage | With Mortgage |
| Less than 2.0x | 19 (33.9%) | 58,750 (189,516.1%) |
| 2.0x to 2.9x | 13 (23.2%) | 19 (61.3%) |
| 3.0x to 3.9x | 2 (3.6%) | 4 (12.9%) |
| 4.0x or more | 22 (39.3%) | 0 (0.0%) |
| Total | 56 (100.0%) | 31 (100.0%) |
Real Estate Taxes by Mortgage Status in Bayard
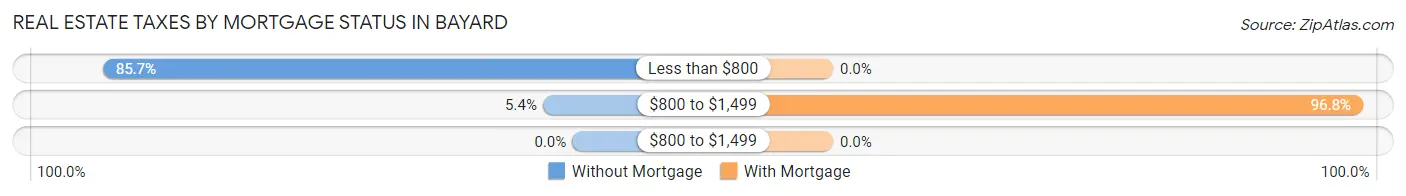
| Property Taxes | Without Mortgage | With Mortgage |
| Less than $800 | 48 (85.7%) | 0 (0.0%) |
| $800 to $1,499 | 3 (5.4%) | 30 (96.8%) |
| $800 to $1,499 | 0 (0.0%) | 0 (0.0%) |
| Total | 56 (100.0%) | 31 (100.0%) |
Health & Disability in Bayard
Health Insurance Coverage by Age in Bayard
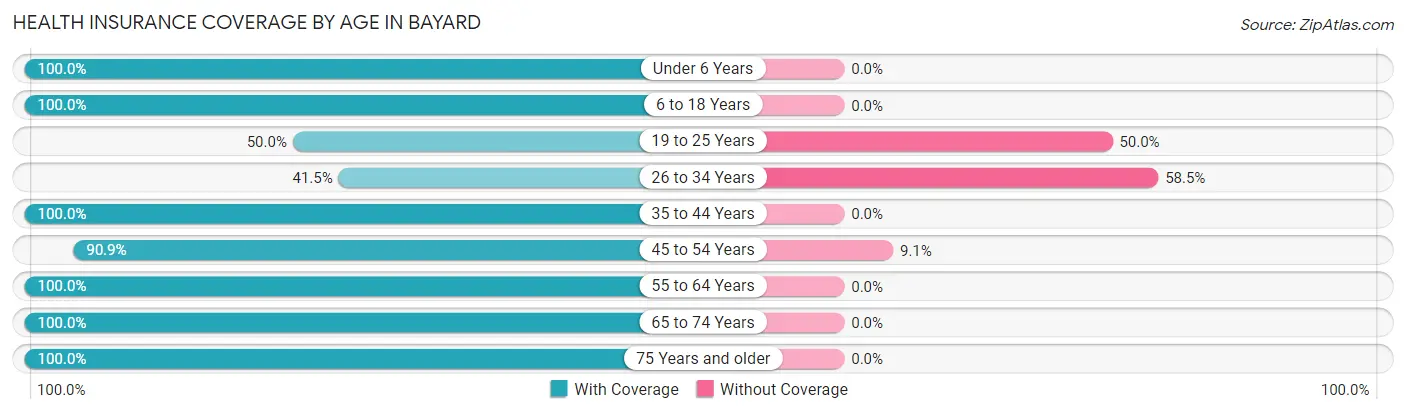
| Age Bracket | With Coverage | Without Coverage |
| Under 6 Years | 5 (100.0%) | 0 (0.0%) |
| 6 to 18 Years | 28 (100.0%) | 0 (0.0%) |
| 19 to 25 Years | 16 (50.0%) | 16 (50.0%) |
| 26 to 34 Years | 17 (41.5%) | 24 (58.5%) |
| 35 to 44 Years | 39 (100.0%) | 0 (0.0%) |
| 45 to 54 Years | 30 (90.9%) | 3 (9.1%) |
| 55 to 64 Years | 34 (100.0%) | 0 (0.0%) |
| 65 to 74 Years | 15 (100.0%) | 0 (0.0%) |
| 75 Years and older | 36 (100.0%) | 0 (0.0%) |
| Total | 220 (83.7%) | 43 (16.4%) |
Health Insurance Coverage by Citizenship Status in Bayard
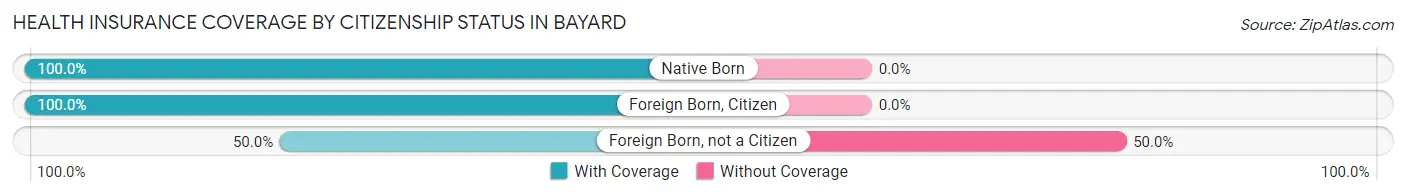
| Citizenship Status | With Coverage | Without Coverage |
| Native Born | 5 (100.0%) | 0 (0.0%) |
| Foreign Born, Citizen | 28 (100.0%) | 0 (0.0%) |
| Foreign Born, not a Citizen | 16 (50.0%) | 16 (50.0%) |
Health Insurance Coverage by Household Income in Bayard
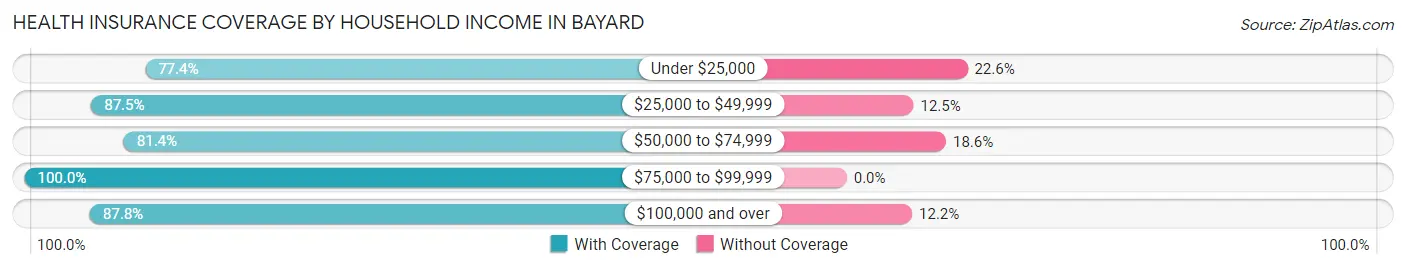
| Household Income | With Coverage | Without Coverage |
| Under $25,000 | 89 (77.4%) | 26 (22.6%) |
| $25,000 to $49,999 | 21 (87.5%) | 3 (12.5%) |
| $50,000 to $74,999 | 35 (81.4%) | 8 (18.6%) |
| $75,000 to $99,999 | 32 (100.0%) | 0 (0.0%) |
| $100,000 and over | 43 (87.8%) | 6 (12.2%) |
Public vs Private Health Insurance Coverage by Age in Bayard
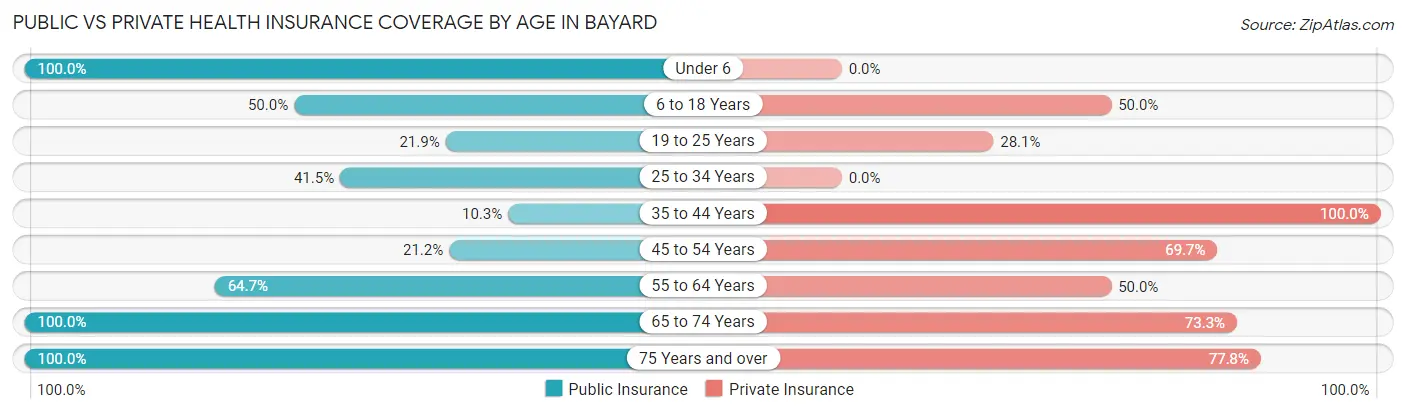
| Age Bracket | Public Insurance | Private Insurance |
| Under 6 | 5 (100.0%) | 0 (0.0%) |
| 6 to 18 Years | 14 (50.0%) | 14 (50.0%) |
| 19 to 25 Years | 7 (21.9%) | 9 (28.1%) |
| 25 to 34 Years | 17 (41.5%) | 0 (0.0%) |
| 35 to 44 Years | 4 (10.3%) | 39 (100.0%) |
| 45 to 54 Years | 7 (21.2%) | 23 (69.7%) |
| 55 to 64 Years | 22 (64.7%) | 17 (50.0%) |
| 65 to 74 Years | 15 (100.0%) | 11 (73.3%) |
| 75 Years and over | 36 (100.0%) | 28 (77.8%) |
| Total | 127 (48.3%) | 141 (53.6%) |
Disability Status by Sex by Age in Bayard
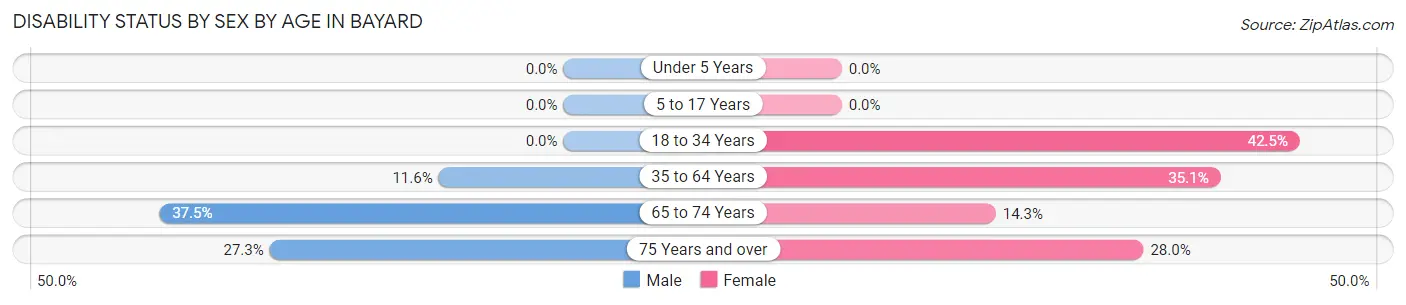
| Age Bracket | Male | Female |
| Under 5 Years | 0 (0.0%) | 0 (0.0%) |
| 5 to 17 Years | 0 (0.0%) | 0 (0.0%) |
| 18 to 34 Years | 0 (0.0%) | 17 (42.5%) |
| 35 to 64 Years | 8 (11.6%) | 13 (35.1%) |
| 65 to 74 Years | 3 (37.5%) | 1 (14.3%) |
| 75 Years and over | 3 (27.3%) | 7 (28.0%) |
Disability Class by Sex by Age in Bayard
Disability Class: Hearing Difficulty
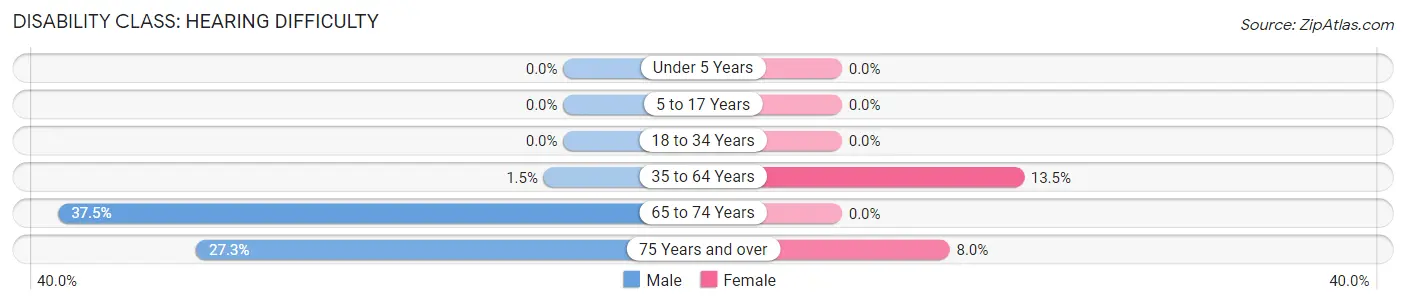
| Age Bracket | Male | Female |
| Under 5 Years | 0 (0.0%) | 0 (0.0%) |
| 5 to 17 Years | 0 (0.0%) | 0 (0.0%) |
| 18 to 34 Years | 0 (0.0%) | 0 (0.0%) |
| 35 to 64 Years | 1 (1.5%) | 5 (13.5%) |
| 65 to 74 Years | 3 (37.5%) | 0 (0.0%) |
| 75 Years and over | 3 (27.3%) | 2 (8.0%) |
Disability Class: Vision Difficulty
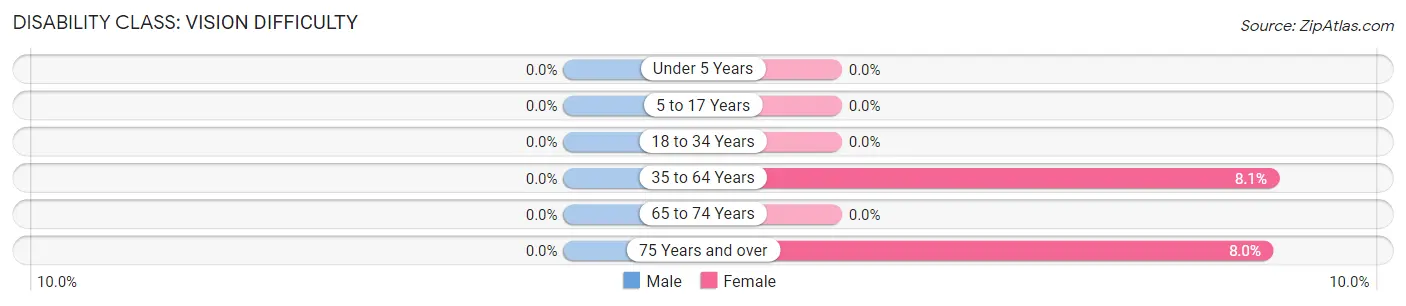
| Age Bracket | Male | Female |
| Under 5 Years | 0 (0.0%) | 0 (0.0%) |
| 5 to 17 Years | 0 (0.0%) | 0 (0.0%) |
| 18 to 34 Years | 0 (0.0%) | 0 (0.0%) |
| 35 to 64 Years | 0 (0.0%) | 3 (8.1%) |
| 65 to 74 Years | 0 (0.0%) | 0 (0.0%) |
| 75 Years and over | 0 (0.0%) | 2 (8.0%) |
Disability Class: Cognitive Difficulty
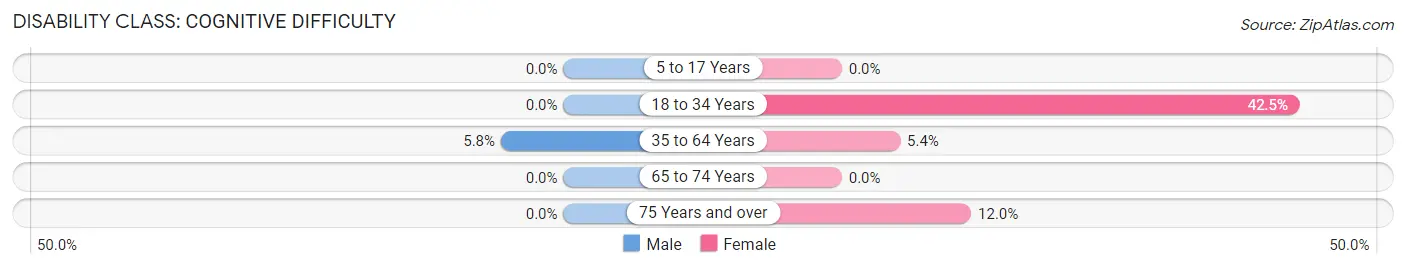
| Age Bracket | Male | Female |
| 5 to 17 Years | 0 (0.0%) | 0 (0.0%) |
| 18 to 34 Years | 0 (0.0%) | 17 (42.5%) |
| 35 to 64 Years | 4 (5.8%) | 2 (5.4%) |
| 65 to 74 Years | 0 (0.0%) | 0 (0.0%) |
| 75 Years and over | 0 (0.0%) | 3 (12.0%) |
Disability Class: Ambulatory Difficulty
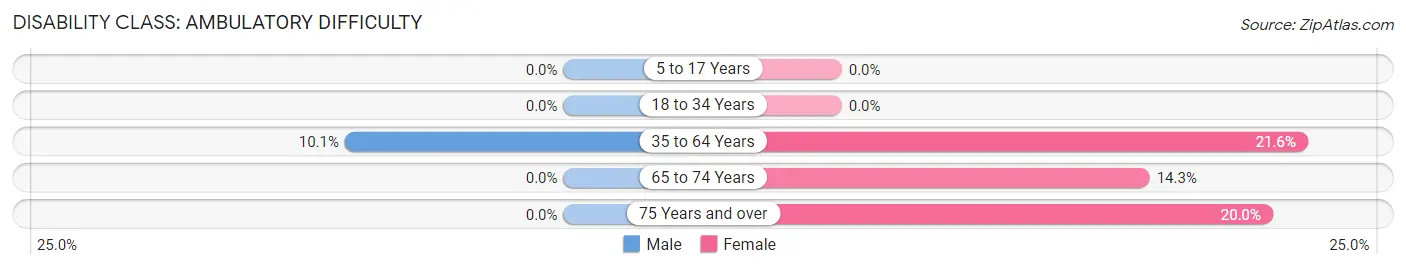
| Age Bracket | Male | Female |
| 5 to 17 Years | 0 (0.0%) | 0 (0.0%) |
| 18 to 34 Years | 0 (0.0%) | 0 (0.0%) |
| 35 to 64 Years | 7 (10.1%) | 8 (21.6%) |
| 65 to 74 Years | 0 (0.0%) | 1 (14.3%) |
| 75 Years and over | 0 (0.0%) | 5 (20.0%) |
Disability Class: Self-Care Difficulty
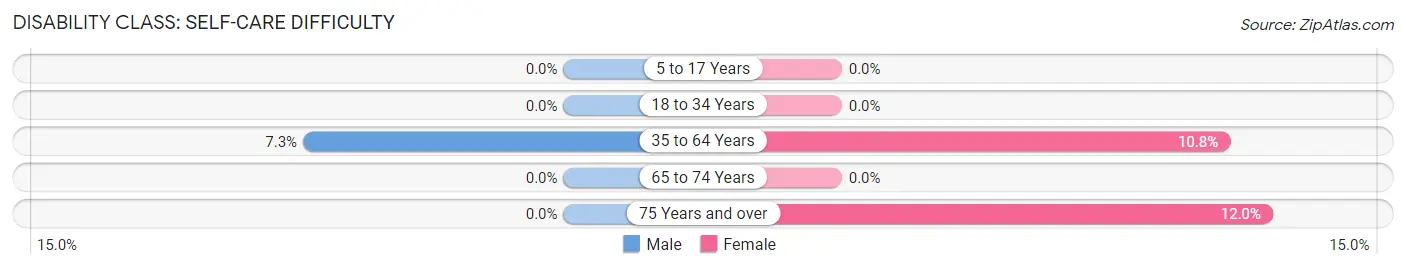
| Age Bracket | Male | Female |
| 5 to 17 Years | 0 (0.0%) | 0 (0.0%) |
| 18 to 34 Years | 0 (0.0%) | 0 (0.0%) |
| 35 to 64 Years | 5 (7.2%) | 4 (10.8%) |
| 65 to 74 Years | 0 (0.0%) | 0 (0.0%) |
| 75 Years and over | 0 (0.0%) | 3 (12.0%) |
Technology Access in Bayard
Computing Device Access in Bayard
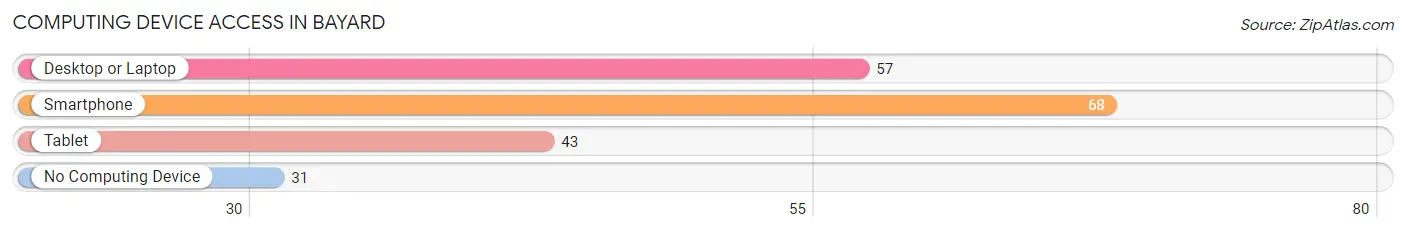
| Device Type | # Households | % Households |
| Desktop or Laptop | 57 | 52.3% |
| Smartphone | 68 | 62.4% |
| Tablet | 43 | 39.5% |
| No Computing Device | 31 | 28.4% |
| Total | 109 | 100.0% |
Internet Access in Bayard
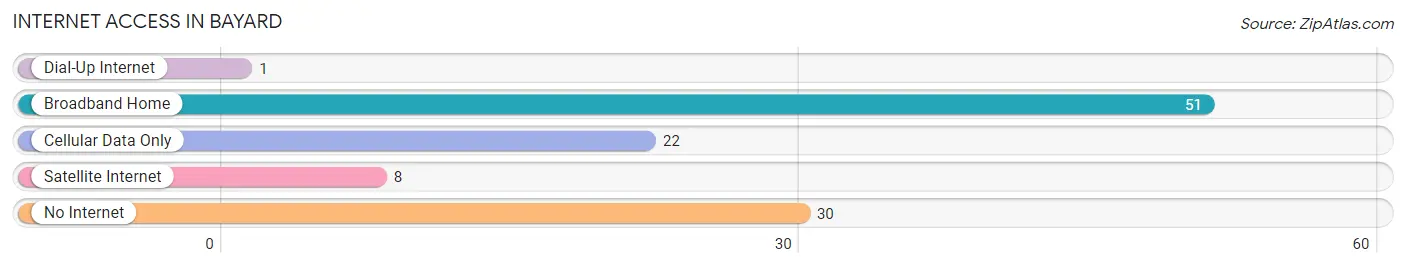
| Internet Type | # Households | % Households |
| Dial-Up Internet | 1 | 0.9% |
| Broadband Home | 51 | 46.8% |
| Cellular Data Only | 22 | 20.2% |
| Satellite Internet | 8 | 7.3% |
| No Internet | 30 | 27.5% |
| Total | 109 | 100.0% |
Bayard Summary
Bayard is a small town located in Grant County, West Virginia. It is situated in the Appalachian Mountains, and is part of the Potomac Highlands region. The town was founded in 1883 and was named after General George Dashiell Bayard, a Union Army officer who fought in the Civil War. The population of Bayard was 545 in the 2010 census.
Geography
Bayard is located in the Appalachian Mountains, in the Potomac Highlands region of West Virginia. The town is situated in Grant County, and is bordered by the towns of Petersburg, Moorefield, and Keyser. The town is located at an elevation of 1,845 feet above sea level. The town is situated on the banks of the North Fork of the South Branch of the Potomac River. The town is surrounded by the George Washington National Forest, and is located near the Monongahela National Forest.
Climate
Bayard has a humid continental climate, with cold winters and hot summers. The average annual temperature is 50.3°F, with an average high of 68.2°F in July and an average low of 32.4°F in January. The average annual precipitation is 40.3 inches, with an average of 4.3 inches of snowfall per year.
Demographics
As of the 2010 census, the population of Bayard was 545. The racial makeup of the town was 97.3% White, 0.2% African American, 0.2% Native American, 0.4% Asian, 0.2% from other races, and 1.7% from two or more races. Hispanic or Latino of any race were 0.7% of the population.
Economy
The economy of Bayard is largely based on agriculture and tourism. The town is home to several small businesses, including a grocery store, a hardware store, and a restaurant. The town is also home to a number of small farms, which produce a variety of crops, including corn, wheat, and hay. The town is also home to a number of tourist attractions, including the nearby Seneca Rocks National Recreation Area, the Smoke Hole Caverns, and the North Fork of the South Branch of the Potomac River.
History
Bayard was founded in 1883 and was named after General George Dashiell Bayard, a Union Army officer who fought in the Civil War. The town was originally a small farming community, and the economy was largely based on agriculture. In the early 20th century, the town began to grow, and several businesses were established. The town was also home to a number of tourist attractions, including the nearby Seneca Rocks National Recreation Area, the Smoke Hole Caverns, and the North Fork of the South Branch of the Potomac River. The town has remained largely unchanged since its founding, and continues to be a small, rural community.
Common Questions
What is Per Capita Income in Bayard?
Per Capita income in Bayard is $22,870.
What is the Median Family Income in Bayard?
Median Family Income in Bayard is $65,313.
What is the Median Household income in Bayard?
Median Household Income in Bayard is $26,250.
What is Inequality or Gini Index in Bayard?
Inequality or Gini Index in Bayard is 0.43.
What is the Total Population of Bayard?
Total Population of Bayard is 263.
What is the Total Male Population of Bayard?
Total Male Population of Bayard is 136.
What is the Total Female Population of Bayard?
Total Female Population of Bayard is 127.
What is the Ratio of Males per 100 Females in Bayard?
There are 107.09 Males per 100 Females in Bayard.
What is the Ratio of Females per 100 Males in Bayard?
There are 93.38 Females per 100 Males in Bayard.
What is the Median Population Age in Bayard?
Median Population Age in Bayard is 40.6 Years.
What is the Average Family Size in Bayard
Average Family Size in Bayard is 3.6 People.
What is the Average Household Size in Bayard
Average Household Size in Bayard is 2.4 People.
How Large is the Labor Force in Bayard?
There are 123 People in the Labor Forcein in Bayard.
What is the Percentage of People in the Labor Force in Bayard?
52.1% of People are in the Labor Force in Bayard.
What is the Unemployment Rate in Bayard?
Unemployment Rate in Bayard is 4.9%.