Sissonville, WV Map & Demographics
Sissonville Map
Sissonville Overview
$24,187
PER CAPITA INCOME
$57,247
AVG FAMILY INCOME
$54,856
AVG HOUSEHOLD INCOME
27.6%
WAGE / INCOME GAP [ % ]
72.4¢/ $1
WAGE / INCOME GAP [ $ ]
$7,113
FAMILY INCOME DEFICIT
0.39
INEQUALITY / GINI INDEX
2,680
TOTAL POPULATION
1,235
MALE POPULATION
1,445
FEMALE POPULATION
85.47
MALES / 100 FEMALES
117.00
FEMALES / 100 MALES
47.9
MEDIAN AGE
3.2
AVG FAMILY SIZE
2.5
AVG HOUSEHOLD SIZE
946
LABOR FORCE [ PEOPLE ]
46.3%
PERCENT IN LABOR FORCE
11.4%
UNEMPLOYMENT RATE
Sissonville Area Codes
Income in Sissonville
Income Overview in Sissonville
Per Capita Income in Sissonville is $24,187, while median incomes of families and households are $57,247 and $54,856 respectively.
| Characteristic | Number | Measure |
| Per Capita Income | 2,680 | $24,187 |
| Median Family Income | 721 | $57,247 |
| Mean Family Income | 721 | $69,794 |
| Median Household Income | 1,069 | $54,856 |
| Mean Household Income | 1,069 | $59,597 |
| Income Deficit | 721 | $7,113 |
| Wage / Income Gap (%) | 2,680 | 27.61% |
| Wage / Income Gap ($) | 2,680 | 72.39¢ per $1 |
| Gini / Inequality Index | 2,680 | 0.39 |
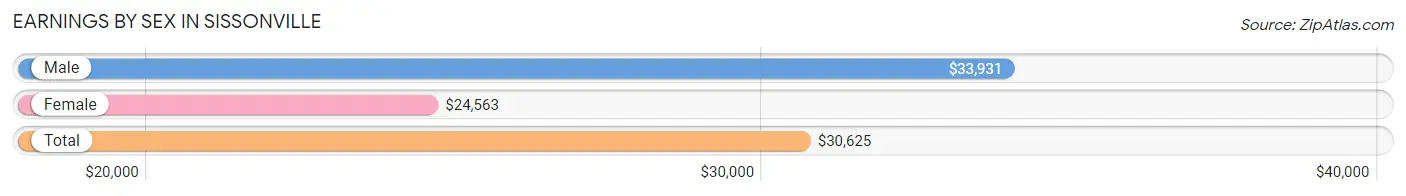
Earnings by Sex in Sissonville
Average Earnings in Sissonville are $30,625, $33,931 for men and $24,563 for women, a difference of 27.6%.
| Sex | Number | Average Earnings |
| Male | 465 (47.3%) | $33,931 |
| Female | 518 (52.7%) | $24,563 |
| Total | 983 (100.0%) | $30,625 |
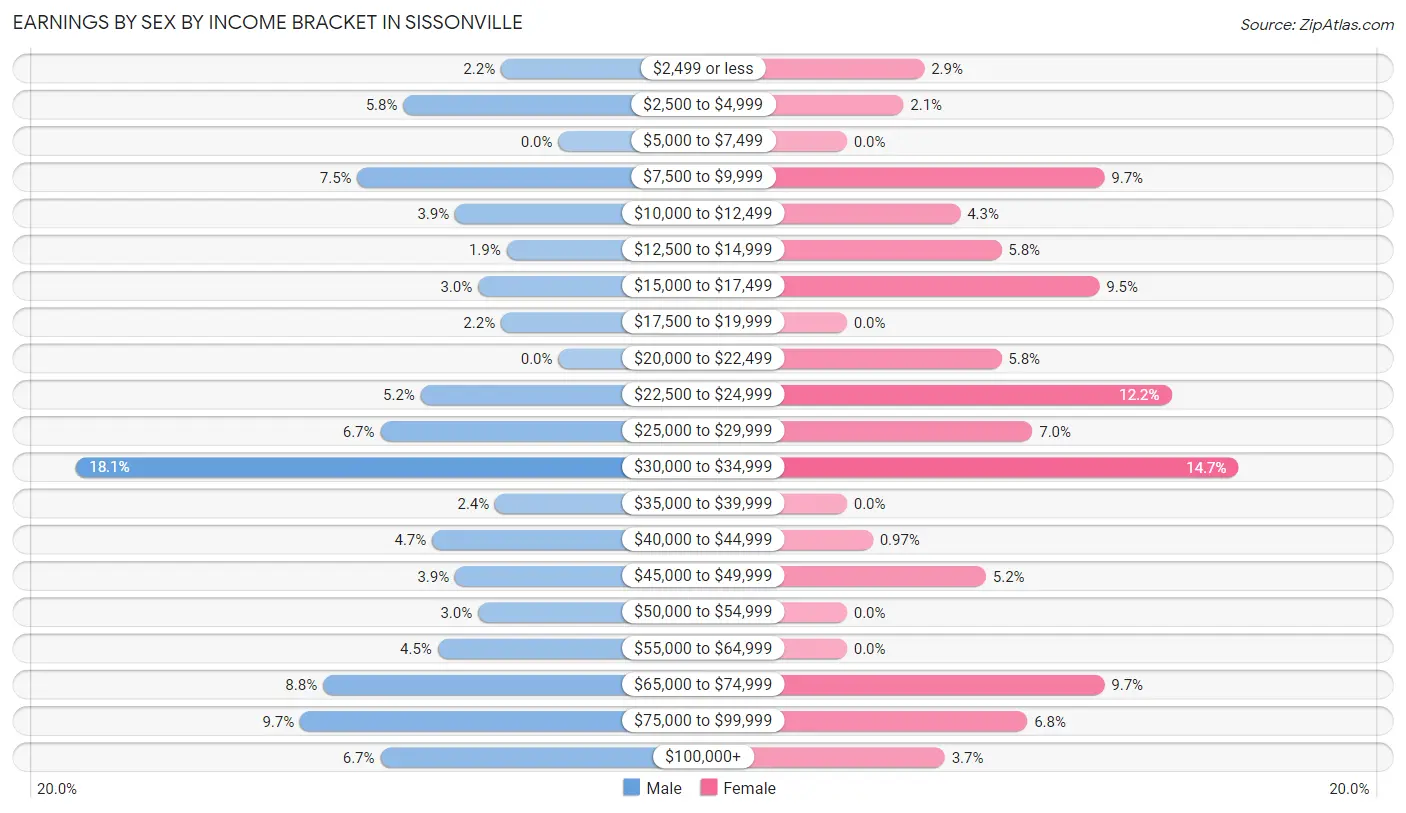
Earnings by Sex by Income Bracket in Sissonville
The most common earnings brackets in Sissonville are $30,000 to $34,999 for men (84 | 18.1%) and $30,000 to $34,999 for women (76 | 14.7%).
| Income | Male | Female |
| $2,499 or less | 10 (2.1%) | 15 (2.9%) |
| $2,500 to $4,999 | 27 (5.8%) | 11 (2.1%) |
| $5,000 to $7,499 | 0 (0.0%) | 0 (0.0%) |
| $7,500 to $9,999 | 35 (7.5%) | 50 (9.7%) |
| $10,000 to $12,499 | 18 (3.9%) | 22 (4.3%) |
| $12,500 to $14,999 | 9 (1.9%) | 30 (5.8%) |
| $15,000 to $17,499 | 14 (3.0%) | 49 (9.5%) |
| $17,500 to $19,999 | 10 (2.1%) | 0 (0.0%) |
| $20,000 to $22,499 | 0 (0.0%) | 30 (5.8%) |
| $22,500 to $24,999 | 24 (5.2%) | 63 (12.2%) |
| $25,000 to $29,999 | 31 (6.7%) | 36 (7.0%) |
| $30,000 to $34,999 | 84 (18.1%) | 76 (14.7%) |
| $35,000 to $39,999 | 11 (2.4%) | 0 (0.0%) |
| $40,000 to $44,999 | 22 (4.7%) | 5 (1.0%) |
| $45,000 to $49,999 | 18 (3.9%) | 27 (5.2%) |
| $50,000 to $54,999 | 14 (3.0%) | 0 (0.0%) |
| $55,000 to $64,999 | 21 (4.5%) | 0 (0.0%) |
| $65,000 to $74,999 | 41 (8.8%) | 50 (9.7%) |
| $75,000 to $99,999 | 45 (9.7%) | 35 (6.8%) |
| $100,000+ | 31 (6.7%) | 19 (3.7%) |
| Total | 465 (100.0%) | 518 (100.0%) |
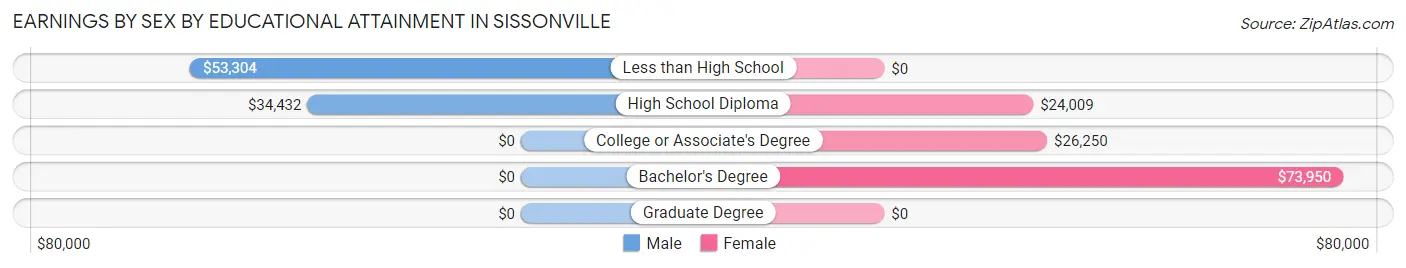
Earnings by Sex by Educational Attainment in Sissonville
Average earnings in Sissonville are $37,273 for men and $26,447 for women, a difference of 29.0%. Men with an educational attainment of less than high school enjoy the highest average annual earnings of $53,304, while those with high school diploma education earn the least with $34,432. Women with an educational attainment of bachelor's degree earn the most with the average annual earnings of $73,950, while those with high school diploma education have the smallest earnings of $24,009.
| Educational Attainment | Male Income | Female Income |
| Less than High School | $53,304 | $0 |
| High School Diploma | $34,432 | $24,009 |
| College or Associate's Degree | - | - |
| Bachelor's Degree | - | - |
| Graduate Degree | - | - |
| Total | $37,273 | $26,447 |
Family Income in Sissonville
Family Income Brackets in Sissonville
According to the Sissonville family income data, there are 212 families falling into the $50,000 to $74,999 income range, which is the most common income bracket and makes up 29.4% of all families.
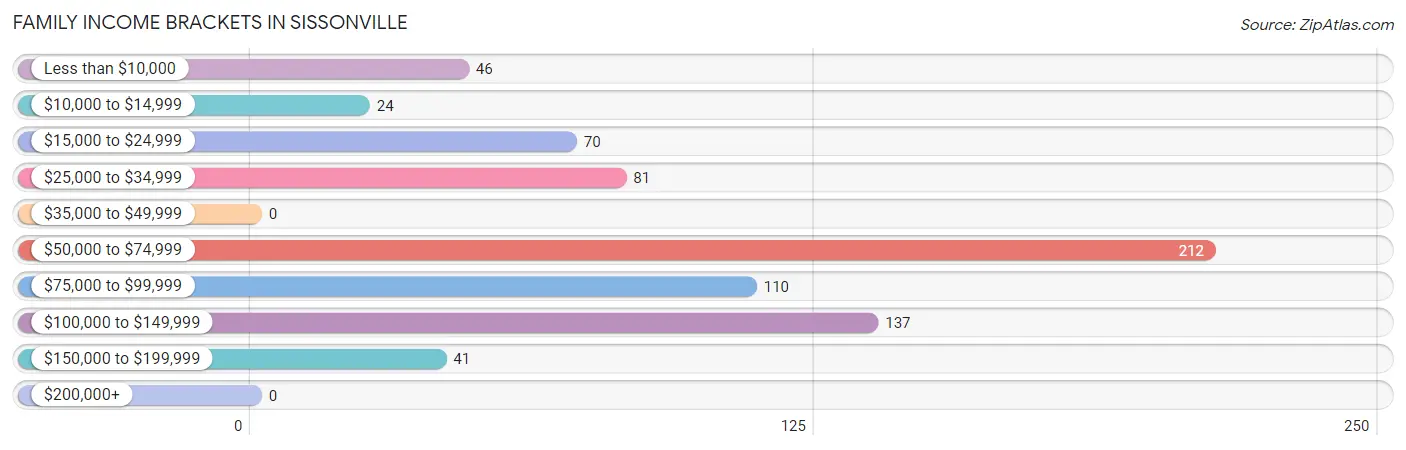
| Income Bracket | # Families | % Families |
| Less than $10,000 | 46 | 6.4% |
| $10,000 to $14,999 | 24 | 3.3% |
| $15,000 to $24,999 | 70 | 9.7% |
| $25,000 to $34,999 | 81 | 11.2% |
| $35,000 to $49,999 | 0 | 0.0% |
| $50,000 to $74,999 | 212 | 29.4% |
| $75,000 to $99,999 | 110 | 15.3% |
| $100,000 to $149,999 | 137 | 19.0% |
| $150,000 to $199,999 | 41 | 5.7% |
| $200,000+ | 0 | 0.0% |
Family Income by Famaliy Size in Sissonville
3-person families (171 | 23.7%) account for the highest median family income in Sissonville with $102,697 per family, while 3-person families (171 | 23.7%) have the highest median income of $34,232 per family member.
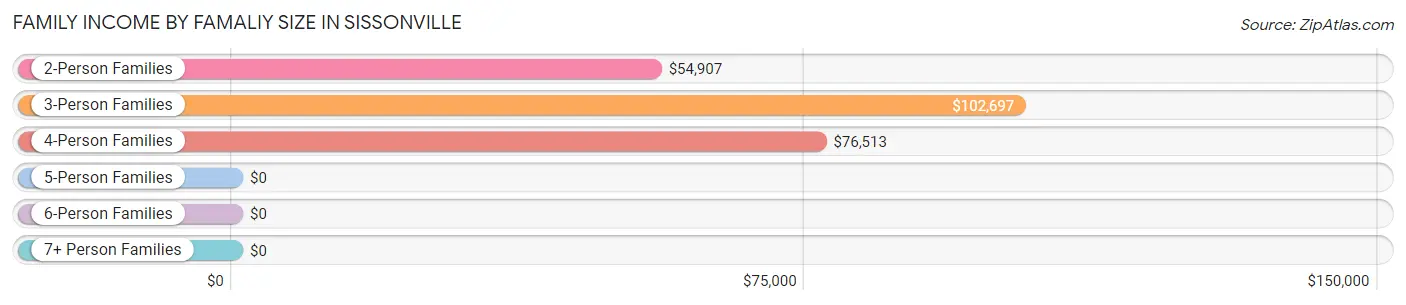
| Income Bracket | # Families | Median Income |
| 2-Person Families | 402 (55.8%) | $54,907 |
| 3-Person Families | 171 (23.7%) | $102,697 |
| 4-Person Families | 35 (4.9%) | $76,513 |
| 5-Person Families | 64 (8.9%) | $0 |
| 6-Person Families | 23 (3.2%) | $0 |
| 7+ Person Families | 26 (3.6%) | $0 |
| Total | 721 (100.0%) | $57,247 |
Family Income by Number of Earners in Sissonville
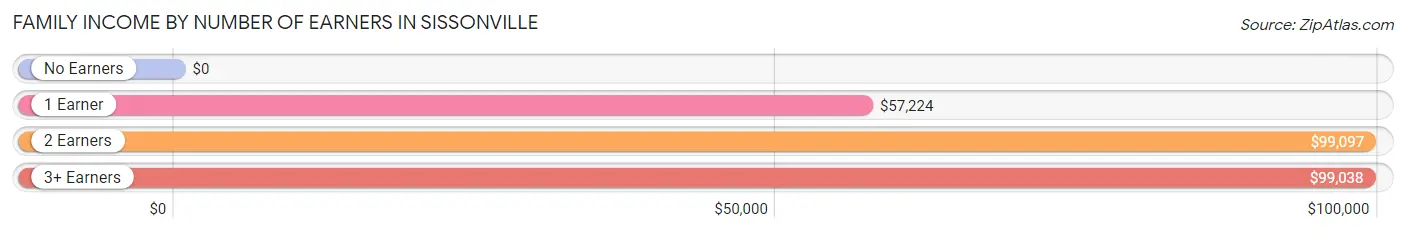
| Number of Earners | # Families | Median Income |
| No Earners | 237 (32.9%) | $0 |
| 1 Earner | 299 (41.5%) | $57,224 |
| 2 Earners | 123 (17.1%) | $99,097 |
| 3+ Earners | 62 (8.6%) | $99,038 |
| Total | 721 (100.0%) | $57,247 |
Household Income in Sissonville
Household Income Brackets in Sissonville
With 345 households falling in the category, the $50,000 to $74,999 income range is the most frequent in Sissonville, accounting for 32.3% of all households.
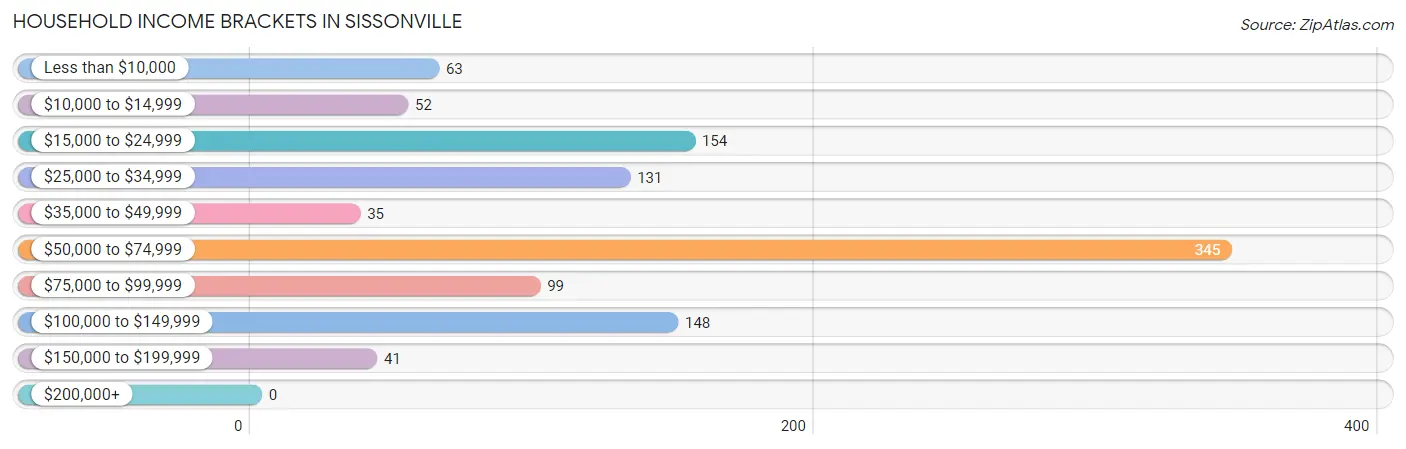
| Income Bracket | # Households | % Households |
| Less than $10,000 | 63 | 5.9% |
| $10,000 to $14,999 | 52 | 4.9% |
| $15,000 to $24,999 | 154 | 14.4% |
| $25,000 to $34,999 | 131 | 12.3% |
| $35,000 to $49,999 | 35 | 3.3% |
| $50,000 to $74,999 | 345 | 32.3% |
| $75,000 to $99,999 | 99 | 9.3% |
| $100,000 to $149,999 | 148 | 13.8% |
| $150,000 to $199,999 | 41 | 3.8% |
| $200,000+ | 0 | 0.0% |
Household Income by Householder Age in Sissonville
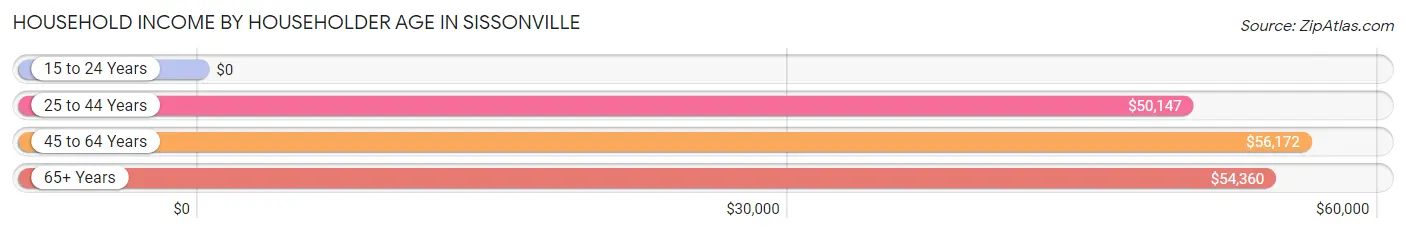
The median household income in Sissonville is $54,856, with the highest median household income of $56,172 found in the 45 to 64 years age bracket for the primary householder. A total of 457 households (42.7%) fall into this category.
| Income Bracket | # Households | Median Income |
| 15 to 24 Years | 0 (0.0%) | $0 |
| 25 to 44 Years | 246 (23.0%) | $50,147 |
| 45 to 64 Years | 457 (42.7%) | $56,172 |
| 65+ Years | 366 (34.2%) | $54,360 |
| Total | 1,069 (100.0%) | $54,856 |
Poverty in Sissonville
Income Below Poverty by Sex and Age in Sissonville
With 20.2% poverty level for males and 18.3% for females among the residents of Sissonville, 6 to 11 year old males and 25 to 34 year old females are the most vulnerable to poverty, with 130 males (71.4%) and 67 females (64.4%) in their respective age groups living below the poverty level.
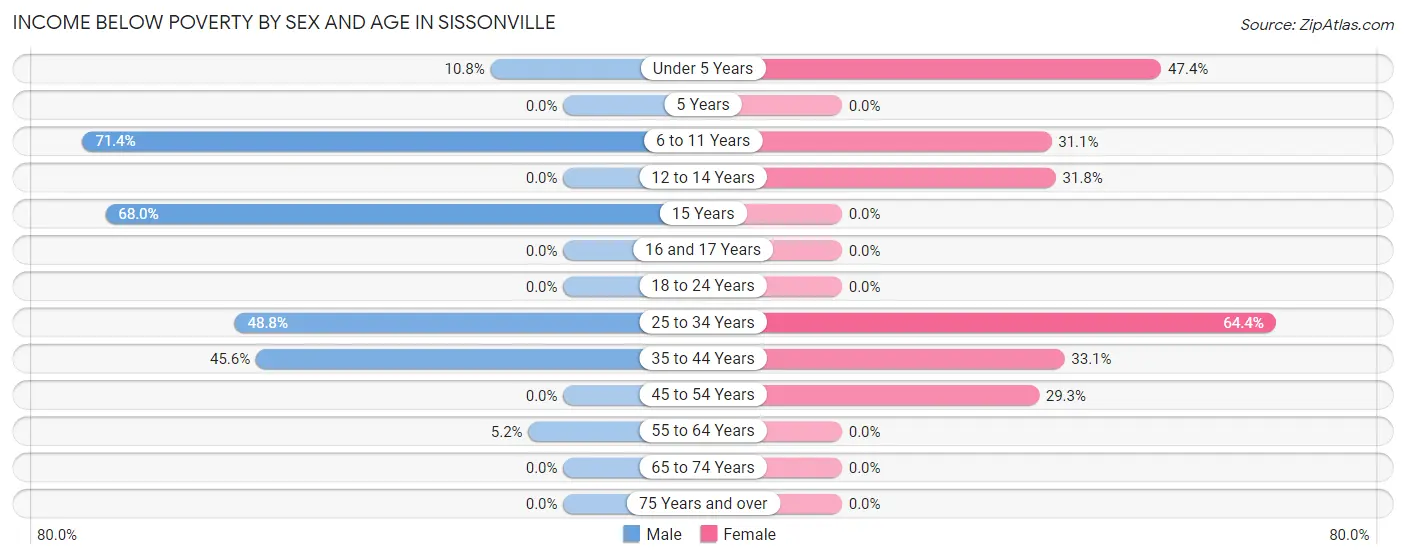
| Age Bracket | Male | Female |
| Under 5 Years | 4 (10.8%) | 46 (47.4%) |
| 5 Years | 0 (0.0%) | 0 (0.0%) |
| 6 to 11 Years | 130 (71.4%) | 28 (31.1%) |
| 12 to 14 Years | 0 (0.0%) | 20 (31.8%) |
| 15 Years | 17 (68.0%) | 0 (0.0%) |
| 16 and 17 Years | 0 (0.0%) | 0 (0.0%) |
| 18 to 24 Years | 0 (0.0%) | 0 (0.0%) |
| 25 to 34 Years | 41 (48.8%) | 67 (64.4%) |
| 35 to 44 Years | 47 (45.6%) | 39 (33.1%) |
| 45 to 54 Years | 0 (0.0%) | 62 (29.2%) |
| 55 to 64 Years | 8 (5.2%) | 0 (0.0%) |
| 65 to 74 Years | 0 (0.0%) | 0 (0.0%) |
| 75 Years and over | 0 (0.0%) | 0 (0.0%) |
| Total | 247 (20.2%) | 262 (18.3%) |
Income Above Poverty by Sex and Age in Sissonville
According to the poverty statistics in Sissonville, males aged 5 years and females aged 5 years are the age groups that are most secure financially, with 100.0% of males and 100.0% of females in these age groups living above the poverty line.
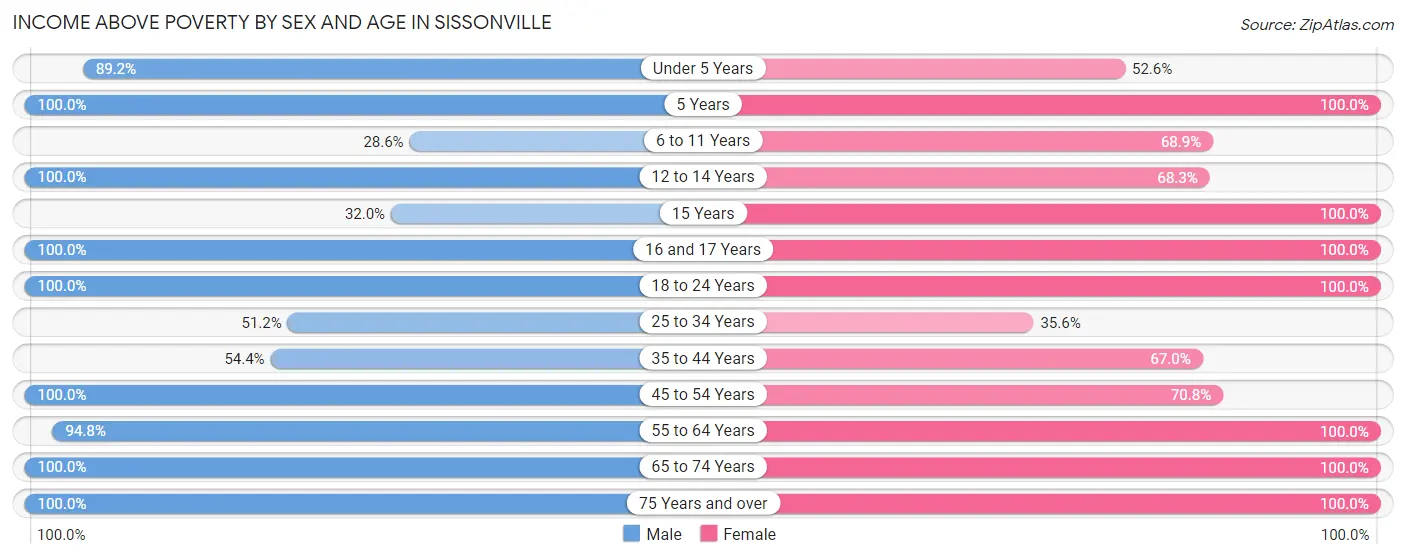
| Age Bracket | Male | Female |
| Under 5 Years | 33 (89.2%) | 51 (52.6%) |
| 5 Years | 11 (100.0%) | 45 (100.0%) |
| 6 to 11 Years | 52 (28.6%) | 62 (68.9%) |
| 12 to 14 Years | 66 (100.0%) | 43 (68.2%) |
| 15 Years | 8 (32.0%) | 21 (100.0%) |
| 16 and 17 Years | 45 (100.0%) | 31 (100.0%) |
| 18 to 24 Years | 87 (100.0%) | 42 (100.0%) |
| 25 to 34 Years | 43 (51.2%) | 37 (35.6%) |
| 35 to 44 Years | 56 (54.4%) | 79 (66.9%) |
| 45 to 54 Years | 146 (100.0%) | 150 (70.8%) |
| 55 to 64 Years | 146 (94.8%) | 240 (100.0%) |
| 65 to 74 Years | 195 (100.0%) | 253 (100.0%) |
| 75 Years and over | 90 (100.0%) | 119 (100.0%) |
| Total | 978 (79.8%) | 1,173 (81.7%) |
Income Below Poverty Among Married-Couple Families in Sissonville
The poverty statistics for married-couple families in Sissonville show that 10.3% or 57 of the total 554 families live below the poverty line. Families with 3 or 4 children have the highest poverty rate of 52.4%, comprising of 43 families. On the other hand, families with no children have the lowest poverty rate of 2.1%, which includes 8 families.
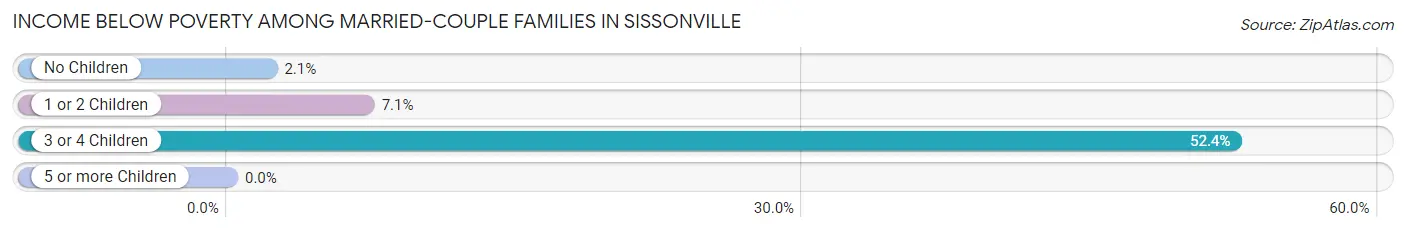
| Children | Above Poverty | Below Poverty |
| No Children | 380 (97.9%) | 8 (2.1%) |
| 1 or 2 Children | 78 (92.9%) | 6 (7.1%) |
| 3 or 4 Children | 39 (47.6%) | 43 (52.4%) |
| 5 or more Children | 0 (0.0%) | 0 (0.0%) |
| Total | 497 (89.7%) | 57 (10.3%) |
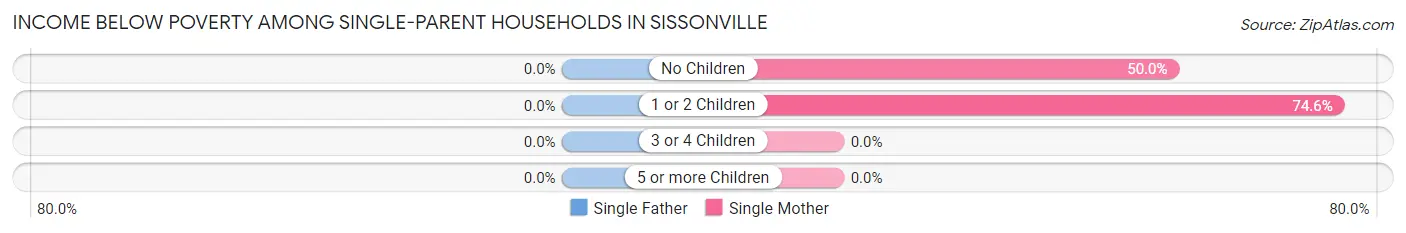
Income Below Poverty Among Single-Parent Households in Sissonville
| Children | Single Father | Single Mother |
| No Children | 0 (0.0%) | 24 (50.0%) |
| 1 or 2 Children | 0 (0.0%) | 50 (74.6%) |
| 3 or 4 Children | 0 (0.0%) | 0 (0.0%) |
| 5 or more Children | 0 (0.0%) | 0 (0.0%) |
| Total | 0 (0.0%) | 74 (52.5%) |
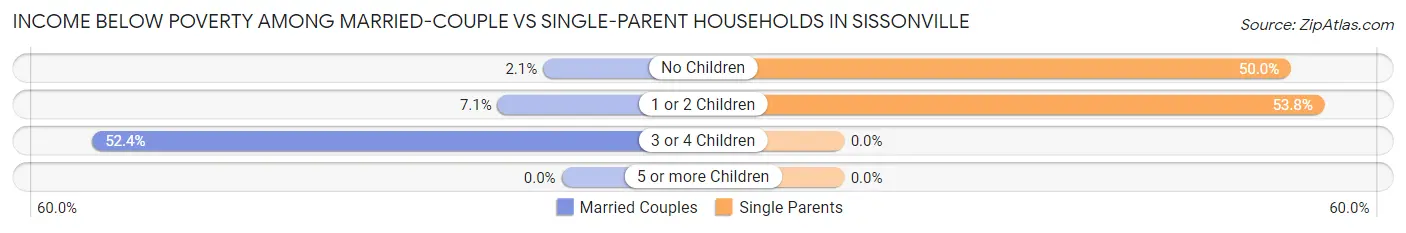
Income Below Poverty Among Married-Couple vs Single-Parent Households in Sissonville
The poverty data for Sissonville shows that 57 of the married-couple family households (10.3%) and 74 of the single-parent households (44.3%) are living below the poverty level. Within the married-couple family households, those with 3 or 4 children have the highest poverty rate, with 43 households (52.4%) falling below the poverty line. Among the single-parent households, those with 1 or 2 children have the highest poverty rate, with 50 household (53.8%) living below poverty.
| Children | Married-Couple Families | Single-Parent Households |
| No Children | 8 (2.1%) | 24 (50.0%) |
| 1 or 2 Children | 6 (7.1%) | 50 (53.8%) |
| 3 or 4 Children | 43 (52.4%) | 0 (0.0%) |
| 5 or more Children | 0 (0.0%) | 0 (0.0%) |
| Total | 57 (10.3%) | 74 (44.3%) |
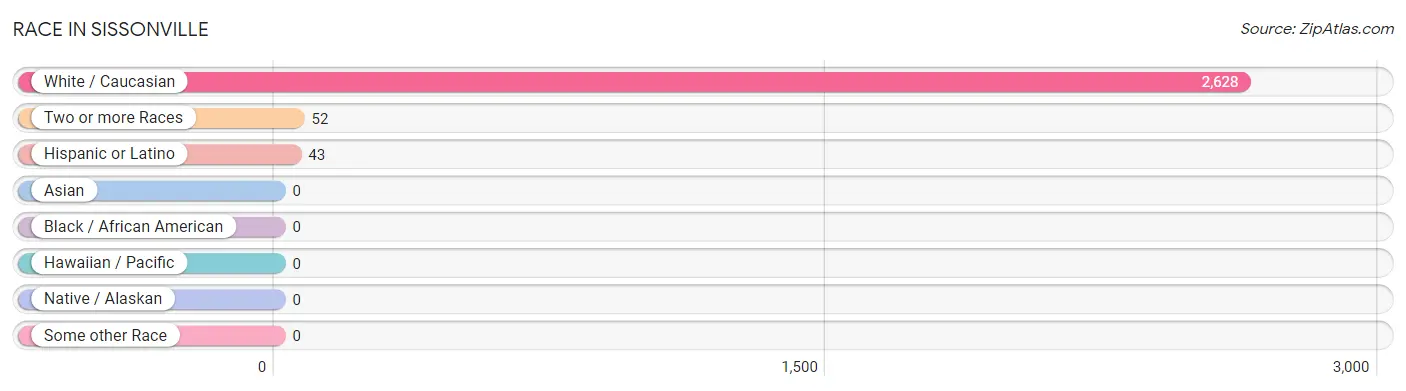
Race in Sissonville
The most populous races in Sissonville are White / Caucasian (2,628 | 98.1%), Two or more Races (52 | 1.9%), and Hispanic or Latino (43 | 1.6%).
| Race | # Population | % Population |
| Asian | 0 | 0.0% |
| Black / African American | 0 | 0.0% |
| Hawaiian / Pacific | 0 | 0.0% |
| Hispanic or Latino | 43 | 1.6% |
| Native / Alaskan | 0 | 0.0% |
| White / Caucasian | 2,628 | 98.1% |
| Two or more Races | 52 | 1.9% |
| Some other Race | 0 | 0.0% |
| Total | 2,680 | 100.0% |
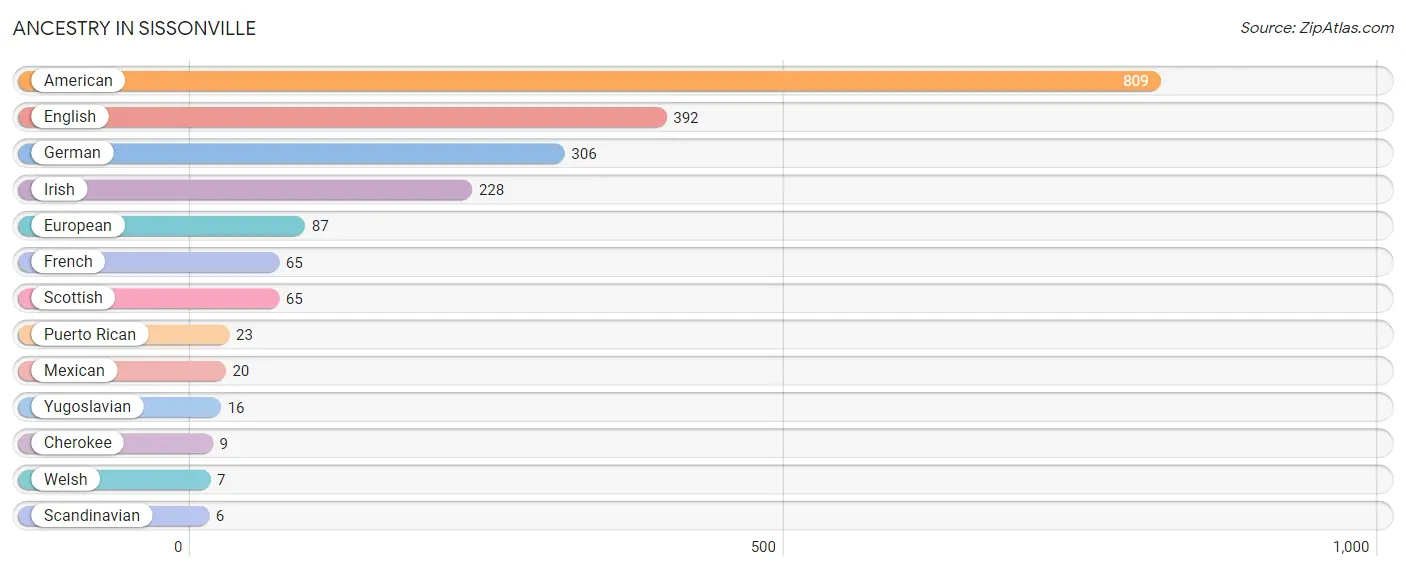
Ancestry in Sissonville
The most populous ancestries reported in Sissonville are American (809 | 30.2%), English (392 | 14.6%), German (306 | 11.4%), Irish (228 | 8.5%), and European (87 | 3.3%), together accounting for 68.0% of all Sissonville residents.
| Ancestry | # Population | % Population |
| American | 809 | 30.2% |
| Cherokee | 9 | 0.3% |
| English | 392 | 14.6% |
| European | 87 | 3.3% |
| French | 65 | 2.4% |
| German | 306 | 11.4% |
| Irish | 228 | 8.5% |
| Mexican | 20 | 0.7% |
| Puerto Rican | 23 | 0.9% |
| Scandinavian | 6 | 0.2% |
| Scottish | 65 | 2.4% |
| Welsh | 7 | 0.3% |
| Yugoslavian | 16 | 0.6% | View All 13 Rows |
Immigrants in Sissonville

| Immigration Origin | # Population | % Population | View All 0 Rows |
Sex and Age in Sissonville
Sex and Age in Sissonville
The most populous age groups in Sissonville are 5 to 9 Years (141 | 11.4%) for men and 70 to 74 Years (176 | 12.2%) for women.
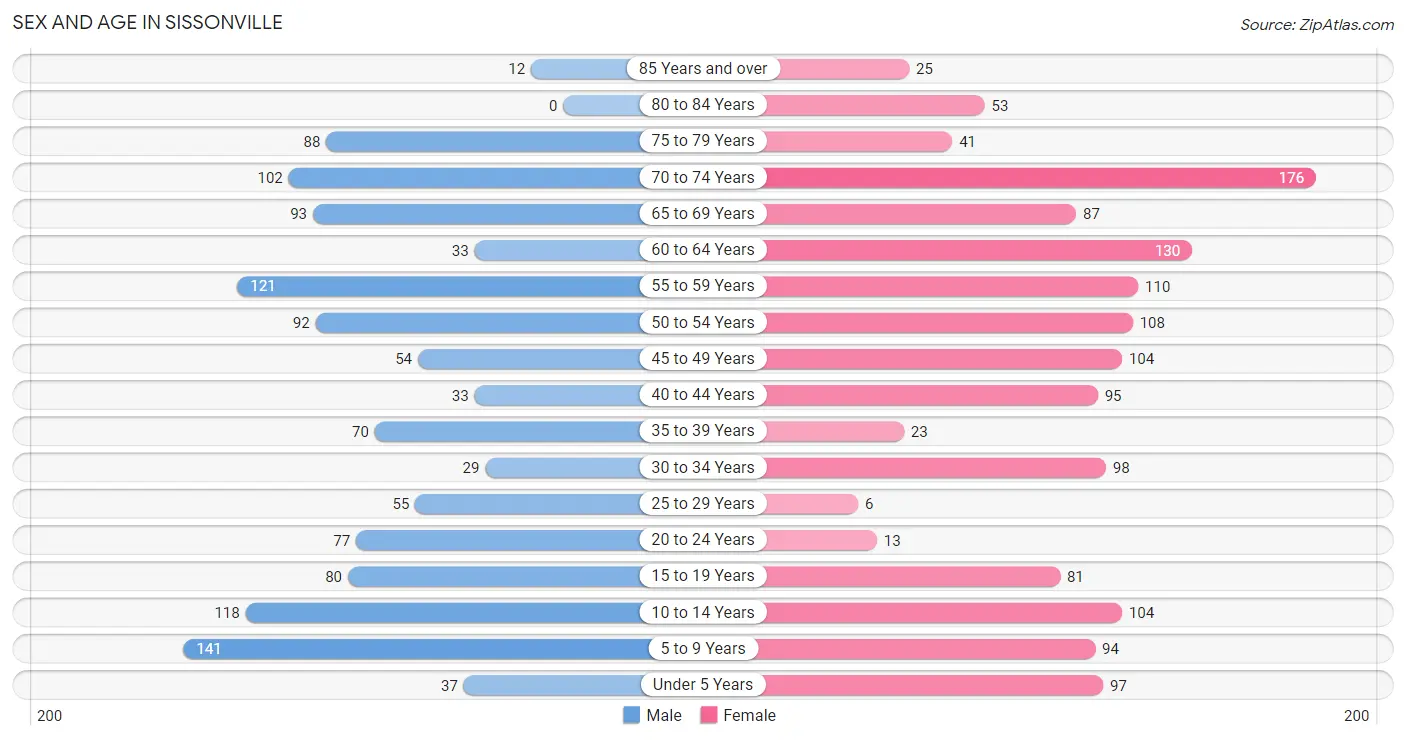
| Age Bracket | Male | Female |
| Under 5 Years | 37 (3.0%) | 97 (6.7%) |
| 5 to 9 Years | 141 (11.4%) | 94 (6.5%) |
| 10 to 14 Years | 118 (9.6%) | 104 (7.2%) |
| 15 to 19 Years | 80 (6.5%) | 81 (5.6%) |
| 20 to 24 Years | 77 (6.2%) | 13 (0.9%) |
| 25 to 29 Years | 55 (4.4%) | 6 (0.4%) |
| 30 to 34 Years | 29 (2.4%) | 98 (6.8%) |
| 35 to 39 Years | 70 (5.7%) | 23 (1.6%) |
| 40 to 44 Years | 33 (2.7%) | 95 (6.6%) |
| 45 to 49 Years | 54 (4.4%) | 104 (7.2%) |
| 50 to 54 Years | 92 (7.4%) | 108 (7.5%) |
| 55 to 59 Years | 121 (9.8%) | 110 (7.6%) |
| 60 to 64 Years | 33 (2.7%) | 130 (9.0%) |
| 65 to 69 Years | 93 (7.5%) | 87 (6.0%) |
| 70 to 74 Years | 102 (8.3%) | 176 (12.2%) |
| 75 to 79 Years | 88 (7.1%) | 41 (2.8%) |
| 80 to 84 Years | 0 (0.0%) | 53 (3.7%) |
| 85 Years and over | 12 (1.0%) | 25 (1.7%) |
| Total | 1,235 (100.0%) | 1,445 (100.0%) |
Families and Households in Sissonville
Median Family Size in Sissonville
The median family size in Sissonville is 3.17 persons per family, with single female/mother families (141 | 19.6%) accounting for the largest median family size of 3.9 persons per family. On the other hand, single male/father families (26 | 3.6%) represent the smallest median family size with 2.73 persons per family.
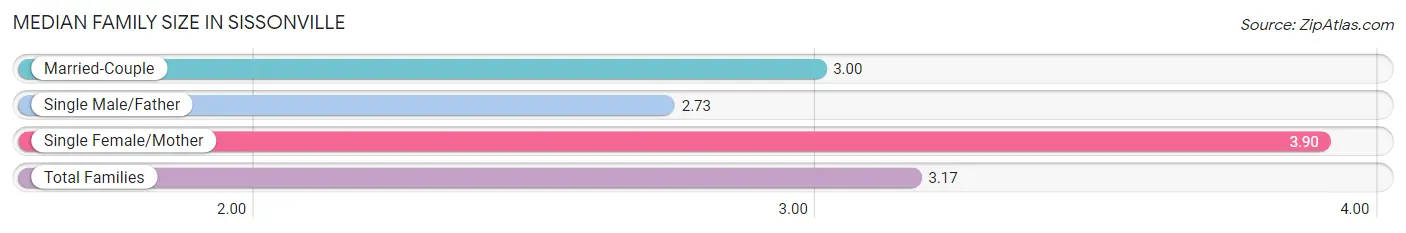
| Family Type | # Families | Family Size |
| Married-Couple | 554 (76.8%) | 3.00 |
| Single Male/Father | 26 (3.6%) | 2.73 |
| Single Female/Mother | 141 (19.6%) | 3.90 |
| Total Families | 721 (100.0%) | 3.17 |
Median Household Size in Sissonville
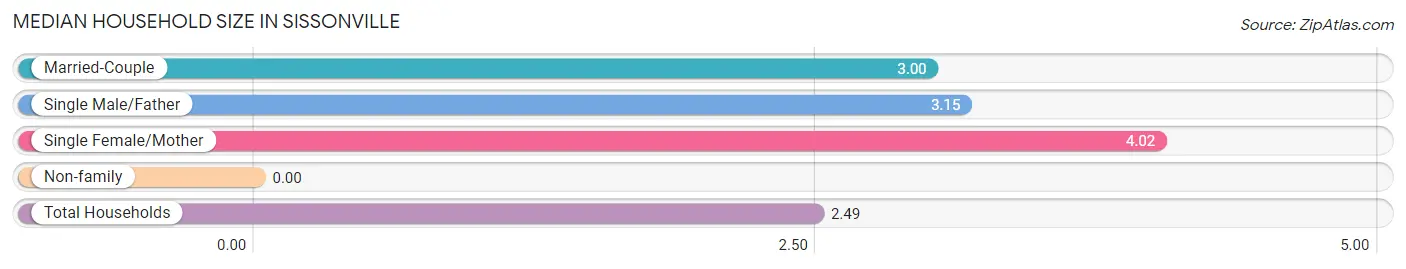
| Household Type | # Households | Household Size |
| Married-Couple | 554 (51.8%) | 3.00 |
| Single Male/Father | 26 (2.4%) | 3.15 |
| Single Female/Mother | 141 (13.2%) | 4.02 |
| Non-family | 348 (32.6%) | - |
| Total Households | 1,069 (100.0%) | 2.49 |
Household Size by Marriage Status in Sissonville
Out of a total of 1,069 households in Sissonville, 721 (67.4%) are family households, while 348 (32.6%) are nonfamily households. The most numerous type of family households are 2-person households, comprising 385, and the most common type of nonfamily households are 1-person households, comprising 348.
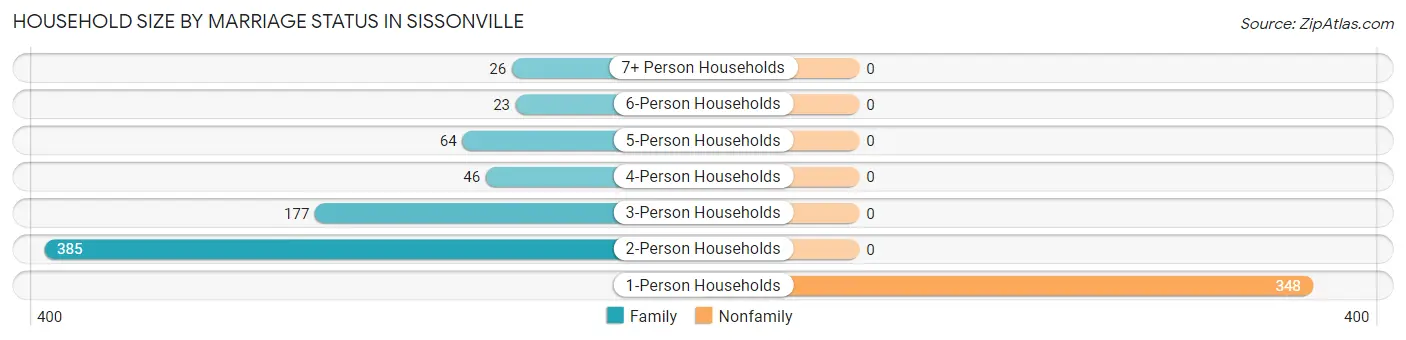
| Household Size | Family Households | Nonfamily Households |
| 1-Person Households | - | 348 (32.6%) |
| 2-Person Households | 385 (36.0%) | 0 (0.0%) |
| 3-Person Households | 177 (16.6%) | 0 (0.0%) |
| 4-Person Households | 46 (4.3%) | 0 (0.0%) |
| 5-Person Households | 64 (6.0%) | 0 (0.0%) |
| 6-Person Households | 23 (2.1%) | 0 (0.0%) |
| 7+ Person Households | 26 (2.4%) | 0 (0.0%) |
| Total | 721 (67.4%) | 348 (32.6%) |
Female Fertility in Sissonville
Fertility by Age in Sissonville
| Age Bracket | Women with Births | Births / 1,000 Women |
| 15 to 19 years | 0 (0.0%) | 0.0 |
| 20 to 34 years | 0 (0.0%) | 0.0 |
| 35 to 50 years | 0 (0.0%) | 0.0 |
| Total | 0 (0.0%) | 0.0 |
Fertility by Age by Marriage Status in Sissonville
| Age Bracket | Married | Unmarried |
| 15 to 19 years | 0 (0.0%) | 0 (0.0%) |
| 20 to 34 years | 0 (0.0%) | 0 (0.0%) |
| 35 to 50 years | 0 (0.0%) | 0 (0.0%) |
| Total | 0 (0.0%) | 0 (0.0%) |
Fertility by Education in Sissonville
| Educational Attainment | Women with Births | Births / 1,000 Women |
| Less than High School | 0 (0.0%) | 0.0 |
| High School Diploma | 0 (0.0%) | 0.0 |
| College or Associate's Degree | 0 (0.0%) | 0.0 |
| Bachelor's Degree | 0 (0.0%) | 0.0 |
| Graduate Degree | 0 (0.0%) | 0.0 |
| Total | 0 (0.0%) | 0.0 |
Fertility by Education by Marriage Status in Sissonville
| Educational Attainment | Married | Unmarried |
| Less than High School | 0 (0.0%) | 0 (0.0%) |
| High School Diploma | 0 (0.0%) | 0 (0.0%) |
| College or Associate's Degree | 0 (0.0%) | 0 (0.0%) |
| Bachelor's Degree | 0 (0.0%) | 0 (0.0%) |
| Graduate Degree | 0 (0.0%) | 0 (0.0%) |
| Total | 0 (0.0%) | 0 (0.0%) |
Employment Characteristics in Sissonville
Employment by Class of Employer in Sissonville
Among the 840 employed individuals in Sissonville, private company employees (518 | 61.7%), state government employees (117 | 13.9%), and not-for-profit organizations (66 | 7.9%) make up the most common classes of employment.
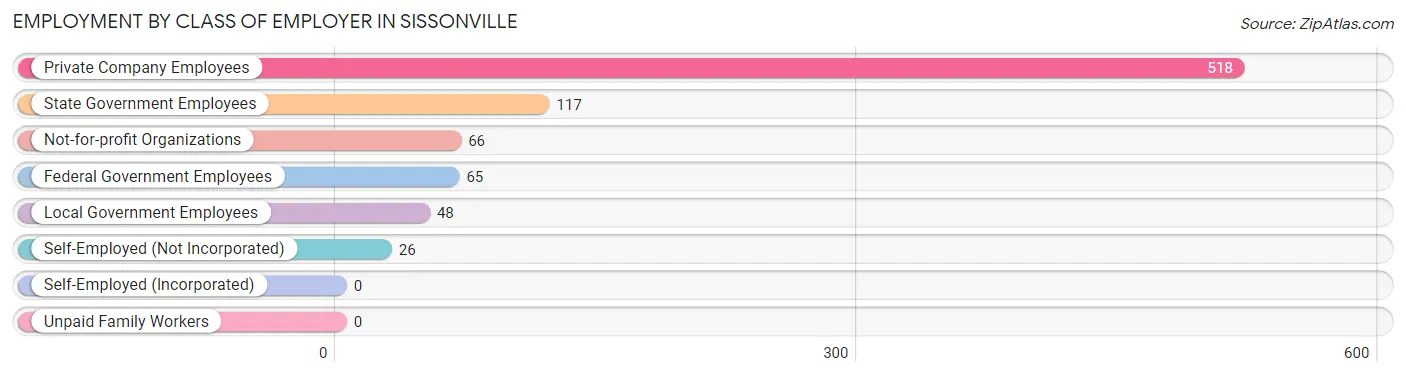
| Employer Class | # Employees | % Employees |
| Private Company Employees | 518 | 61.7% |
| Self-Employed (Incorporated) | 0 | 0.0% |
| Self-Employed (Not Incorporated) | 26 | 3.1% |
| Not-for-profit Organizations | 66 | 7.9% |
| Local Government Employees | 48 | 5.7% |
| State Government Employees | 117 | 13.9% |
| Federal Government Employees | 65 | 7.7% |
| Unpaid Family Workers | 0 | 0.0% |
| Total | 840 | 100.0% |
Employment Status by Age in Sissonville
According to the labor force statistics for Sissonville, out of the total population over 16 years of age (2,043), 46.3% or 946 individuals are in the labor force, with 11.4% or 108 of them unemployed. The age group with the highest labor force participation rate is 45 to 54 years, with 76.0% or 272 individuals in the labor force. Within the labor force, the 16 to 19 years age range has the highest percentage of unemployed individuals, with 86.8% or 66 of them being unemployed.
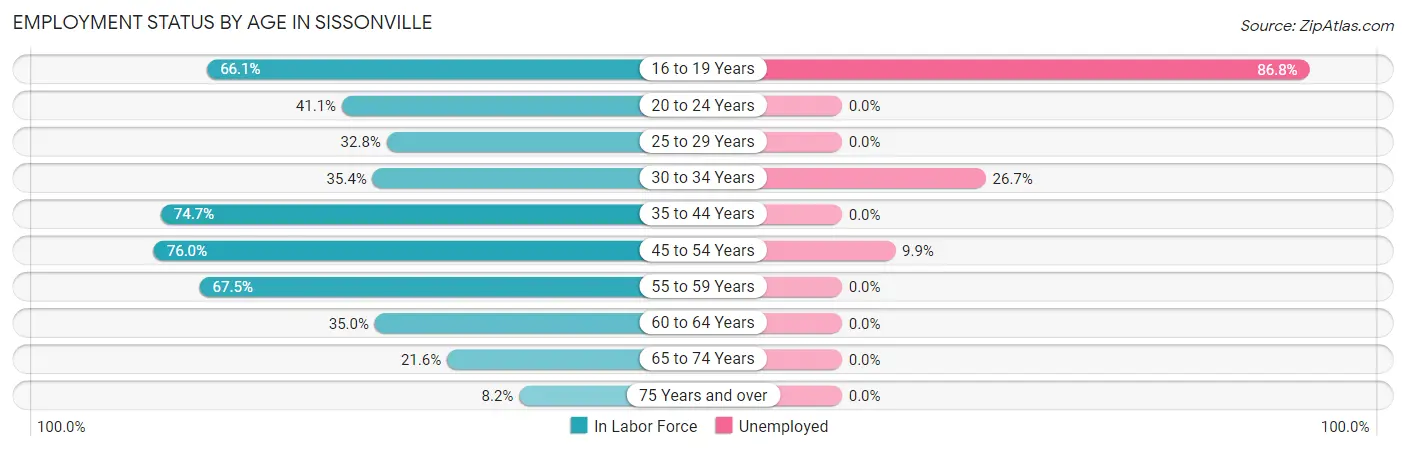
| Age Bracket | In Labor Force | Unemployed |
| 16 to 19 Years | 76 (66.1%) | 66 (86.8%) |
| 20 to 24 Years | 37 (41.1%) | 0 (0.0%) |
| 25 to 29 Years | 20 (32.8%) | 0 (0.0%) |
| 30 to 34 Years | 45 (35.4%) | 12 (26.7%) |
| 35 to 44 Years | 165 (74.7%) | 0 (0.0%) |
| 45 to 54 Years | 272 (76.0%) | 27 (9.9%) |
| 55 to 59 Years | 156 (67.5%) | 0 (0.0%) |
| 60 to 64 Years | 57 (35.0%) | 0 (0.0%) |
| 65 to 74 Years | 99 (21.6%) | 0 (0.0%) |
| 75 Years and over | 18 (8.2%) | 0 (0.0%) |
| Total | 946 (46.3%) | 108 (11.4%) |
Employment Status by Educational Attainment in Sissonville
According to labor force statistics for Sissonville, 61.6% of individuals (715) out of the total population between 25 and 64 years of age (1,161) are in the labor force, with 5.5% or 39 of them being unemployed. The group with the highest labor force participation rate are those with the educational attainment of bachelor's degree or higher, with 71.6% or 111 individuals in the labor force. Within the labor force, individuals with college / associate degree education have the highest percentage of unemployment, with 7.0% or 19 of them being unemployed.
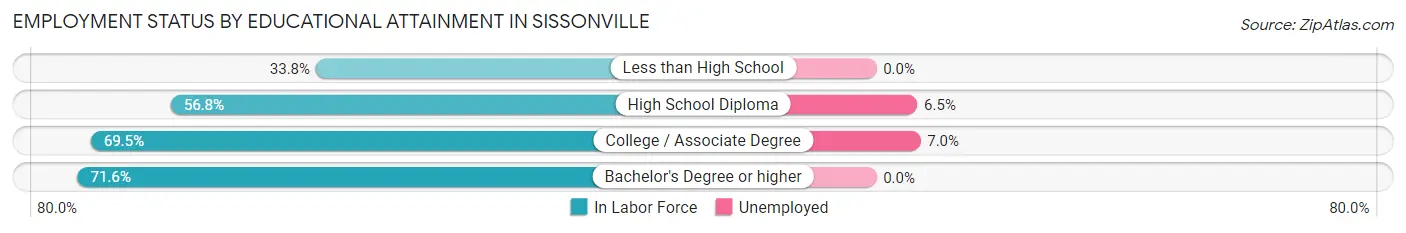
| Educational Attainment | In Labor Force | Unemployed |
| Less than High School | 25 (33.8%) | 0 (0.0%) |
| High School Diploma | 306 (56.8%) | 35 (6.5%) |
| College / Associate Degree | 273 (69.5%) | 28 (7.0%) |
| Bachelor's Degree or higher | 111 (71.6%) | 0 (0.0%) |
| Total | 715 (61.6%) | 64 (5.5%) |
Employment Occupations by Sex in Sissonville
Management, Business, Science and Arts Occupations
The most common Management, Business, Science and Arts occupations in Sissonville are Management (125 | 15.3%), Health Diagnosing & Treating (86 | 10.5%), Community & Social Service (65 | 8.0%), Health Technologists (59 | 7.2%), and Legal Services & Support (42 | 5.1%).
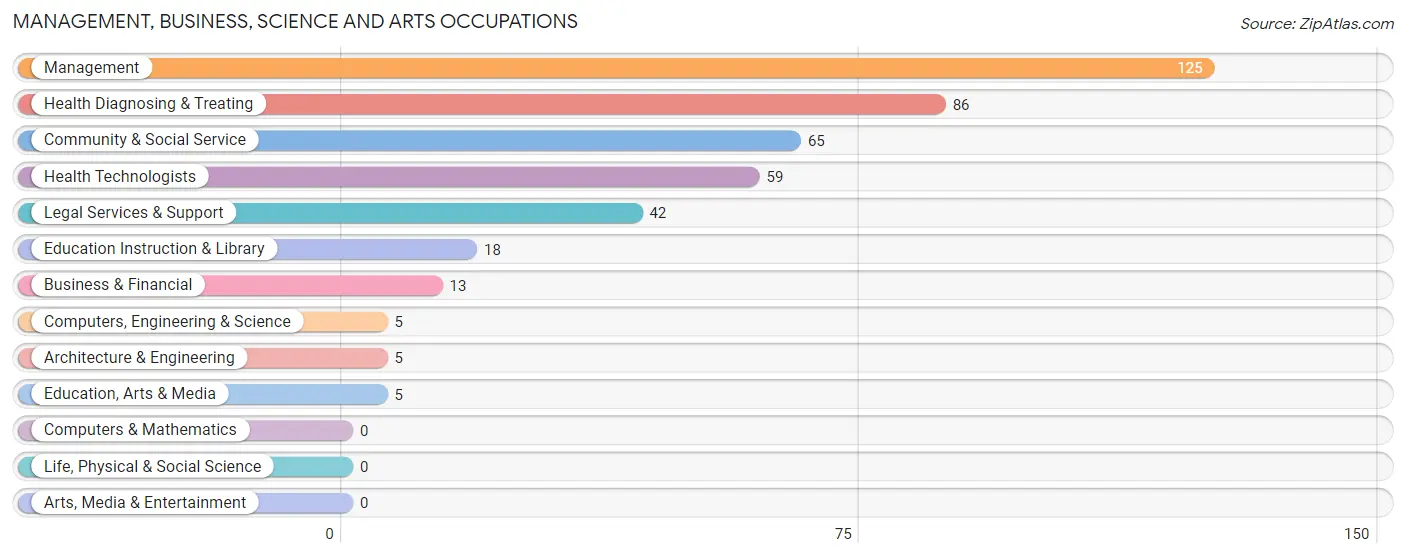
Management, Business, Science and Arts Occupations by Sex
Within the Management, Business, Science and Arts occupations in Sissonville, the most male-oriented occupations are Computers, Engineering & Science (100.0%), Architecture & Engineering (100.0%), and Education, Arts & Media (100.0%), while the most female-oriented occupations are Management (100.0%), Legal Services & Support (100.0%), and Education Instruction & Library (100.0%).
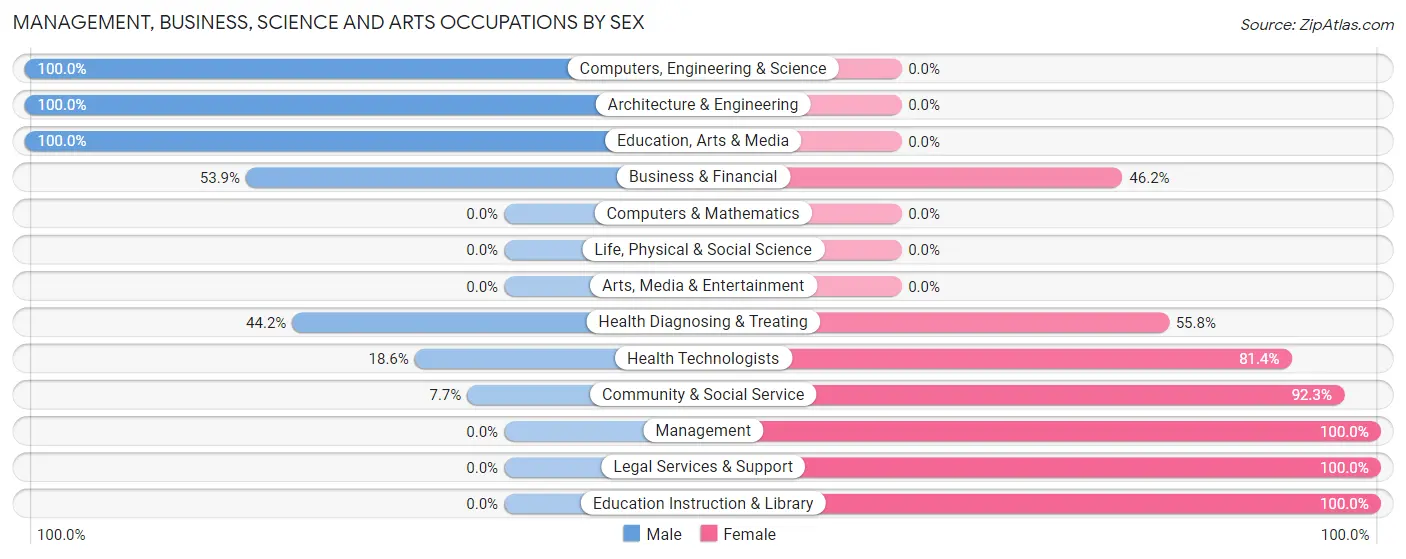
| Occupation | Male | Female |
| Management | 0 (0.0%) | 125 (100.0%) |
| Business & Financial | 7 (53.8%) | 6 (46.2%) |
| Computers, Engineering & Science | 5 (100.0%) | 0 (0.0%) |
| Computers & Mathematics | 0 (0.0%) | 0 (0.0%) |
| Architecture & Engineering | 5 (100.0%) | 0 (0.0%) |
| Life, Physical & Social Science | 0 (0.0%) | 0 (0.0%) |
| Community & Social Service | 5 (7.7%) | 60 (92.3%) |
| Education, Arts & Media | 5 (100.0%) | 0 (0.0%) |
| Legal Services & Support | 0 (0.0%) | 42 (100.0%) |
| Education Instruction & Library | 0 (0.0%) | 18 (100.0%) |
| Arts, Media & Entertainment | 0 (0.0%) | 0 (0.0%) |
| Health Diagnosing & Treating | 38 (44.2%) | 48 (55.8%) |
| Health Technologists | 11 (18.6%) | 48 (81.4%) |
| Total (Category) | 55 (18.7%) | 239 (81.3%) |
| Total (Overall) | 340 (41.7%) | 476 (58.3%) |
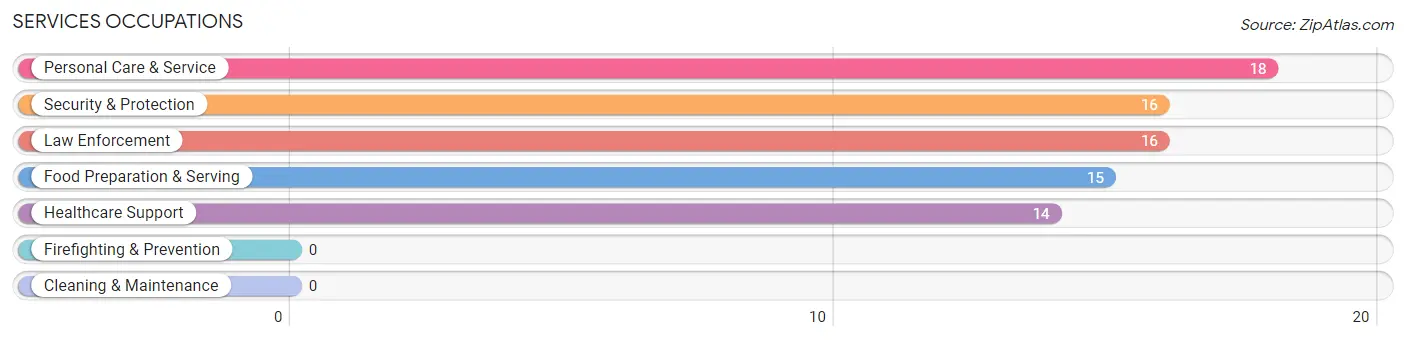
Services Occupations
The most common Services occupations in Sissonville are Personal Care & Service (18 | 2.2%), Security & Protection (16 | 2.0%), Law Enforcement (16 | 2.0%), Food Preparation & Serving (15 | 1.8%), and Healthcare Support (14 | 1.7%).
Services Occupations by Sex
Within the Services occupations in Sissonville, the most male-oriented occupations are Security & Protection (100.0%), Law Enforcement (100.0%), and Personal Care & Service (100.0%), while the most female-oriented occupations are Healthcare Support (100.0%), and Food Preparation & Serving (100.0%).
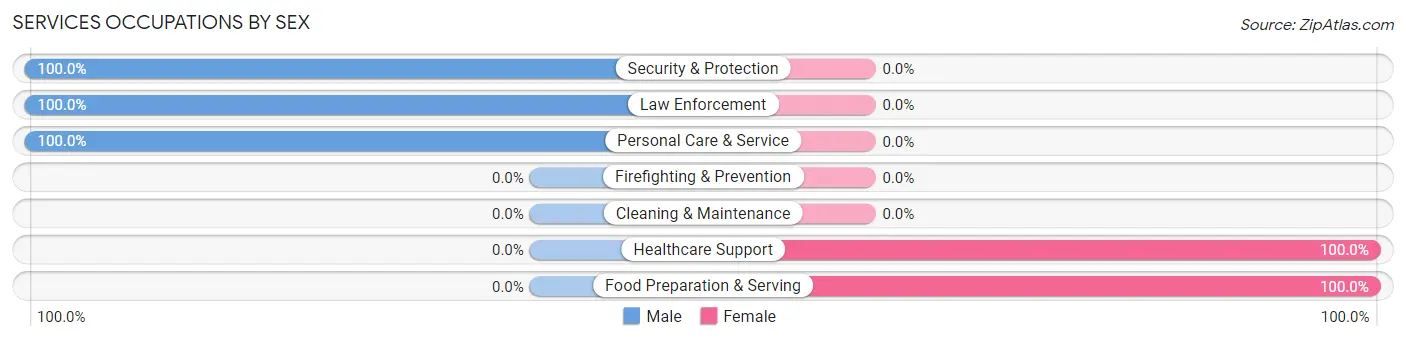
| Occupation | Male | Female |
| Healthcare Support | 0 (0.0%) | 14 (100.0%) |
| Security & Protection | 16 (100.0%) | 0 (0.0%) |
| Firefighting & Prevention | 0 (0.0%) | 0 (0.0%) |
| Law Enforcement | 16 (100.0%) | 0 (0.0%) |
| Food Preparation & Serving | 0 (0.0%) | 15 (100.0%) |
| Cleaning & Maintenance | 0 (0.0%) | 0 (0.0%) |
| Personal Care & Service | 18 (100.0%) | 0 (0.0%) |
| Total (Category) | 34 (54.0%) | 29 (46.0%) |
| Total (Overall) | 340 (41.7%) | 476 (58.3%) |
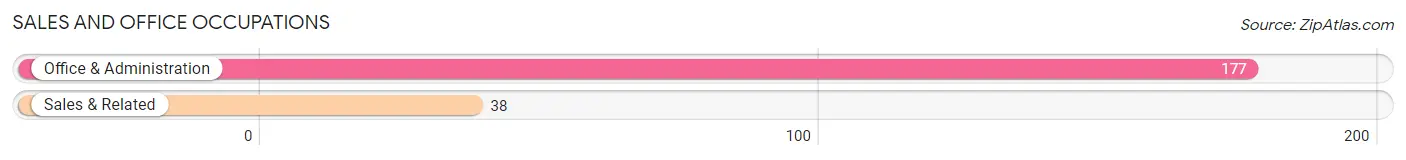
Sales and Office Occupations
The most common Sales and Office occupations in Sissonville are Office & Administration (177 | 21.7%), and Sales & Related (38 | 4.7%).
Sales and Office Occupations by Sex
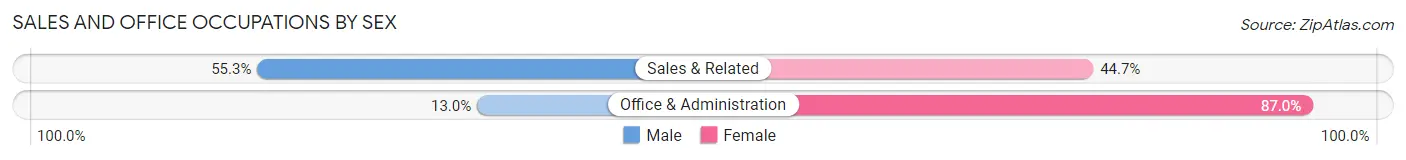
| Occupation | Male | Female |
| Sales & Related | 21 (55.3%) | 17 (44.7%) |
| Office & Administration | 23 (13.0%) | 154 (87.0%) |
| Total (Category) | 44 (20.5%) | 171 (79.5%) |
| Total (Overall) | 340 (41.7%) | 476 (58.3%) |
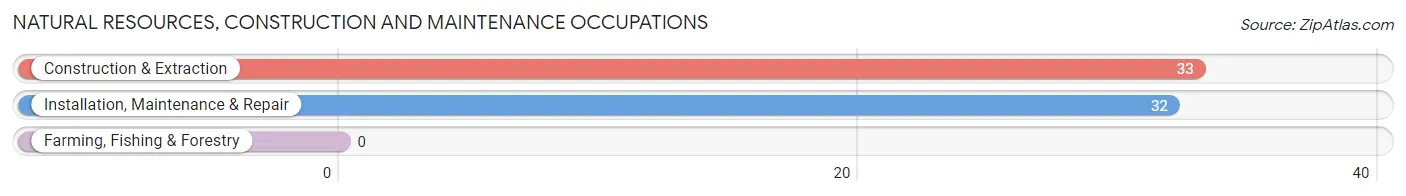
Natural Resources, Construction and Maintenance Occupations
The most common Natural Resources, Construction and Maintenance occupations in Sissonville are Construction & Extraction (33 | 4.0%), and Installation, Maintenance & Repair (32 | 3.9%).
Natural Resources, Construction and Maintenance Occupations by Sex
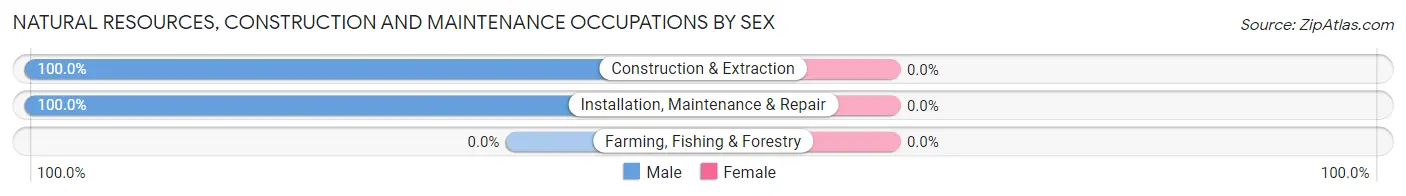
| Occupation | Male | Female |
| Farming, Fishing & Forestry | 0 (0.0%) | 0 (0.0%) |
| Construction & Extraction | 33 (100.0%) | 0 (0.0%) |
| Installation, Maintenance & Repair | 32 (100.0%) | 0 (0.0%) |
| Total (Category) | 65 (100.0%) | 0 (0.0%) |
| Total (Overall) | 340 (41.7%) | 476 (58.3%) |
Production, Transportation and Moving Occupations
The most common Production, Transportation and Moving occupations in Sissonville are Material Moving (70 | 8.6%), Production (55 | 6.7%), and Transportation (54 | 6.6%).
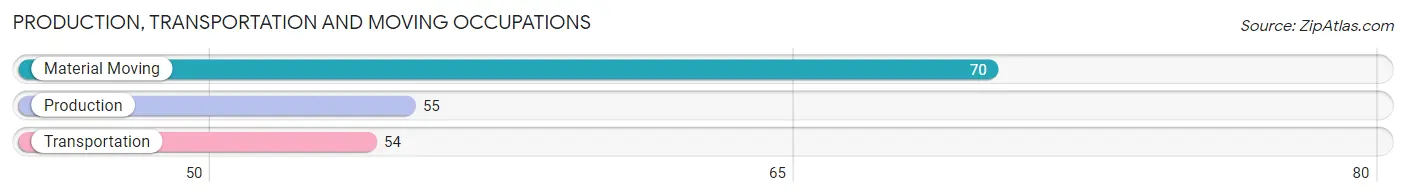
Production, Transportation and Moving Occupations by Sex
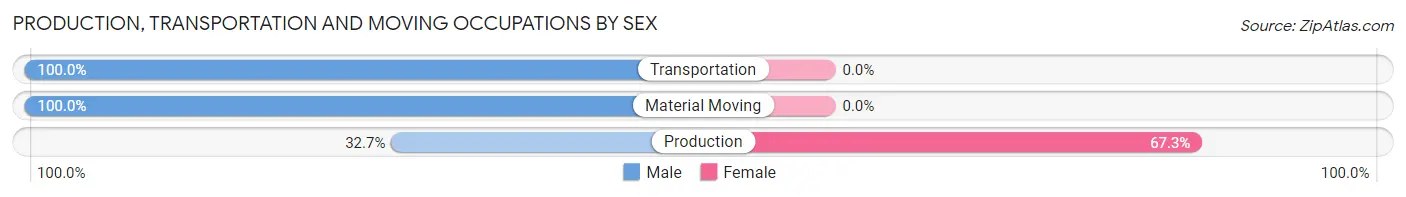
| Occupation | Male | Female |
| Production | 18 (32.7%) | 37 (67.3%) |
| Transportation | 54 (100.0%) | 0 (0.0%) |
| Material Moving | 70 (100.0%) | 0 (0.0%) |
| Total (Category) | 142 (79.3%) | 37 (20.7%) |
| Total (Overall) | 340 (41.7%) | 476 (58.3%) |
Employment Industries by Sex in Sissonville
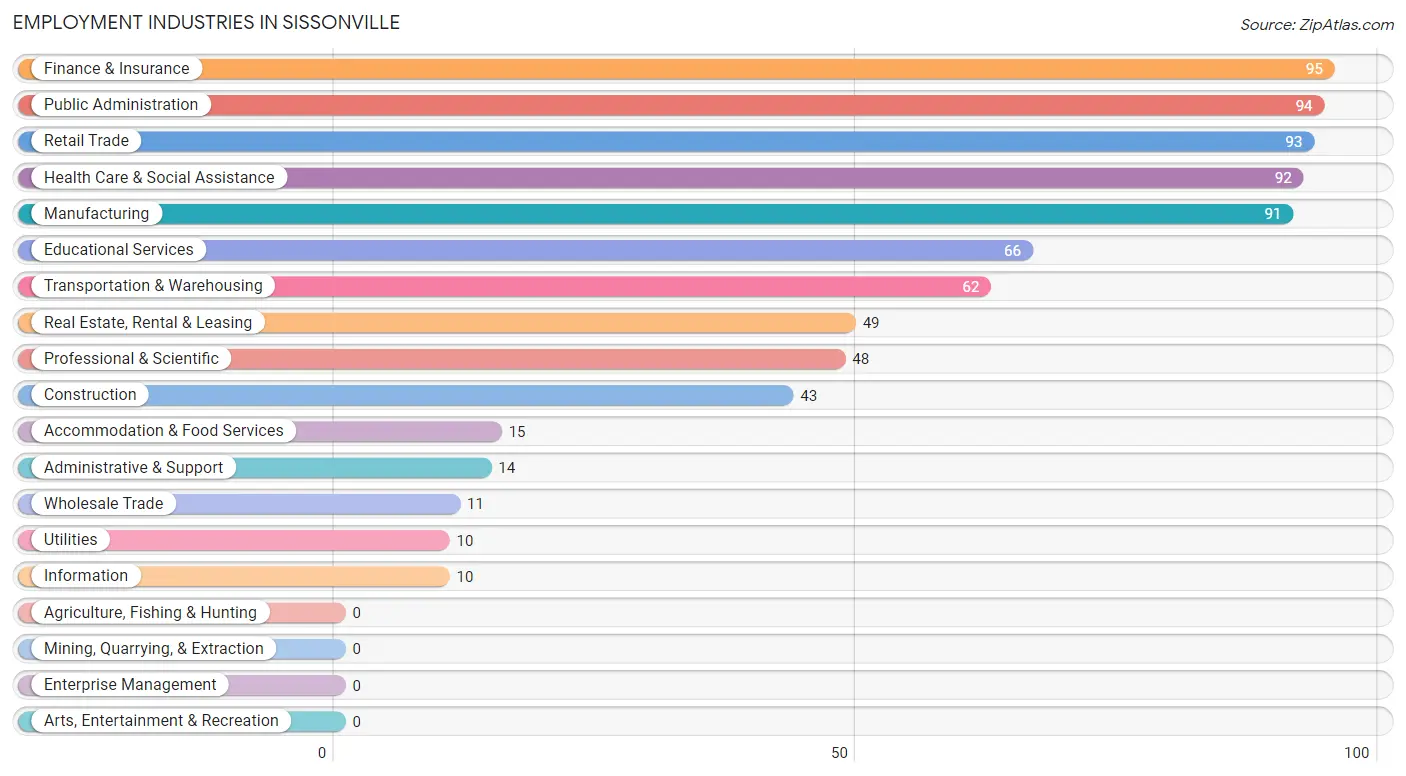
Employment Industries in Sissonville
The major employment industries in Sissonville include Finance & Insurance (95 | 11.6%), Public Administration (94 | 11.5%), Retail Trade (93 | 11.4%), Health Care & Social Assistance (92 | 11.3%), and Manufacturing (91 | 11.2%).
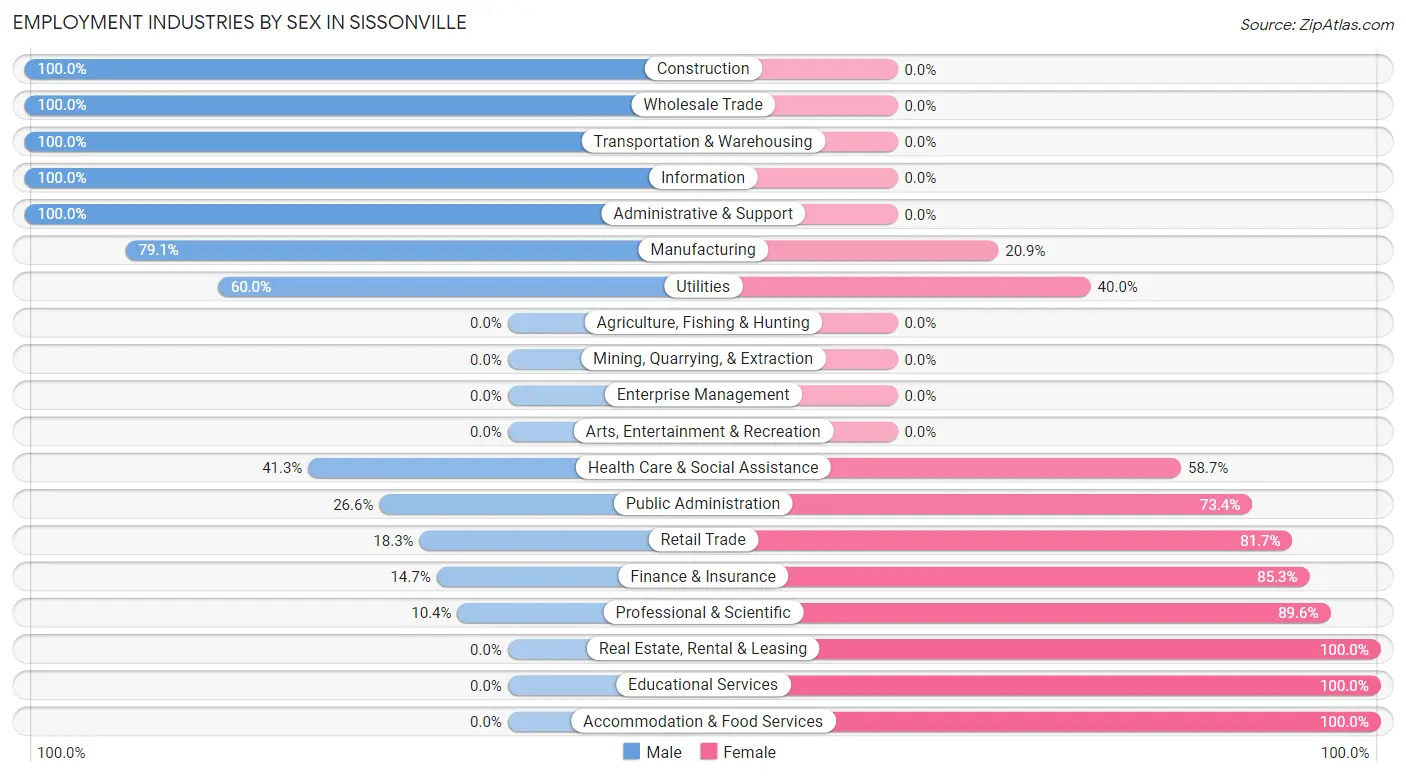
Employment Industries by Sex in Sissonville
The Sissonville industries that see more men than women are Construction (100.0%), Wholesale Trade (100.0%), and Transportation & Warehousing (100.0%), whereas the industries that tend to have a higher number of women are Real Estate, Rental & Leasing (100.0%), Educational Services (100.0%), and Accommodation & Food Services (100.0%).
| Industry | Male | Female |
| Agriculture, Fishing & Hunting | 0 (0.0%) | 0 (0.0%) |
| Mining, Quarrying, & Extraction | 0 (0.0%) | 0 (0.0%) |
| Construction | 43 (100.0%) | 0 (0.0%) |
| Manufacturing | 72 (79.1%) | 19 (20.9%) |
| Wholesale Trade | 11 (100.0%) | 0 (0.0%) |
| Retail Trade | 17 (18.3%) | 76 (81.7%) |
| Transportation & Warehousing | 62 (100.0%) | 0 (0.0%) |
| Utilities | 6 (60.0%) | 4 (40.0%) |
| Information | 10 (100.0%) | 0 (0.0%) |
| Finance & Insurance | 14 (14.7%) | 81 (85.3%) |
| Real Estate, Rental & Leasing | 0 (0.0%) | 49 (100.0%) |
| Professional & Scientific | 5 (10.4%) | 43 (89.6%) |
| Enterprise Management | 0 (0.0%) | 0 (0.0%) |
| Administrative & Support | 14 (100.0%) | 0 (0.0%) |
| Educational Services | 0 (0.0%) | 66 (100.0%) |
| Health Care & Social Assistance | 38 (41.3%) | 54 (58.7%) |
| Arts, Entertainment & Recreation | 0 (0.0%) | 0 (0.0%) |
| Accommodation & Food Services | 0 (0.0%) | 15 (100.0%) |
| Public Administration | 25 (26.6%) | 69 (73.4%) |
| Total | 340 (41.7%) | 476 (58.3%) |
Education in Sissonville
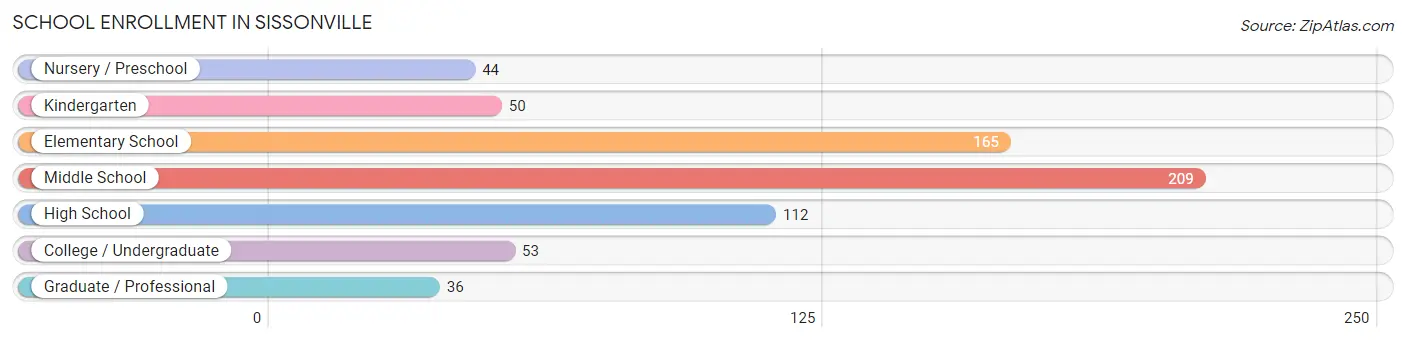
School Enrollment in Sissonville
The most common levels of schooling among the 669 students in Sissonville are middle school (209 | 31.2%), elementary school (165 | 24.7%), and high school (112 | 16.7%).
| School Level | # Students | % Students |
| Nursery / Preschool | 44 | 6.6% |
| Kindergarten | 50 | 7.5% |
| Elementary School | 165 | 24.7% |
| Middle School | 209 | 31.2% |
| High School | 112 | 16.7% |
| College / Undergraduate | 53 | 7.9% |
| Graduate / Professional | 36 | 5.4% |
| Total | 669 | 100.0% |
School Enrollment by Age by Funding Source in Sissonville
Out of a total of 669 students who are enrolled in schools in Sissonville, 91 (13.6%) attend a private institution, while the remaining 578 (86.4%) are enrolled in public schools. The age group of 35 years and over has the highest likelihood of being enrolled in private schools, with 18 (100.0% in the age bracket) enrolled. Conversely, the age group of 3 to 4 year olds has the lowest likelihood of being enrolled in a private school, with 11 (100.0% in the age bracket) attending a public institution.
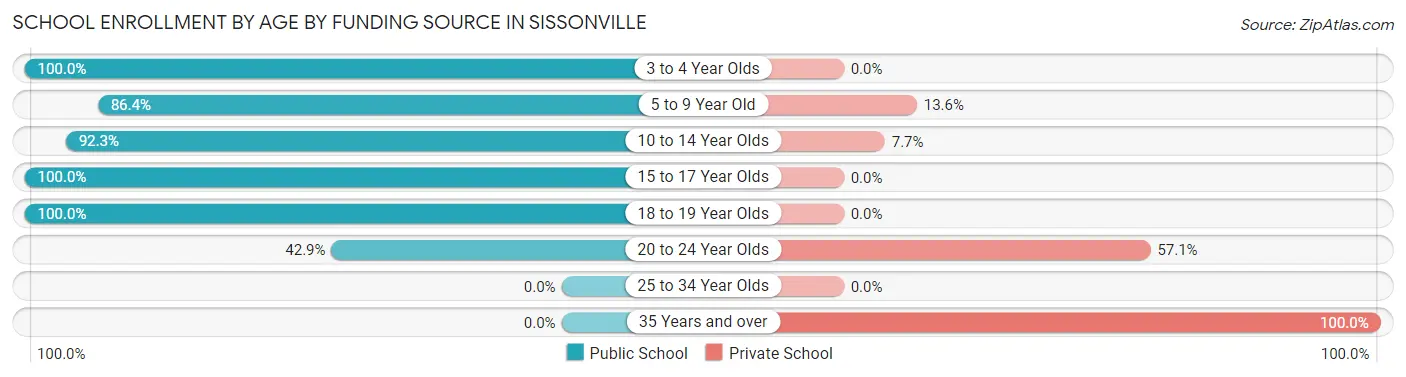
| Age Bracket | Public School | Private School |
| 3 to 4 Year Olds | 11 (100.0%) | 0 (0.0%) |
| 5 to 9 Year Old | 203 (86.4%) | 32 (13.6%) |
| 10 to 14 Year Olds | 205 (92.3%) | 17 (7.7%) |
| 15 to 17 Year Olds | 112 (100.0%) | 0 (0.0%) |
| 18 to 19 Year Olds | 29 (100.0%) | 0 (0.0%) |
| 20 to 24 Year Olds | 18 (42.9%) | 24 (57.1%) |
| 25 to 34 Year Olds | 0 (0.0%) | 0 (0.0%) |
| 35 Years and over | 0 (0.0%) | 18 (100.0%) |
| Total | 578 (86.4%) | 91 (13.6%) |
Educational Attainment by Field of Study in Sissonville
Business (151 | 62.4%), arts & humanities (59 | 24.4%), education (18 | 7.4%), psychology (7 | 2.9%), and communications (7 | 2.9%) are the most common fields of study among 242 individuals in Sissonville who have obtained a bachelor's degree or higher.
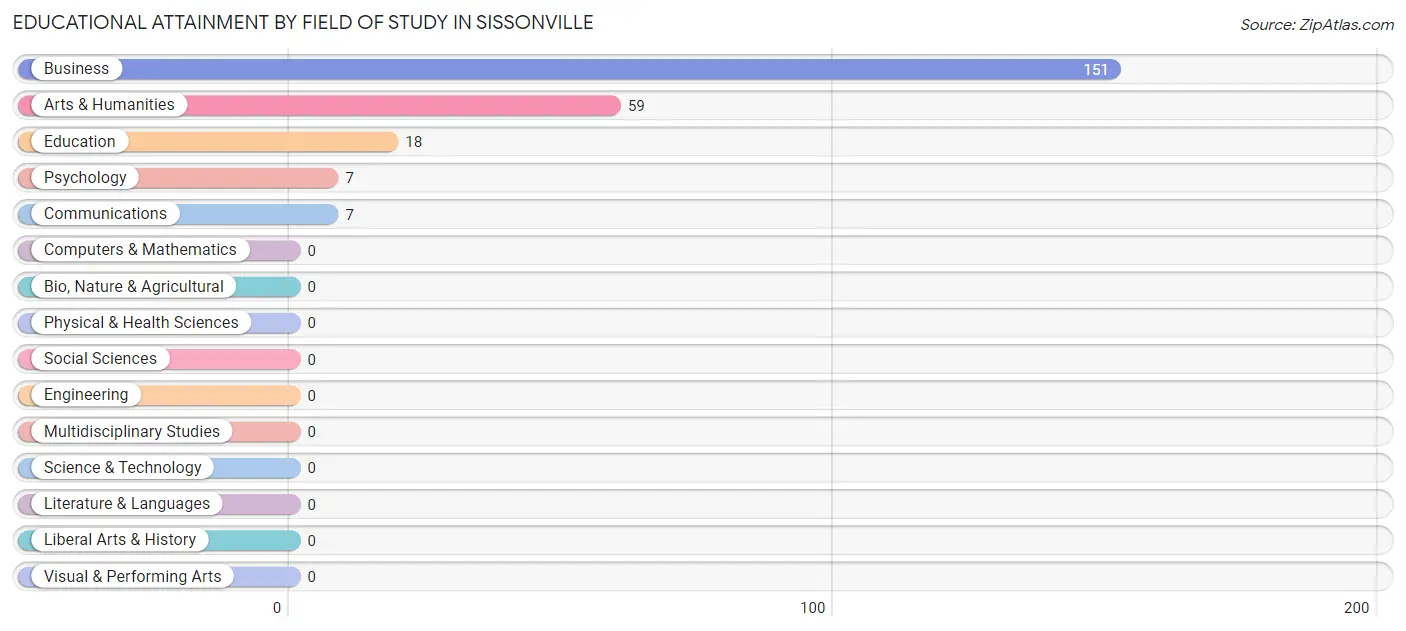
| Field of Study | # Graduates | % Graduates |
| Computers & Mathematics | 0 | 0.0% |
| Bio, Nature & Agricultural | 0 | 0.0% |
| Physical & Health Sciences | 0 | 0.0% |
| Psychology | 7 | 2.9% |
| Social Sciences | 0 | 0.0% |
| Engineering | 0 | 0.0% |
| Multidisciplinary Studies | 0 | 0.0% |
| Science & Technology | 0 | 0.0% |
| Business | 151 | 62.4% |
| Education | 18 | 7.4% |
| Literature & Languages | 0 | 0.0% |
| Liberal Arts & History | 0 | 0.0% |
| Visual & Performing Arts | 0 | 0.0% |
| Communications | 7 | 2.9% |
| Arts & Humanities | 59 | 24.4% |
| Total | 242 | 100.0% |
Transportation & Commute in Sissonville
Vehicle Availability by Sex in Sissonville
The most prevalent vehicle ownership categories in Sissonville are males with 2 vehicles (186, accounting for 51.1%) and females with 2 vehicles (178, making up 39.1%).
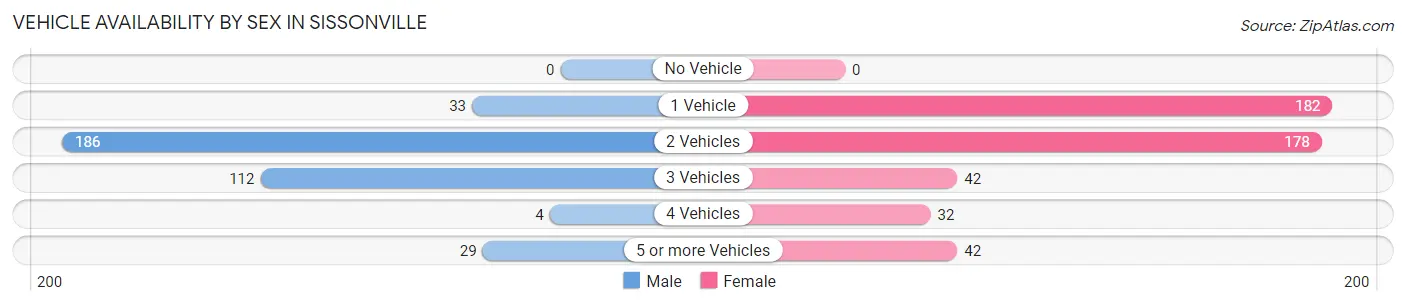
| Vehicles Available | Male | Female |
| No Vehicle | 0 (0.0%) | 0 (0.0%) |
| 1 Vehicle | 33 (9.1%) | 182 (38.2%) |
| 2 Vehicles | 186 (51.1%) | 178 (37.4%) |
| 3 Vehicles | 112 (30.8%) | 42 (8.8%) |
| 4 Vehicles | 4 (1.1%) | 32 (6.7%) |
| 5 or more Vehicles | 29 (8.0%) | 42 (8.8%) |
| Total | 364 (100.0%) | 476 (100.0%) |
Commute Time in Sissonville
The most frequently occuring commute durations in Sissonville are 20 to 24 minutes (180 commuters, 22.6%), 5 to 9 minutes (133 commuters, 16.7%), and 30 to 34 minutes (133 commuters, 16.7%).
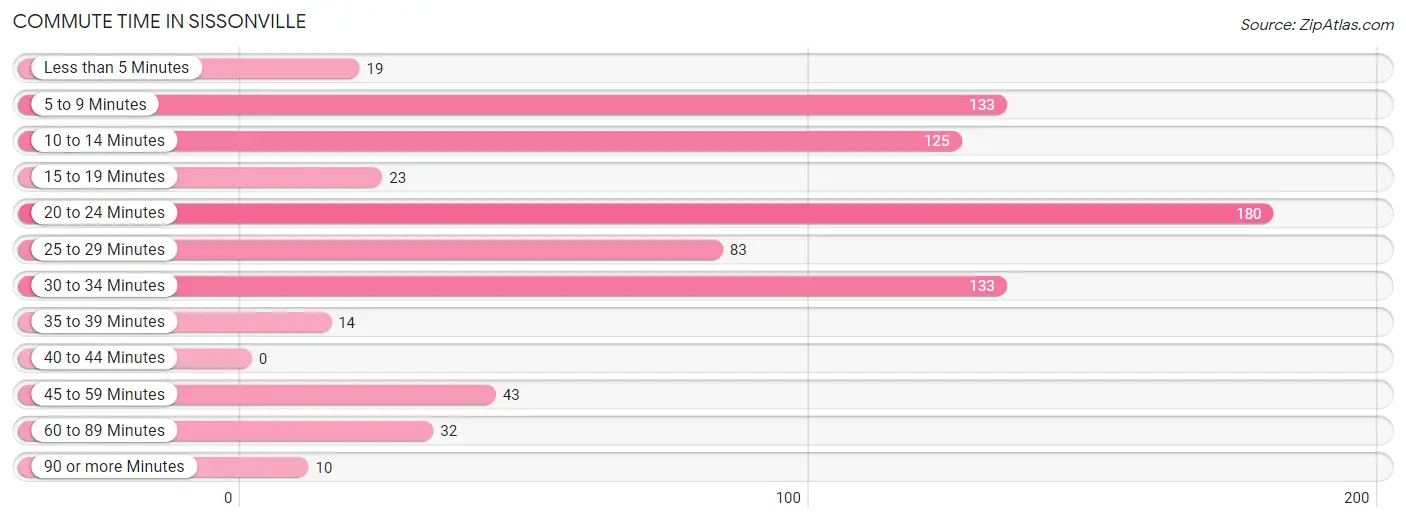
| Commute Time | # Commuters | % Commuters |
| Less than 5 Minutes | 19 | 2.4% |
| 5 to 9 Minutes | 133 | 16.7% |
| 10 to 14 Minutes | 125 | 15.7% |
| 15 to 19 Minutes | 23 | 2.9% |
| 20 to 24 Minutes | 180 | 22.6% |
| 25 to 29 Minutes | 83 | 10.4% |
| 30 to 34 Minutes | 133 | 16.7% |
| 35 to 39 Minutes | 14 | 1.8% |
| 40 to 44 Minutes | 0 | 0.0% |
| 45 to 59 Minutes | 43 | 5.4% |
| 60 to 89 Minutes | 32 | 4.0% |
| 90 or more Minutes | 10 | 1.3% |
Commute Time by Sex in Sissonville
The most common commute times in Sissonville are 10 to 14 minutes (114 commuters, 33.0%) for males and 20 to 24 minutes (124 commuters, 27.6%) for females.
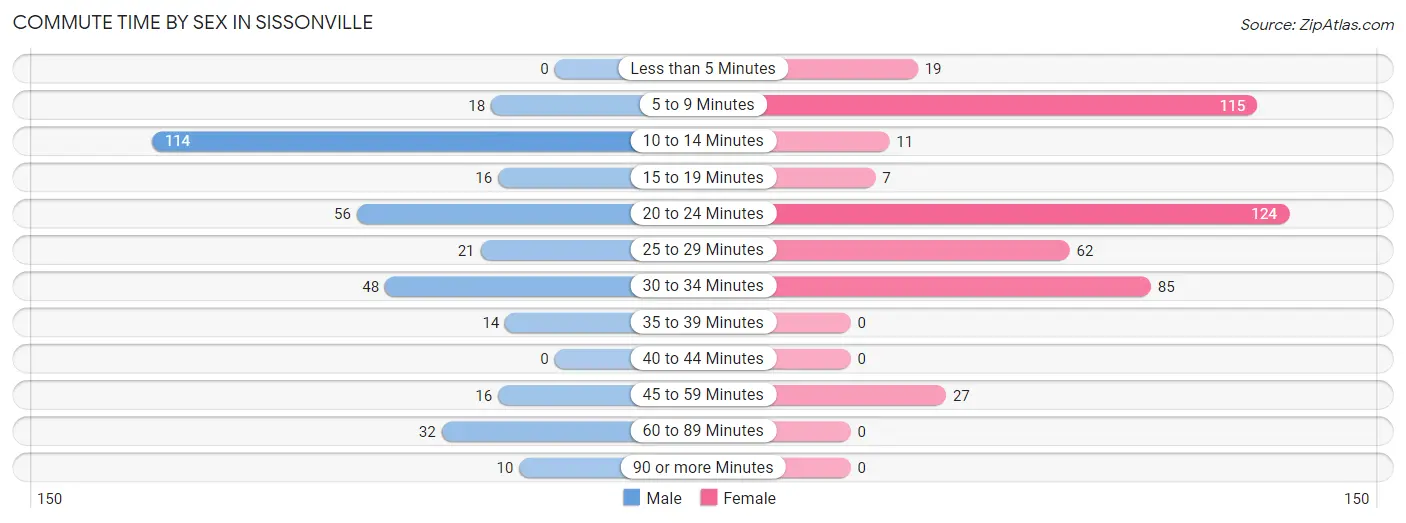
| Commute Time | Male | Female |
| Less than 5 Minutes | 0 (0.0%) | 19 (4.2%) |
| 5 to 9 Minutes | 18 (5.2%) | 115 (25.6%) |
| 10 to 14 Minutes | 114 (33.0%) | 11 (2.4%) |
| 15 to 19 Minutes | 16 (4.6%) | 7 (1.6%) |
| 20 to 24 Minutes | 56 (16.2%) | 124 (27.6%) |
| 25 to 29 Minutes | 21 (6.1%) | 62 (13.8%) |
| 30 to 34 Minutes | 48 (13.9%) | 85 (18.9%) |
| 35 to 39 Minutes | 14 (4.1%) | 0 (0.0%) |
| 40 to 44 Minutes | 0 (0.0%) | 0 (0.0%) |
| 45 to 59 Minutes | 16 (4.6%) | 27 (6.0%) |
| 60 to 89 Minutes | 32 (9.3%) | 0 (0.0%) |
| 90 or more Minutes | 10 (2.9%) | 0 (0.0%) |
Time of Departure to Work by Sex in Sissonville
The most frequent times of departure to work in Sissonville are 5:30 AM to 5:59 AM (90, 26.1%) for males and 7:30 AM to 7:59 AM (74, 16.4%) for females.
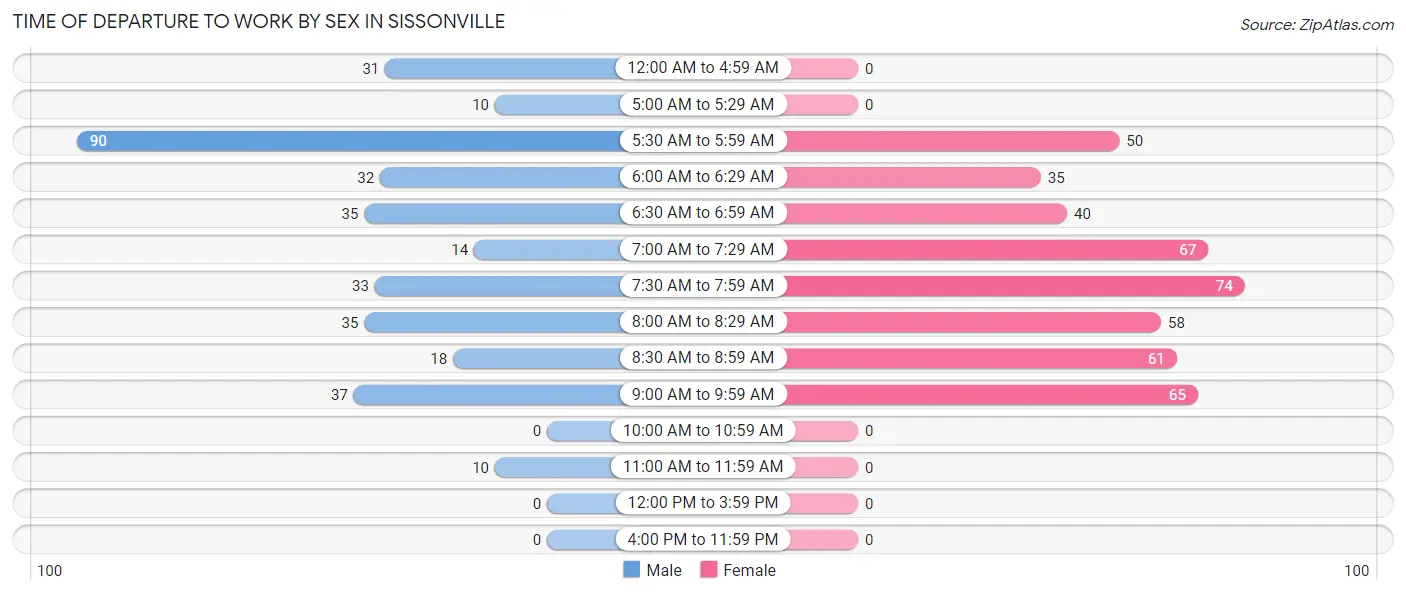
| Time of Departure | Male | Female |
| 12:00 AM to 4:59 AM | 31 (9.0%) | 0 (0.0%) |
| 5:00 AM to 5:29 AM | 10 (2.9%) | 0 (0.0%) |
| 5:30 AM to 5:59 AM | 90 (26.1%) | 50 (11.1%) |
| 6:00 AM to 6:29 AM | 32 (9.3%) | 35 (7.8%) |
| 6:30 AM to 6:59 AM | 35 (10.1%) | 40 (8.9%) |
| 7:00 AM to 7:29 AM | 14 (4.1%) | 67 (14.9%) |
| 7:30 AM to 7:59 AM | 33 (9.6%) | 74 (16.4%) |
| 8:00 AM to 8:29 AM | 35 (10.1%) | 58 (12.9%) |
| 8:30 AM to 8:59 AM | 18 (5.2%) | 61 (13.6%) |
| 9:00 AM to 9:59 AM | 37 (10.7%) | 65 (14.4%) |
| 10:00 AM to 10:59 AM | 0 (0.0%) | 0 (0.0%) |
| 11:00 AM to 11:59 AM | 10 (2.9%) | 0 (0.0%) |
| 12:00 PM to 3:59 PM | 0 (0.0%) | 0 (0.0%) |
| 4:00 PM to 11:59 PM | 0 (0.0%) | 0 (0.0%) |
| Total | 345 (100.0%) | 450 (100.0%) |
Housing Occupancy in Sissonville
Occupancy by Ownership in Sissonville
Of the total 1,069 dwellings in Sissonville, owner-occupied units account for 776 (72.6%), while renter-occupied units make up 293 (27.4%).
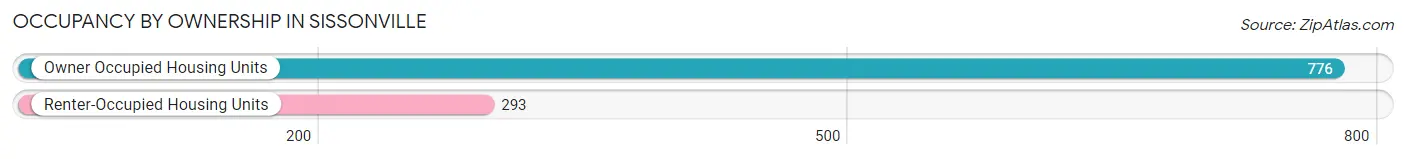
| Occupancy | # Housing Units | % Housing Units |
| Owner Occupied Housing Units | 776 | 72.6% |
| Renter-Occupied Housing Units | 293 | 27.4% |
| Total Occupied Housing Units | 1,069 | 100.0% |
Occupancy by Household Size in Sissonville
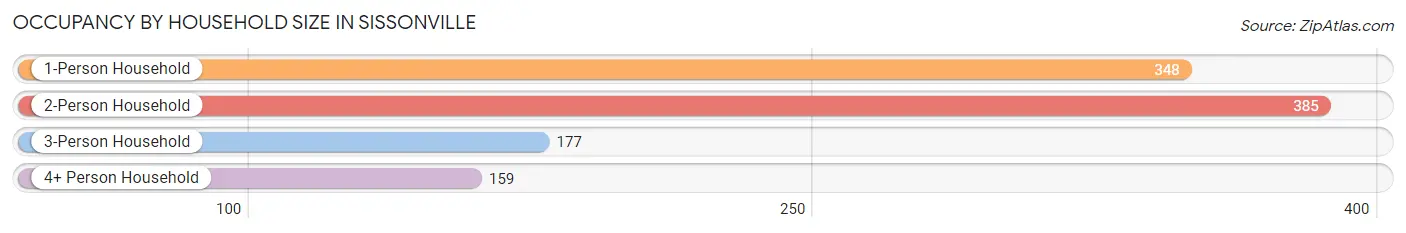
| Household Size | # Housing Units | % Housing Units |
| 1-Person Household | 348 | 32.6% |
| 2-Person Household | 385 | 36.0% |
| 3-Person Household | 177 | 16.6% |
| 4+ Person Household | 159 | 14.9% |
| Total Housing Units | 1,069 | 100.0% |
Occupancy by Ownership by Household Size in Sissonville
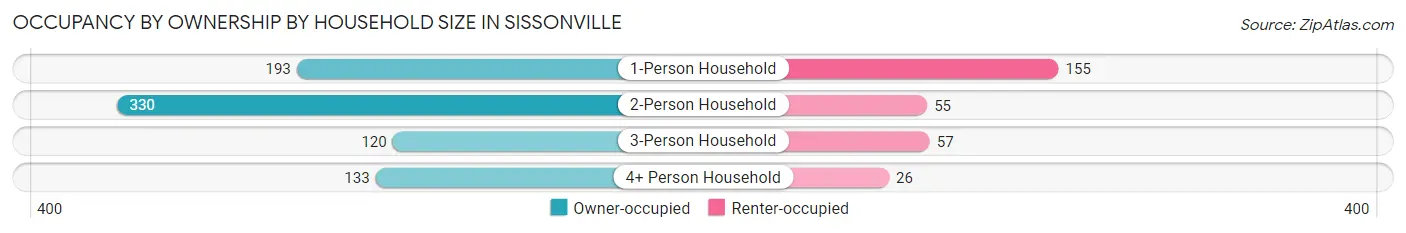
| Household Size | Owner-occupied | Renter-occupied |
| 1-Person Household | 193 (55.5%) | 155 (44.5%) |
| 2-Person Household | 330 (85.7%) | 55 (14.3%) |
| 3-Person Household | 120 (67.8%) | 57 (32.2%) |
| 4+ Person Household | 133 (83.7%) | 26 (16.4%) |
| Total Housing Units | 776 (72.6%) | 293 (27.4%) |
Occupancy by Educational Attainment in Sissonville
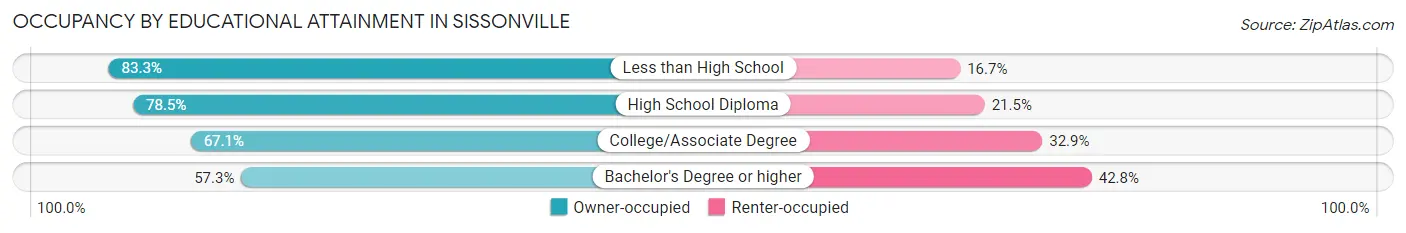
| Household Size | Owner-occupied | Renter-occupied |
| Less than High School | 95 (83.3%) | 19 (16.7%) |
| High School Diploma | 372 (78.5%) | 102 (21.5%) |
| College/Associate Degree | 230 (67.1%) | 113 (32.9%) |
| Bachelor's Degree or higher | 79 (57.3%) | 59 (42.7%) |
Occupancy by Age of Householder in Sissonville
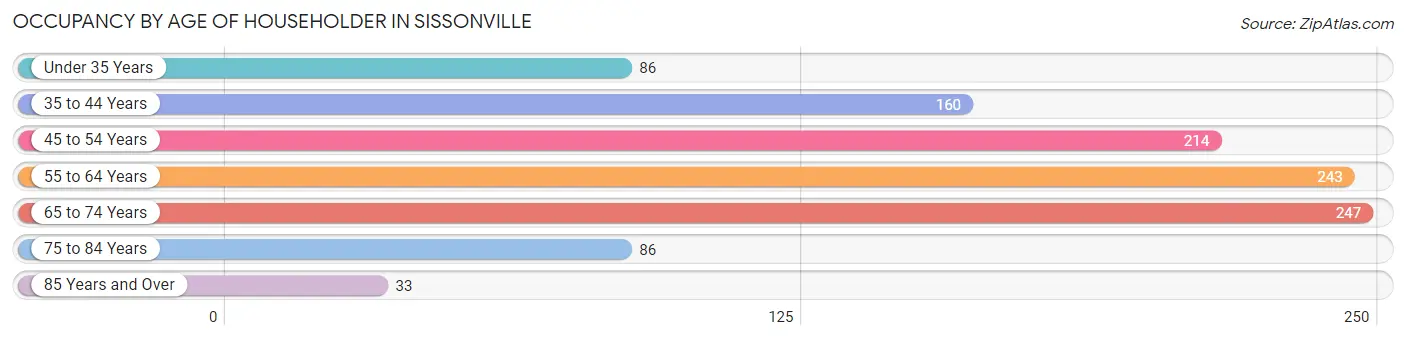
| Age Bracket | # Households | % Households |
| Under 35 Years | 86 | 8.0% |
| 35 to 44 Years | 160 | 15.0% |
| 45 to 54 Years | 214 | 20.0% |
| 55 to 64 Years | 243 | 22.7% |
| 65 to 74 Years | 247 | 23.1% |
| 75 to 84 Years | 86 | 8.0% |
| 85 Years and Over | 33 | 3.1% |
| Total | 1,069 | 100.0% |
Housing Finances in Sissonville
Median Income by Occupancy in Sissonville
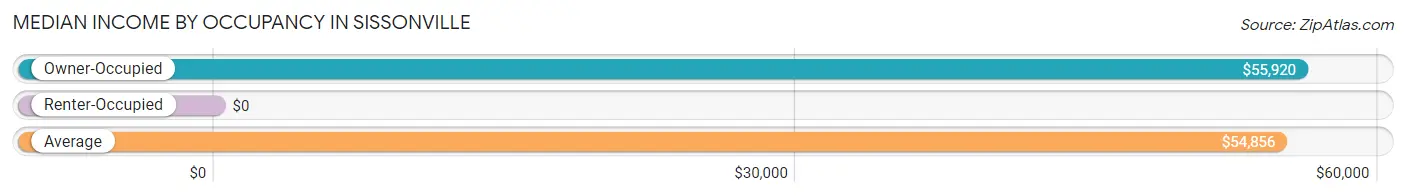
| Occupancy Type | # Households | Median Income |
| Owner-Occupied | 776 (72.6%) | $55,920 |
| Renter-Occupied | 293 (27.4%) | $0 |
| Average | 1,069 (100.0%) | $54,856 |
Occupancy by Householder Income Bracket in Sissonville
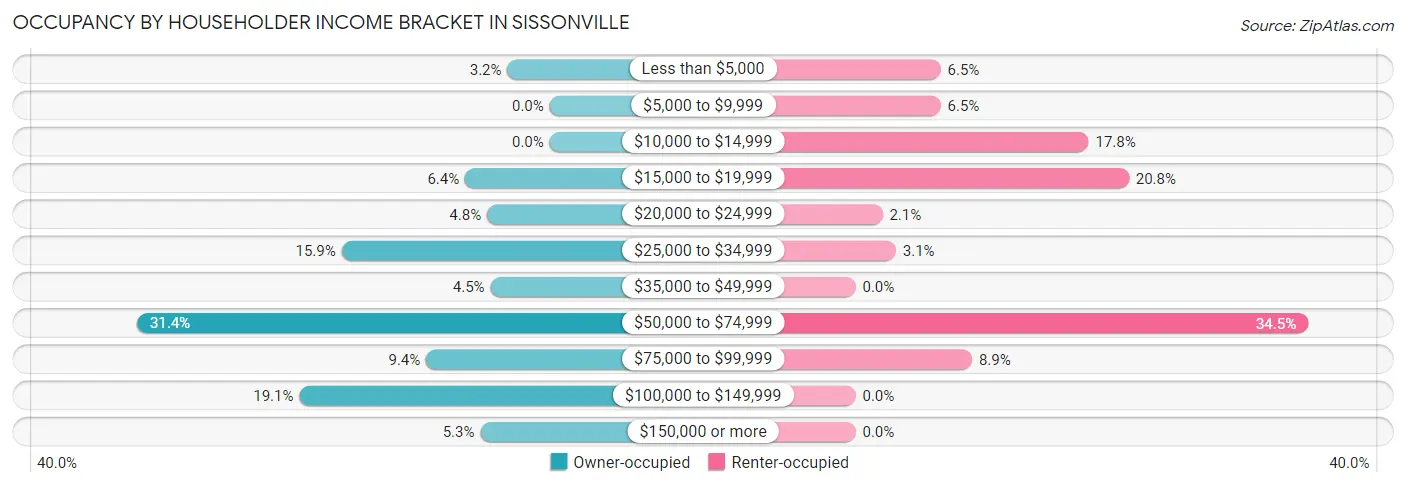
| Income Bracket | Owner-occupied | Renter-occupied |
| Less than $5,000 | 25 (3.2%) | 19 (6.5%) |
| $5,000 to $9,999 | 0 (0.0%) | 19 (6.5%) |
| $10,000 to $14,999 | 0 (0.0%) | 52 (17.7%) |
| $15,000 to $19,999 | 50 (6.4%) | 61 (20.8%) |
| $20,000 to $24,999 | 37 (4.8%) | 6 (2.1%) |
| $25,000 to $34,999 | 123 (15.9%) | 9 (3.1%) |
| $35,000 to $49,999 | 35 (4.5%) | 0 (0.0%) |
| $50,000 to $74,999 | 244 (31.4%) | 101 (34.5%) |
| $75,000 to $99,999 | 73 (9.4%) | 26 (8.9%) |
| $100,000 to $149,999 | 148 (19.1%) | 0 (0.0%) |
| $150,000 or more | 41 (5.3%) | 0 (0.0%) |
| Total | 776 (100.0%) | 293 (100.0%) |
Monthly Housing Cost Tiers in Sissonville
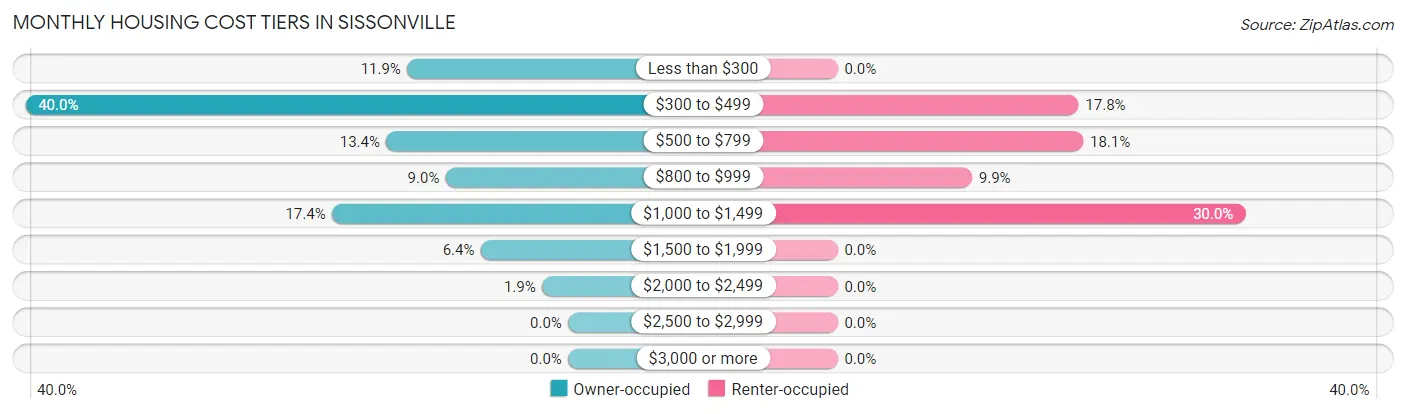
| Monthly Cost | Owner-occupied | Renter-occupied |
| Less than $300 | 92 (11.9%) | 0 (0.0%) |
| $300 to $499 | 310 (40.0%) | 52 (17.7%) |
| $500 to $799 | 104 (13.4%) | 53 (18.1%) |
| $800 to $999 | 70 (9.0%) | 29 (9.9%) |
| $1,000 to $1,499 | 135 (17.4%) | 88 (30.0%) |
| $1,500 to $1,999 | 50 (6.4%) | 0 (0.0%) |
| $2,000 to $2,499 | 15 (1.9%) | 0 (0.0%) |
| $2,500 to $2,999 | 0 (0.0%) | 0 (0.0%) |
| $3,000 or more | 0 (0.0%) | 0 (0.0%) |
| Total | 776 (100.0%) | 293 (100.0%) |
Physical Housing Characteristics in Sissonville
Housing Structures in Sissonville
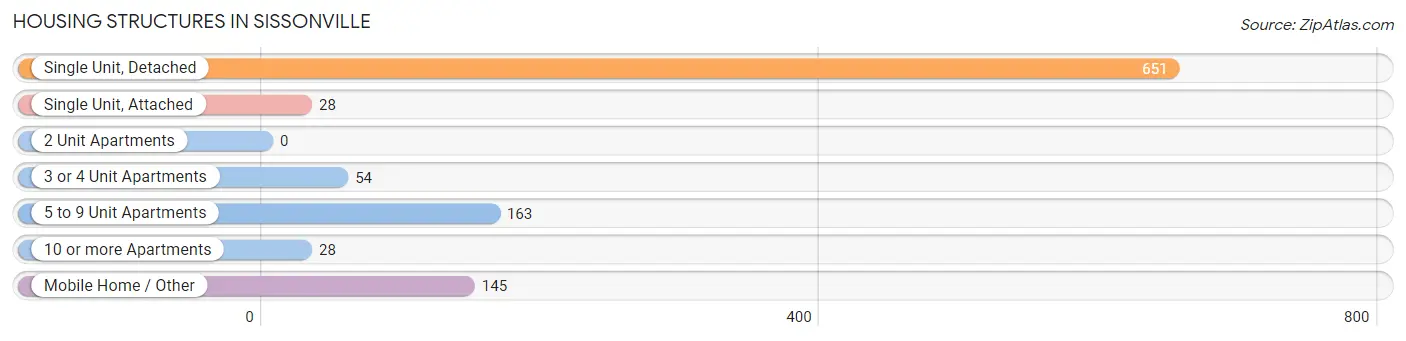
| Structure Type | # Housing Units | % Housing Units |
| Single Unit, Detached | 651 | 60.9% |
| Single Unit, Attached | 28 | 2.6% |
| 2 Unit Apartments | 0 | 0.0% |
| 3 or 4 Unit Apartments | 54 | 5.1% |
| 5 to 9 Unit Apartments | 163 | 15.2% |
| 10 or more Apartments | 28 | 2.6% |
| Mobile Home / Other | 145 | 13.6% |
| Total | 1,069 | 100.0% |
Housing Structures by Occupancy in Sissonville
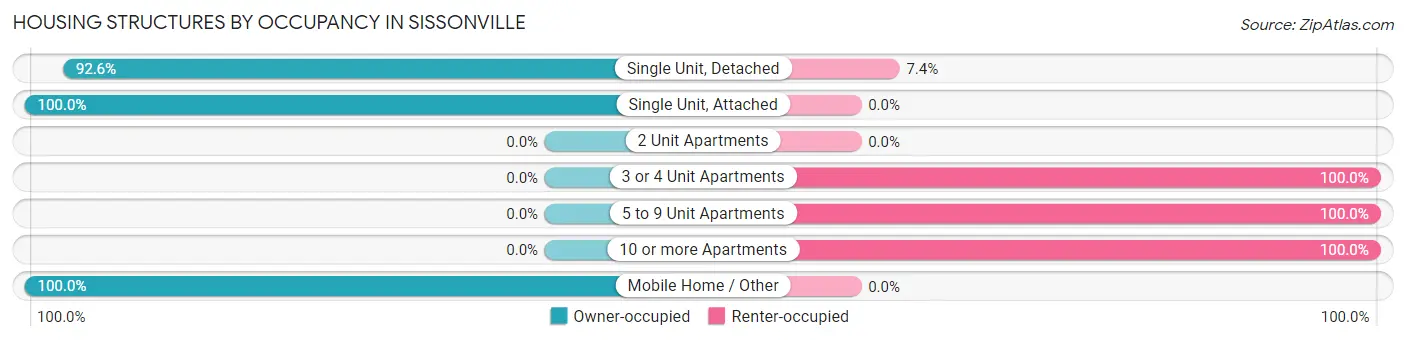
| Structure Type | Owner-occupied | Renter-occupied |
| Single Unit, Detached | 603 (92.6%) | 48 (7.4%) |
| Single Unit, Attached | 28 (100.0%) | 0 (0.0%) |
| 2 Unit Apartments | 0 (0.0%) | 0 (0.0%) |
| 3 or 4 Unit Apartments | 0 (0.0%) | 54 (100.0%) |
| 5 to 9 Unit Apartments | 0 (0.0%) | 163 (100.0%) |
| 10 or more Apartments | 0 (0.0%) | 28 (100.0%) |
| Mobile Home / Other | 145 (100.0%) | 0 (0.0%) |
| Total | 776 (72.6%) | 293 (27.4%) |
Housing Structures by Number of Rooms in Sissonville
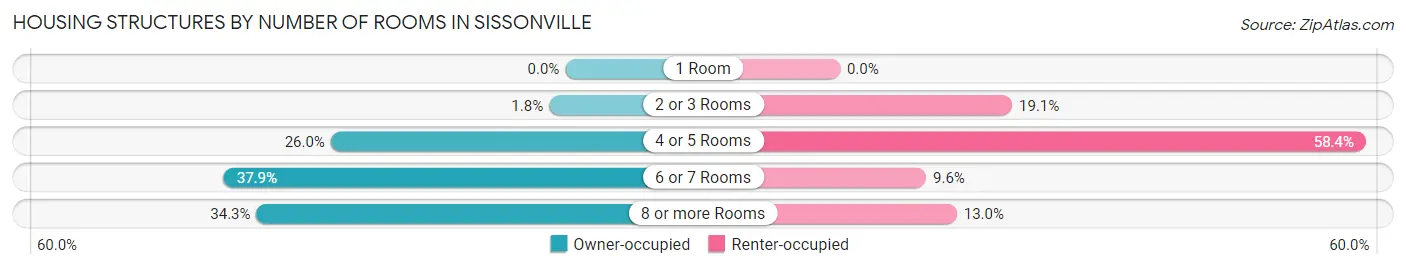
| Number of Rooms | Owner-occupied | Renter-occupied |
| 1 Room | 0 (0.0%) | 0 (0.0%) |
| 2 or 3 Rooms | 14 (1.8%) | 56 (19.1%) |
| 4 or 5 Rooms | 202 (26.0%) | 171 (58.4%) |
| 6 or 7 Rooms | 294 (37.9%) | 28 (9.6%) |
| 8 or more Rooms | 266 (34.3%) | 38 (13.0%) |
| Total | 776 (100.0%) | 293 (100.0%) |
Housing Structure by Heating Type in Sissonville
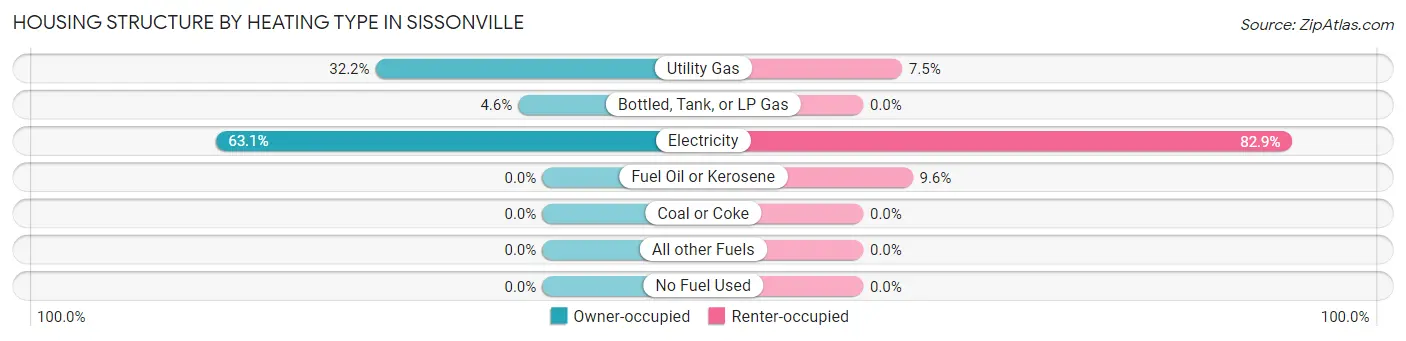
| Heating Type | Owner-occupied | Renter-occupied |
| Utility Gas | 250 (32.2%) | 22 (7.5%) |
| Bottled, Tank, or LP Gas | 36 (4.6%) | 0 (0.0%) |
| Electricity | 490 (63.1%) | 243 (82.9%) |
| Fuel Oil or Kerosene | 0 (0.0%) | 28 (9.6%) |
| Coal or Coke | 0 (0.0%) | 0 (0.0%) |
| All other Fuels | 0 (0.0%) | 0 (0.0%) |
| No Fuel Used | 0 (0.0%) | 0 (0.0%) |
| Total | 776 (100.0%) | 293 (100.0%) |
Household Vehicle Usage in Sissonville
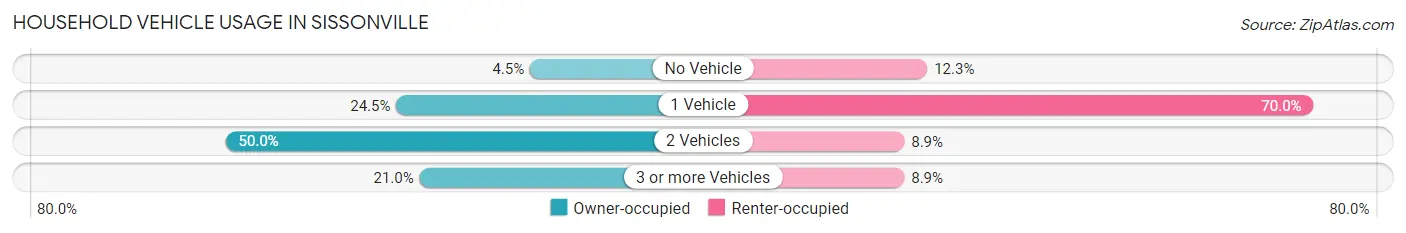
| Vehicles per Household | Owner-occupied | Renter-occupied |
| No Vehicle | 35 (4.5%) | 36 (12.3%) |
| 1 Vehicle | 190 (24.5%) | 205 (70.0%) |
| 2 Vehicles | 388 (50.0%) | 26 (8.9%) |
| 3 or more Vehicles | 163 (21.0%) | 26 (8.9%) |
| Total | 776 (100.0%) | 293 (100.0%) |
Real Estate & Mortgages in Sissonville
Real Estate and Mortgage Overview in Sissonville
| Characteristic | Without Mortgage | With Mortgage |
| Housing Units | 515 | 261 |
| Median Property Value | $180,800 | $106,500 |
| Median Household Income | $54,907 | $37 |
| Monthly Housing Costs | $424 | $0 |
| Real Estate Taxes | $952 | $0 |
Property Value by Mortgage Status in Sissonville
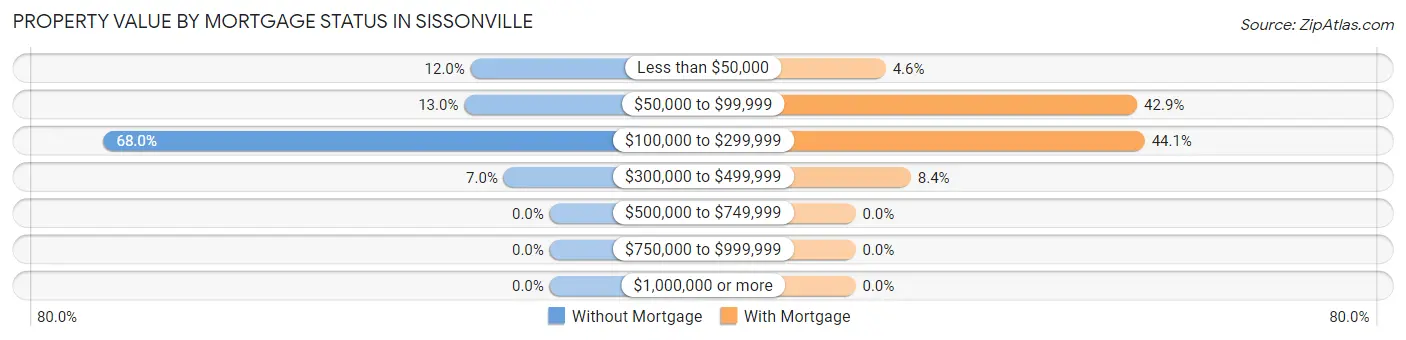
| Property Value | Without Mortgage | With Mortgage |
| Less than $50,000 | 62 (12.0%) | 12 (4.6%) |
| $50,000 to $99,999 | 67 (13.0%) | 112 (42.9%) |
| $100,000 to $299,999 | 350 (68.0%) | 115 (44.1%) |
| $300,000 to $499,999 | 36 (7.0%) | 22 (8.4%) |
| $500,000 to $749,999 | 0 (0.0%) | 0 (0.0%) |
| $750,000 to $999,999 | 0 (0.0%) | 0 (0.0%) |
| $1,000,000 or more | 0 (0.0%) | 0 (0.0%) |
| Total | 515 (100.0%) | 261 (100.0%) |
Household Income by Mortgage Status in Sissonville
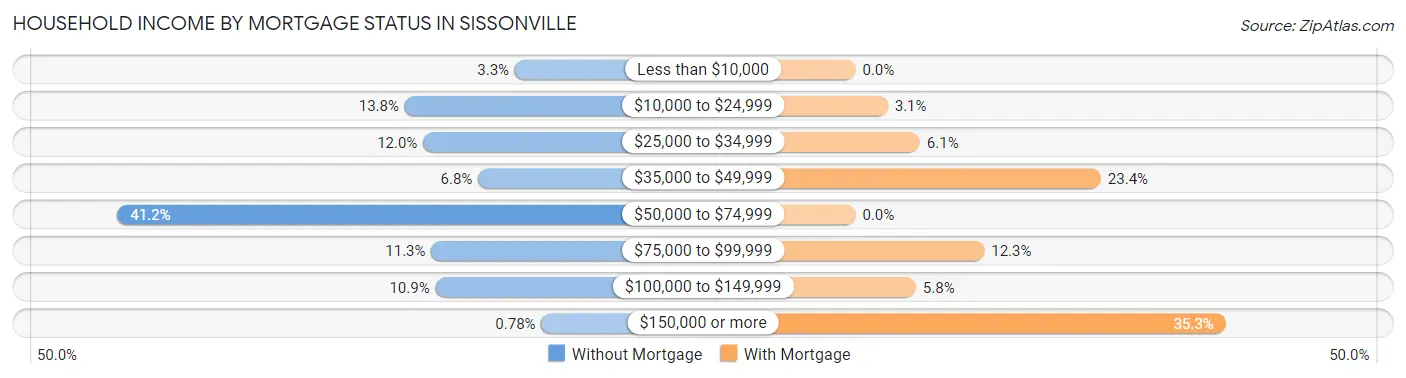
| Household Income | Without Mortgage | With Mortgage |
| Less than $10,000 | 17 (3.3%) | 0 (0.0%) |
| $10,000 to $24,999 | 71 (13.8%) | 8 (3.1%) |
| $25,000 to $34,999 | 62 (12.0%) | 16 (6.1%) |
| $35,000 to $49,999 | 35 (6.8%) | 61 (23.4%) |
| $50,000 to $74,999 | 212 (41.2%) | 0 (0.0%) |
| $75,000 to $99,999 | 58 (11.3%) | 32 (12.3%) |
| $100,000 to $149,999 | 56 (10.9%) | 15 (5.8%) |
| $150,000 or more | 4 (0.8%) | 92 (35.2%) |
| Total | 515 (100.0%) | 261 (100.0%) |
Property Value to Household Income Ratio in Sissonville
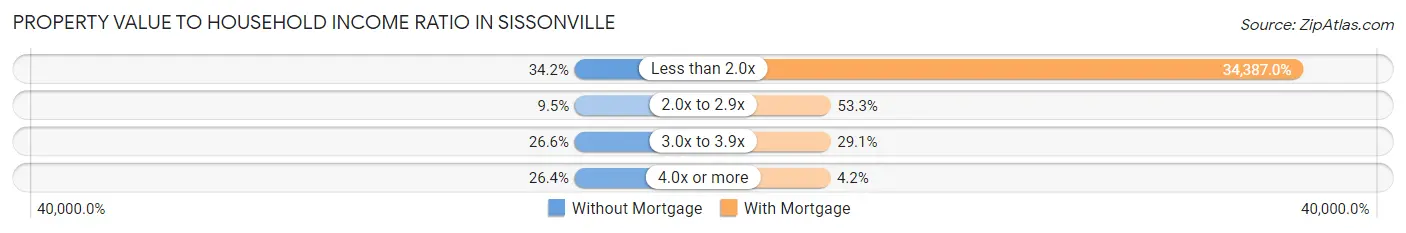
| Value-to-Income Ratio | Without Mortgage | With Mortgage |
| Less than 2.0x | 176 (34.2%) | 89,750 (34,387.0%) |
| 2.0x to 2.9x | 49 (9.5%) | 139 (53.3%) |
| 3.0x to 3.9x | 137 (26.6%) | 76 (29.1%) |
| 4.0x or more | 136 (26.4%) | 11 (4.2%) |
| Total | 515 (100.0%) | 261 (100.0%) |
Real Estate Taxes by Mortgage Status in Sissonville
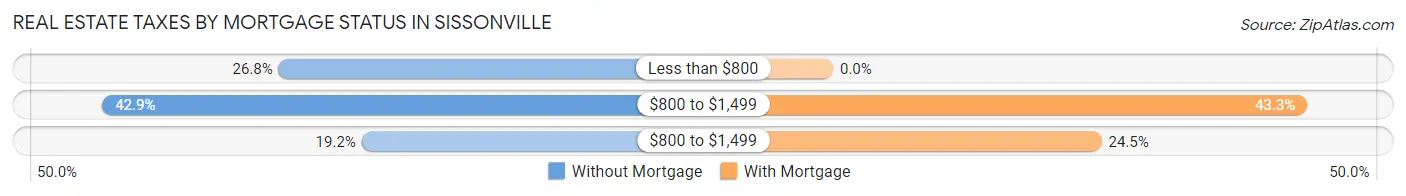
| Property Taxes | Without Mortgage | With Mortgage |
| Less than $800 | 138 (26.8%) | 0 (0.0%) |
| $800 to $1,499 | 221 (42.9%) | 113 (43.3%) |
| $800 to $1,499 | 99 (19.2%) | 64 (24.5%) |
| Total | 515 (100.0%) | 261 (100.0%) |
Health & Disability in Sissonville
Health Insurance Coverage by Age in Sissonville
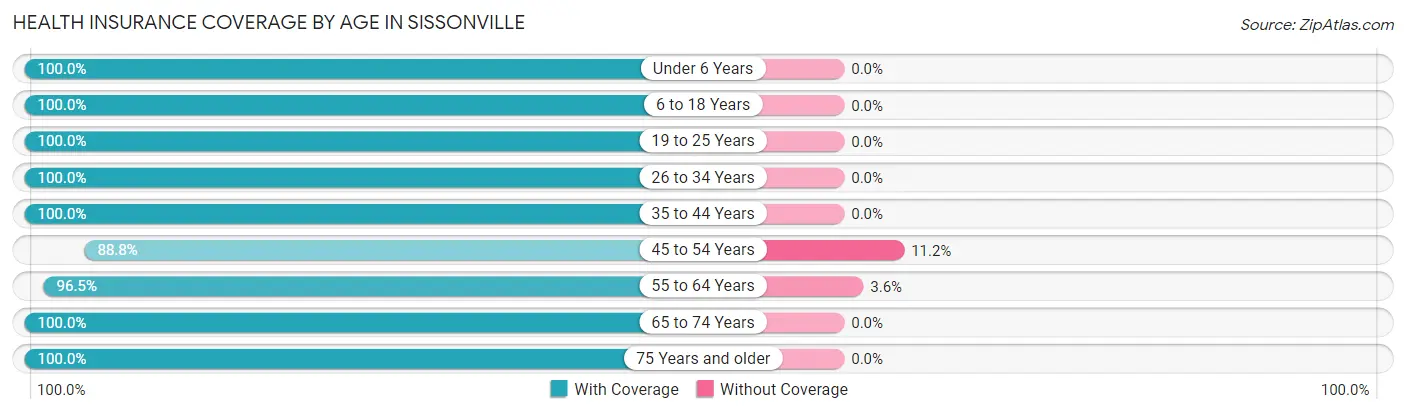
| Age Bracket | With Coverage | Without Coverage |
| Under 6 Years | 190 (100.0%) | 0 (0.0%) |
| 6 to 18 Years | 523 (100.0%) | 0 (0.0%) |
| 19 to 25 Years | 105 (100.0%) | 0 (0.0%) |
| 26 to 34 Years | 188 (100.0%) | 0 (0.0%) |
| 35 to 44 Years | 221 (100.0%) | 0 (0.0%) |
| 45 to 54 Years | 318 (88.8%) | 40 (11.2%) |
| 55 to 64 Years | 380 (96.5%) | 14 (3.5%) |
| 65 to 74 Years | 448 (100.0%) | 0 (0.0%) |
| 75 Years and older | 209 (100.0%) | 0 (0.0%) |
| Total | 2,582 (98.0%) | 54 (2.1%) |
Health Insurance Coverage by Citizenship Status in Sissonville
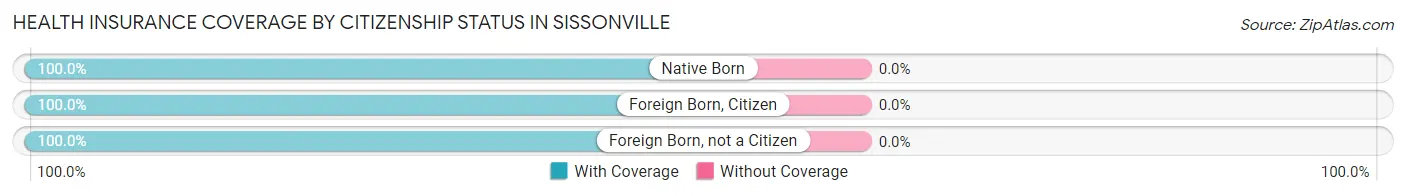
| Citizenship Status | With Coverage | Without Coverage |
| Native Born | 190 (100.0%) | 0 (0.0%) |
| Foreign Born, Citizen | 523 (100.0%) | 0 (0.0%) |
| Foreign Born, not a Citizen | 105 (100.0%) | 0 (0.0%) |
Health Insurance Coverage by Household Income in Sissonville
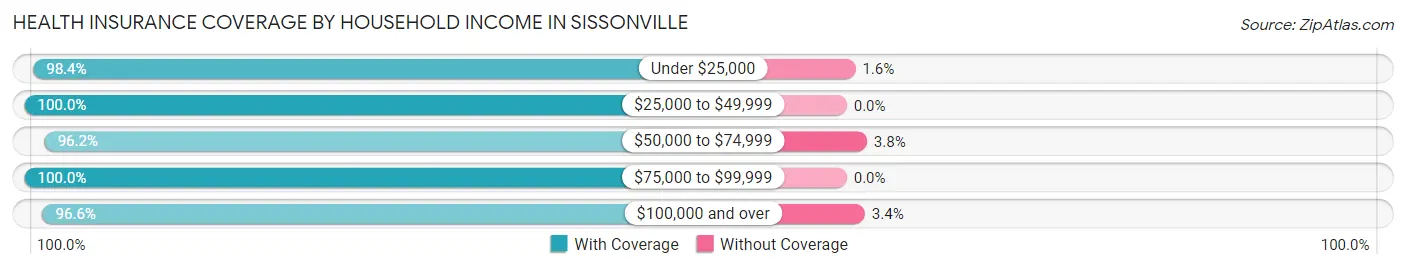
| Household Income | With Coverage | Without Coverage |
| Under $25,000 | 422 (98.4%) | 7 (1.6%) |
| $25,000 to $49,999 | 417 (100.0%) | 0 (0.0%) |
| $50,000 to $74,999 | 715 (96.2%) | 28 (3.8%) |
| $75,000 to $99,999 | 486 (100.0%) | 0 (0.0%) |
| $100,000 and over | 542 (96.6%) | 19 (3.4%) |
Public vs Private Health Insurance Coverage by Age in Sissonville
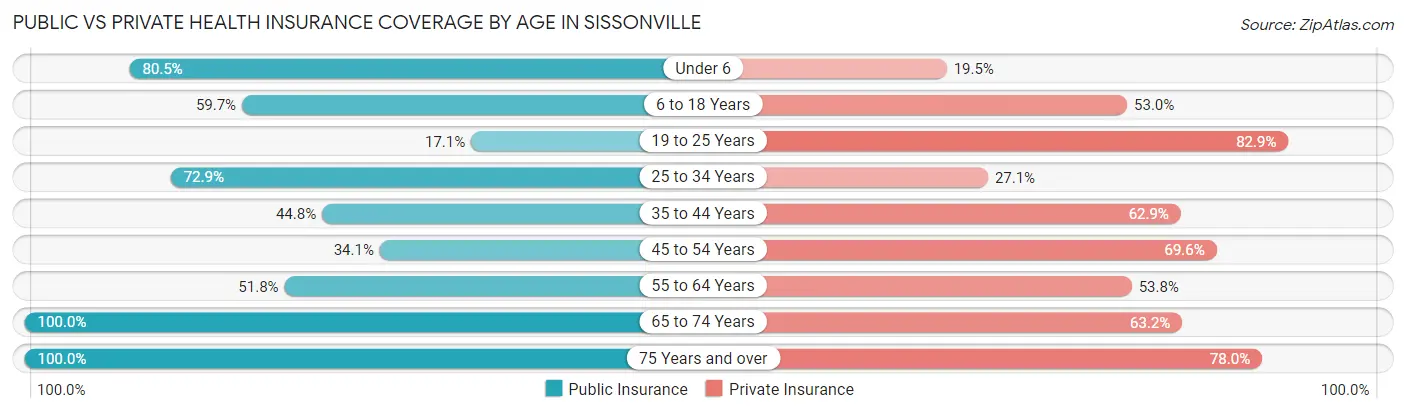
| Age Bracket | Public Insurance | Private Insurance |
| Under 6 | 153 (80.5%) | 37 (19.5%) |
| 6 to 18 Years | 312 (59.7%) | 277 (53.0%) |
| 19 to 25 Years | 18 (17.1%) | 87 (82.9%) |
| 25 to 34 Years | 137 (72.9%) | 51 (27.1%) |
| 35 to 44 Years | 99 (44.8%) | 139 (62.9%) |
| 45 to 54 Years | 122 (34.1%) | 249 (69.6%) |
| 55 to 64 Years | 204 (51.8%) | 212 (53.8%) |
| 65 to 74 Years | 448 (100.0%) | 283 (63.2%) |
| 75 Years and over | 209 (100.0%) | 163 (78.0%) |
| Total | 1,702 (64.6%) | 1,498 (56.8%) |
Disability Status by Sex by Age in Sissonville
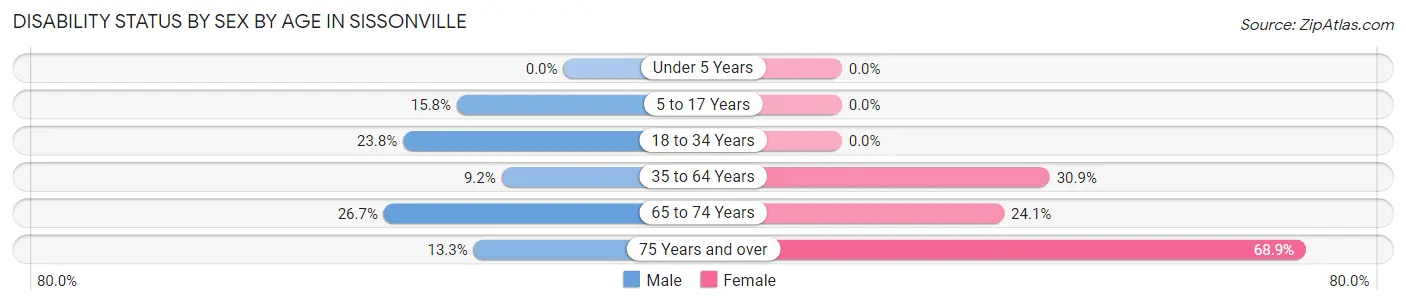
| Age Bracket | Male | Female |
| Under 5 Years | 0 (0.0%) | 0 (0.0%) |
| 5 to 17 Years | 52 (15.8%) | 0 (0.0%) |
| 18 to 34 Years | 35 (23.8%) | 0 (0.0%) |
| 35 to 64 Years | 37 (9.2%) | 176 (30.9%) |
| 65 to 74 Years | 52 (26.7%) | 61 (24.1%) |
| 75 Years and over | 12 (13.3%) | 82 (68.9%) |
Disability Class by Sex by Age in Sissonville
Disability Class: Hearing Difficulty
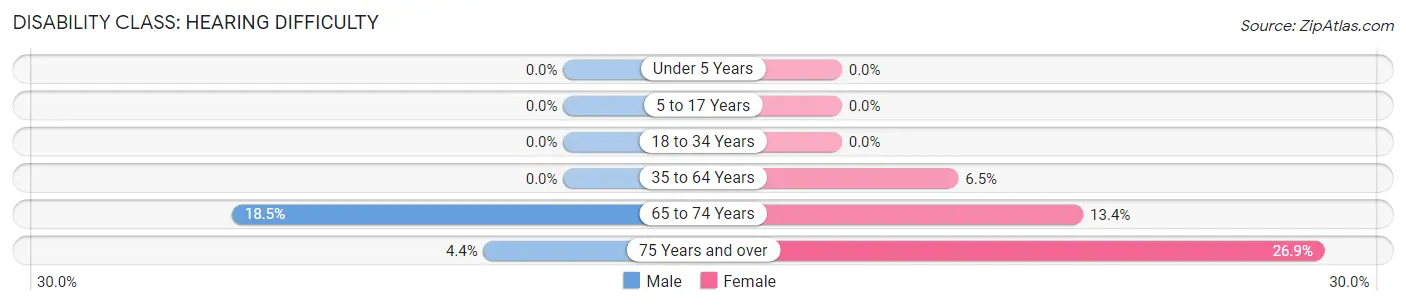
| Age Bracket | Male | Female |
| Under 5 Years | 0 (0.0%) | 0 (0.0%) |
| 5 to 17 Years | 0 (0.0%) | 0 (0.0%) |
| 18 to 34 Years | 0 (0.0%) | 0 (0.0%) |
| 35 to 64 Years | 0 (0.0%) | 37 (6.5%) |
| 65 to 74 Years | 36 (18.5%) | 34 (13.4%) |
| 75 Years and over | 4 (4.4%) | 32 (26.9%) |
Disability Class: Vision Difficulty
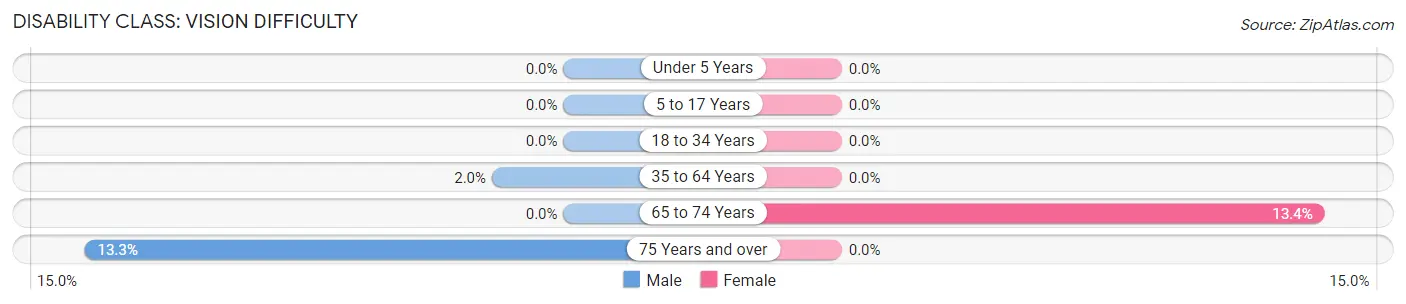
| Age Bracket | Male | Female |
| Under 5 Years | 0 (0.0%) | 0 (0.0%) |
| 5 to 17 Years | 0 (0.0%) | 0 (0.0%) |
| 18 to 34 Years | 0 (0.0%) | 0 (0.0%) |
| 35 to 64 Years | 8 (2.0%) | 0 (0.0%) |
| 65 to 74 Years | 0 (0.0%) | 34 (13.4%) |
| 75 Years and over | 12 (13.3%) | 0 (0.0%) |
Disability Class: Cognitive Difficulty
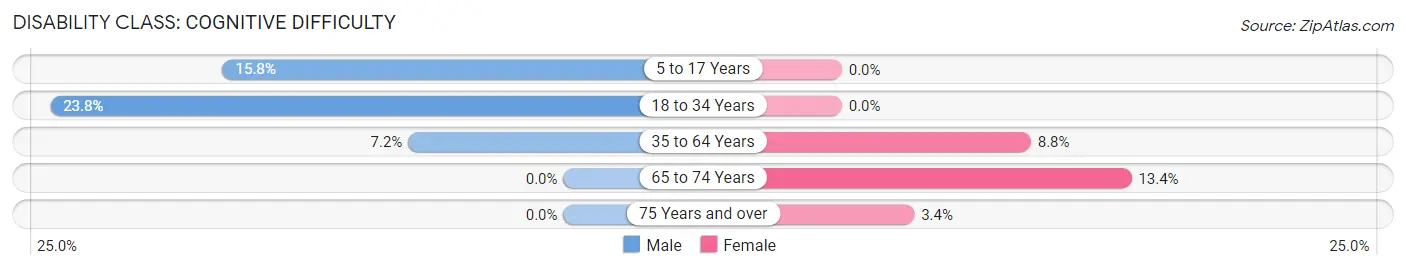
| Age Bracket | Male | Female |
| 5 to 17 Years | 52 (15.8%) | 0 (0.0%) |
| 18 to 34 Years | 35 (23.8%) | 0 (0.0%) |
| 35 to 64 Years | 29 (7.2%) | 50 (8.8%) |
| 65 to 74 Years | 0 (0.0%) | 34 (13.4%) |
| 75 Years and over | 0 (0.0%) | 4 (3.4%) |
Disability Class: Ambulatory Difficulty
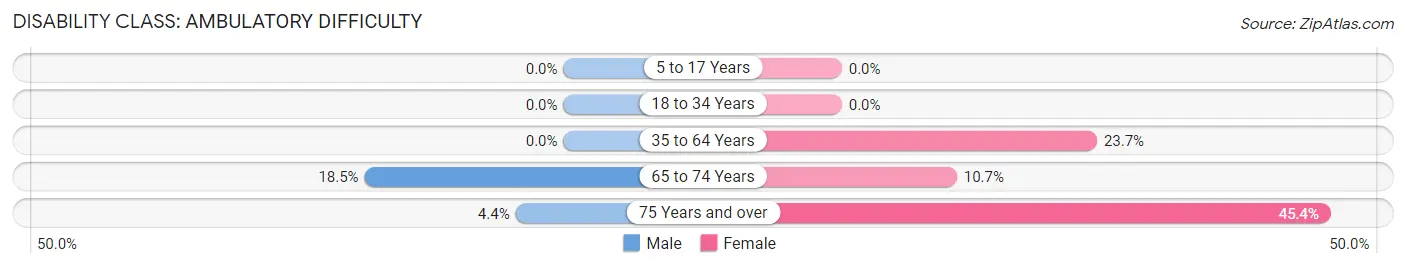
| Age Bracket | Male | Female |
| 5 to 17 Years | 0 (0.0%) | 0 (0.0%) |
| 18 to 34 Years | 0 (0.0%) | 0 (0.0%) |
| 35 to 64 Years | 0 (0.0%) | 135 (23.7%) |
| 65 to 74 Years | 36 (18.5%) | 27 (10.7%) |
| 75 Years and over | 4 (4.4%) | 54 (45.4%) |
Disability Class: Self-Care Difficulty
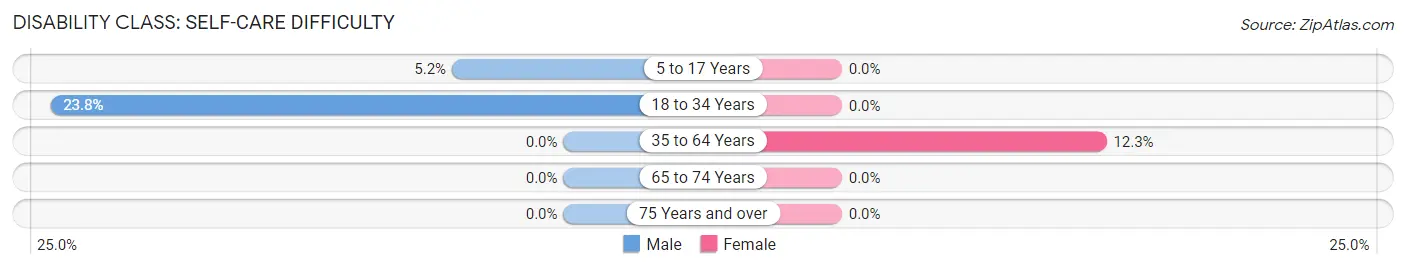
| Age Bracket | Male | Female |
| 5 to 17 Years | 17 (5.2%) | 0 (0.0%) |
| 18 to 34 Years | 35 (23.8%) | 0 (0.0%) |
| 35 to 64 Years | 0 (0.0%) | 70 (12.3%) |
| 65 to 74 Years | 0 (0.0%) | 0 (0.0%) |
| 75 Years and over | 0 (0.0%) | 0 (0.0%) |
Technology Access in Sissonville
Computing Device Access in Sissonville
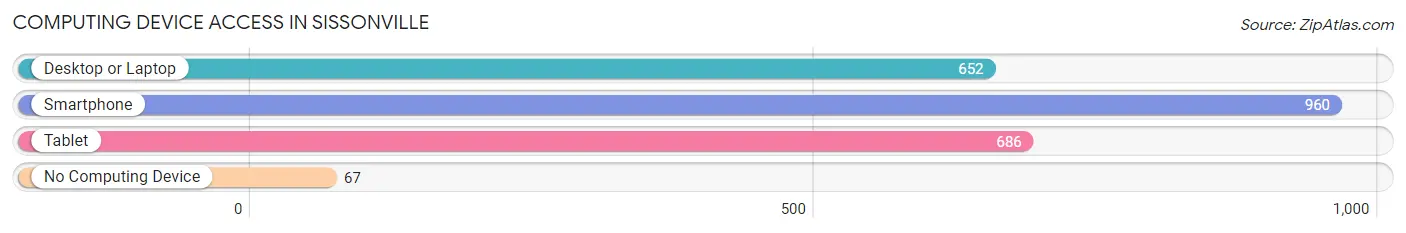
| Device Type | # Households | % Households |
| Desktop or Laptop | 652 | 61.0% |
| Smartphone | 960 | 89.8% |
| Tablet | 686 | 64.2% |
| No Computing Device | 67 | 6.3% |
| Total | 1,069 | 100.0% |
Internet Access in Sissonville
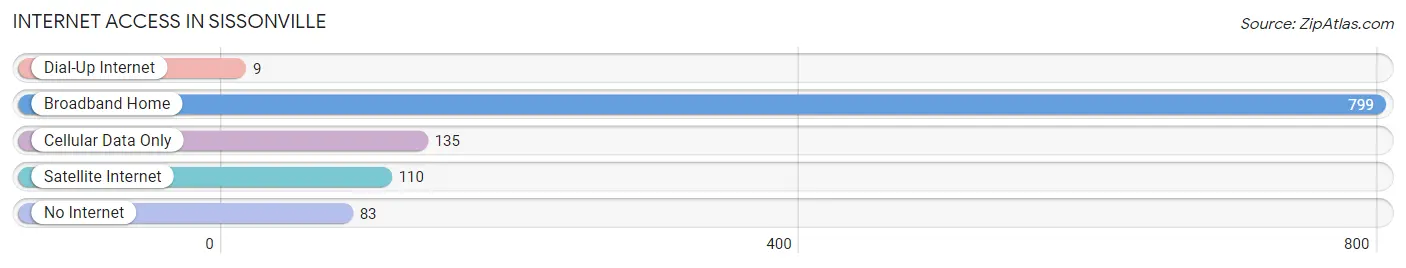
| Internet Type | # Households | % Households |
| Dial-Up Internet | 9 | 0.8% |
| Broadband Home | 799 | 74.7% |
| Cellular Data Only | 135 | 12.6% |
| Satellite Internet | 110 | 10.3% |
| No Internet | 83 | 7.8% |
| Total | 1,069 | 100.0% |
Sissonville Summary
Sissonville is a small unincorporated community located in Kanawha County, West Virginia. It is situated along the Kanawha River, approximately 15 miles northwest of Charleston, the state capital. The population of Sissonville was 1,845 at the 2010 census.
History
Sissonville was first settled in the late 1700s by the Sisson family, who were among the first settlers in the area. The town was originally known as Sisson's Crossroads, and was later shortened to Sissonville. The town was officially incorporated in 1891.
In the early 1900s, Sissonville was a thriving community with several businesses, including a general store, a blacksmith shop, a grist mill, and a sawmill. The town also had a post office, a school, and a church.
In the 1950s, Sissonville began to decline as the coal industry in the area declined. The town's population decreased, and many of the businesses closed.
Geography
Sissonville is located in the Appalachian Mountains of West Virginia, approximately 15 miles northwest of Charleston. The town is situated along the Kanawha River, and is surrounded by hills and mountains. The elevation of Sissonville is 845 feet above sea level.
The climate in Sissonville is humid subtropical, with hot, humid summers and cold, wet winters. The average annual temperature is 54 degrees Fahrenheit, and the average annual precipitation is 43 inches.
Economy
The economy of Sissonville is largely based on agriculture and tourism. The town is home to several farms, which produce a variety of crops, including corn, soybeans, and hay.
Tourism is also an important part of the local economy. The town is home to several attractions, including the Sissonville Historic District, which is listed on the National Register of Historic Places. The district includes several historic buildings, including the Sissonville General Store, the Sissonville Post Office, and the Sissonville Church.
Demographics
As of the 2010 census, the population of Sissonville was 1,845. The racial makeup of the town was 97.3% White, 0.9% African American, 0.2% Native American, 0.2% Asian, 0.1% Pacific Islander, and 0.3% from other races.
The median household income in Sissonville was $37,917, and the median family income was $45,625. The per capita income was $19,945. About 11.3% of the population was below the poverty line.
Conclusion
Sissonville is a small unincorporated community located in Kanawha County, West Virginia. It is situated along the Kanawha River, approximately 15 miles northwest of Charleston, the state capital. The population of Sissonville was 1,845 at the 2010 census. The town's economy is largely based on agriculture and tourism, and the town is home to several attractions, including the Sissonville Historic District. The racial makeup of the town was 97.3% White, 0.9% African American, 0.2% Native American, 0.2% Asian, 0.1% Pacific Islander, and 0.3% from other races. The median household income in Sissonville was $37,917, and the median family income was $45,625. The per capita income was $19,945. About 11.3% of the population was below the poverty line.
Common Questions
What is Per Capita Income in Sissonville?
Per Capita income in Sissonville is $24,187.
What is the Median Family Income in Sissonville?
Median Family Income in Sissonville is $57,247.
What is the Median Household income in Sissonville?
Median Household Income in Sissonville is $54,856.
What is Income or Wage Gap in Sissonville?
Income or Wage Gap in Sissonville is 27.6%.
Women in Sissonville earn 72.4 cents for every dollar earned by a man.
What is Family Income Deficit in Sissonville?
Family Income Deficit in Sissonville is $7,113.
Families that are below poverty line in Sissonville earn $7,113 less on average than the poverty threshold level.
What is Inequality or Gini Index in Sissonville?
Inequality or Gini Index in Sissonville is 0.39.
What is the Total Population of Sissonville?
Total Population of Sissonville is 2,680.
What is the Total Male Population of Sissonville?
Total Male Population of Sissonville is 1,235.
What is the Total Female Population of Sissonville?
Total Female Population of Sissonville is 1,445.
What is the Ratio of Males per 100 Females in Sissonville?
There are 85.47 Males per 100 Females in Sissonville.
What is the Ratio of Females per 100 Males in Sissonville?
There are 117.00 Females per 100 Males in Sissonville.
What is the Median Population Age in Sissonville?
Median Population Age in Sissonville is 47.9 Years.
What is the Average Family Size in Sissonville
Average Family Size in Sissonville is 3.2 People.
What is the Average Household Size in Sissonville
Average Household Size in Sissonville is 2.5 People.
How Large is the Labor Force in Sissonville?
There are 946 People in the Labor Forcein in Sissonville.
What is the Percentage of People in the Labor Force in Sissonville?
46.3% of People are in the Labor Force in Sissonville.
What is the Unemployment Rate in Sissonville?
Unemployment Rate in Sissonville is 11.4%.