Immigrants from Philippines vs Ugandan 3 or more Vehicles in Household
COMPARE
Immigrants from Philippines
Ugandan
3 or more Vehicles in Household
3 or more Vehicles in Household Comparison
Immigrants from Philippines
Ugandans
23.8%
3 OR MORE VEHICLES IN HOUSEHOLD
100.0/ 100
METRIC RATING
22nd/ 347
METRIC RANK
17.8%
3 OR MORE VEHICLES IN HOUSEHOLD
0.9/ 100
METRIC RATING
260th/ 347
METRIC RANK
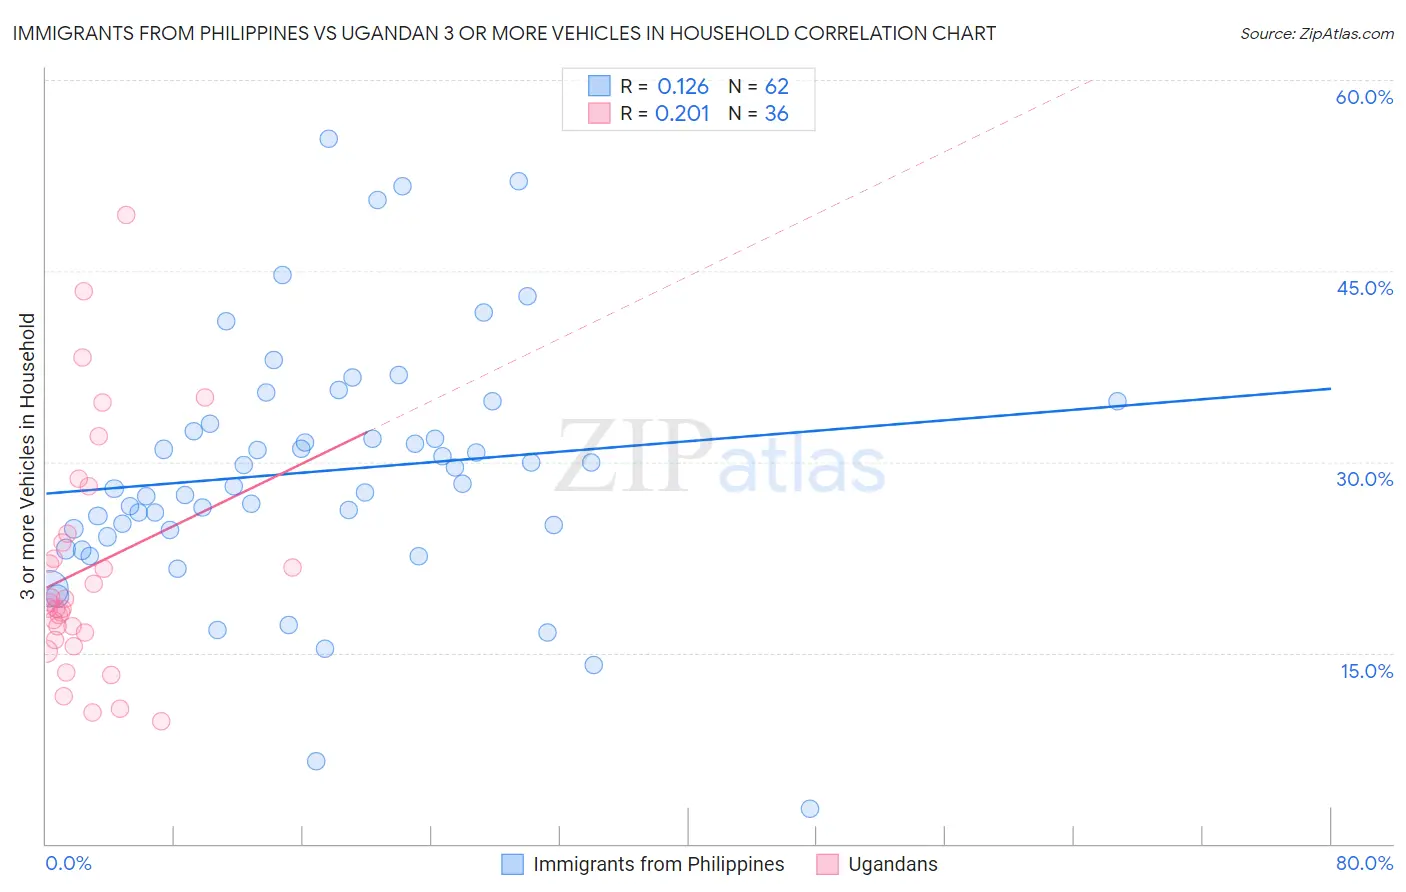
Immigrants from Philippines vs Ugandan 3 or more Vehicles in Household Correlation Chart
The statistical analysis conducted on geographies consisting of 470,874,140 people shows a poor positive correlation between the proportion of Immigrants from Philippines and percentage of households with 3 or more vehicles available in the United States with a correlation coefficient (R) of 0.126 and weighted average of 23.8%. Similarly, the statistical analysis conducted on geographies consisting of 93,996,667 people shows a weak positive correlation between the proportion of Ugandans and percentage of households with 3 or more vehicles available in the United States with a correlation coefficient (R) of 0.201 and weighted average of 17.8%, a difference of 33.6%.
3 or more Vehicles in Household Correlation Summary
| Measurement | Immigrants from Philippines | Ugandan |
| Minimum | 2.7% | 9.7% |
| Maximum | 55.4% | 49.4% |
| Range | 52.7% | 39.7% |
| Mean | 29.2% | 21.6% |
| Median | 28.2% | 18.7% |
| Interquartile 25% (IQ1) | 24.6% | 16.3% |
| Interquartile 75% (IQ3) | 33.0% | 24.0% |
| Interquartile Range (IQR) | 8.4% | 7.7% |
| Standard Deviation (Sample) | 9.9% | 9.2% |
| Standard Deviation (Population) | 9.8% | 9.1% |
Similar Demographics by 3 or more Vehicles in Household
Demographics Similar to Immigrants from Philippines by 3 or more Vehicles in Household
In terms of 3 or more vehicles in household, the demographic groups most similar to Immigrants from Philippines are Immigrants from Vietnam (23.8%, a difference of 0.060%), Paiute (23.8%, a difference of 0.18%), Chinese (23.9%, a difference of 0.47%), Norwegian (23.9%, a difference of 0.51%), and Scandinavian (23.6%, a difference of 0.59%).
| Demographics | Rating | Rank | 3 or more Vehicles in Household |
| Hawaiians | 100.0 /100 | #15 | Exceptional 24.3% |
| Basques | 100.0 /100 | #16 | Exceptional 24.3% |
| Koreans | 100.0 /100 | #17 | Exceptional 24.1% |
| Norwegians | 100.0 /100 | #18 | Exceptional 23.9% |
| Chinese | 100.0 /100 | #19 | Exceptional 23.9% |
| Paiute | 100.0 /100 | #20 | Exceptional 23.8% |
| Immigrants | Vietnam | 100.0 /100 | #21 | Exceptional 23.8% |
| Immigrants | Philippines | 100.0 /100 | #22 | Exceptional 23.8% |
| Scandinavians | 100.0 /100 | #23 | Exceptional 23.6% |
| Sri Lankans | 100.0 /100 | #24 | Exceptional 23.6% |
| Immigrants | Central America | 100.0 /100 | #25 | Exceptional 23.4% |
| Mexican American Indians | 100.0 /100 | #26 | Exceptional 23.3% |
| Guamanians/Chamorros | 100.0 /100 | #27 | Exceptional 23.2% |
| Lumbee | 100.0 /100 | #28 | Exceptional 23.1% |
| Spanish | 100.0 /100 | #29 | Exceptional 23.1% |
Demographics Similar to Ugandans by 3 or more Vehicles in Household
In terms of 3 or more vehicles in household, the demographic groups most similar to Ugandans are Immigrants from Northern Africa (17.8%, a difference of 0.020%), Colombian (17.8%, a difference of 0.050%), Uruguayan (17.8%, a difference of 0.13%), Bermudan (17.8%, a difference of 0.16%), and Cambodian (17.8%, a difference of 0.18%).
| Demographics | Rating | Rank | 3 or more Vehicles in Household |
| Immigrants | Ethiopia | 1.3 /100 | #253 | Tragic 17.9% |
| Ethiopians | 1.2 /100 | #254 | Tragic 17.9% |
| Immigrants | Turkey | 1.2 /100 | #255 | Tragic 17.9% |
| Sub-Saharan Africans | 1.1 /100 | #256 | Tragic 17.9% |
| Immigrants | Eritrea | 1.1 /100 | #257 | Tragic 17.8% |
| Sudanese | 1.1 /100 | #258 | Tragic 17.8% |
| Uruguayans | 1.0 /100 | #259 | Tragic 17.8% |
| Ugandans | 0.9 /100 | #260 | Tragic 17.8% |
| Immigrants | Northern Africa | 0.9 /100 | #261 | Tragic 17.8% |
| Colombians | 0.9 /100 | #262 | Tragic 17.8% |
| Bermudans | 0.9 /100 | #263 | Tragic 17.8% |
| Cambodians | 0.9 /100 | #264 | Tragic 17.8% |
| Immigrants | Panama | 0.8 /100 | #265 | Tragic 17.7% |
| Macedonians | 0.8 /100 | #266 | Tragic 17.7% |
| Immigrants | Venezuela | 0.8 /100 | #267 | Tragic 17.7% |