Costa Rican vs Immigrants from Honduras 3 or more Vehicles in Household
COMPARE
Costa Rican
Immigrants from Honduras
3 or more Vehicles in Household
3 or more Vehicles in Household Comparison
Costa Ricans
Immigrants from Honduras
20.6%
3 OR MORE VEHICLES IN HOUSEHOLD
94.6/ 100
METRIC RATING
118th/ 347
METRIC RANK
18.2%
3 OR MORE VEHICLES IN HOUSEHOLD
3.1/ 100
METRIC RATING
238th/ 347
METRIC RANK
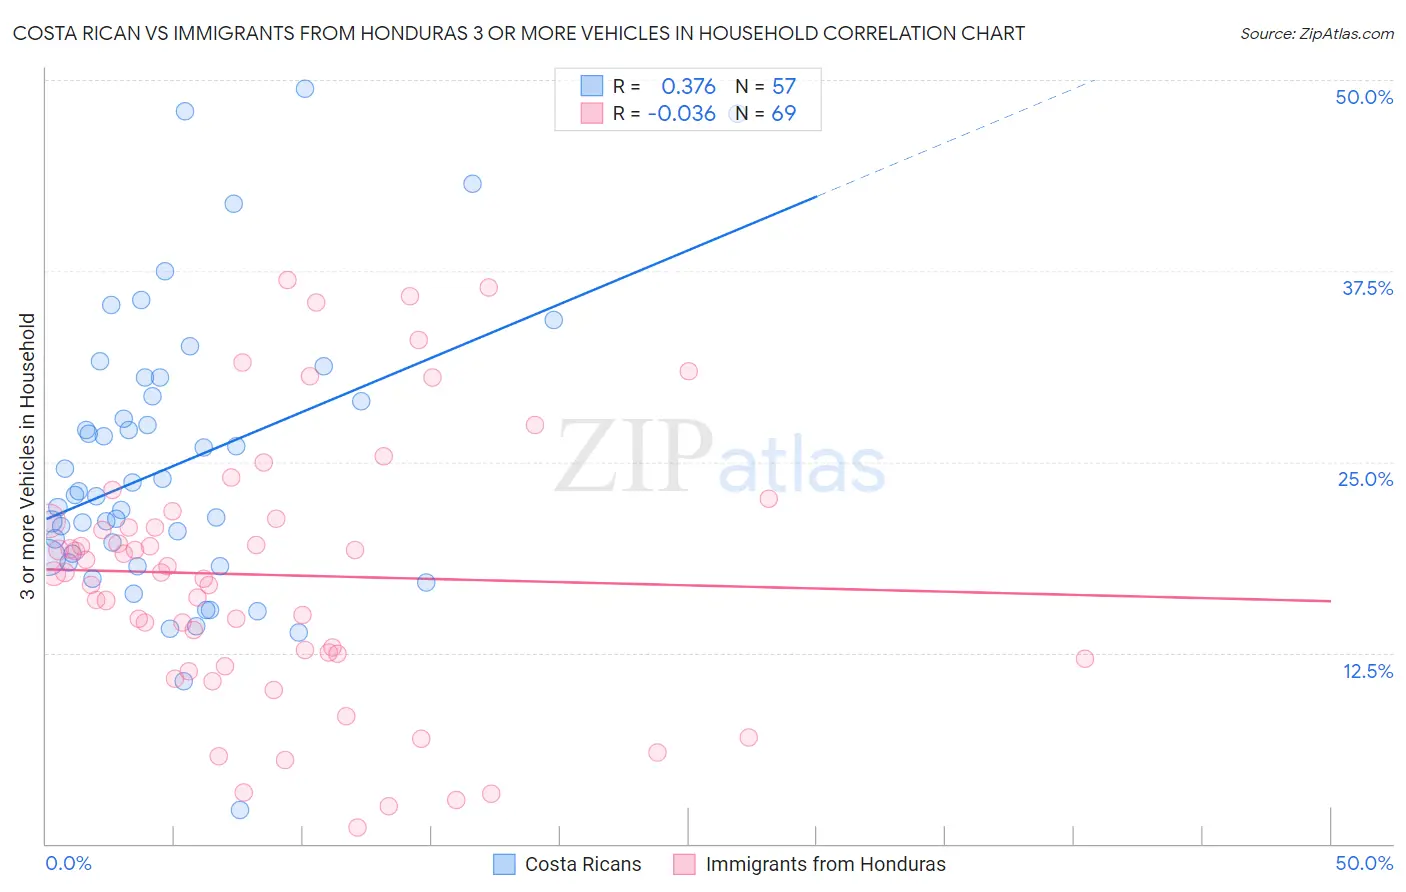
Costa Rican vs Immigrants from Honduras 3 or more Vehicles in Household Correlation Chart
The statistical analysis conducted on geographies consisting of 253,426,253 people shows a mild positive correlation between the proportion of Costa Ricans and percentage of households with 3 or more vehicles available in the United States with a correlation coefficient (R) of 0.376 and weighted average of 20.6%. Similarly, the statistical analysis conducted on geographies consisting of 322,444,199 people shows no correlation between the proportion of Immigrants from Honduras and percentage of households with 3 or more vehicles available in the United States with a correlation coefficient (R) of -0.036 and weighted average of 18.2%, a difference of 12.7%.
3 or more Vehicles in Household Correlation Summary
| Measurement | Costa Rican | Immigrants from Honduras |
| Minimum | 2.2% | 1.0% |
| Maximum | 49.4% | 36.9% |
| Range | 47.2% | 35.9% |
| Mean | 24.9% | 17.6% |
| Median | 22.9% | 17.7% |
| Interquartile 25% (IQ1) | 18.6% | 12.3% |
| Interquartile 75% (IQ3) | 29.9% | 21.2% |
| Interquartile Range (IQR) | 11.3% | 8.9% |
| Standard Deviation (Sample) | 9.4% | 8.6% |
| Standard Deviation (Population) | 9.3% | 8.5% |
Similar Demographics by 3 or more Vehicles in Household
Demographics Similar to Costa Ricans by 3 or more Vehicles in Household
In terms of 3 or more vehicles in household, the demographic groups most similar to Costa Ricans are Immigrants from Latin America (20.5%, a difference of 0.040%), Croatian (20.6%, a difference of 0.11%), Italian (20.6%, a difference of 0.13%), French Canadian (20.6%, a difference of 0.16%), and Maltese (20.5%, a difference of 0.23%).
| Demographics | Rating | Rank | 3 or more Vehicles in Household |
| Immigrants | Micronesia | 96.7 /100 | #111 | Exceptional 20.7% |
| Nicaraguans | 96.2 /100 | #112 | Exceptional 20.7% |
| Immigrants | England | 96.2 /100 | #113 | Exceptional 20.7% |
| Burmese | 95.8 /100 | #114 | Exceptional 20.6% |
| French Canadians | 95.0 /100 | #115 | Exceptional 20.6% |
| Italians | 94.9 /100 | #116 | Exceptional 20.6% |
| Croatians | 94.9 /100 | #117 | Exceptional 20.6% |
| Costa Ricans | 94.6 /100 | #118 | Exceptional 20.6% |
| Immigrants | Latin America | 94.5 /100 | #119 | Exceptional 20.5% |
| Maltese | 93.9 /100 | #120 | Exceptional 20.5% |
| Immigrants | Thailand | 93.8 /100 | #121 | Exceptional 20.5% |
| German Russians | 93.7 /100 | #122 | Exceptional 20.5% |
| Immigrants | Korea | 93.7 /100 | #123 | Exceptional 20.5% |
| Central Americans | 93.1 /100 | #124 | Exceptional 20.5% |
| Immigrants | Netherlands | 92.9 /100 | #125 | Exceptional 20.4% |
Demographics Similar to Immigrants from Honduras by 3 or more Vehicles in Household
In terms of 3 or more vehicles in household, the demographic groups most similar to Immigrants from Honduras are Immigrants from Middle Africa (18.2%, a difference of 0.010%), Immigrants from China (18.2%, a difference of 0.13%), Indonesian (18.3%, a difference of 0.23%), Immigrants from Malaysia (18.3%, a difference of 0.28%), and African (18.2%, a difference of 0.33%).
| Demographics | Rating | Rank | 3 or more Vehicles in Household |
| Immigrants | Belgium | 4.8 /100 | #231 | Tragic 18.4% |
| Immigrants | Uganda | 4.6 /100 | #232 | Tragic 18.4% |
| Hondurans | 4.6 /100 | #233 | Tragic 18.4% |
| Immigrants | North Macedonia | 4.4 /100 | #234 | Tragic 18.4% |
| Sierra Leoneans | 3.9 /100 | #235 | Tragic 18.3% |
| Immigrants | Malaysia | 3.6 /100 | #236 | Tragic 18.3% |
| Indonesians | 3.5 /100 | #237 | Tragic 18.3% |
| Immigrants | Honduras | 3.1 /100 | #238 | Tragic 18.2% |
| Immigrants | Middle Africa | 3.1 /100 | #239 | Tragic 18.2% |
| Immigrants | China | 2.9 /100 | #240 | Tragic 18.2% |
| Africans | 2.7 /100 | #241 | Tragic 18.2% |
| Hopi | 2.5 /100 | #242 | Tragic 18.2% |
| Immigrants | Europe | 2.4 /100 | #243 | Tragic 18.1% |
| Mongolians | 2.3 /100 | #244 | Tragic 18.1% |
| Immigrants | Belize | 2.1 /100 | #245 | Tragic 18.1% |