Costa Rican vs Latvian 3 or more Vehicles in Household
COMPARE
Costa Rican
Latvian
3 or more Vehicles in Household
3 or more Vehicles in Household Comparison
Costa Ricans
Latvians
20.6%
3 OR MORE VEHICLES IN HOUSEHOLD
94.6/ 100
METRIC RATING
118th/ 347
METRIC RANK
19.3%
3 OR MORE VEHICLES IN HOUSEHOLD
35.7/ 100
METRIC RATING
184th/ 347
METRIC RANK
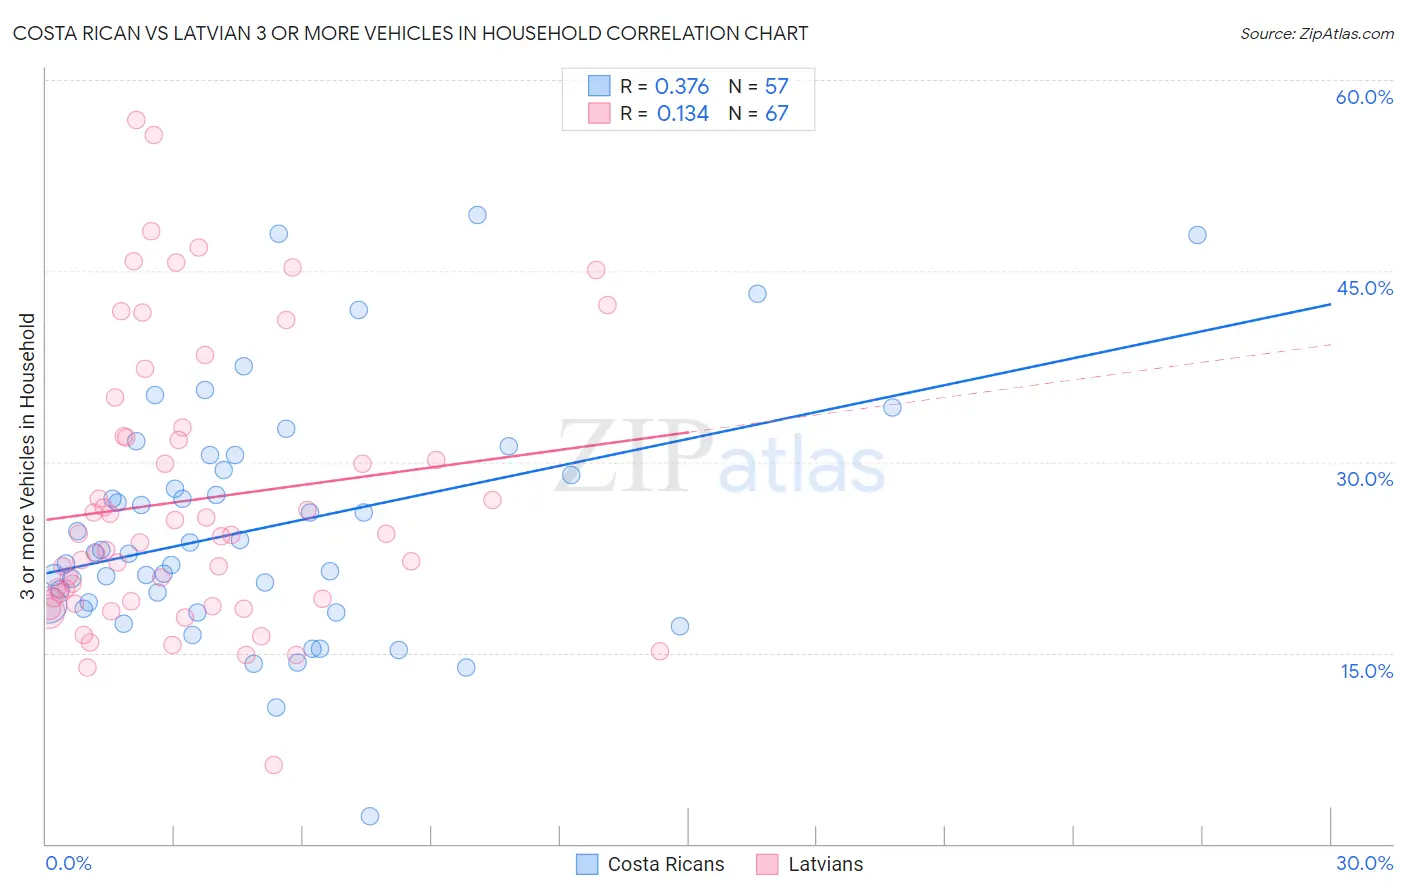
Costa Rican vs Latvian 3 or more Vehicles in Household Correlation Chart
The statistical analysis conducted on geographies consisting of 253,426,253 people shows a mild positive correlation between the proportion of Costa Ricans and percentage of households with 3 or more vehicles available in the United States with a correlation coefficient (R) of 0.376 and weighted average of 20.6%. Similarly, the statistical analysis conducted on geographies consisting of 220,591,398 people shows a poor positive correlation between the proportion of Latvians and percentage of households with 3 or more vehicles available in the United States with a correlation coefficient (R) of 0.134 and weighted average of 19.3%, a difference of 6.6%.
3 or more Vehicles in Household Correlation Summary
| Measurement | Costa Rican | Latvian |
| Minimum | 2.2% | 6.2% |
| Maximum | 49.4% | 56.8% |
| Range | 47.2% | 50.6% |
| Mean | 24.9% | 27.0% |
| Median | 22.9% | 24.2% |
| Interquartile 25% (IQ1) | 18.6% | 19.0% |
| Interquartile 75% (IQ3) | 29.9% | 32.0% |
| Interquartile Range (IQR) | 11.3% | 13.0% |
| Standard Deviation (Sample) | 9.4% | 10.9% |
| Standard Deviation (Population) | 9.3% | 10.9% |
Similar Demographics by 3 or more Vehicles in Household
Demographics Similar to Costa Ricans by 3 or more Vehicles in Household
In terms of 3 or more vehicles in household, the demographic groups most similar to Costa Ricans are Immigrants from Latin America (20.5%, a difference of 0.040%), Croatian (20.6%, a difference of 0.11%), Italian (20.6%, a difference of 0.13%), French Canadian (20.6%, a difference of 0.16%), and Maltese (20.5%, a difference of 0.23%).
| Demographics | Rating | Rank | 3 or more Vehicles in Household |
| Immigrants | Micronesia | 96.7 /100 | #111 | Exceptional 20.7% |
| Nicaraguans | 96.2 /100 | #112 | Exceptional 20.7% |
| Immigrants | England | 96.2 /100 | #113 | Exceptional 20.7% |
| Burmese | 95.8 /100 | #114 | Exceptional 20.6% |
| French Canadians | 95.0 /100 | #115 | Exceptional 20.6% |
| Italians | 94.9 /100 | #116 | Exceptional 20.6% |
| Croatians | 94.9 /100 | #117 | Exceptional 20.6% |
| Costa Ricans | 94.6 /100 | #118 | Exceptional 20.6% |
| Immigrants | Latin America | 94.5 /100 | #119 | Exceptional 20.5% |
| Maltese | 93.9 /100 | #120 | Exceptional 20.5% |
| Immigrants | Thailand | 93.8 /100 | #121 | Exceptional 20.5% |
| German Russians | 93.7 /100 | #122 | Exceptional 20.5% |
| Immigrants | Korea | 93.7 /100 | #123 | Exceptional 20.5% |
| Central Americans | 93.1 /100 | #124 | Exceptional 20.5% |
| Immigrants | Netherlands | 92.9 /100 | #125 | Exceptional 20.4% |
Demographics Similar to Latvians by 3 or more Vehicles in Household
In terms of 3 or more vehicles in household, the demographic groups most similar to Latvians are Cajun (19.3%, a difference of 0.020%), Cuban (19.3%, a difference of 0.070%), Romanian (19.3%, a difference of 0.11%), South African (19.3%, a difference of 0.15%), and Immigrants from South Central Asia (19.3%, a difference of 0.26%).
| Demographics | Rating | Rank | 3 or more Vehicles in Household |
| Immigrants | Peru | 41.1 /100 | #177 | Average 19.4% |
| Immigrants | Syria | 40.3 /100 | #178 | Average 19.4% |
| Immigrants | South Central Asia | 38.9 /100 | #179 | Fair 19.3% |
| South Africans | 37.5 /100 | #180 | Fair 19.3% |
| Romanians | 37.1 /100 | #181 | Fair 19.3% |
| Cubans | 36.6 /100 | #182 | Fair 19.3% |
| Cajuns | 36.0 /100 | #183 | Fair 19.3% |
| Latvians | 35.7 /100 | #184 | Fair 19.3% |
| Immigrants | Sri Lanka | 30.7 /100 | #185 | Fair 19.2% |
| Immigrants | Sweden | 29.0 /100 | #186 | Fair 19.2% |
| Immigrants | Hong Kong | 28.3 /100 | #187 | Fair 19.2% |
| Immigrants | Kuwait | 26.1 /100 | #188 | Fair 19.1% |
| Indians (Asian) | 26.0 /100 | #189 | Fair 19.1% |
| Immigrants | Zimbabwe | 25.5 /100 | #190 | Fair 19.1% |
| South American Indians | 25.4 /100 | #191 | Fair 19.1% |