Armenian Receiving Food Stamps
COMPARE
Armenian
Select to Compare
Receiving Food Stamps
Armenian Receiving Food Stamps
11.1%
PUBLIC INCOME | FOOD STAMPS
81.4/ 100
METRIC RATING
154th/ 347
METRIC RANK
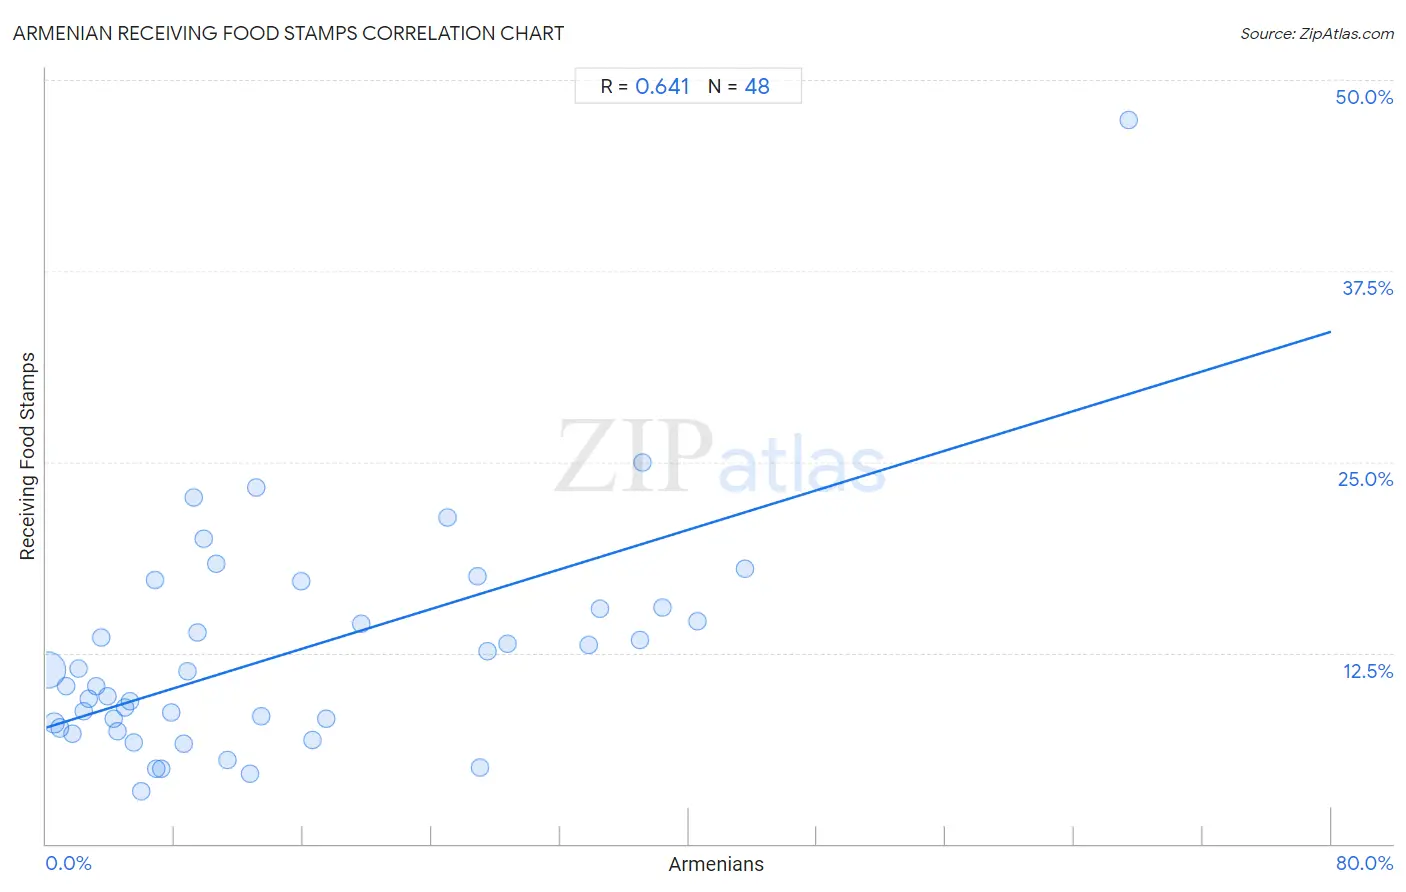
Armenian Receiving Food Stamps Correlation Chart
The statistical analysis conducted on geographies consisting of 309,974,656 people shows a significant positive correlation between the proportion of Armenians and percentage of population receiving government assistance and/or food stamps in the United States with a correlation coefficient (R) of 0.641 and weighted average of 11.1%. On average, for every 1% (one percent) increase in Armenians within a typical geography, there is an increase of 0.32% in percentage of population receiving government assistance and/or food stamps.
It is essential to understand that the correlation between the percentage of Armenians and percentage of population receiving government assistance and/or food stamps does not imply a direct cause-and-effect relationship. It remains uncertain whether the presence of Armenians influences an upward or downward trend in the level of percentage of population receiving government assistance and/or food stamps within an area, or if Armenians simply ended up residing in those areas with higher or lower levels of percentage of population receiving government assistance and/or food stamps due to other factors.
Demographics Similar to Armenians by Receiving Food Stamps
In terms of receiving food stamps, the demographic groups most similar to Armenians are Lebanese (11.1%, a difference of 0.060%), Immigrants from Kazakhstan (11.1%, a difference of 0.080%), Immigrants from Spain (11.1%, a difference of 0.090%), Immigrants from Argentina (11.2%, a difference of 0.25%), and Soviet Union (11.1%, a difference of 0.45%).
| Demographics | Rating | Rank | Receiving Food Stamps |
| Whites/Caucasians | 83.9 /100 | #147 | Excellent 11.1% |
| Immigrants from South Eastern Asia | 83.3 /100 | #148 | Excellent 11.1% |
| Brazilians | 83.2 /100 | #149 | Excellent 11.1% |
| Soviet Union | 83.1 /100 | #150 | Excellent 11.1% |
| Immigrants from Spain | 81.7 /100 | #151 | Excellent 11.1% |
| Immigrants from Kazakhstan | 81.7 /100 | #152 | Excellent 11.1% |
| Lebanese | 81.6 /100 | #153 | Excellent 11.1% |
| Armenians | 81.4 /100 | #154 | Excellent 11.1% |
| Immigrants from Argentina | 80.4 /100 | #155 | Excellent 11.2% |
| Immigrants from Afghanistan | 75.6 /100 | #156 | Good 11.3% |
| Immigrants from Lebanon | 75.2 /100 | #157 | Good 11.3% |
| Immigrants from Bosnia and Herzegovina | 72.6 /100 | #158 | Good 11.3% |
| Immigrants from Oceania | 70.4 /100 | #159 | Good 11.4% |
| French Canadians | 69.5 /100 | #160 | Good 11.4% |
| Pennsylvania Germans | 68.4 /100 | #161 | Good 11.4% |
Armenian Receiving Food Stamps Correlation Summary
| Measurement | Armenian Data | Receiving Food Stamps Data |
| Minimum | 0.097% | 3.5% |
| Maximum | 67.4% | 47.4% |
| Range | 67.3% | 43.9% |
| Mean | 15.1% | 12.5% |
| Median | 9.3% | 10.8% |
| Interquartile 25% (IQ1) | 4.3% | 7.7% |
| Interquartile 75% (IQ3) | 25.9% | 15.4% |
| Interquartile Range (IQR) | 21.6% | 7.7% |
| Standard Deviation (Sample) | 14.7% | 7.4% |
| Standard Deviation (Population) | 14.5% | 7.4% |
Correlation Details
| Armenian Percentile | Sample Size | Receiving Food Stamps |
[ 0.0% - 0.5% ] 0.097% | 269,809,164 | 11.3% |
[ 0.0% - 0.5% ] 0.49% | 23,483,174 | 7.9% |
[ 0.5% - 1.0% ] 0.87% | 5,289,241 | 7.6% |
[ 1.0% - 1.5% ] 1.24% | 2,849,604 | 10.3% |
[ 1.5% - 2.0% ] 1.63% | 835,467 | 7.2% |
[ 2.0% - 2.5% ] 2.02% | 4,844,166 | 11.5% |
[ 2.0% - 2.5% ] 2.30% | 499,837 | 8.7% |
[ 2.5% - 3.0% ] 2.68% | 503,034 | 9.5% |
[ 3.0% - 3.5% ] 3.12% | 111,457 | 10.3% |
[ 3.0% - 3.5% ] 3.45% | 257,790 | 13.5% |
[ 3.5% - 4.0% ] 3.83% | 26,366 | 9.6% |
[ 4.0% - 4.5% ] 4.18% | 69,517 | 8.2% |
[ 4.0% - 4.5% ] 4.45% | 110,830 | 7.4% |
[ 4.5% - 5.0% ] 4.87% | 30,109 | 8.9% |
[ 5.0% - 5.5% ] 5.22% | 90,657 | 9.3% |
[ 5.0% - 5.5% ] 5.46% | 109,631 | 6.6% |
[ 5.5% - 6.0% ] 5.90% | 88,797 | 3.5% |
[ 6.5% - 7.0% ] 6.80% | 60,345 | 17.3% |
[ 6.5% - 7.0% ] 6.86% | 44,244 | 4.9% |
[ 7.0% - 7.5% ] 7.19% | 20,092 | 4.9% |
[ 7.5% - 8.0% ] 7.76% | 7,344 | 8.6% |
[ 8.5% - 9.0% ] 8.54% | 72,421 | 6.6% |
[ 8.5% - 9.0% ] 8.76% | 145,227 | 11.3% |
[ 9.0% - 9.5% ] 9.19% | 468 | 22.7% |
[ 9.0% - 9.5% ] 9.41% | 43,552 | 13.8% |
[ 9.5% - 10.0% ] 9.83% | 865 | 20.0% |
[ 10.5% - 11.0% ] 10.62% | 51,654 | 18.3% |
[ 11.0% - 11.5% ] 11.28% | 133 | 5.5% |
[ 12.5% - 13.0% ] 12.69% | 32,827 | 4.6% |
[ 13.0% - 13.5% ] 13.08% | 650 | 23.3% |
[ 13.0% - 13.5% ] 13.41% | 27,523 | 8.3% |
[ 15.5% - 16.0% ] 15.85% | 2,038 | 17.2% |
[ 16.5% - 17.0% ] 16.58% | 20,911 | 6.8% |
[ 17.0% - 17.5% ] 17.45% | 7,509 | 8.2% |
[ 19.5% - 20.0% ] 19.65% | 12,312 | 14.4% |
[ 25.0% - 25.5% ] 25.00% | 116 | 21.3% |
[ 26.5% - 27.0% ] 26.83% | 45,564 | 17.5% |
[ 26.5% - 27.0% ] 26.98% | 15,377 | 5.0% |
[ 27.0% - 27.5% ] 27.43% | 226 | 12.6% |
[ 28.5% - 29.0% ] 28.71% | 18,951 | 13.1% |
[ 33.5% - 34.0% ] 33.78% | 16,679 | 13.0% |
[ 34.5% - 35.0% ] 34.51% | 194,512 | 15.4% |
[ 36.5% - 37.0% ] 36.93% | 32,294 | 13.3% |
[ 37.0% - 37.5% ] 37.12% | 35,755 | 25.0% |
[ 38.0% - 38.5% ] 38.33% | 11,091 | 15.5% |
[ 40.5% - 41.0% ] 40.51% | 22,831 | 14.6% |
[ 43.5% - 44.0% ] 43.52% | 22,163 | 18.0% |
[ 67.0% - 67.5% ] 67.38% | 141 | 47.4% |