Armenian Single Mother Poverty
COMPARE
Armenian
Select to Compare
Single Mother Poverty
Armenian Single Mother Poverty
26.8%
POVERTY | SINGLE MOTHERS
99.9/ 100
METRIC RATING
42nd/ 347
METRIC RANK
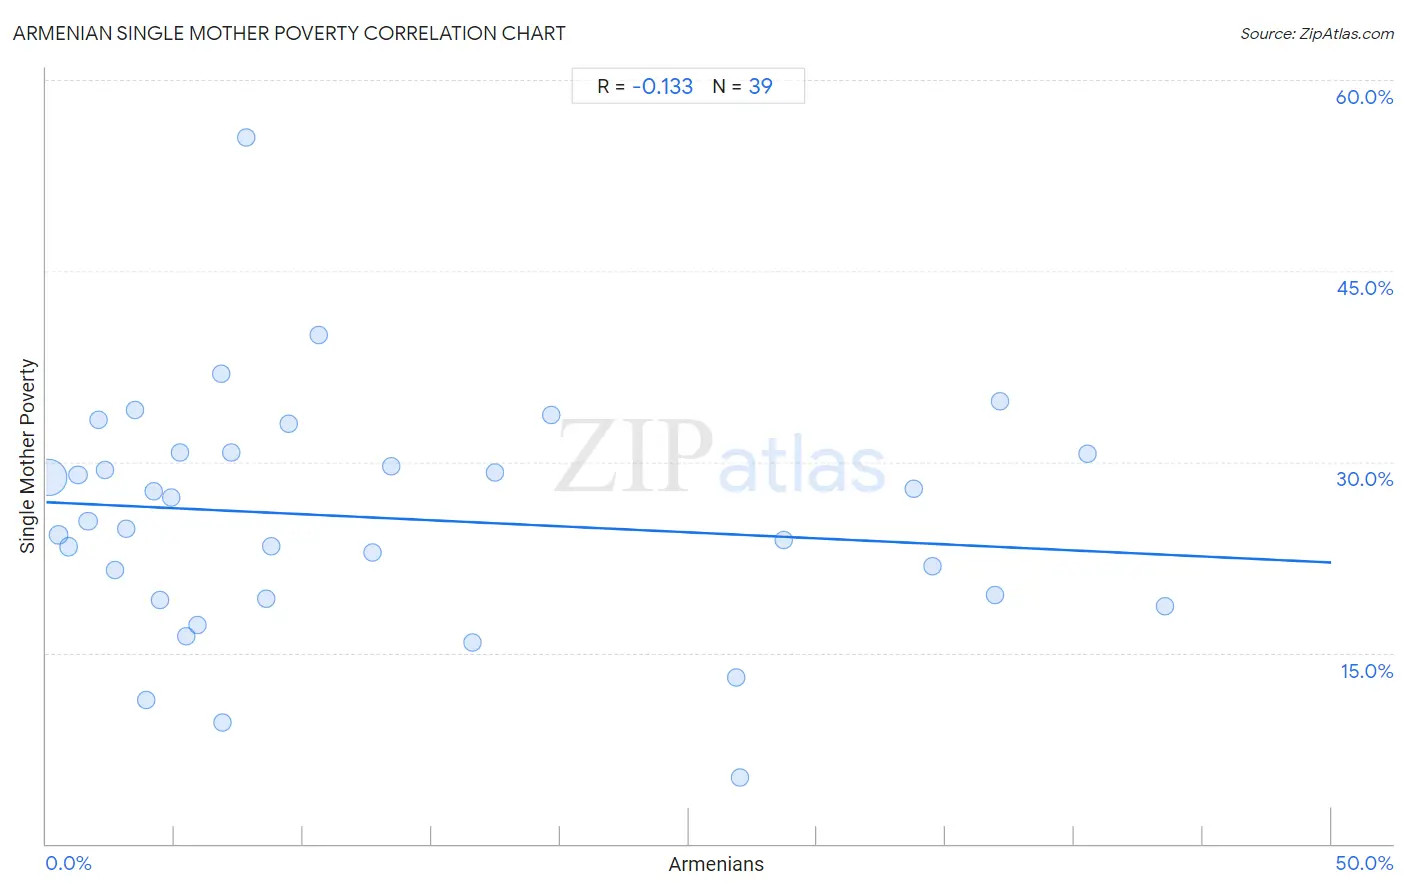
Armenian Single Mother Poverty Correlation Chart
The statistical analysis conducted on geographies consisting of 302,870,774 people shows a poor negative correlation between the proportion of Armenians and poverty level among single mothers in the United States with a correlation coefficient (R) of -0.133 and weighted average of 26.8%. On average, for every 1% (one percent) increase in Armenians within a typical geography, there is a decrease of 0.095% in poverty level among single mothers.
It is essential to understand that the correlation between the percentage of Armenians and poverty level among single mothers does not imply a direct cause-and-effect relationship. It remains uncertain whether the presence of Armenians influences an upward or downward trend in the level of poverty level among single mothers within an area, or if Armenians simply ended up residing in those areas with higher or lower levels of poverty level among single mothers due to other factors.
Demographics Similar to Armenians by Single Mother Poverty
In terms of single mother poverty, the demographic groups most similar to Armenians are Tsimshian (26.8%, a difference of 0.080%), Immigrants from Sierra Leone (26.9%, a difference of 0.22%), Immigrants from Greece (26.7%, a difference of 0.23%), Latvian (26.9%, a difference of 0.29%), and Immigrants from Vietnam (26.7%, a difference of 0.31%).
| Demographics | Rating | Rank | Single Mother Poverty |
| Maltese | 99.9 /100 | #35 | Exceptional 26.6% |
| Okinawans | 99.9 /100 | #36 | Exceptional 26.6% |
| Immigrants from Israel | 99.9 /100 | #37 | Exceptional 26.6% |
| Immigrants from Fiji | 99.9 /100 | #38 | Exceptional 26.6% |
| Sri Lankans | 99.9 /100 | #39 | Exceptional 26.7% |
| Immigrants from Vietnam | 99.9 /100 | #40 | Exceptional 26.7% |
| Immigrants from Greece | 99.9 /100 | #41 | Exceptional 26.7% |
| Armenians | 99.9 /100 | #42 | Exceptional 26.8% |
| Tsimshian | 99.9 /100 | #43 | Exceptional 26.8% |
| Immigrants from Sierra Leone | 99.9 /100 | #44 | Exceptional 26.9% |
| Latvians | 99.9 /100 | #45 | Exceptional 26.9% |
| Immigrants from Serbia | 99.9 /100 | #46 | Exceptional 26.9% |
| Egyptians | 99.8 /100 | #47 | Exceptional 26.9% |
| Immigrants from Poland | 99.8 /100 | #48 | Exceptional 26.9% |
| Cambodians | 99.8 /100 | #49 | Exceptional 27.0% |
Armenian Single Mother Poverty Correlation Summary
| Measurement | Armenian Data | Single Mother Poverty Data |
| Minimum | 0.096% | 5.2% |
| Maximum | 43.5% | 55.5% |
| Range | 43.4% | 50.3% |
| Mean | 13.0% | 25.6% |
| Median | 7.2% | 25.4% |
| Interquartile 25% (IQ1) | 3.5% | 19.2% |
| Interquartile 75% (IQ3) | 19.6% | 30.7% |
| Interquartile Range (IQR) | 16.2% | 11.5% |
| Standard Deviation (Sample) | 13.0% | 9.2% |
| Standard Deviation (Population) | 12.8% | 9.1% |
Correlation Details
| Armenian Percentile | Sample Size | Single Mother Poverty |
[ 0.0% - 0.5% ] 0.096% | 265,226,618 | 28.8% |
[ 0.0% - 0.5% ] 0.49% | 22,024,481 | 24.3% |
[ 0.5% - 1.0% ] 0.87% | 4,757,517 | 23.3% |
[ 1.0% - 1.5% ] 1.24% | 2,612,519 | 28.9% |
[ 1.5% - 2.0% ] 1.63% | 744,040 | 25.4% |
[ 2.0% - 2.5% ] 2.02% | 4,783,677 | 33.3% |
[ 2.0% - 2.5% ] 2.29% | 475,383 | 29.4% |
[ 2.5% - 3.0% ] 2.68% | 474,160 | 21.5% |
[ 3.0% - 3.5% ] 3.13% | 108,822 | 24.8% |
[ 3.0% - 3.5% ] 3.46% | 235,456 | 34.1% |
[ 3.5% - 4.0% ] 3.90% | 16,588 | 11.3% |
[ 4.0% - 4.5% ] 4.20% | 48,862 | 27.7% |
[ 4.0% - 4.5% ] 4.45% | 107,867 | 19.2% |
[ 4.5% - 5.0% ] 4.88% | 28,497 | 27.2% |
[ 5.0% - 5.5% ] 5.23% | 85,743 | 30.7% |
[ 5.0% - 5.5% ] 5.45% | 108,092 | 16.3% |
[ 5.5% - 6.0% ] 5.90% | 88,797 | 17.2% |
[ 6.5% - 7.0% ] 6.80% | 60,345 | 37.0% |
[ 6.5% - 7.0% ] 6.86% | 42,719 | 9.6% |
[ 7.0% - 7.5% ] 7.19% | 20,092 | 30.7% |
[ 7.5% - 8.0% ] 7.77% | 2,264 | 55.5% |
[ 8.5% - 9.0% ] 8.54% | 72,421 | 19.2% |
[ 8.5% - 9.0% ] 8.76% | 145,227 | 23.4% |
[ 9.0% - 9.5% ] 9.41% | 43,552 | 33.0% |
[ 10.5% - 11.0% ] 10.62% | 51,654 | 40.0% |
[ 12.5% - 13.0% ] 12.69% | 32,344 | 22.8% |
[ 13.0% - 13.5% ] 13.41% | 27,479 | 29.6% |
[ 16.5% - 17.0% ] 16.58% | 20,911 | 15.8% |
[ 17.0% - 17.5% ] 17.46% | 8,209 | 29.2% |
[ 19.5% - 20.0% ] 19.65% | 12,312 | 33.7% |
[ 26.5% - 27.0% ] 26.83% | 45,564 | 13.1% |
[ 26.5% - 27.0% ] 26.98% | 15,377 | 5.2% |
[ 28.5% - 29.0% ] 28.71% | 18,951 | 23.9% |
[ 33.5% - 34.0% ] 33.78% | 16,679 | 27.9% |
[ 34.5% - 35.0% ] 34.51% | 194,512 | 21.8% |
[ 36.5% - 37.0% ] 36.93% | 32,294 | 19.5% |
[ 37.0% - 37.5% ] 37.12% | 35,755 | 34.8% |
[ 40.5% - 41.0% ] 40.51% | 22,831 | 30.6% |
[ 43.5% - 44.0% ] 43.52% | 22,163 | 18.6% |