Armenian Female Disability
COMPARE
Armenian
Select to Compare
Female Disability
Armenian Female Disability
12.3%
DISABILITY | FEMALES
29.7/ 100
METRIC RATING
191st/ 347
METRIC RANK
Armenian Female Disability Correlation Chart
The statistical analysis conducted on geographies consisting of 310,925,320 people shows a significant positive correlation between the proportion of Armenians and percentage of females with a disability in the United States with a correlation coefficient (R) of 0.623 and weighted average of 12.3%. On average, for every 1% (one percent) increase in Armenians within a typical geography, there is an increase of 0.48% in percentage of females with a disability.
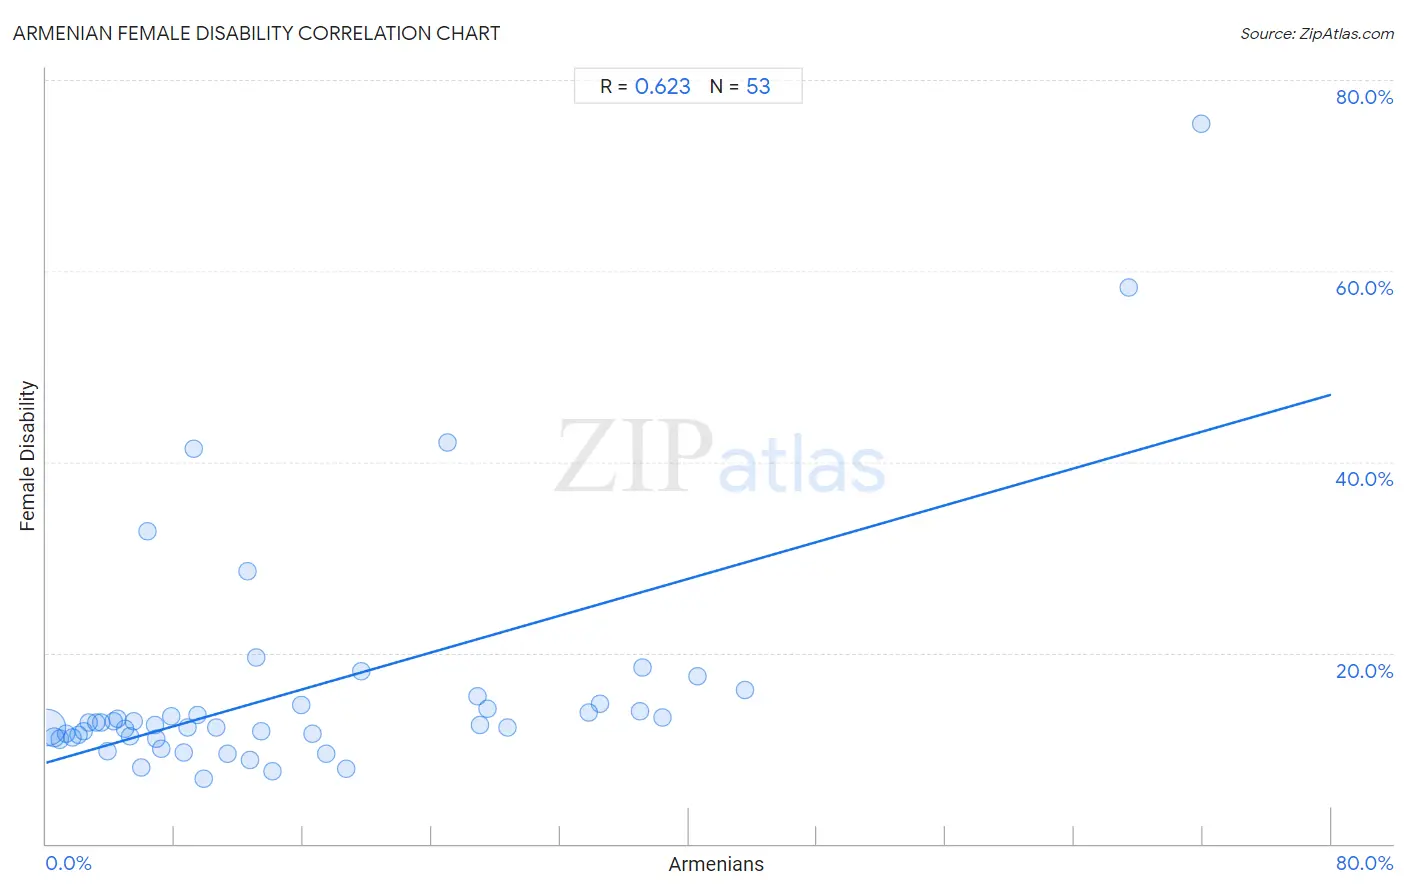
It is essential to understand that the correlation between the percentage of Armenians and percentage of females with a disability does not imply a direct cause-and-effect relationship. It remains uncertain whether the presence of Armenians influences an upward or downward trend in the level of percentage of females with a disability within an area, or if Armenians simply ended up residing in those areas with higher or lower levels of percentage of females with a disability due to other factors.
Demographics Similar to Armenians by Female Disability
In terms of female disability, the demographic groups most similar to Armenians are Immigrants from Western Africa (12.3%, a difference of 0.020%), Immigrants from Honduras (12.3%, a difference of 0.070%), Immigrants from Albania (12.3%, a difference of 0.080%), Northern European (12.3%, a difference of 0.10%), and Ukrainian (12.3%, a difference of 0.11%).
| Demographics | Rating | Rank | Female Disability |
| Iraqis | 36.0 /100 | #184 | Fair 12.3% |
| Immigrants from Uzbekistan | 33.9 /100 | #185 | Fair 12.3% |
| Austrians | 33.3 /100 | #186 | Fair 12.3% |
| Serbians | 33.1 /100 | #187 | Fair 12.3% |
| Immigrants from North America | 32.8 /100 | #188 | Fair 12.3% |
| Immigrants from Albania | 31.6 /100 | #189 | Fair 12.3% |
| Immigrants from Honduras | 31.3 /100 | #190 | Fair 12.3% |
| Armenians | 29.7 /100 | #191 | Fair 12.3% |
| Immigrants from Western Africa | 29.2 /100 | #192 | Fair 12.3% |
| Northern Europeans | 27.5 /100 | #193 | Fair 12.3% |
| Ukrainians | 27.2 /100 | #194 | Fair 12.3% |
| Swedes | 26.6 /100 | #195 | Fair 12.3% |
| Immigrants from Panama | 25.5 /100 | #196 | Fair 12.3% |
| Hondurans | 25.4 /100 | #197 | Fair 12.3% |
| Mexican American Indians | 24.9 /100 | #198 | Fair 12.3% |
Armenian Female Disability Correlation Summary
| Measurement | Armenian Data | Female Disability Data |
| Minimum | 0.098% | 6.9% |
| Maximum | 71.9% | 75.4% |
| Range | 71.8% | 68.5% |
| Mean | 16.0% | 16.2% |
| Median | 9.8% | 12.5% |
| Interquartile 25% (IQ1) | 4.7% | 11.2% |
| Interquartile 75% (IQ3) | 25.9% | 14.6% |
| Interquartile Range (IQR) | 21.3% | 3.4% |
| Standard Deviation (Sample) | 16.1% | 12.4% |
| Standard Deviation (Population) | 15.9% | 12.3% |
Correlation Details
| Armenian Percentile | Sample Size | Female Disability |
[ 0.0% - 0.5% ] 0.098% | 270,316,341 | 12.1% |
[ 0.0% - 0.5% ] 0.49% | 23,678,634 | 11.2% |
[ 0.5% - 1.0% ] 0.87% | 5,375,630 | 11.0% |
[ 1.0% - 1.5% ] 1.24% | 2,947,229 | 11.5% |
[ 1.5% - 2.0% ] 1.62% | 855,232 | 11.2% |
[ 2.0% - 2.5% ] 2.02% | 4,863,084 | 11.4% |
[ 2.0% - 2.5% ] 2.30% | 516,136 | 11.8% |
[ 2.5% - 3.0% ] 2.68% | 505,109 | 12.7% |
[ 3.0% - 3.5% ] 3.12% | 111,744 | 12.8% |
[ 3.0% - 3.5% ] 3.45% | 259,339 | 12.8% |
[ 3.5% - 4.0% ] 3.83% | 26,366 | 9.7% |
[ 4.0% - 4.5% ] 4.18% | 69,133 | 12.8% |
[ 4.0% - 4.5% ] 4.45% | 111,511 | 13.1% |
[ 4.5% - 5.0% ] 4.87% | 31,277 | 12.1% |
[ 5.0% - 5.5% ] 5.22% | 90,657 | 11.3% |
[ 5.0% - 5.5% ] 5.46% | 109,631 | 12.8% |
[ 5.5% - 6.0% ] 5.90% | 88,797 | 7.9% |
[ 6.0% - 6.5% ] 6.27% | 829 | 32.8% |
[ 6.5% - 7.0% ] 6.80% | 60,345 | 12.4% |
[ 6.5% - 7.0% ] 6.86% | 44,244 | 11.1% |
[ 7.0% - 7.5% ] 7.19% | 20,092 | 9.9% |
[ 7.5% - 8.0% ] 7.76% | 7,344 | 13.4% |
[ 8.5% - 9.0% ] 8.54% | 72,421 | 9.5% |
[ 8.5% - 9.0% ] 8.76% | 145,227 | 12.2% |
[ 9.0% - 9.5% ] 9.19% | 468 | 41.4% |
[ 9.0% - 9.5% ] 9.42% | 43,893 | 13.5% |
[ 9.5% - 10.0% ] 9.82% | 947 | 6.9% |
[ 10.5% - 11.0% ] 10.62% | 51,654 | 12.2% |
[ 11.0% - 11.5% ] 11.28% | 133 | 9.4% |
[ 12.0% - 12.5% ] 12.50% | 16 | 28.6% |
[ 12.5% - 13.0% ] 12.69% | 33,101 | 8.8% |
[ 13.0% - 13.5% ] 13.08% | 650 | 19.5% |
[ 13.0% - 13.5% ] 13.41% | 27,479 | 11.8% |
[ 14.0% - 14.5% ] 14.08% | 206 | 7.6% |
[ 15.5% - 16.0% ] 15.89% | 2,644 | 14.5% |
[ 16.5% - 17.0% ] 16.58% | 20,911 | 11.6% |
[ 17.0% - 17.5% ] 17.46% | 8,209 | 9.5% |
[ 18.5% - 19.0% ] 18.65% | 429 | 7.8% |
[ 19.5% - 20.0% ] 19.65% | 12,312 | 18.1% |
[ 25.0% - 25.5% ] 25.00% | 116 | 42.1% |
[ 26.5% - 27.0% ] 26.83% | 45,564 | 15.5% |
[ 26.5% - 27.0% ] 26.98% | 15,465 | 12.5% |
[ 27.0% - 27.5% ] 27.43% | 226 | 14.2% |
[ 28.5% - 29.0% ] 28.71% | 18,951 | 12.2% |
[ 33.5% - 34.0% ] 33.78% | 16,679 | 13.7% |
[ 34.5% - 35.0% ] 34.51% | 194,512 | 14.7% |
[ 36.5% - 37.0% ] 36.93% | 32,294 | 13.9% |
[ 37.0% - 37.5% ] 37.12% | 35,755 | 18.5% |
[ 38.0% - 38.5% ] 38.33% | 11,091 | 13.3% |
[ 40.5% - 41.0% ] 40.51% | 22,831 | 17.6% |
[ 43.5% - 44.0% ] 43.52% | 22,163 | 16.0% |
[ 67.0% - 67.5% ] 67.38% | 141 | 58.2% |
[ 71.5% - 72.0% ] 71.88% | 128 | 75.4% |