Armenian vs English 3 or more Vehicles in Household
COMPARE
Armenian
English
3 or more Vehicles in Household
3 or more Vehicles in Household Comparison
Armenians
English
19.8%
3 OR MORE VEHICLES IN HOUSEHOLD
68.8/ 100
METRIC RATING
158th/ 347
METRIC RANK
23.1%
3 OR MORE VEHICLES IN HOUSEHOLD
100.0/ 100
METRIC RATING
31st/ 347
METRIC RANK
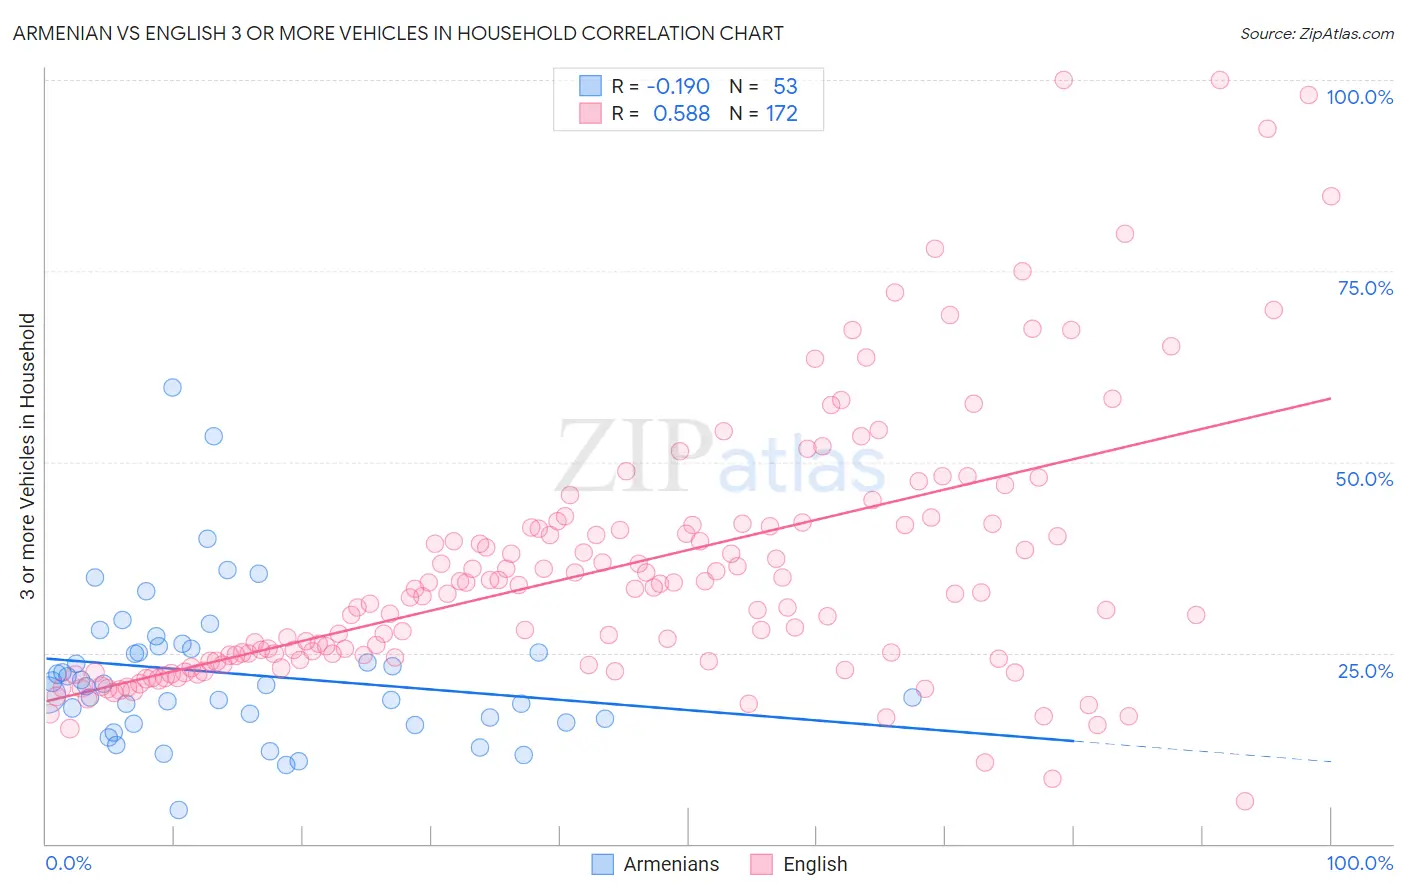
Armenian vs English 3 or more Vehicles in Household Correlation Chart
The statistical analysis conducted on geographies consisting of 310,710,692 people shows a poor negative correlation between the proportion of Armenians and percentage of households with 3 or more vehicles available in the United States with a correlation coefficient (R) of -0.190 and weighted average of 19.8%. Similarly, the statistical analysis conducted on geographies consisting of 578,919,458 people shows a substantial positive correlation between the proportion of English and percentage of households with 3 or more vehicles available in the United States with a correlation coefficient (R) of 0.588 and weighted average of 23.1%, a difference of 16.5%.
3 or more Vehicles in Household Correlation Summary
| Measurement | Armenian | English |
| Minimum | 4.4% | 5.6% |
| Maximum | 59.7% | 100.0% |
| Range | 55.3% | 94.4% |
| Mean | 22.3% | 36.0% |
| Median | 20.7% | 32.8% |
| Interquartile 25% (IQ1) | 16.1% | 23.9% |
| Interquartile 75% (IQ3) | 25.7% | 41.7% |
| Interquartile Range (IQR) | 9.6% | 17.7% |
| Standard Deviation (Sample) | 9.9% | 17.5% |
| Standard Deviation (Population) | 9.8% | 17.5% |
Similar Demographics by 3 or more Vehicles in Household
Demographics Similar to Armenians by 3 or more Vehicles in Household
In terms of 3 or more vehicles in household, the demographic groups most similar to Armenians are Immigrants from Pakistan (19.8%, a difference of 0.050%), Immigrants from Lebanon (19.8%, a difference of 0.11%), Hungarian (19.8%, a difference of 0.15%), Thai (19.8%, a difference of 0.20%), and Immigrants from Guatemala (19.7%, a difference of 0.27%).
| Demographics | Rating | Rank | 3 or more Vehicles in Household |
| Taiwanese | 80.6 /100 | #151 | Excellent 20.0% |
| Lebanese | 79.8 /100 | #152 | Good 20.0% |
| Yuman | 75.6 /100 | #153 | Good 19.9% |
| Immigrants | Jordan | 75.0 /100 | #154 | Good 19.9% |
| Tlingit-Haida | 73.4 /100 | #155 | Good 19.9% |
| Thais | 71.1 /100 | #156 | Good 19.8% |
| Hungarians | 70.5 /100 | #157 | Good 19.8% |
| Armenians | 68.8 /100 | #158 | Good 19.8% |
| Immigrants | Pakistan | 68.2 /100 | #159 | Good 19.8% |
| Immigrants | Lebanon | 67.6 /100 | #160 | Good 19.8% |
| Immigrants | Guatemala | 65.6 /100 | #161 | Good 19.7% |
| Estonians | 63.2 /100 | #162 | Good 19.7% |
| Chileans | 63.0 /100 | #163 | Good 19.7% |
| Yugoslavians | 62.9 /100 | #164 | Good 19.7% |
| Immigrants | Costa Rica | 61.9 /100 | #165 | Good 19.7% |
Demographics Similar to English by 3 or more Vehicles in Household
In terms of 3 or more vehicles in household, the demographic groups most similar to English are Pueblo (23.0%, a difference of 0.090%), Spanish American (23.0%, a difference of 0.15%), Immigrants from South Eastern Asia (23.1%, a difference of 0.19%), Swiss (23.0%, a difference of 0.20%), and Choctaw (23.0%, a difference of 0.22%).
| Demographics | Rating | Rank | 3 or more Vehicles in Household |
| Sri Lankans | 100.0 /100 | #24 | Exceptional 23.6% |
| Immigrants | Central America | 100.0 /100 | #25 | Exceptional 23.4% |
| Mexican American Indians | 100.0 /100 | #26 | Exceptional 23.3% |
| Guamanians/Chamorros | 100.0 /100 | #27 | Exceptional 23.2% |
| Lumbee | 100.0 /100 | #28 | Exceptional 23.1% |
| Spanish | 100.0 /100 | #29 | Exceptional 23.1% |
| Immigrants | South Eastern Asia | 100.0 /100 | #30 | Exceptional 23.1% |
| English | 100.0 /100 | #31 | Exceptional 23.1% |
| Pueblo | 100.0 /100 | #32 | Exceptional 23.0% |
| Spanish Americans | 100.0 /100 | #33 | Exceptional 23.0% |
| Swiss | 100.0 /100 | #34 | Exceptional 23.0% |
| Choctaw | 100.0 /100 | #35 | Exceptional 23.0% |
| Cherokee | 100.0 /100 | #36 | Exceptional 23.0% |
| Swedes | 100.0 /100 | #37 | Exceptional 23.0% |
| Dutch | 100.0 /100 | #38 | Exceptional 22.9% |