Armenian Disability Age Under 5
COMPARE
Armenian
Select to Compare
Disability Age Under 5
Armenian Disability Age Under 5
1.0%
DISABILITY | AGE UNDER 5
99.9/ 100
METRIC RATING
31st/ 347
METRIC RANK
Armenian Disability Age Under 5 Correlation Chart
The statistical analysis conducted on geographies consisting of 178,674,366 people shows a substantial positive correlation between the proportion of Armenians and percentage of population with a disability under the age of 5 in the United States with a correlation coefficient (R) of 0.523 and weighted average of 1.0%. On average, for every 1% (one percent) increase in Armenians within a typical geography, there is an increase of 0.35% in percentage of population with a disability under the age of 5.
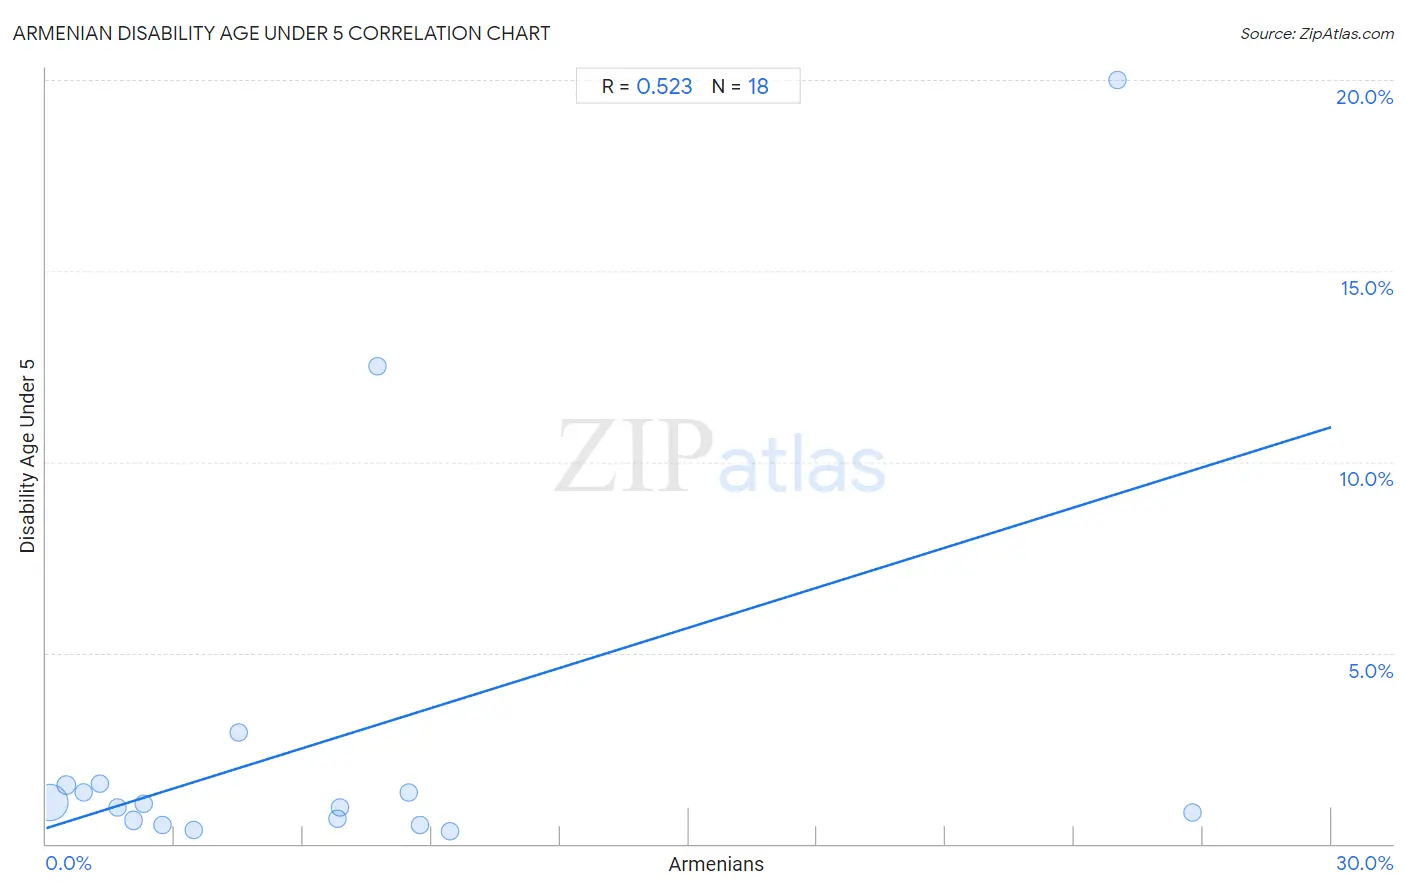
It is essential to understand that the correlation between the percentage of Armenians and percentage of population with a disability under the age of 5 does not imply a direct cause-and-effect relationship. It remains uncertain whether the presence of Armenians influences an upward or downward trend in the level of percentage of population with a disability under the age of 5 within an area, or if Armenians simply ended up residing in those areas with higher or lower levels of percentage of population with a disability under the age of 5 due to other factors.
Demographics Similar to Armenians by Disability Age Under 5
In terms of disability age under 5, the demographic groups most similar to Armenians are Iranian (1.0%, a difference of 0.050%), Bolivian (1.0%, a difference of 0.22%), Immigrants from South Central Asia (1.0%, a difference of 0.28%), Immigrants from Ukraine (1.0%, a difference of 0.34%), and Barbadian (1.0%, a difference of 0.58%).
| Demographics | Rating | Rank | Disability Age Under 5 |
| Indians (Asian) | 100.0 /100 | #24 | Exceptional 1.0% |
| Immigrants from Micronesia | 100.0 /100 | #25 | Exceptional 1.0% |
| Immigrants from Taiwan | 100.0 /100 | #26 | Exceptional 1.0% |
| Guyanese | 100.0 /100 | #27 | Exceptional 1.0% |
| Immigrants from Eastern Asia | 100.0 /100 | #28 | Exceptional 1.0% |
| Immigrants from Belarus | 100.0 /100 | #29 | Exceptional 1.0% |
| Immigrants from South Central Asia | 99.9 /100 | #30 | Exceptional 1.0% |
| Armenians | 99.9 /100 | #31 | Exceptional 1.0% |
| Iranians | 99.9 /100 | #32 | Exceptional 1.0% |
| Bolivians | 99.9 /100 | #33 | Exceptional 1.0% |
| Immigrants from Ukraine | 99.9 /100 | #34 | Exceptional 1.0% |
| Barbadians | 99.9 /100 | #35 | Exceptional 1.0% |
| Immigrants from Nepal | 99.9 /100 | #36 | Exceptional 1.0% |
| Immigrants from India | 99.9 /100 | #37 | Exceptional 1.0% |
| Immigrants from Guyana | 99.9 /100 | #38 | Exceptional 1.0% |
Armenian Disability Age Under 5 Correlation Summary
| Measurement | Armenian Data | Disability Age Under 5 Data |
| Minimum | 0.087% | 0.31% |
| Maximum | 26.8% | 20.0% |
| Range | 26.7% | 19.7% |
| Mean | 6.6% | 2.7% |
| Median | 4.0% | 1.0% |
| Interquartile 25% (IQ1) | 1.7% | 0.61% |
| Interquartile 75% (IQ3) | 8.5% | 1.5% |
| Interquartile Range (IQR) | 6.8% | 0.92% |
| Standard Deviation (Sample) | 7.7% | 5.1% |
| Standard Deviation (Population) | 7.4% | 5.0% |
Correlation Details
| Armenian Percentile | Sample Size | Disability Age Under 5 |
[ 0.0% - 0.5% ] 0.087% | 160,546,147 | 1.1% |
[ 0.0% - 0.5% ] 0.47% | 9,786,050 | 1.5% |
[ 0.5% - 1.0% ] 0.86% | 1,705,166 | 1.3% |
[ 1.0% - 1.5% ] 1.24% | 1,348,215 | 1.6% |
[ 1.5% - 2.0% ] 1.67% | 240,177 | 0.95% |
[ 2.0% - 2.5% ] 2.03% | 4,101,066 | 0.61% |
[ 2.0% - 2.5% ] 2.26% | 302,093 | 1.1% |
[ 2.5% - 3.0% ] 2.72% | 252,075 | 0.49% |
[ 3.0% - 3.5% ] 3.45% | 102,586 | 0.36% |
[ 4.0% - 4.5% ] 4.49% | 39,963 | 2.9% |
[ 6.5% - 7.0% ] 6.81% | 55,451 | 0.67% |
[ 6.5% - 7.0% ] 6.86% | 42,719 | 0.95% |
[ 7.5% - 8.0% ] 7.73% | 233 | 12.5% |
[ 8.0% - 8.5% ] 8.47% | 35,918 | 1.3% |
[ 8.5% - 9.0% ] 8.74% | 45,764 | 0.49% |
[ 9.0% - 9.5% ] 9.41% | 43,552 | 0.31% |
[ 25.0% - 25.5% ] 25.00% | 72 | 20.0% |
[ 26.5% - 27.0% ] 26.76% | 27,119 | 0.83% |