Armenian vs Immigrants from Yemen 3 or more Vehicles in Household
COMPARE
Armenian
Immigrants from Yemen
3 or more Vehicles in Household
3 or more Vehicles in Household Comparison
Armenians
Immigrants from Yemen
19.8%
3 OR MORE VEHICLES IN HOUSEHOLD
68.8/ 100
METRIC RATING
158th/ 347
METRIC RANK
14.2%
3 OR MORE VEHICLES IN HOUSEHOLD
0.0/ 100
METRIC RATING
324th/ 347
METRIC RANK
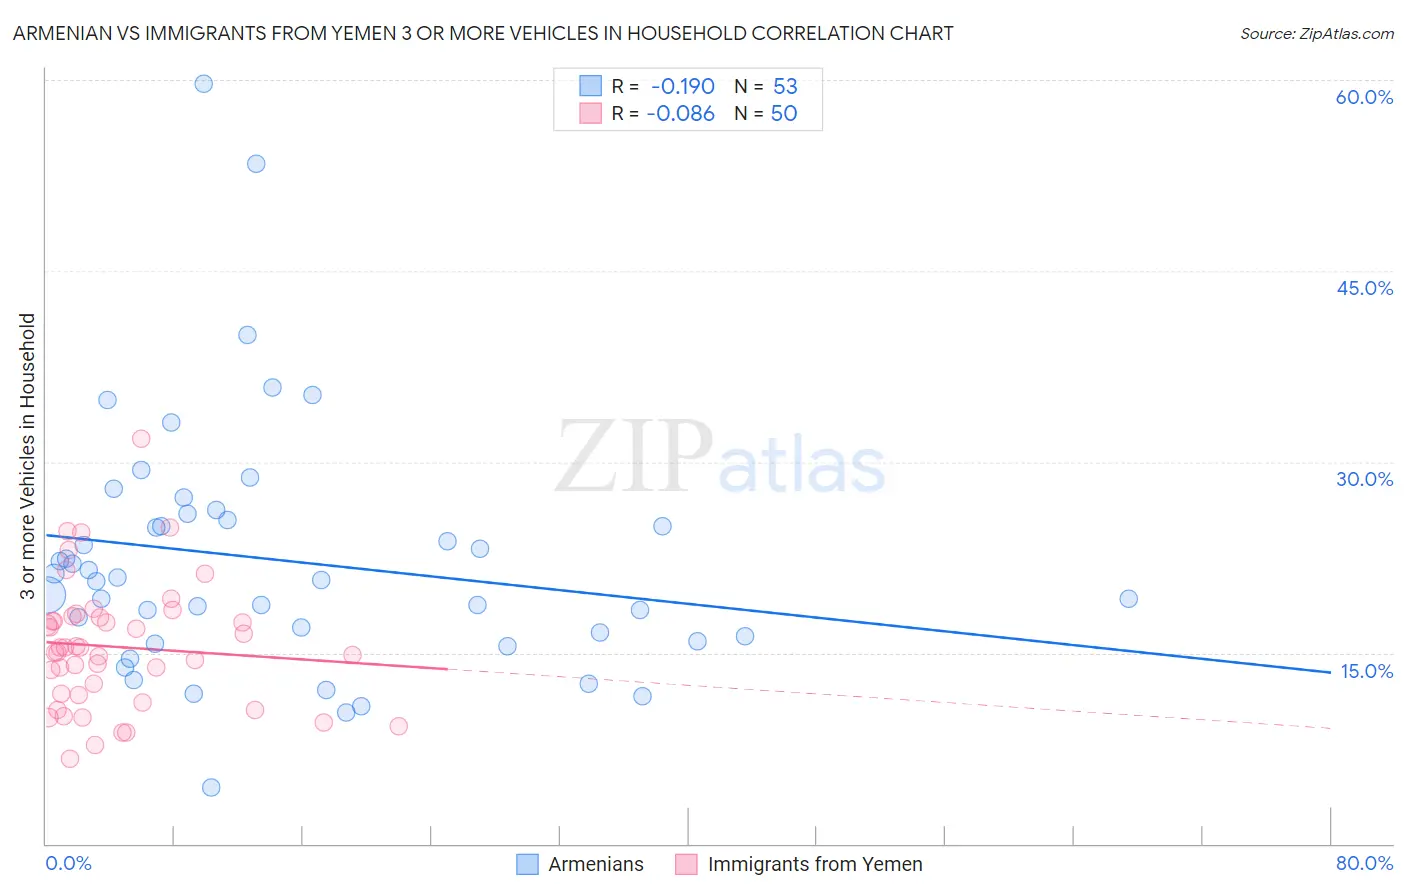
Armenian vs Immigrants from Yemen 3 or more Vehicles in Household Correlation Chart
The statistical analysis conducted on geographies consisting of 310,710,692 people shows a poor negative correlation between the proportion of Armenians and percentage of households with 3 or more vehicles available in the United States with a correlation coefficient (R) of -0.190 and weighted average of 19.8%. Similarly, the statistical analysis conducted on geographies consisting of 82,431,124 people shows a slight negative correlation between the proportion of Immigrants from Yemen and percentage of households with 3 or more vehicles available in the United States with a correlation coefficient (R) of -0.086 and weighted average of 14.2%, a difference of 39.0%.
3 or more Vehicles in Household Correlation Summary
| Measurement | Armenian | Immigrants from Yemen |
| Minimum | 4.4% | 6.7% |
| Maximum | 59.7% | 31.8% |
| Range | 55.3% | 25.1% |
| Mean | 22.3% | 15.5% |
| Median | 20.7% | 15.2% |
| Interquartile 25% (IQ1) | 16.1% | 11.6% |
| Interquartile 75% (IQ3) | 25.7% | 17.8% |
| Interquartile Range (IQR) | 9.6% | 6.1% |
| Standard Deviation (Sample) | 9.9% | 5.0% |
| Standard Deviation (Population) | 9.8% | 5.0% |
Similar Demographics by 3 or more Vehicles in Household
Demographics Similar to Armenians by 3 or more Vehicles in Household
In terms of 3 or more vehicles in household, the demographic groups most similar to Armenians are Immigrants from Pakistan (19.8%, a difference of 0.050%), Immigrants from Lebanon (19.8%, a difference of 0.11%), Hungarian (19.8%, a difference of 0.15%), Thai (19.8%, a difference of 0.20%), and Immigrants from Guatemala (19.7%, a difference of 0.27%).
| Demographics | Rating | Rank | 3 or more Vehicles in Household |
| Taiwanese | 80.6 /100 | #151 | Excellent 20.0% |
| Lebanese | 79.8 /100 | #152 | Good 20.0% |
| Yuman | 75.6 /100 | #153 | Good 19.9% |
| Immigrants | Jordan | 75.0 /100 | #154 | Good 19.9% |
| Tlingit-Haida | 73.4 /100 | #155 | Good 19.9% |
| Thais | 71.1 /100 | #156 | Good 19.8% |
| Hungarians | 70.5 /100 | #157 | Good 19.8% |
| Armenians | 68.8 /100 | #158 | Good 19.8% |
| Immigrants | Pakistan | 68.2 /100 | #159 | Good 19.8% |
| Immigrants | Lebanon | 67.6 /100 | #160 | Good 19.8% |
| Immigrants | Guatemala | 65.6 /100 | #161 | Good 19.7% |
| Estonians | 63.2 /100 | #162 | Good 19.7% |
| Chileans | 63.0 /100 | #163 | Good 19.7% |
| Yugoslavians | 62.9 /100 | #164 | Good 19.7% |
| Immigrants | Costa Rica | 61.9 /100 | #165 | Good 19.7% |
Demographics Similar to Immigrants from Yemen by 3 or more Vehicles in Household
In terms of 3 or more vehicles in household, the demographic groups most similar to Immigrants from Yemen are Senegalese (14.2%, a difference of 0.080%), Soviet Union (14.2%, a difference of 0.41%), Ecuadorian (14.1%, a difference of 1.3%), Immigrants from Albania (14.0%, a difference of 2.0%), and Immigrants from Caribbean (14.6%, a difference of 2.3%).
| Demographics | Rating | Rank | 3 or more Vehicles in Household |
| Jamaicans | 0.0 /100 | #317 | Tragic 15.2% |
| Immigrants | Haiti | 0.0 /100 | #318 | Tragic 15.2% |
| Cape Verdeans | 0.0 /100 | #319 | Tragic 15.0% |
| Yup'ik | 0.0 /100 | #320 | Tragic 14.8% |
| Immigrants | Jamaica | 0.0 /100 | #321 | Tragic 14.7% |
| Immigrants | West Indies | 0.0 /100 | #322 | Tragic 14.6% |
| Immigrants | Caribbean | 0.0 /100 | #323 | Tragic 14.6% |
| Immigrants | Yemen | 0.0 /100 | #324 | Tragic 14.2% |
| Senegalese | 0.0 /100 | #325 | Tragic 14.2% |
| Soviet Union | 0.0 /100 | #326 | Tragic 14.2% |
| Ecuadorians | 0.0 /100 | #327 | Tragic 14.1% |
| Immigrants | Albania | 0.0 /100 | #328 | Tragic 14.0% |
| Immigrants | Senegal | 0.0 /100 | #329 | Tragic 13.8% |
| West Indians | 0.0 /100 | #330 | Tragic 13.7% |
| Immigrants | Dominica | 0.0 /100 | #331 | Tragic 13.7% |