Armenian Disability Age 5 to 17
COMPARE
Armenian
Select to Compare
Disability Age 5 to 17
Armenian Disability Age 5 to 17
4.6%
DISABILITY | AGE 5 TO 17
100.0/ 100
METRIC RATING
11th/ 347
METRIC RANK
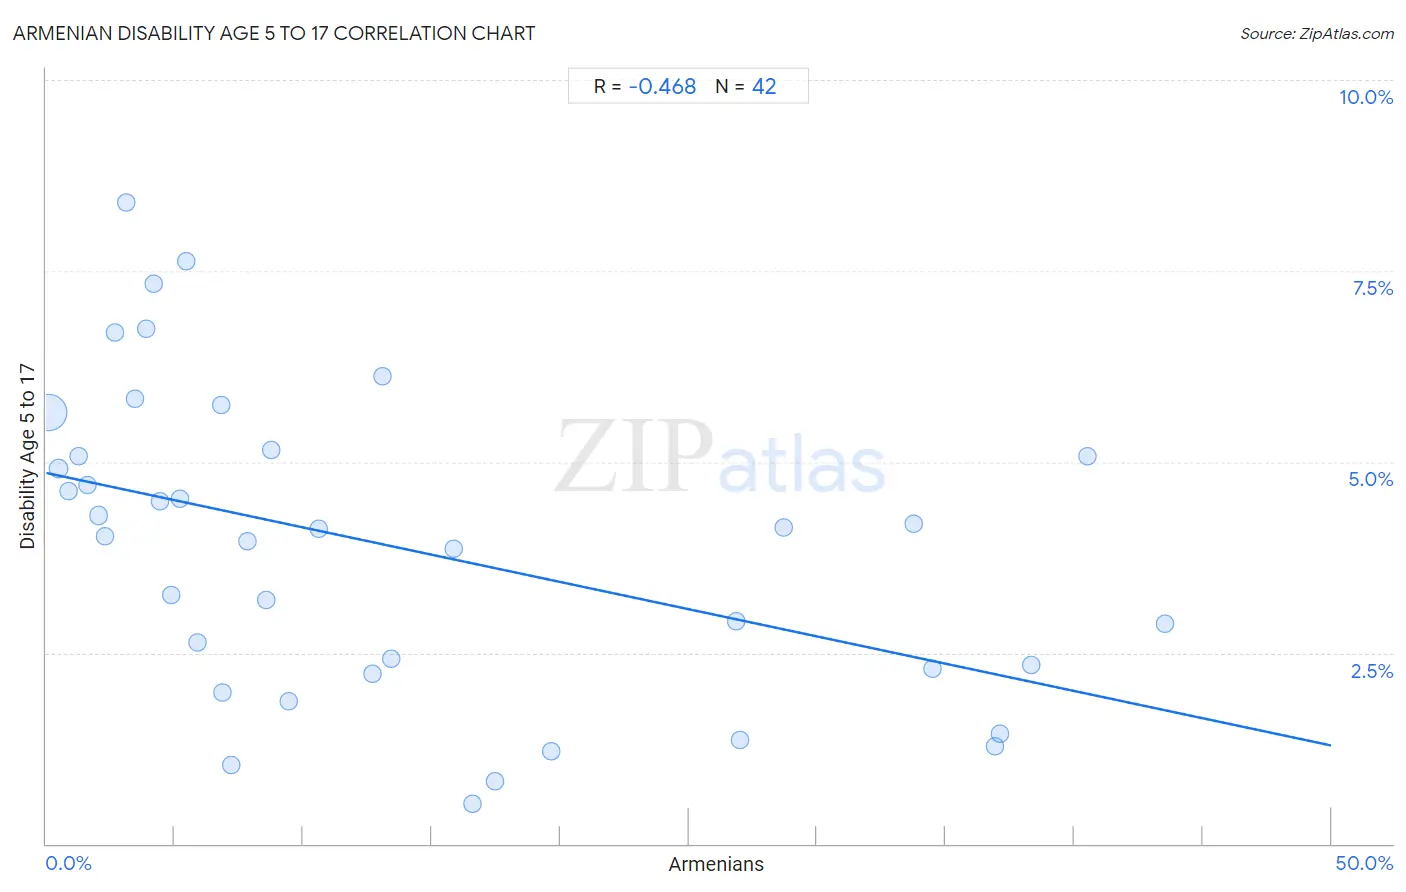
Armenian Disability Age 5 to 17 Correlation Chart
The statistical analysis conducted on geographies consisting of 308,701,051 people shows a moderate negative correlation between the proportion of Armenians and percentage of population with a disability between the ages 5 and 17 in the United States with a correlation coefficient (R) of -0.468 and weighted average of 4.6%. On average, for every 1% (one percent) increase in Armenians within a typical geography, there is a decrease of 0.071% in percentage of population with a disability between the ages 5 and 17.
It is essential to understand that the correlation between the percentage of Armenians and percentage of population with a disability between the ages 5 and 17 does not imply a direct cause-and-effect relationship. It remains uncertain whether the presence of Armenians influences an upward or downward trend in the level of percentage of population with a disability between the ages 5 and 17 within an area, or if Armenians simply ended up residing in those areas with higher or lower levels of percentage of population with a disability between the ages 5 and 17 due to other factors.
Demographics Similar to Armenians by Disability Age 5 to 17
In terms of disability age 5 to 17, the demographic groups most similar to Armenians are Immigrants from India (4.6%, a difference of 0.16%), Immigrants from Eastern Asia (4.6%, a difference of 0.23%), Iranian (4.6%, a difference of 0.24%), Indian (Asian) (4.6%, a difference of 0.56%), and Thai (4.7%, a difference of 1.3%).
| Demographics | Rating | Rank | Disability Age 5 to 17 |
| Filipinos | 100.0 /100 | #4 | Exceptional 4.3% |
| Immigrants from Iran | 100.0 /100 | #5 | Exceptional 4.4% |
| Immigrants from Israel | 100.0 /100 | #6 | Exceptional 4.5% |
| Immigrants from China | 100.0 /100 | #7 | Exceptional 4.5% |
| Indians (Asian) | 100.0 /100 | #8 | Exceptional 4.6% |
| Immigrants from Eastern Asia | 100.0 /100 | #9 | Exceptional 4.6% |
| Immigrants from India | 100.0 /100 | #10 | Exceptional 4.6% |
| Armenians | 100.0 /100 | #11 | Exceptional 4.6% |
| Iranians | 100.0 /100 | #12 | Exceptional 4.6% |
| Thais | 100.0 /100 | #13 | Exceptional 4.7% |
| Immigrants from Korea | 100.0 /100 | #14 | Exceptional 4.7% |
| Chinese | 100.0 /100 | #15 | Exceptional 4.7% |
| Immigrants from Singapore | 100.0 /100 | #16 | Exceptional 4.7% |
| Arapaho | 100.0 /100 | #17 | Exceptional 4.7% |
| Immigrants from South Central Asia | 100.0 /100 | #18 | Exceptional 4.7% |
Armenian Disability Age 5 to 17 Correlation Summary
| Measurement | Armenian Data | Disability Age 5 to 17 Data |
| Minimum | 0.097% | 0.52% |
| Maximum | 43.5% | 8.4% |
| Range | 43.4% | 7.9% |
| Mean | 13.7% | 3.9% |
| Median | 8.2% | 4.1% |
| Interquartile 25% (IQ1) | 3.9% | 2.3% |
| Interquartile 75% (IQ3) | 19.6% | 5.1% |
| Interquartile Range (IQR) | 15.7% | 2.8% |
| Standard Deviation (Sample) | 13.1% | 2.0% |
| Standard Deviation (Population) | 12.9% | 2.0% |
Correlation Details
| Armenian Percentile | Sample Size | Disability Age 5 to 17 |
[ 0.0% - 0.5% ] 0.097% | 269,215,623 | 5.7% |
[ 0.0% - 0.5% ] 0.49% | 23,115,362 | 4.9% |
[ 0.5% - 1.0% ] 0.87% | 5,131,994 | 4.6% |
[ 1.0% - 1.5% ] 1.24% | 2,820,870 | 5.1% |
[ 1.5% - 2.0% ] 1.62% | 783,104 | 4.7% |
[ 2.0% - 2.5% ] 2.02% | 4,823,039 | 4.3% |
[ 2.0% - 2.5% ] 2.30% | 502,518 | 4.0% |
[ 2.5% - 3.0% ] 2.68% | 499,144 | 6.7% |
[ 3.0% - 3.5% ] 3.13% | 107,698 | 8.4% |
[ 3.0% - 3.5% ] 3.45% | 245,500 | 5.8% |
[ 3.5% - 4.0% ] 3.91% | 19,100 | 6.7% |
[ 4.0% - 4.5% ] 4.18% | 65,470 | 7.3% |
[ 4.0% - 4.5% ] 4.45% | 102,611 | 4.5% |
[ 4.5% - 5.0% ] 4.88% | 28,963 | 3.3% |
[ 5.0% - 5.5% ] 5.22% | 89,032 | 4.5% |
[ 5.0% - 5.5% ] 5.45% | 106,018 | 7.6% |
[ 5.5% - 6.0% ] 5.90% | 85,809 | 2.6% |
[ 6.5% - 7.0% ] 6.80% | 60,345 | 5.8% |
[ 6.5% - 7.0% ] 6.86% | 44,244 | 2.0% |
[ 7.0% - 7.5% ] 7.19% | 20,092 | 1.0% |
[ 7.5% - 8.0% ] 7.84% | 2,718 | 4.0% |
[ 8.5% - 9.0% ] 8.54% | 72,421 | 3.2% |
[ 8.5% - 9.0% ] 8.76% | 145,227 | 5.2% |
[ 9.0% - 9.5% ] 9.41% | 43,552 | 1.9% |
[ 10.5% - 11.0% ] 10.62% | 51,654 | 4.1% |
[ 12.5% - 13.0% ] 12.69% | 32,827 | 2.2% |
[ 13.0% - 13.5% ] 13.08% | 650 | 6.1% |
[ 13.0% - 13.5% ] 13.41% | 27,479 | 2.4% |
[ 15.5% - 16.0% ] 15.85% | 2,038 | 3.9% |
[ 16.5% - 17.0% ] 16.58% | 20,911 | 0.52% |
[ 17.0% - 17.5% ] 17.45% | 7,509 | 0.81% |
[ 19.5% - 20.0% ] 19.65% | 12,312 | 1.2% |
[ 26.5% - 27.0% ] 26.83% | 45,564 | 2.9% |
[ 26.5% - 27.0% ] 26.98% | 15,377 | 1.4% |
[ 28.5% - 29.0% ] 28.71% | 18,951 | 4.1% |
[ 33.5% - 34.0% ] 33.78% | 16,679 | 4.2% |
[ 34.5% - 35.0% ] 34.51% | 194,512 | 2.3% |
[ 36.5% - 37.0% ] 36.93% | 32,294 | 1.3% |
[ 37.0% - 37.5% ] 37.12% | 35,755 | 1.4% |
[ 38.0% - 38.5% ] 38.33% | 11,091 | 2.3% |
[ 40.5% - 41.0% ] 40.51% | 22,831 | 5.1% |
[ 43.5% - 44.0% ] 43.52% | 22,163 | 2.9% |