Armenian vs Immigrants from France 3 or more Vehicles in Household
COMPARE
Armenian
Immigrants from France
3 or more Vehicles in Household
3 or more Vehicles in Household Comparison
Armenians
Immigrants from France
19.8%
3 OR MORE VEHICLES IN HOUSEHOLD
68.8/ 100
METRIC RATING
158th/ 347
METRIC RANK
17.6%
3 OR MORE VEHICLES IN HOUSEHOLD
0.6/ 100
METRIC RATING
269th/ 347
METRIC RANK
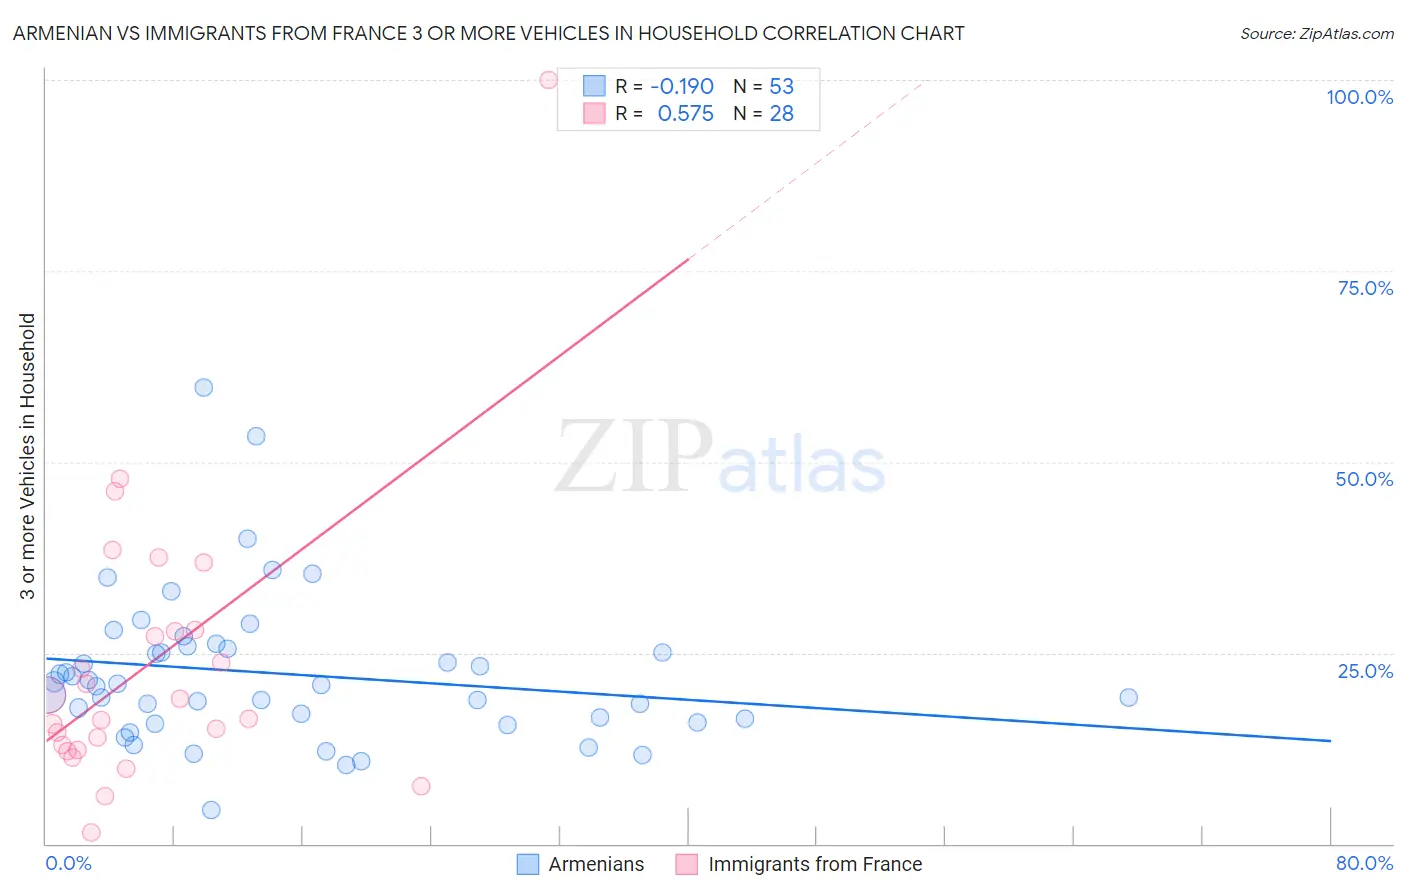
Armenian vs Immigrants from France 3 or more Vehicles in Household Correlation Chart
The statistical analysis conducted on geographies consisting of 310,710,692 people shows a poor negative correlation between the proportion of Armenians and percentage of households with 3 or more vehicles available in the United States with a correlation coefficient (R) of -0.190 and weighted average of 19.8%. Similarly, the statistical analysis conducted on geographies consisting of 287,763,737 people shows a substantial positive correlation between the proportion of Immigrants from France and percentage of households with 3 or more vehicles available in the United States with a correlation coefficient (R) of 0.575 and weighted average of 17.6%, a difference of 12.2%.
3 or more Vehicles in Household Correlation Summary
| Measurement | Armenian | Immigrants from France |
| Minimum | 4.4% | 1.5% |
| Maximum | 59.7% | 100.0% |
| Range | 55.3% | 98.5% |
| Mean | 22.3% | 23.6% |
| Median | 20.7% | 17.7% |
| Interquartile 25% (IQ1) | 16.1% | 12.6% |
| Interquartile 75% (IQ3) | 25.7% | 27.9% |
| Interquartile Range (IQR) | 9.6% | 15.4% |
| Standard Deviation (Sample) | 9.9% | 19.1% |
| Standard Deviation (Population) | 9.8% | 18.7% |
Similar Demographics by 3 or more Vehicles in Household
Demographics Similar to Armenians by 3 or more Vehicles in Household
In terms of 3 or more vehicles in household, the demographic groups most similar to Armenians are Immigrants from Pakistan (19.8%, a difference of 0.050%), Immigrants from Lebanon (19.8%, a difference of 0.11%), Hungarian (19.8%, a difference of 0.15%), Thai (19.8%, a difference of 0.20%), and Immigrants from Guatemala (19.7%, a difference of 0.27%).
| Demographics | Rating | Rank | 3 or more Vehicles in Household |
| Taiwanese | 80.6 /100 | #151 | Excellent 20.0% |
| Lebanese | 79.8 /100 | #152 | Good 20.0% |
| Yuman | 75.6 /100 | #153 | Good 19.9% |
| Immigrants | Jordan | 75.0 /100 | #154 | Good 19.9% |
| Tlingit-Haida | 73.4 /100 | #155 | Good 19.9% |
| Thais | 71.1 /100 | #156 | Good 19.8% |
| Hungarians | 70.5 /100 | #157 | Good 19.8% |
| Armenians | 68.8 /100 | #158 | Good 19.8% |
| Immigrants | Pakistan | 68.2 /100 | #159 | Good 19.8% |
| Immigrants | Lebanon | 67.6 /100 | #160 | Good 19.8% |
| Immigrants | Guatemala | 65.6 /100 | #161 | Good 19.7% |
| Estonians | 63.2 /100 | #162 | Good 19.7% |
| Chileans | 63.0 /100 | #163 | Good 19.7% |
| Yugoslavians | 62.9 /100 | #164 | Good 19.7% |
| Immigrants | Costa Rica | 61.9 /100 | #165 | Good 19.7% |
Demographics Similar to Immigrants from France by 3 or more Vehicles in Household
In terms of 3 or more vehicles in household, the demographic groups most similar to Immigrants from France are Immigrants from Nepal (17.6%, a difference of 0.050%), South American (17.6%, a difference of 0.050%), Immigrants from Bulgaria (17.7%, a difference of 0.42%), Immigrants from Venezuela (17.7%, a difference of 0.44%), and Immigrants from Africa (17.6%, a difference of 0.46%).
| Demographics | Rating | Rank | 3 or more Vehicles in Household |
| Colombians | 0.9 /100 | #262 | Tragic 17.8% |
| Bermudans | 0.9 /100 | #263 | Tragic 17.8% |
| Cambodians | 0.9 /100 | #264 | Tragic 17.8% |
| Immigrants | Panama | 0.8 /100 | #265 | Tragic 17.7% |
| Macedonians | 0.8 /100 | #266 | Tragic 17.7% |
| Immigrants | Venezuela | 0.8 /100 | #267 | Tragic 17.7% |
| Immigrants | Bulgaria | 0.8 /100 | #268 | Tragic 17.7% |
| Immigrants | France | 0.6 /100 | #269 | Tragic 17.6% |
| Immigrants | Nepal | 0.6 /100 | #270 | Tragic 17.6% |
| South Americans | 0.6 /100 | #271 | Tragic 17.6% |
| Immigrants | Africa | 0.5 /100 | #272 | Tragic 17.6% |
| Immigrants | Sudan | 0.5 /100 | #273 | Tragic 17.6% |
| Immigrants | Bosnia and Herzegovina | 0.5 /100 | #274 | Tragic 17.5% |
| Immigrants | Ukraine | 0.4 /100 | #275 | Tragic 17.5% |
| Okinawans | 0.4 /100 | #276 | Tragic 17.4% |