Armenian vs Immigrants from Nicaragua 3 or more Vehicles in Household
COMPARE
Armenian
Immigrants from Nicaragua
3 or more Vehicles in Household
3 or more Vehicles in Household Comparison
Armenians
Immigrants from Nicaragua
19.8%
3 OR MORE VEHICLES IN HOUSEHOLD
68.8/ 100
METRIC RATING
158th/ 347
METRIC RANK
20.2%
3 OR MORE VEHICLES IN HOUSEHOLD
87.1/ 100
METRIC RATING
136th/ 347
METRIC RANK
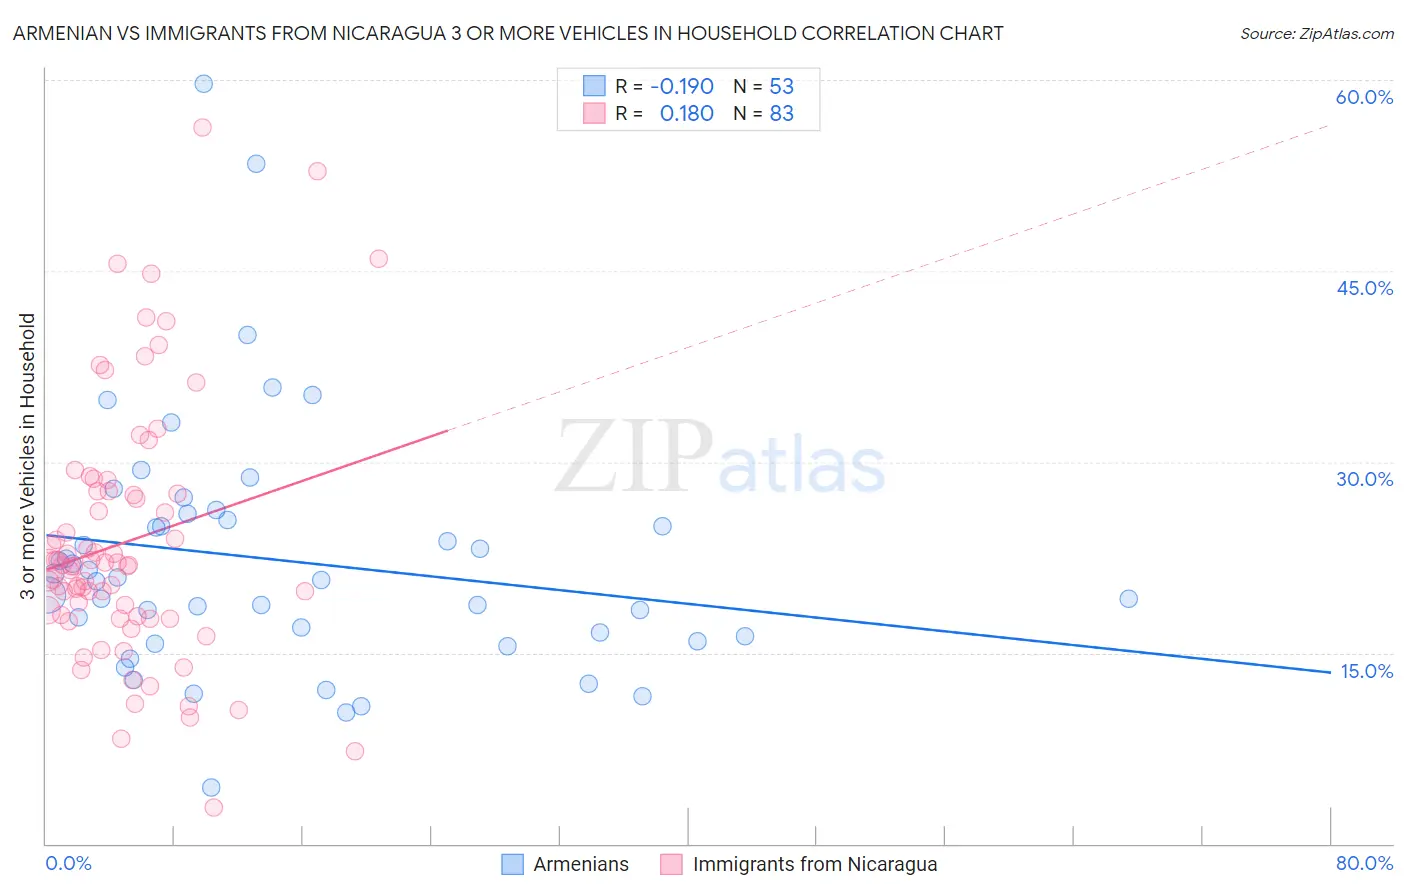
Armenian vs Immigrants from Nicaragua 3 or more Vehicles in Household Correlation Chart
The statistical analysis conducted on geographies consisting of 310,710,692 people shows a poor negative correlation between the proportion of Armenians and percentage of households with 3 or more vehicles available in the United States with a correlation coefficient (R) of -0.190 and weighted average of 19.8%. Similarly, the statistical analysis conducted on geographies consisting of 236,311,792 people shows a poor positive correlation between the proportion of Immigrants from Nicaragua and percentage of households with 3 or more vehicles available in the United States with a correlation coefficient (R) of 0.180 and weighted average of 20.2%, a difference of 2.1%.
3 or more Vehicles in Household Correlation Summary
| Measurement | Armenian | Immigrants from Nicaragua |
| Minimum | 4.4% | 2.8% |
| Maximum | 59.7% | 56.2% |
| Range | 55.3% | 53.4% |
| Mean | 22.3% | 23.7% |
| Median | 20.7% | 21.9% |
| Interquartile 25% (IQ1) | 16.1% | 17.9% |
| Interquartile 75% (IQ3) | 25.7% | 27.6% |
| Interquartile Range (IQR) | 9.6% | 9.8% |
| Standard Deviation (Sample) | 9.9% | 10.0% |
| Standard Deviation (Population) | 9.8% | 9.9% |
Similar Demographics by 3 or more Vehicles in Household
Demographics Similar to Armenians by 3 or more Vehicles in Household
In terms of 3 or more vehicles in household, the demographic groups most similar to Armenians are Immigrants from Pakistan (19.8%, a difference of 0.050%), Immigrants from Lebanon (19.8%, a difference of 0.11%), Hungarian (19.8%, a difference of 0.15%), Thai (19.8%, a difference of 0.20%), and Immigrants from Guatemala (19.7%, a difference of 0.27%).
| Demographics | Rating | Rank | 3 or more Vehicles in Household |
| Taiwanese | 80.6 /100 | #151 | Excellent 20.0% |
| Lebanese | 79.8 /100 | #152 | Good 20.0% |
| Yuman | 75.6 /100 | #153 | Good 19.9% |
| Immigrants | Jordan | 75.0 /100 | #154 | Good 19.9% |
| Tlingit-Haida | 73.4 /100 | #155 | Good 19.9% |
| Thais | 71.1 /100 | #156 | Good 19.8% |
| Hungarians | 70.5 /100 | #157 | Good 19.8% |
| Armenians | 68.8 /100 | #158 | Good 19.8% |
| Immigrants | Pakistan | 68.2 /100 | #159 | Good 19.8% |
| Immigrants | Lebanon | 67.6 /100 | #160 | Good 19.8% |
| Immigrants | Guatemala | 65.6 /100 | #161 | Good 19.7% |
| Estonians | 63.2 /100 | #162 | Good 19.7% |
| Chileans | 63.0 /100 | #163 | Good 19.7% |
| Yugoslavians | 62.9 /100 | #164 | Good 19.7% |
| Immigrants | Costa Rica | 61.9 /100 | #165 | Good 19.7% |
Demographics Similar to Immigrants from Nicaragua by 3 or more Vehicles in Household
In terms of 3 or more vehicles in household, the demographic groups most similar to Immigrants from Nicaragua are Immigrants from Iraq (20.2%, a difference of 0.0%), Immigrants from India (20.2%, a difference of 0.010%), Polish (20.2%, a difference of 0.030%), Immigrants from Canada (20.2%, a difference of 0.12%), and Immigrants from North America (20.2%, a difference of 0.12%).
| Demographics | Rating | Rank | 3 or more Vehicles in Household |
| Zimbabweans | 88.7 /100 | #129 | Excellent 20.3% |
| Greeks | 88.6 /100 | #130 | Excellent 20.3% |
| Immigrants | Asia | 88.1 /100 | #131 | Excellent 20.2% |
| Immigrants | Canada | 87.8 /100 | #132 | Excellent 20.2% |
| Immigrants | North America | 87.8 /100 | #133 | Excellent 20.2% |
| Poles | 87.3 /100 | #134 | Excellent 20.2% |
| Immigrants | India | 87.2 /100 | #135 | Excellent 20.2% |
| Immigrants | Nicaragua | 87.1 /100 | #136 | Excellent 20.2% |
| Immigrants | Iraq | 87.1 /100 | #137 | Excellent 20.2% |
| Aleuts | 86.3 /100 | #138 | Excellent 20.2% |
| Slovenes | 85.5 /100 | #139 | Excellent 20.2% |
| French American Indians | 85.3 /100 | #140 | Excellent 20.1% |
| Ottawa | 84.9 /100 | #141 | Excellent 20.1% |
| Jordanians | 84.4 /100 | #142 | Excellent 20.1% |
| Lithuanians | 84.4 /100 | #143 | Excellent 20.1% |