Armenian Self-Care Disability
COMPARE
Armenian
Select to Compare
Self-Care Disability
Armenian Self-Care Disability
3.4%
SELF-CARE DISABILITY
0.0/ 100
METRIC RATING
345th/ 347
METRIC RANK
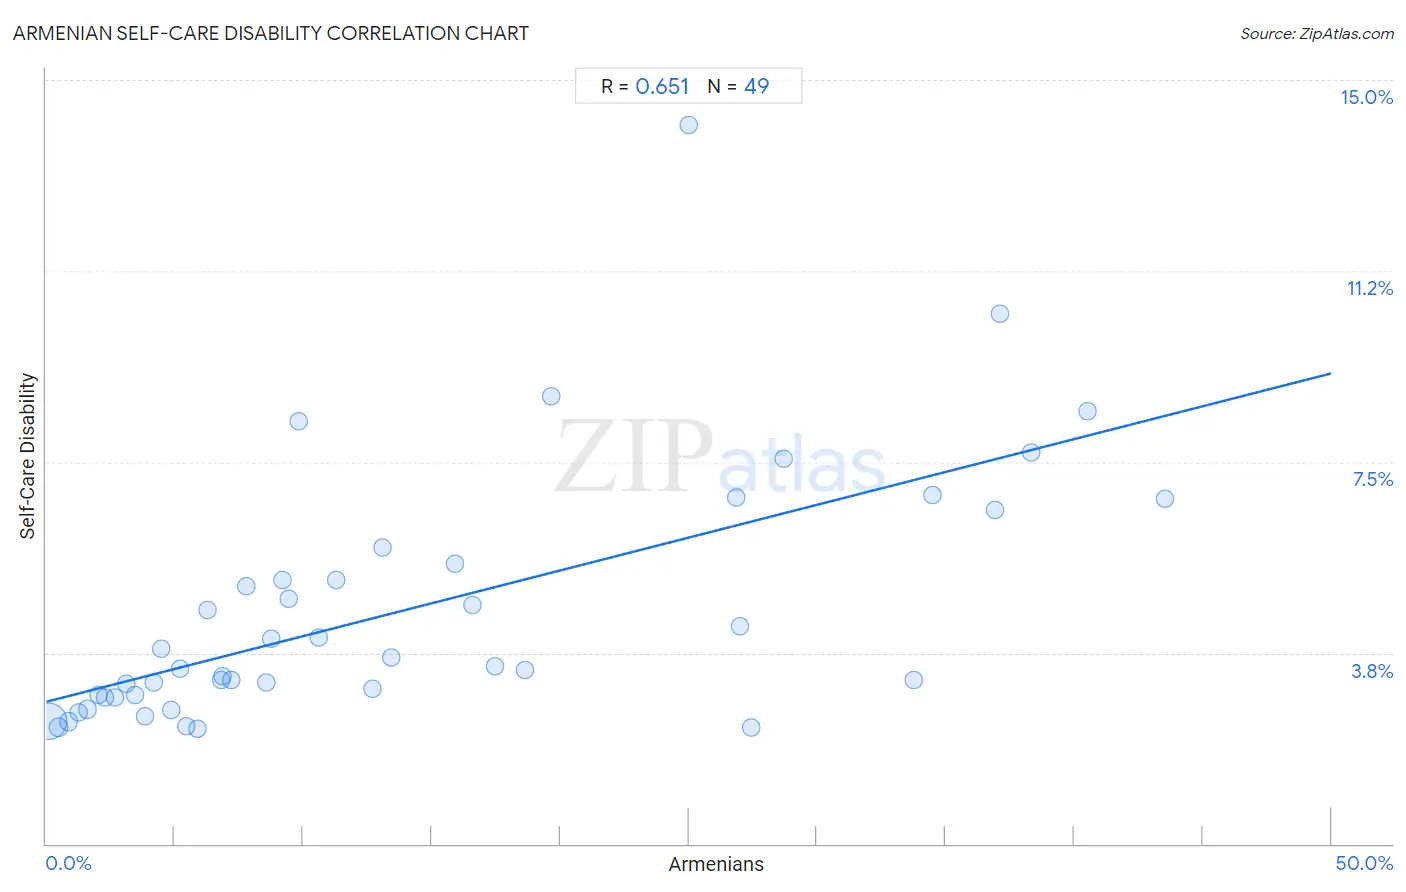
Armenian Self-Care Disability Correlation Chart
The statistical analysis conducted on geographies consisting of 310,650,762 people shows a significant positive correlation between the proportion of Armenians and percentage of population with self-care disability in the United States with a correlation coefficient (R) of 0.651 and weighted average of 3.4%. On average, for every 1% (one percent) increase in Armenians within a typical geography, there is an increase of 0.13% in percentage of population with self-care disability.
It is essential to understand that the correlation between the percentage of Armenians and percentage of population with self-care disability does not imply a direct cause-and-effect relationship. It remains uncertain whether the presence of Armenians influences an upward or downward trend in the level of percentage of population with self-care disability within an area, or if Armenians simply ended up residing in those areas with higher or lower levels of percentage of population with self-care disability due to other factors.
Demographics Similar to Armenians by Self-Care Disability
In terms of self-care disability, the demographic groups most similar to Armenians are Pueblo (3.3%, a difference of 4.5%), Puerto Rican (3.7%, a difference of 8.0%), Tohono O'odham (3.1%, a difference of 9.3%), Colville (3.1%, a difference of 9.4%), and Dominican (3.1%, a difference of 11.2%).
| Demographics | Rating | Rank | Self-Care Disability |
| Dutch West Indians | 0.0 /100 | #333 | Tragic 3.0% |
| Houma | 0.0 /100 | #334 | Tragic 3.0% |
| Immigrants from the Azores | 0.0 /100 | #335 | Tragic 3.0% |
| Immigrants from Yemen | 0.0 /100 | #336 | Tragic 3.0% |
| Choctaw | 0.0 /100 | #337 | Tragic 3.0% |
| Cape Verdeans | 0.0 /100 | #338 | Tragic 3.0% |
| Immigrants from Dominican Republic | 0.0 /100 | #339 | Tragic 3.0% |
| Immigrants from Cabo Verde | 0.0 /100 | #340 | Tragic 3.1% |
| Dominicans | 0.0 /100 | #341 | Tragic 3.1% |
| Colville | 0.0 /100 | #342 | Tragic 3.1% |
| Tohono O'odham | 0.0 /100 | #343 | Tragic 3.1% |
| Pueblo | 0.0 /100 | #344 | Tragic 3.3% |
| Armenians | 0.0 /100 | #345 | Tragic 3.4% |
| Puerto Ricans | 0.0 /100 | #346 | Tragic 3.7% |
| Immigrants from Armenia | 0.0 /100 | #347 | Tragic 4.2% |
Armenian Self-Care Disability Correlation Summary
| Measurement | Armenian Data | Self-Care Disability Data |
| Minimum | 0.098% | 2.3% |
| Maximum | 43.5% | 14.1% |
| Range | 43.4% | 11.8% |
| Mean | 13.9% | 4.6% |
| Median | 9.2% | 3.5% |
| Interquartile 25% (IQ1) | 4.3% | 2.9% |
| Interquartile 75% (IQ3) | 22.3% | 5.7% |
| Interquartile Range (IQR) | 18.0% | 2.8% |
| Standard Deviation (Sample) | 12.5% | 2.5% |
| Standard Deviation (Population) | 12.3% | 2.4% |
Correlation Details
| Armenian Percentile | Sample Size | Self-Care Disability |
[ 0.0% - 0.5% ] 0.098% | 270,179,562 | 2.4% |
[ 0.0% - 0.5% ] 0.49% | 23,617,099 | 2.3% |
[ 0.5% - 1.0% ] 0.87% | 5,339,885 | 2.4% |
[ 1.0% - 1.5% ] 1.24% | 2,925,111 | 2.6% |
[ 1.5% - 2.0% ] 1.62% | 847,676 | 2.6% |
[ 2.0% - 2.5% ] 2.02% | 4,859,141 | 2.9% |
[ 2.0% - 2.5% ] 2.30% | 513,842 | 2.9% |
[ 2.5% - 3.0% ] 2.68% | 504,746 | 2.9% |
[ 3.0% - 3.5% ] 3.12% | 111,744 | 3.1% |
[ 3.0% - 3.5% ] 3.45% | 257,790 | 2.9% |
[ 3.5% - 4.0% ] 3.83% | 26,366 | 2.5% |
[ 4.0% - 4.5% ] 4.18% | 69,133 | 3.2% |
[ 4.0% - 4.5% ] 4.45% | 111,423 | 3.8% |
[ 4.5% - 5.0% ] 4.87% | 30,308 | 2.6% |
[ 5.0% - 5.5% ] 5.22% | 90,468 | 3.4% |
[ 5.0% - 5.5% ] 5.46% | 109,458 | 2.3% |
[ 5.5% - 6.0% ] 5.90% | 88,797 | 2.3% |
[ 6.0% - 6.5% ] 6.27% | 829 | 4.6% |
[ 6.5% - 7.0% ] 6.80% | 60,345 | 3.2% |
[ 6.5% - 7.0% ] 6.86% | 44,244 | 3.3% |
[ 7.0% - 7.5% ] 7.19% | 20,092 | 3.2% |
[ 7.5% - 8.0% ] 7.76% | 7,344 | 5.1% |
[ 8.5% - 9.0% ] 8.54% | 72,421 | 3.2% |
[ 8.5% - 9.0% ] 8.76% | 145,227 | 4.0% |
[ 9.0% - 9.5% ] 9.19% | 468 | 5.2% |
[ 9.0% - 9.5% ] 9.41% | 43,552 | 4.8% |
[ 9.5% - 10.0% ] 9.82% | 947 | 8.3% |
[ 10.5% - 11.0% ] 10.62% | 51,654 | 4.1% |
[ 11.0% - 11.5% ] 11.28% | 133 | 5.2% |
[ 12.5% - 13.0% ] 12.69% | 32,827 | 3.0% |
[ 13.0% - 13.5% ] 13.08% | 650 | 5.8% |
[ 13.0% - 13.5% ] 13.41% | 27,479 | 3.6% |
[ 15.5% - 16.0% ] 15.89% | 2,581 | 5.5% |
[ 16.5% - 17.0% ] 16.58% | 20,911 | 4.7% |
[ 17.0% - 17.5% ] 17.46% | 8,209 | 3.5% |
[ 18.5% - 19.0% ] 18.65% | 429 | 3.4% |
[ 19.5% - 20.0% ] 19.65% | 12,312 | 8.8% |
[ 25.0% - 25.5% ] 25.00% | 116 | 14.1% |
[ 26.5% - 27.0% ] 26.83% | 45,564 | 6.8% |
[ 26.5% - 27.0% ] 26.98% | 15,377 | 4.3% |
[ 27.0% - 27.5% ] 27.43% | 226 | 2.3% |
[ 28.5% - 29.0% ] 28.71% | 18,951 | 7.6% |
[ 33.5% - 34.0% ] 33.78% | 16,679 | 3.2% |
[ 34.5% - 35.0% ] 34.51% | 194,512 | 6.8% |
[ 36.5% - 37.0% ] 36.93% | 32,294 | 6.6% |
[ 37.0% - 37.5% ] 37.12% | 35,755 | 10.4% |
[ 38.0% - 38.5% ] 38.33% | 11,091 | 7.7% |
[ 40.5% - 41.0% ] 40.51% | 22,831 | 8.5% |
[ 43.5% - 44.0% ] 43.52% | 22,163 | 6.8% |