Zip Codes with the Highest Percentage of Population Employed in Education Instruction & Library in Crossville, TN
RELATED REPORTS & OPTIONS
Education Instruction & Library
Crossville
Compare Zip Codes
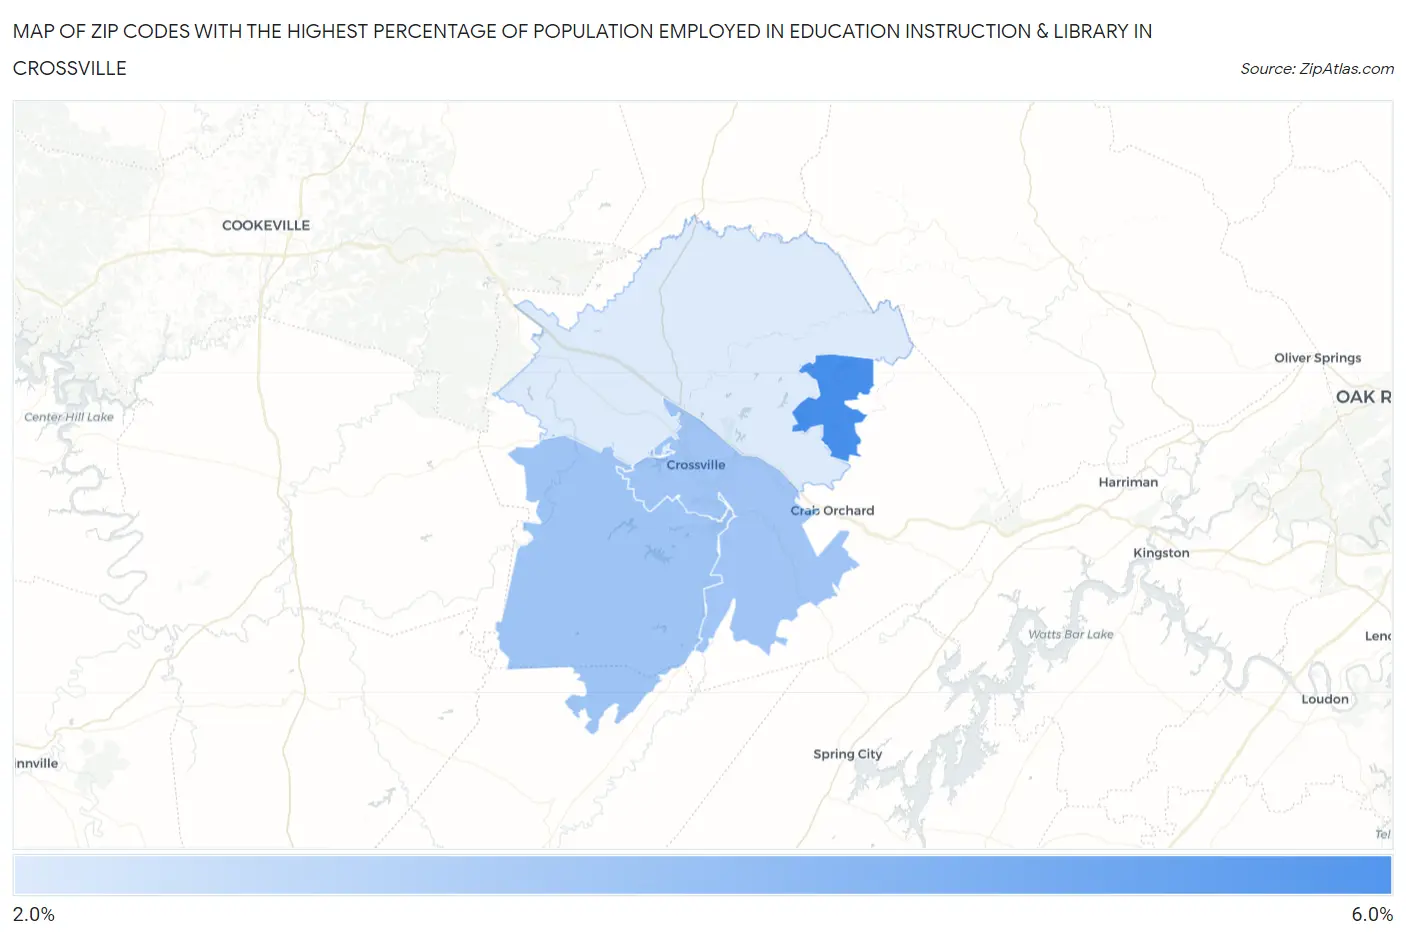
Map of Zip Codes with the Highest Percentage of Population Employed in Education Instruction & Library in Crossville
2.4%
5.8%
Zip Codes with the Highest Percentage of Population Employed in Education Instruction & Library in Crossville, TN
| Zip Code | % Employed | vs State | vs National | |
| 1. | 38558 | 5.8% | 5.8%(-0.053)#248 | 6.2%(-0.395)#14,358 |
| 2. | 38572 | 3.8% | 5.8%(-2.05)#441 | 6.2%(-2.39)#22,414 |
| 3. | 38555 | 3.7% | 5.8%(-2.11)#454 | 6.2%(-2.46)#22,634 |
| 4. | 38571 | 2.4% | 5.8%(-3.45)#521 | 6.2%(-3.80)#26,237 |
1
Common Questions
What are the Top 3 Zip Codes with the Highest Percentage of Population Employed in Education Instruction & Library in Crossville, TN?
Top 3 Zip Codes with the Highest Percentage of Population Employed in Education Instruction & Library in Crossville, TN are:
What zip code has the Highest Percentage of Population Employed in Education Instruction & Library in Crossville, TN?
38558 has the Highest Percentage of Population Employed in Education Instruction & Library in Crossville, TN with 5.8%.
What is the Percentage of Population Employed in Education Instruction & Library in Crossville, TN?
Percentage of Population Employed in Education Instruction & Library in Crossville is 2.3%.
What is the Percentage of Population Employed in Education Instruction & Library in Tennessee?
Percentage of Population Employed in Education Instruction & Library in Tennessee is 5.8%.
What is the Percentage of Population Employed in Education Instruction & Library in the United States?
Percentage of Population Employed in Education Instruction & Library in the United States is 6.2%.