Zip Codes with the Highest Percentage of Population with a Degree in Social Sciences in South Dakota
RELATED REPORTS & OPTIONS
Social Sciences
South Dakota
Compare Zip Codes
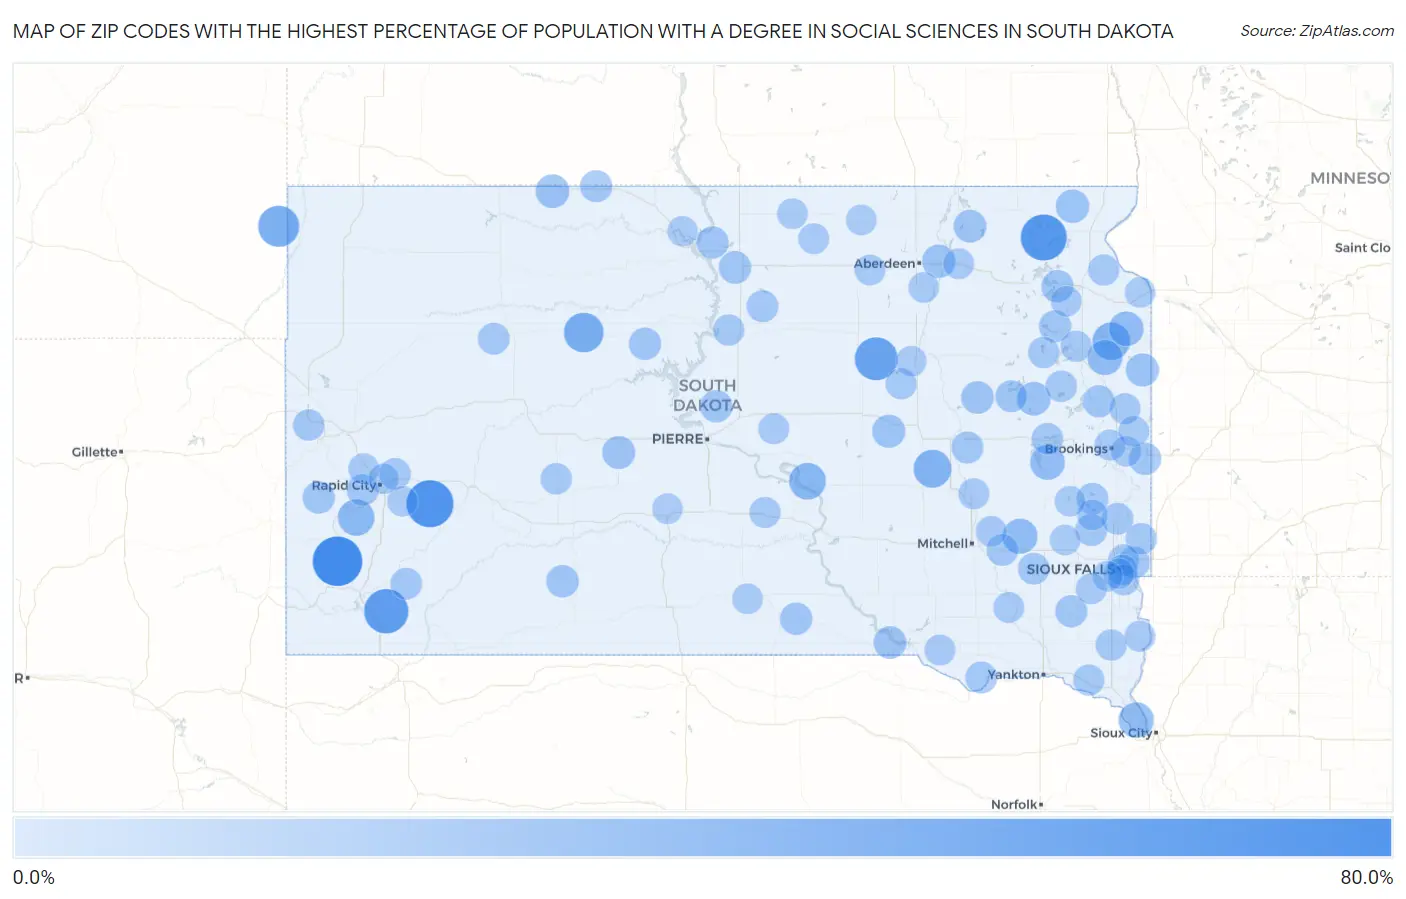
Map of Zip Codes with the Highest Percentage of Population with a Degree in Social Sciences in South Dakota
0.0%
80.0%
Zip Codes with the Highest Percentage of Population with a Degree in Social Sciences in South Dakota
| Zip Code | % Graduates | vs State | vs National | |
| 1. | 57773 | 66.7% | 6.3%(+60.3)#1 | 8.1%(+58.6)#80 |
| 2. | 57725 | 58.6% | 6.3%(+52.3)#2 | 8.1%(+50.5)#102 |
| 3. | 57232 | 55.2% | 6.3%(+48.8)#3 | 8.1%(+47.1)#117 |
| 4. | 57782 | 50.0% | 6.3%(+43.7)#4 | 8.1%(+41.9)#159 |
| 5. | 57470 | 45.5% | 6.3%(+39.1)#5 | 8.1%(+37.4)#195 |
| 6. | 57724 | 39.1% | 6.3%(+32.8)#6 | 8.1%(+31.1)#255 |
| 7. | 57636 | 35.0% | 6.3%(+28.7)#7 | 8.1%(+26.9)#313 |
| 8. | 57312 | 29.2% | 6.3%(+22.8)#8 | 8.1%(+21.1)#451 |
| 9. | 57265 | 28.0% | 6.3%(+21.7)#9 | 8.1%(+19.9)#495 |
| 10. | 57339 | 25.7% | 6.3%(+19.4)#10 | 8.1%(+17.6)#594 |
| 11. | 57751 | 24.9% | 6.3%(+18.6)#11 | 8.1%(+16.8)#653 |
| 12. | 57038 | 21.1% | 6.3%(+14.8)#12 | 8.1%(+13.1)#867 |
| 13. | 57374 | 20.7% | 6.3%(+14.3)#13 | 8.1%(+12.6)#900 |
| 14. | 57238 | 20.5% | 6.3%(+14.2)#14 | 8.1%(+12.4)#916 |
| 15. | 57051 | 19.3% | 6.3%(+13.0)#15 | 8.1%(+11.2)#1,046 |
| 16. | 57246 | 19.2% | 6.3%(+12.9)#16 | 8.1%(+11.2)#1,056 |
| 17. | 57221 | 16.4% | 6.3%(+10.0)#17 | 8.1%(+8.32)#1,538 |
| 18. | 57645 | 16.0% | 6.3%(+9.65)#18 | 8.1%(+7.93)#1,639 |
| 19. | 57224 | 15.3% | 6.3%(+8.93)#19 | 8.1%(+7.21)#1,862 |
| 20. | 57427 | 14.8% | 6.3%(+8.44)#20 | 8.1%(+6.72)#2,028 |
| 21. | 57381 | 14.3% | 6.3%(+7.94)#21 | 8.1%(+6.21)#2,219 |
| 22. | 57237 | 14.2% | 6.3%(+7.83)#22 | 8.1%(+6.10)#2,278 |
| 23. | 57552 | 14.0% | 6.3%(+7.67)#23 | 8.1%(+5.95)#2,341 |
| 24. | 57432 | 13.6% | 6.3%(+7.29)#24 | 8.1%(+5.57)#2,518 |
| 25. | 57335 | 13.2% | 6.3%(+6.81)#25 | 8.1%(+5.09)#2,750 |
| 26. | 57322 | 13.0% | 6.3%(+6.70)#26 | 8.1%(+4.97)#2,808 |
| 27. | 57472 | 12.8% | 6.3%(+6.46)#27 | 8.1%(+4.73)#2,942 |
| 28. | 57577 | 12.4% | 6.3%(+6.06)#28 | 8.1%(+4.34)#3,210 |
| 29. | 57501 | 12.1% | 6.3%(+5.71)#29 | 8.1%(+3.99)#3,460 |
| 30. | 57625 | 12.1% | 6.3%(+5.71)#30 | 8.1%(+3.98)#3,462 |
| 31. | 57026 | 11.9% | 6.3%(+5.59)#31 | 8.1%(+3.86)#3,545 |
| 32. | 57529 | 11.9% | 6.3%(+5.56)#32 | 8.1%(+3.83)#3,574 |
| 33. | 57273 | 11.9% | 6.3%(+5.52)#33 | 8.1%(+3.79)#3,605 |
| 34. | 57745 | 11.8% | 6.3%(+5.49)#34 | 8.1%(+3.77)#3,625 |
| 35. | 57631 | 11.8% | 6.3%(+5.48)#35 | 8.1%(+3.76)#3,635 |
| 36. | 57234 | 11.4% | 6.3%(+5.05)#36 | 8.1%(+3.32)#4,007 |
| 37. | 57036 | 11.1% | 6.3%(+4.77)#37 | 8.1%(+3.04)#4,269 |
| 38. | 57018 | 11.0% | 6.3%(+4.61)#38 | 8.1%(+2.88)#4,422 |
| 39. | 57641 | 10.9% | 6.3%(+4.52)#39 | 8.1%(+2.80)#4,509 |
| 40. | 57235 | 10.8% | 6.3%(+4.44)#40 | 8.1%(+2.71)#4,607 |
| 41. | 57324 | 10.7% | 6.3%(+4.37)#41 | 8.1%(+2.64)#4,678 |
| 42. | 57278 | 10.5% | 6.3%(+4.13)#42 | 8.1%(+2.41)#4,964 |
| 43. | 57005 | 10.5% | 6.3%(+4.12)#43 | 8.1%(+2.40)#4,974 |
| 44. | 57311 | 10.4% | 6.3%(+4.03)#44 | 8.1%(+2.30)#5,095 |
| 45. | 57626 | 10.3% | 6.3%(+4.00)#45 | 8.1%(+2.27)#5,125 |
| 46. | 57450 | 10.3% | 6.3%(+4.00)#46 | 8.1%(+2.27)#5,127 |
| 47. | 57062 | 10.2% | 6.3%(+3.85)#47 | 8.1%(+2.12)#5,314 |
| 48. | 57075 | 10.2% | 6.3%(+3.81)#48 | 8.1%(+2.08)#5,354 |
| 49. | 57022 | 10.1% | 6.3%(+3.80)#49 | 8.1%(+2.08)#5,363 |
| 50. | 57722 | 10.0% | 6.3%(+3.65)#50 | 8.1%(+1.93)#5,594 |
| 51. | 57319 | 9.8% | 6.3%(+3.47)#51 | 8.1%(+1.74)#5,797 |
| 52. | 57249 | 9.6% | 6.3%(+3.26)#52 | 8.1%(+1.53)#6,062 |
| 53. | 57783 | 9.4% | 6.3%(+3.10)#53 | 8.1%(+1.37)#6,292 |
| 54. | 57706 | 9.4% | 6.3%(+3.05)#54 | 8.1%(+1.32)#6,366 |
| 55. | 57702 | 9.4% | 6.3%(+3.03)#55 | 8.1%(+1.31)#6,383 |
| 56. | 57241 | 9.2% | 6.3%(+2.90)#56 | 8.1%(+1.17)#6,557 |
| 57. | 57567 | 9.2% | 6.3%(+2.85)#57 | 8.1%(+1.12)#6,632 |
| 58. | 57030 | 9.1% | 6.3%(+2.75)#58 | 8.1%(+1.02)#6,791 |
| 59. | 57243 | 9.0% | 6.3%(+2.61)#59 | 8.1%(+0.884)#7,026 |
| 60. | 57104 | 8.9% | 6.3%(+2.51)#60 | 8.1%(+0.780)#7,189 |
| 61. | 57004 | 8.8% | 6.3%(+2.49)#61 | 8.1%(+0.761)#7,214 |
| 62. | 57442 | 8.8% | 6.3%(+2.49)#62 | 8.1%(+0.760)#7,215 |
| 63. | 57069 | 8.4% | 6.3%(+2.08)#63 | 8.1%(+0.356)#7,951 |
| 64. | 57279 | 8.4% | 6.3%(+2.03)#64 | 8.1%(+0.306)#8,043 |
| 65. | 57201 | 8.3% | 6.3%(+2.00)#65 | 8.1%(+0.278)#8,080 |
| 66. | 57476 | 8.3% | 6.3%(+1.99)#66 | 8.1%(+0.262)#8,123 |
| 67. | 57544 | 8.1% | 6.3%(+1.79)#67 | 8.1%(+0.068)#8,478 |
| 68. | 57268 | 8.1% | 6.3%(+1.76)#68 | 8.1%(+0.037)#8,540 |
| 69. | 57536 | 7.9% | 6.3%(+1.55)#69 | 8.1%(-0.176)#8,972 |
| 70. | 57380 | 7.9% | 6.3%(+1.52)#70 | 8.1%(-0.204)#9,028 |
| 71. | 57052 | 7.8% | 6.3%(+1.45)#71 | 8.1%(-0.279)#9,179 |
| 72. | 57034 | 7.6% | 6.3%(+1.27)#72 | 8.1%(-0.452)#9,528 |
| 73. | 57015 | 7.5% | 6.3%(+1.19)#73 | 8.1%(-0.537)#9,700 |
| 74. | 57006 | 7.5% | 6.3%(+1.19)#74 | 8.1%(-0.539)#9,704 |
| 75. | 57314 | 7.5% | 6.3%(+1.13)#75 | 8.1%(-0.595)#9,826 |
| 76. | 57718 | 7.4% | 6.3%(+1.10)#76 | 8.1%(-0.627)#9,902 |
| 77. | 57448 | 7.4% | 6.3%(+1.06)#77 | 8.1%(-0.664)#9,979 |
| 78. | 57108 | 7.3% | 6.3%(+0.948)#78 | 8.1%(-0.778)#10,223 |
| 79. | 57445 | 7.1% | 6.3%(+0.797)#79 | 8.1%(-0.928)#10,571 |
| 80. | 57256 | 7.1% | 6.3%(+0.797)#80 | 8.1%(-0.928)#10,602 |
| 81. | 57340 | 7.1% | 6.3%(+0.797)#81 | 8.1%(-0.928)#10,605 |
| 82. | 57451 | 7.0% | 6.3%(+0.672)#82 | 8.1%(-1.05)#10,868 |
| 83. | 57276 | 6.9% | 6.3%(+0.591)#83 | 8.1%(-1.13)#11,060 |
| 84. | 57016 | 6.9% | 6.3%(+0.572)#84 | 8.1%(-1.15)#11,114 |
| 85. | 57437 | 6.9% | 6.3%(+0.551)#85 | 8.1%(-1.17)#11,162 |
| 86. | 57456 | 6.9% | 6.3%(+0.551)#86 | 8.1%(-1.17)#11,167 |
| 87. | 57580 | 6.9% | 6.3%(+0.537)#87 | 8.1%(-1.19)#11,207 |
| 88. | 57002 | 6.8% | 6.3%(+0.438)#88 | 8.1%(-1.29)#11,421 |
| 89. | 57479 | 6.8% | 6.3%(+0.411)#89 | 8.1%(-1.31)#11,482 |
| 90. | 57103 | 6.8% | 6.3%(+0.406)#90 | 8.1%(-1.32)#11,495 |
| 91. | 57048 | 6.7% | 6.3%(+0.396)#91 | 8.1%(-1.33)#11,521 |
| 92. | 57105 | 6.7% | 6.3%(+0.306)#92 | 8.1%(-1.42)#11,739 |
| 93. | 57469 | 6.6% | 6.3%(+0.290)#93 | 8.1%(-1.44)#11,769 |
| 94. | 57042 | 6.5% | 6.3%(+0.194)#94 | 8.1%(-1.53)#12,021 |
| 95. | 57559 | 6.5% | 6.3%(+0.190)#95 | 8.1%(-1.54)#12,027 |
| 96. | 57106 | 6.5% | 6.3%(+0.113)#96 | 8.1%(-1.61)#12,208 |
| 97. | 57703 | 6.4% | 6.3%(+0.044)#97 | 8.1%(-1.68)#12,402 |
| 98. | 57701 | 6.3% | 6.3%(-0.023)#98 | 8.1%(-1.75)#12,572 |
| 99. | 57216 | 6.2% | 6.3%(-0.096)#99 | 8.1%(-1.82)#12,743 |
| 100. | 57658 | 6.2% | 6.3%(-0.096)#100 | 8.1%(-1.82)#12,761 |
Common Questions
What are the Top 10 Zip Codes with the Highest Percentage of Population with a Degree in Social Sciences in South Dakota?
Top 10 Zip Codes with the Highest Percentage of Population with a Degree in Social Sciences in South Dakota are:
What zip code has the Highest Percentage of Population with a Degree in Social Sciences in South Dakota?
57773 has the Highest Percentage of Population with a Degree in Social Sciences in South Dakota with 66.7%.
What is the Percentage of Population with a Degree in Social Sciences in the State of South Dakota?
Percentage of Population with a Degree in Social Sciences in South Dakota is 6.3%.
What is the Percentage of Population with a Degree in Social Sciences in the United States?
Percentage of Population with a Degree in Social Sciences in the United States is 8.1%.