Harwood, ND Map & Demographics
Harwood Map
Harwood Overview
$64,938
PER CAPITA INCOME
$144,500
AVG FAMILY INCOME
$139,750
AVG HOUSEHOLD INCOME
33.1%
WAGE / INCOME GAP [ % ]
66.9¢/ $1
WAGE / INCOME GAP [ $ ]
0.44
INEQUALITY / GINI INDEX
759
TOTAL POPULATION
352
MALE POPULATION
407
FEMALE POPULATION
86.49
MALES / 100 FEMALES
115.62
FEMALES / 100 MALES
39.5
MEDIAN AGE
3.2
AVG FAMILY SIZE
3.1
AVG HOUSEHOLD SIZE
383
LABOR FORCE [ PEOPLE ]
73.9%
PERCENT IN LABOR FORCE
0.8%
UNEMPLOYMENT RATE
Harwood Zip Codes
Harwood Area Codes
Income in Harwood
Income Overview in Harwood
Per Capita Income in Harwood is $64,938, while median incomes of families and households are $144,500 and $139,750 respectively.
| Characteristic | Number | Measure |
| Per Capita Income | 759 | $64,938 |
| Median Family Income | 222 | $144,500 |
| Mean Family Income | 222 | $212,023 |
| Median Household Income | 248 | $139,750 |
| Mean Household Income | 248 | $200,254 |
| Income Deficit | 222 | $0 |
| Wage / Income Gap (%) | 759 | 33.09% |
| Wage / Income Gap ($) | 759 | 66.91¢ per $1 |
| Gini / Inequality Index | 759 | 0.44 |
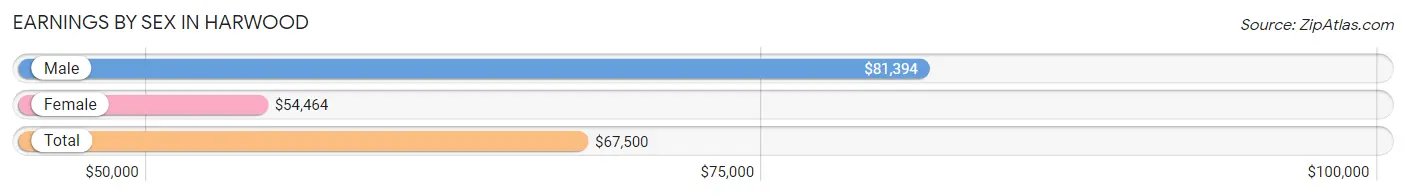
Earnings by Sex in Harwood
Average Earnings in Harwood are $67,500, $81,394 for men and $54,464 for women, a difference of 33.1%.
| Sex | Number | Average Earnings |
| Male | 227 (55.9%) | $81,394 |
| Female | 179 (44.1%) | $54,464 |
| Total | 406 (100.0%) | $67,500 |
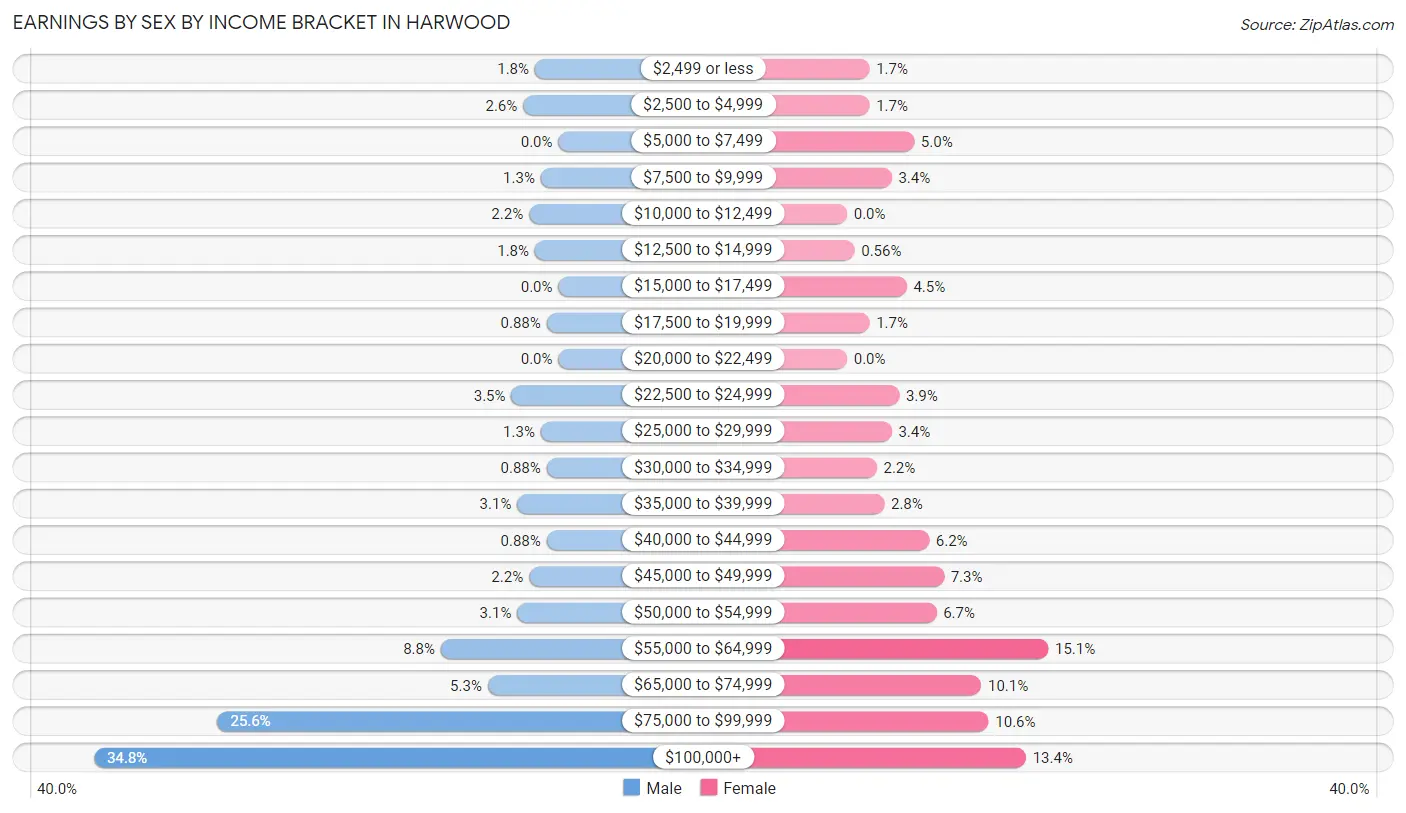
Earnings by Sex by Income Bracket in Harwood
The most common earnings brackets in Harwood are $100,000+ for men (79 | 34.8%) and $55,000 to $64,999 for women (27 | 15.1%).
| Income | Male | Female |
| $2,499 or less | 4 (1.8%) | 3 (1.7%) |
| $2,500 to $4,999 | 6 (2.6%) | 3 (1.7%) |
| $5,000 to $7,499 | 0 (0.0%) | 9 (5.0%) |
| $7,500 to $9,999 | 3 (1.3%) | 6 (3.4%) |
| $10,000 to $12,499 | 5 (2.2%) | 0 (0.0%) |
| $12,500 to $14,999 | 4 (1.8%) | 1 (0.6%) |
| $15,000 to $17,499 | 0 (0.0%) | 8 (4.5%) |
| $17,500 to $19,999 | 2 (0.9%) | 3 (1.7%) |
| $20,000 to $22,499 | 0 (0.0%) | 0 (0.0%) |
| $22,500 to $24,999 | 8 (3.5%) | 7 (3.9%) |
| $25,000 to $29,999 | 3 (1.3%) | 6 (3.4%) |
| $30,000 to $34,999 | 2 (0.9%) | 4 (2.2%) |
| $35,000 to $39,999 | 7 (3.1%) | 5 (2.8%) |
| $40,000 to $44,999 | 2 (0.9%) | 11 (6.1%) |
| $45,000 to $49,999 | 5 (2.2%) | 13 (7.3%) |
| $50,000 to $54,999 | 7 (3.1%) | 12 (6.7%) |
| $55,000 to $64,999 | 20 (8.8%) | 27 (15.1%) |
| $65,000 to $74,999 | 12 (5.3%) | 18 (10.1%) |
| $75,000 to $99,999 | 58 (25.6%) | 19 (10.6%) |
| $100,000+ | 79 (34.8%) | 24 (13.4%) |
| Total | 227 (100.0%) | 179 (100.0%) |
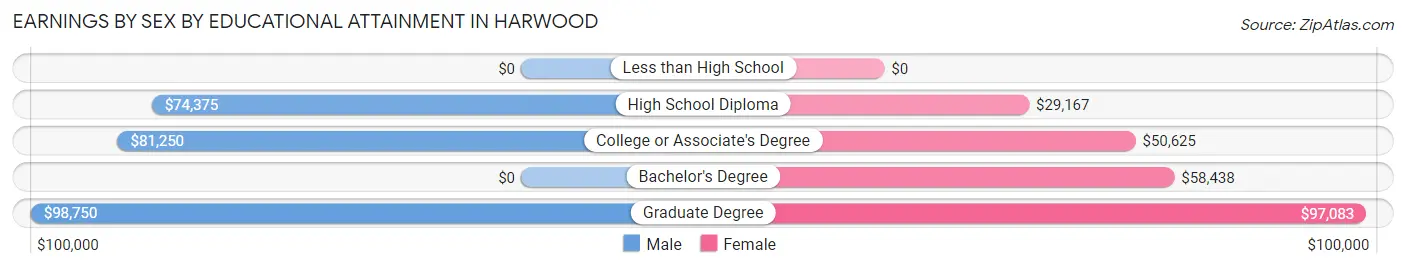
Earnings by Sex by Educational Attainment in Harwood
Average earnings in Harwood are $82,356 for men and $57,596 for women, a difference of 30.1%. Men with an educational attainment of graduate degree enjoy the highest average annual earnings of $98,750, while those with high school diploma education earn the least with $74,375. Women with an educational attainment of graduate degree earn the most with the average annual earnings of $97,083, while those with high school diploma education have the smallest earnings of $29,167.
| Educational Attainment | Male Income | Female Income |
| Less than High School | - | - |
| High School Diploma | $74,375 | $29,167 |
| College or Associate's Degree | $81,250 | $50,625 |
| Bachelor's Degree | - | - |
| Graduate Degree | $98,750 | $97,083 |
| Total | $82,356 | $57,596 |
Family Income in Harwood
Family Income Brackets in Harwood
According to the Harwood family income data, there are 68 families falling into the $200,000+ income range, which is the most common income bracket and makes up 30.6% of all families.
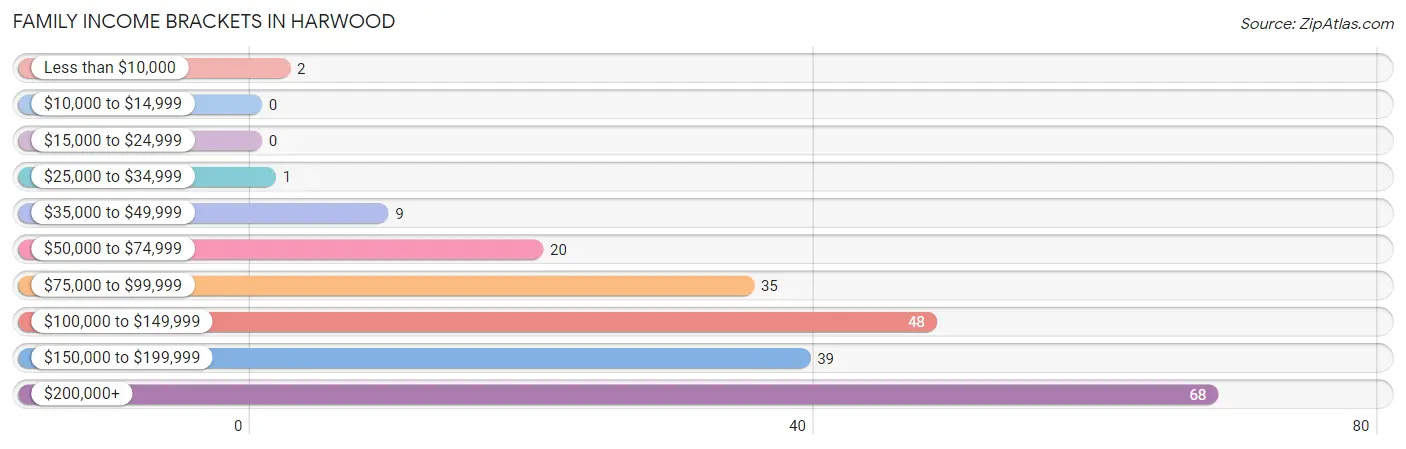
| Income Bracket | # Families | % Families |
| Less than $10,000 | 2 | 0.9% |
| $10,000 to $14,999 | 0 | 0.0% |
| $15,000 to $24,999 | 0 | 0.0% |
| $25,000 to $34,999 | 1 | 0.5% |
| $35,000 to $49,999 | 9 | 4.1% |
| $50,000 to $74,999 | 20 | 9.0% |
| $75,000 to $99,999 | 35 | 15.8% |
| $100,000 to $149,999 | 48 | 21.6% |
| $150,000 to $199,999 | 39 | 17.6% |
| $200,000+ | 68 | 30.6% |
Family Income by Famaliy Size in Harwood
5-person families (43 | 19.4%) account for the highest median family income in Harwood with $250,001 per family, while 2-person families (92 | 41.4%) have the highest median income of $63,125 per family member.
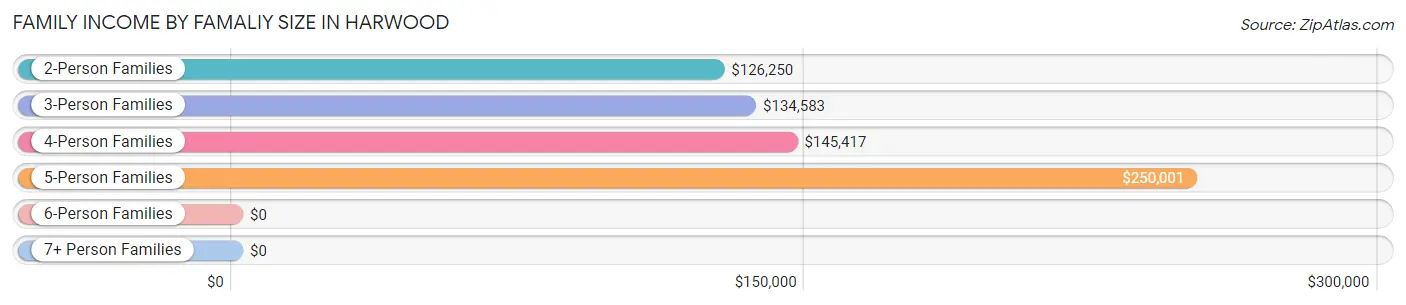
| Income Bracket | # Families | Median Income |
| 2-Person Families | 92 (41.4%) | $126,250 |
| 3-Person Families | 27 (12.2%) | $134,583 |
| 4-Person Families | 57 (25.7%) | $145,417 |
| 5-Person Families | 43 (19.4%) | $250,001 |
| 6-Person Families | 1 (0.4%) | $0 |
| 7+ Person Families | 2 (0.9%) | $0 |
| Total | 222 (100.0%) | $144,500 |
Family Income by Number of Earners in Harwood
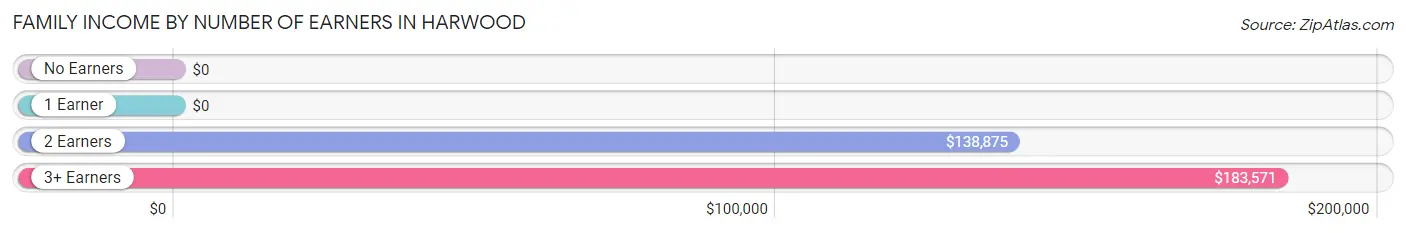
| Number of Earners | # Families | Median Income |
| No Earners | 20 (9.0%) | $0 |
| 1 Earner | 63 (28.4%) | $0 |
| 2 Earners | 109 (49.1%) | $138,875 |
| 3+ Earners | 30 (13.5%) | $183,571 |
| Total | 222 (100.0%) | $144,500 |
Household Income in Harwood
Household Income Brackets in Harwood
With 68 households falling in the category, the $200,000+ income range is the most frequent in Harwood, accounting for 27.4% of all households.
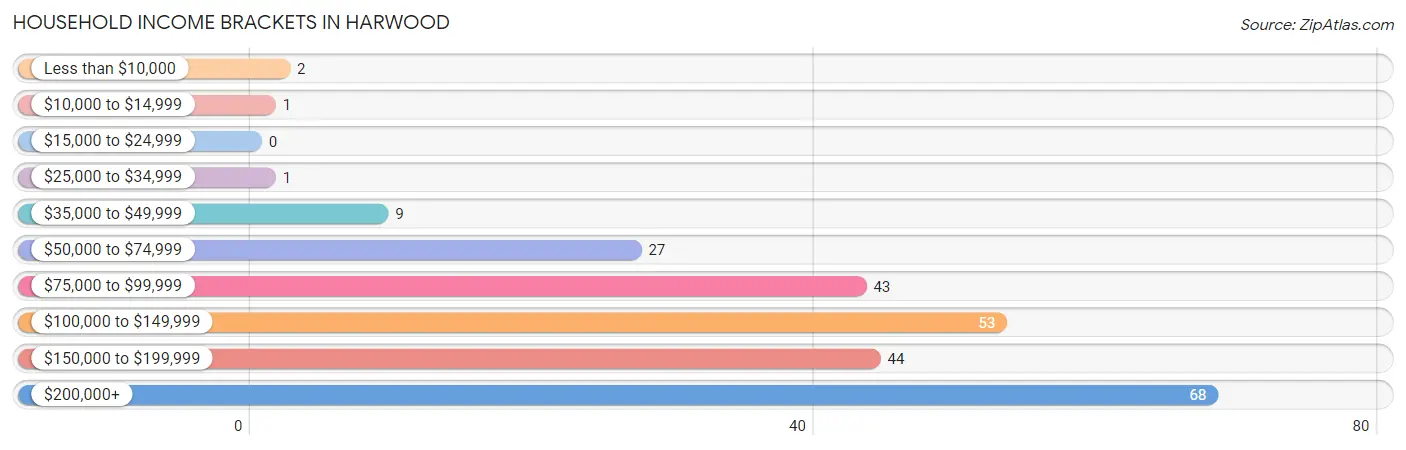
| Income Bracket | # Households | % Households |
| Less than $10,000 | 2 | 0.8% |
| $10,000 to $14,999 | 1 | 0.4% |
| $15,000 to $24,999 | 0 | 0.0% |
| $25,000 to $34,999 | 1 | 0.4% |
| $35,000 to $49,999 | 9 | 3.6% |
| $50,000 to $74,999 | 27 | 10.9% |
| $75,000 to $99,999 | 43 | 17.3% |
| $100,000 to $149,999 | 53 | 21.4% |
| $150,000 to $199,999 | 44 | 17.7% |
| $200,000+ | 68 | 27.4% |
Household Income by Householder Age in Harwood
The median household income in Harwood is $139,750, with the highest median household income of $166,750 found in the 25 to 44 years age bracket for the primary householder. A total of 99 households (39.9%) fall into this category.
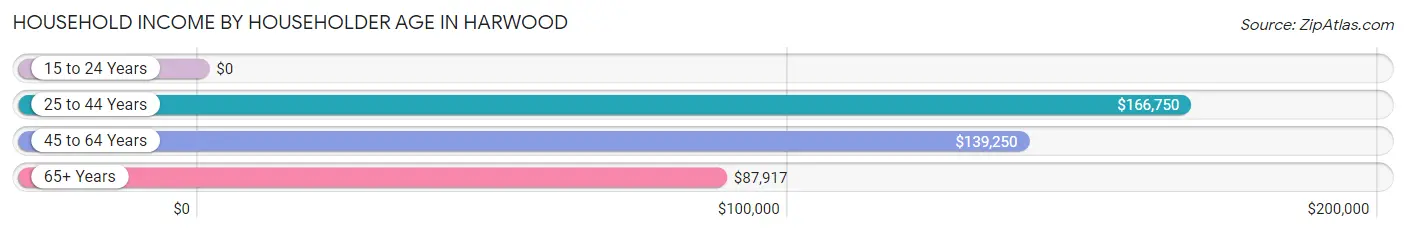
| Income Bracket | # Households | Median Income |
| 15 to 24 Years | 0 (0.0%) | $0 |
| 25 to 44 Years | 99 (39.9%) | $166,750 |
| 45 to 64 Years | 108 (43.5%) | $139,250 |
| 65+ Years | 41 (16.5%) | $87,917 |
| Total | 248 (100.0%) | $139,750 |
Poverty in Harwood
Income Below Poverty by Sex and Age in Harwood
With 0.6% poverty level for males and 1.0% for females among the residents of Harwood, 55 to 64 year old males and 55 to 64 year old females are the most vulnerable to poverty, with 2 males (4.1%) and 4 females (8.3%) in their respective age groups living below the poverty level.
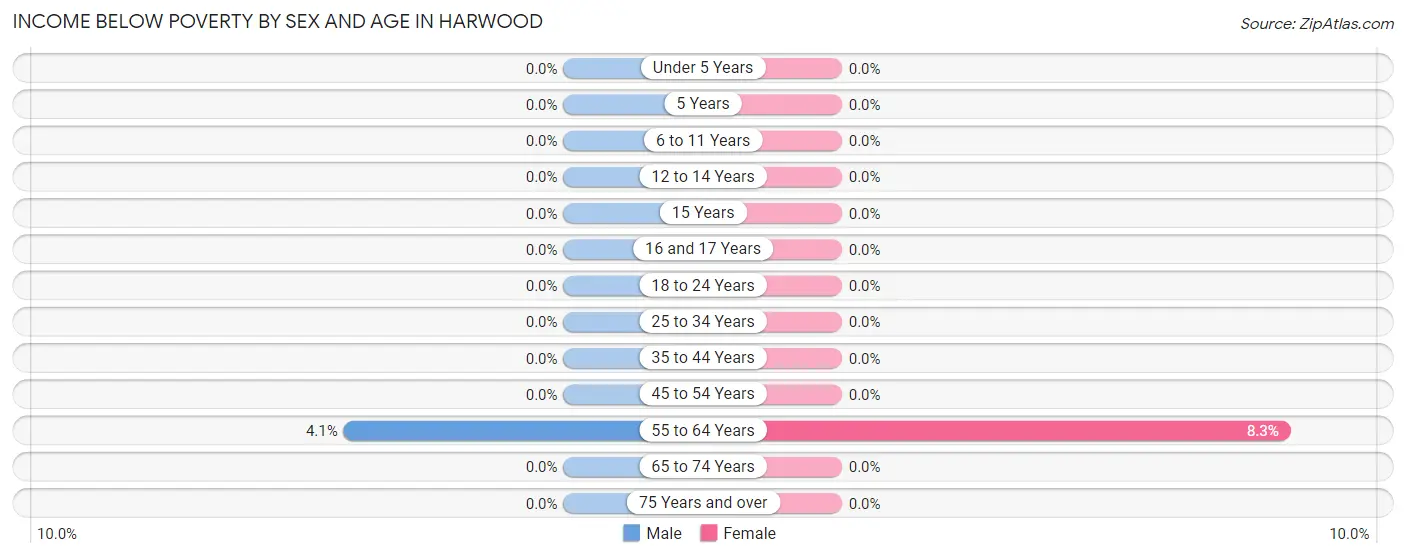
| Age Bracket | Male | Female |
| Under 5 Years | 0 (0.0%) | 0 (0.0%) |
| 5 Years | 0 (0.0%) | 0 (0.0%) |
| 6 to 11 Years | 0 (0.0%) | 0 (0.0%) |
| 12 to 14 Years | 0 (0.0%) | 0 (0.0%) |
| 15 Years | 0 (0.0%) | 0 (0.0%) |
| 16 and 17 Years | 0 (0.0%) | 0 (0.0%) |
| 18 to 24 Years | 0 (0.0%) | 0 (0.0%) |
| 25 to 34 Years | 0 (0.0%) | 0 (0.0%) |
| 35 to 44 Years | 0 (0.0%) | 0 (0.0%) |
| 45 to 54 Years | 0 (0.0%) | 0 (0.0%) |
| 55 to 64 Years | 2 (4.1%) | 4 (8.3%) |
| 65 to 74 Years | 0 (0.0%) | 0 (0.0%) |
| 75 Years and over | 0 (0.0%) | 0 (0.0%) |
| Total | 2 (0.6%) | 4 (1.0%) |
Income Above Poverty by Sex and Age in Harwood
According to the poverty statistics in Harwood, males aged under 5 years and females aged under 5 years are the age groups that are most secure financially, with 100.0% of males and 100.0% of females in these age groups living above the poverty line.
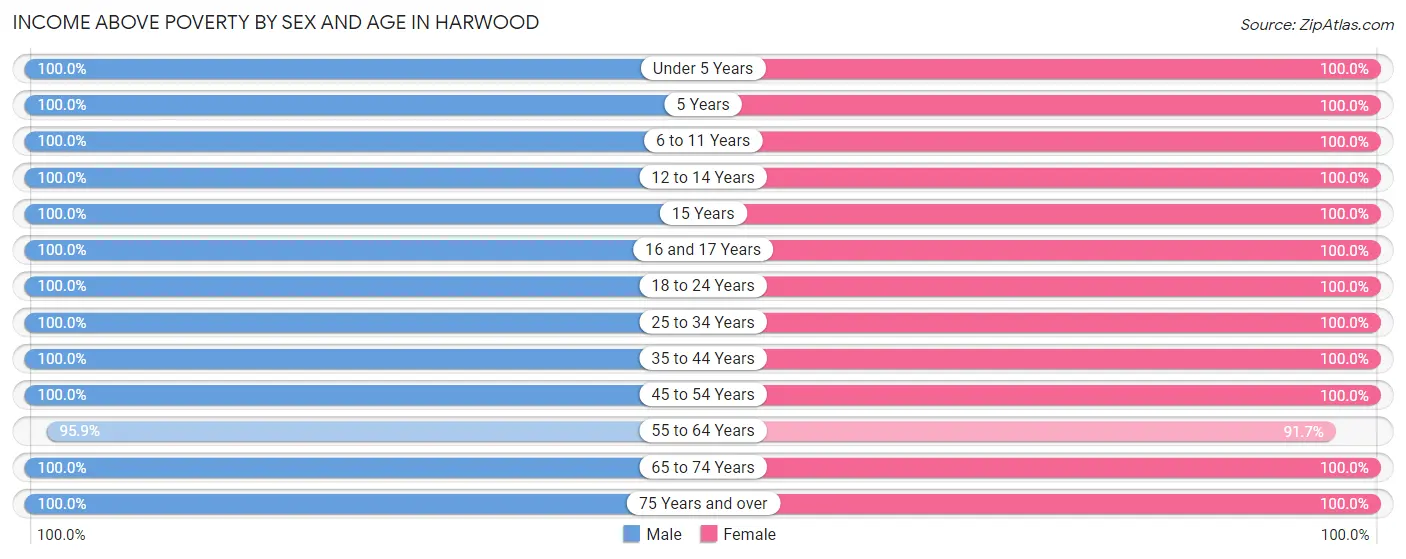
| Age Bracket | Male | Female |
| Under 5 Years | 6 (100.0%) | 31 (100.0%) |
| 5 Years | 1 (100.0%) | 11 (100.0%) |
| 6 to 11 Years | 62 (100.0%) | 51 (100.0%) |
| 12 to 14 Years | 17 (100.0%) | 46 (100.0%) |
| 15 Years | 8 (100.0%) | 8 (100.0%) |
| 16 and 17 Years | 8 (100.0%) | 7 (100.0%) |
| 18 to 24 Years | 13 (100.0%) | 9 (100.0%) |
| 25 to 34 Years | 23 (100.0%) | 43 (100.0%) |
| 35 to 44 Years | 72 (100.0%) | 67 (100.0%) |
| 45 to 54 Years | 54 (100.0%) | 50 (100.0%) |
| 55 to 64 Years | 47 (95.9%) | 44 (91.7%) |
| 65 to 74 Years | 34 (100.0%) | 32 (100.0%) |
| 75 Years and over | 5 (100.0%) | 4 (100.0%) |
| Total | 350 (99.4%) | 403 (99.0%) |
Income Below Poverty Among Married-Couple Families in Harwood
The poverty statistics for married-couple families in Harwood show that 0.9% or 2 of the total 213 families live below the poverty line. Families with no children have the highest poverty rate of 2.1%, comprising of 2 families. On the other hand, families with 1 or 2 children have the lowest poverty rate of 0.0%, which includes 0 families.
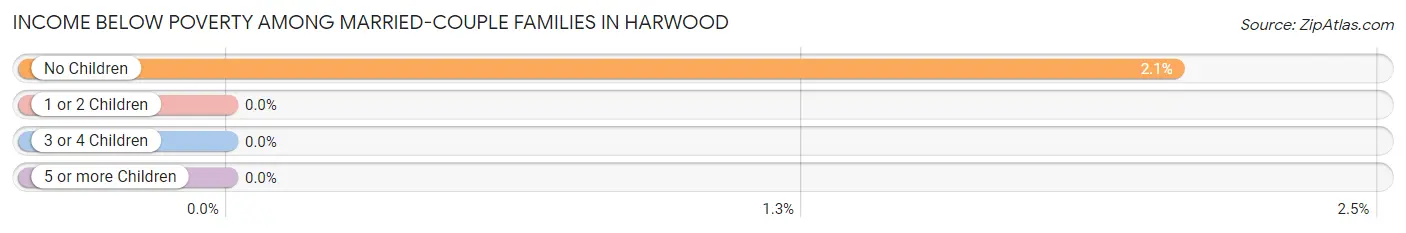
| Children | Above Poverty | Below Poverty |
| No Children | 95 (97.9%) | 2 (2.1%) |
| 1 or 2 Children | 72 (100.0%) | 0 (0.0%) |
| 3 or 4 Children | 42 (100.0%) | 0 (0.0%) |
| 5 or more Children | 2 (100.0%) | 0 (0.0%) |
| Total | 211 (99.1%) | 2 (0.9%) |
Income Below Poverty Among Single-Parent Households in Harwood
| Children | Single Father | Single Mother |
| No Children | 0 (0.0%) | 0 (0.0%) |
| 1 or 2 Children | 0 (0.0%) | 0 (0.0%) |
| 3 or 4 Children | 0 (0.0%) | 0 (0.0%) |
| 5 or more Children | 0 (0.0%) | 0 (0.0%) |
| Total | 0 (0.0%) | 0 (0.0%) |
Income Below Poverty Among Married-Couple vs Single-Parent Households in Harwood
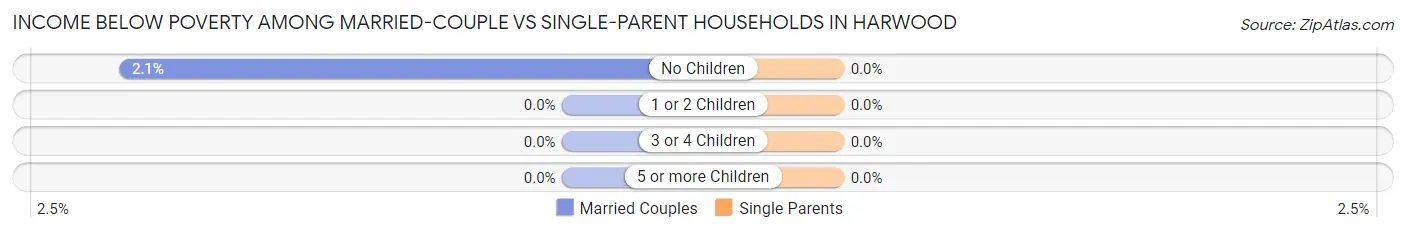
| Children | Married-Couple Families | Single-Parent Households |
| No Children | 2 (2.1%) | 0 (0.0%) |
| 1 or 2 Children | 0 (0.0%) | 0 (0.0%) |
| 3 or 4 Children | 0 (0.0%) | 0 (0.0%) |
| 5 or more Children | 0 (0.0%) | 0 (0.0%) |
| Total | 2 (0.9%) | 0 (0.0%) |
Race in Harwood
The most populous races in Harwood are White / Caucasian (733 | 96.6%), Two or more Races (22 | 2.9%), and Hispanic or Latino (9 | 1.2%).
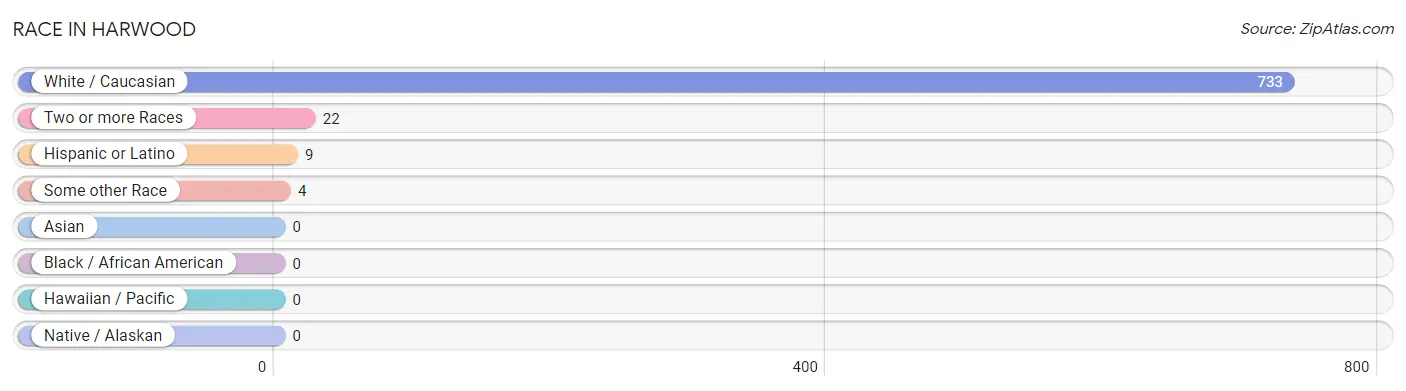
| Race | # Population | % Population |
| Asian | 0 | 0.0% |
| Black / African American | 0 | 0.0% |
| Hawaiian / Pacific | 0 | 0.0% |
| Hispanic or Latino | 9 | 1.2% |
| Native / Alaskan | 0 | 0.0% |
| White / Caucasian | 733 | 96.6% |
| Two or more Races | 22 | 2.9% |
| Some other Race | 4 | 0.5% |
| Total | 759 | 100.0% |
Ancestry in Harwood
The most populous ancestries reported in Harwood are German (233 | 30.7%), Norwegian (230 | 30.3%), Scottish (53 | 7.0%), English (43 | 5.7%), and Irish (39 | 5.1%), together accounting for 78.8% of all Harwood residents.
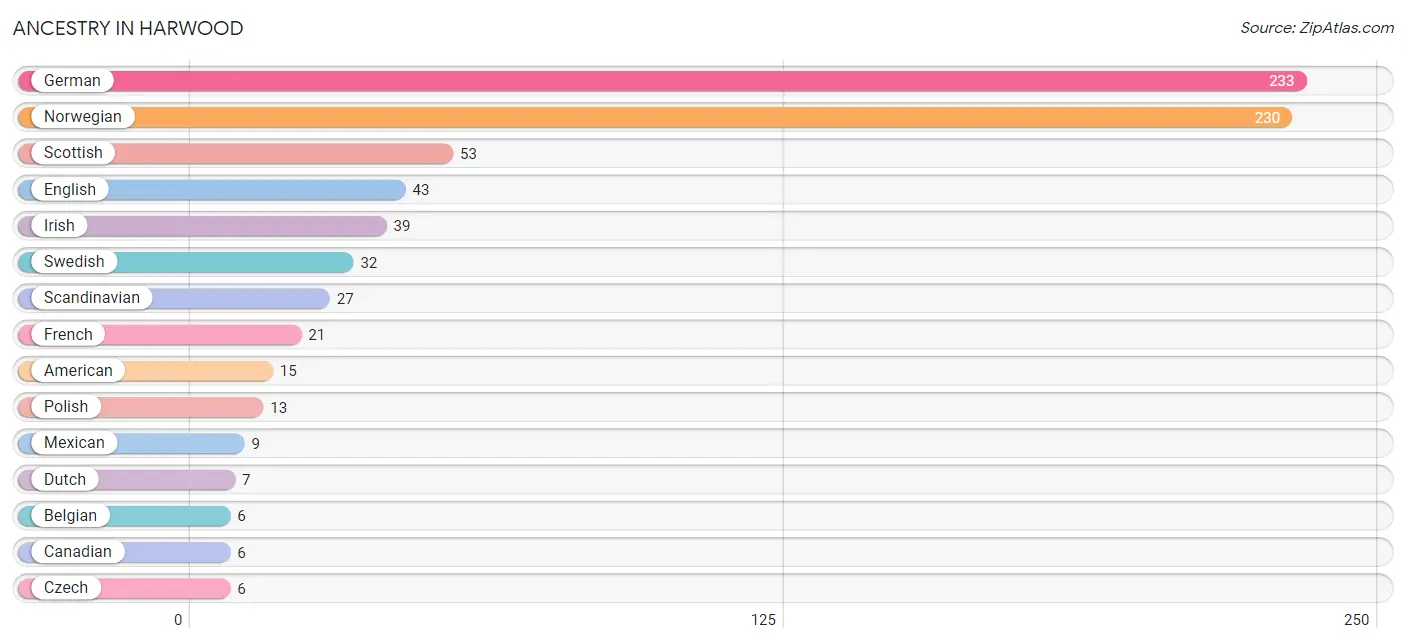
| Ancestry | # Population | % Population |
| American | 15 | 2.0% |
| Belgian | 6 | 0.8% |
| Canadian | 6 | 0.8% |
| Czech | 6 | 0.8% |
| Danish | 3 | 0.4% |
| Dutch | 7 | 0.9% |
| English | 43 | 5.7% |
| Finnish | 3 | 0.4% |
| French | 21 | 2.8% |
| French Canadian | 3 | 0.4% |
| German | 233 | 30.7% |
| Greek | 2 | 0.3% |
| Hungarian | 2 | 0.3% |
| Icelander | 6 | 0.8% |
| Irish | 39 | 5.1% |
| Italian | 4 | 0.5% |
| Mexican | 9 | 1.2% |
| Norwegian | 230 | 30.3% |
| Polish | 13 | 1.7% |
| Russian | 4 | 0.5% |
| Scandinavian | 27 | 3.6% |
| Scottish | 53 | 7.0% |
| Swedish | 32 | 4.2% | View All 23 Rows |
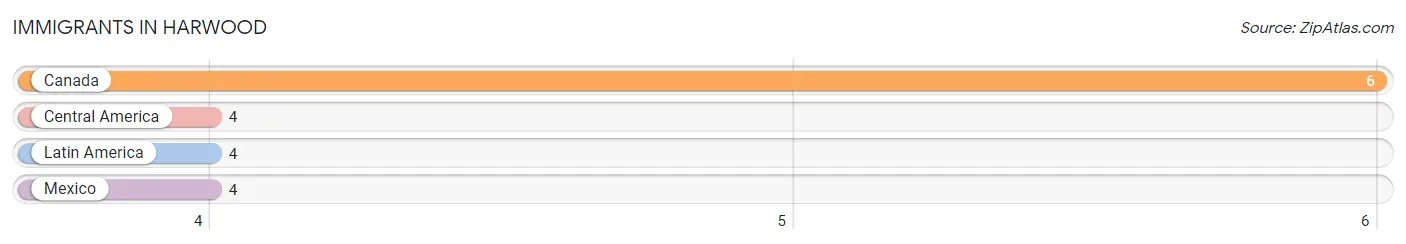
Immigrants in Harwood
The most numerous immigrant groups reported in Harwood came from Canada (6 | 0.8%), Central America (4 | 0.5%), Latin America (4 | 0.5%), and Mexico (4 | 0.5%), together accounting for 2.4% of all Harwood residents.
| Immigration Origin | # Population | % Population |
| Canada | 6 | 0.8% |
| Central America | 4 | 0.5% |
| Latin America | 4 | 0.5% |
| Mexico | 4 | 0.5% | View All 4 Rows |
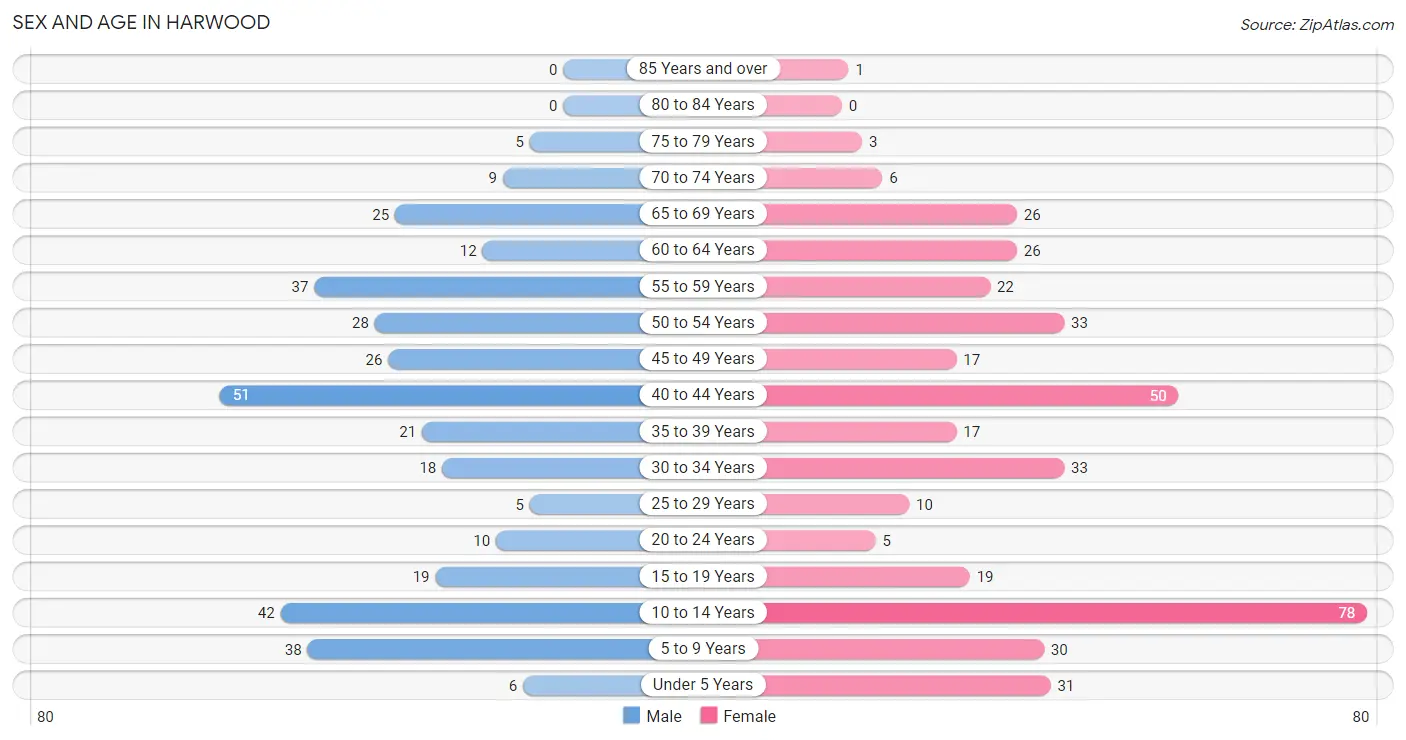
Sex and Age in Harwood
Sex and Age in Harwood
The most populous age groups in Harwood are 40 to 44 Years (51 | 14.5%) for men and 10 to 14 Years (78 | 19.2%) for women.
| Age Bracket | Male | Female |
| Under 5 Years | 6 (1.7%) | 31 (7.6%) |
| 5 to 9 Years | 38 (10.8%) | 30 (7.4%) |
| 10 to 14 Years | 42 (11.9%) | 78 (19.2%) |
| 15 to 19 Years | 19 (5.4%) | 19 (4.7%) |
| 20 to 24 Years | 10 (2.8%) | 5 (1.2%) |
| 25 to 29 Years | 5 (1.4%) | 10 (2.5%) |
| 30 to 34 Years | 18 (5.1%) | 33 (8.1%) |
| 35 to 39 Years | 21 (6.0%) | 17 (4.2%) |
| 40 to 44 Years | 51 (14.5%) | 50 (12.3%) |
| 45 to 49 Years | 26 (7.4%) | 17 (4.2%) |
| 50 to 54 Years | 28 (8.0%) | 33 (8.1%) |
| 55 to 59 Years | 37 (10.5%) | 22 (5.4%) |
| 60 to 64 Years | 12 (3.4%) | 26 (6.4%) |
| 65 to 69 Years | 25 (7.1%) | 26 (6.4%) |
| 70 to 74 Years | 9 (2.6%) | 6 (1.5%) |
| 75 to 79 Years | 5 (1.4%) | 3 (0.7%) |
| 80 to 84 Years | 0 (0.0%) | 0 (0.0%) |
| 85 Years and over | 0 (0.0%) | 1 (0.3%) |
| Total | 352 (100.0%) | 407 (100.0%) |
Families and Households in Harwood
Median Family Size in Harwood
The median family size in Harwood is 3.24 persons per family, with married-couple families (213 | 96.0%) accounting for the largest median family size of 3.3 persons per family. On the other hand, single male/father families (5 | 2.2%) represent the smallest median family size with 1.80 persons per family.
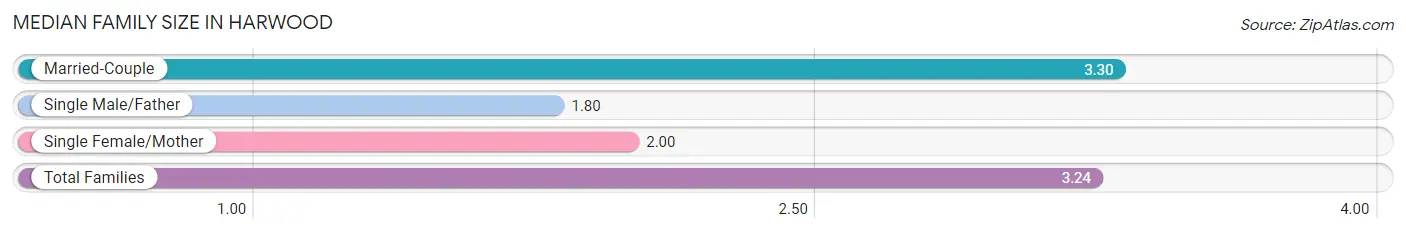
| Family Type | # Families | Family Size |
| Married-Couple | 213 (96.0%) | 3.30 |
| Single Male/Father | 5 (2.2%) | 1.80 |
| Single Female/Mother | 4 (1.8%) | 2.00 |
| Total Families | 222 (100.0%) | 3.24 |
Median Household Size in Harwood
The median household size in Harwood is 3.06 persons per household, with married-couple households (213 | 85.9%) accounting for the largest median household size of 3.3 persons per household. non-family households (26 | 10.5%) represent the smallest median household size with 1.42 persons per household.
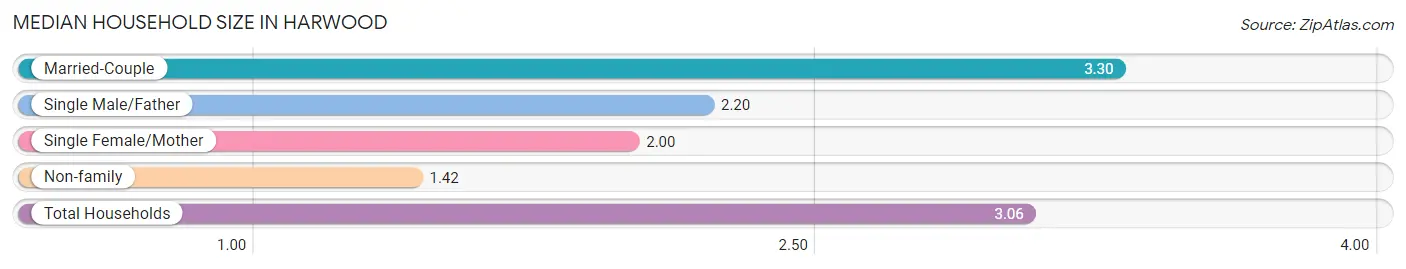
| Household Type | # Households | Household Size |
| Married-Couple | 213 (85.9%) | 3.30 |
| Single Male/Father | 5 (2.0%) | 2.20 |
| Single Female/Mother | 4 (1.6%) | 2.00 |
| Non-family | 26 (10.5%) | 1.42 |
| Total Households | 248 (100.0%) | 3.06 |
Household Size by Marriage Status in Harwood
Out of a total of 248 households in Harwood, 222 (89.5%) are family households, while 26 (10.5%) are nonfamily households. The most numerous type of family households are 2-person households, comprising 92, and the most common type of nonfamily households are 1-person households, comprising 17.
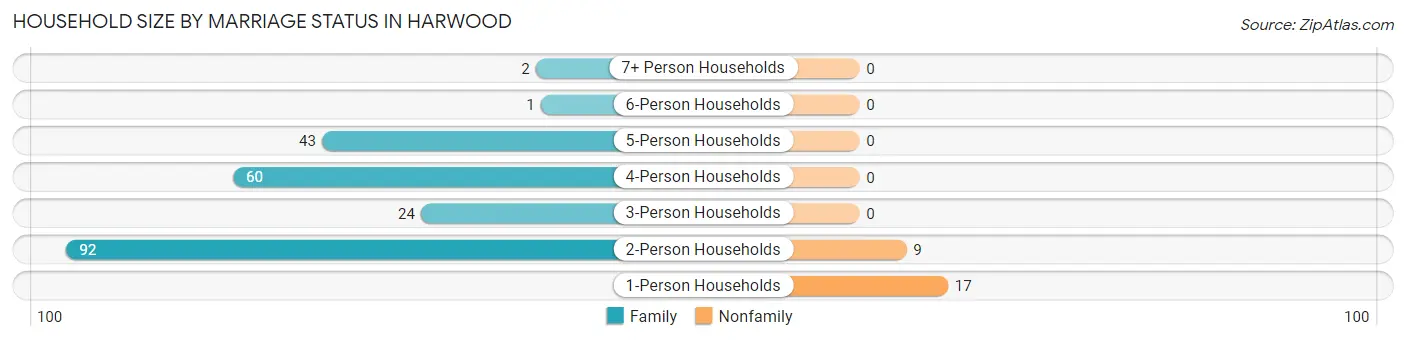
| Household Size | Family Households | Nonfamily Households |
| 1-Person Households | - | 17 (6.9%) |
| 2-Person Households | 92 (37.1%) | 9 (3.6%) |
| 3-Person Households | 24 (9.7%) | 0 (0.0%) |
| 4-Person Households | 60 (24.2%) | 0 (0.0%) |
| 5-Person Households | 43 (17.3%) | 0 (0.0%) |
| 6-Person Households | 1 (0.4%) | 0 (0.0%) |
| 7+ Person Households | 2 (0.8%) | 0 (0.0%) |
| Total | 222 (89.5%) | 26 (10.5%) |
Female Fertility in Harwood
Fertility by Age in Harwood
Average fertility rate in Harwood is 39.0 births per 1,000 women. Women in the age bracket of 20 to 34 years have the highest fertility rate with 83.0 births per 1,000 women. Women in the age bracket of 20 to 34 years acount for 66.7% of all women with births.
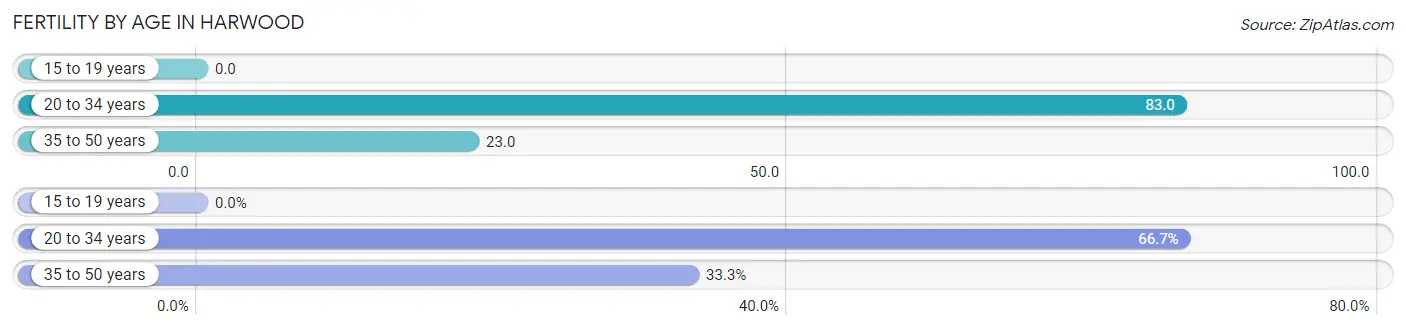
| Age Bracket | Women with Births | Births / 1,000 Women |
| 15 to 19 years | 0 (0.0%) | 0.0 |
| 20 to 34 years | 4 (66.7%) | 83.0 |
| 35 to 50 years | 2 (33.3%) | 23.0 |
| Total | 6 (100.0%) | 39.0 |
Fertility by Age by Marriage Status in Harwood
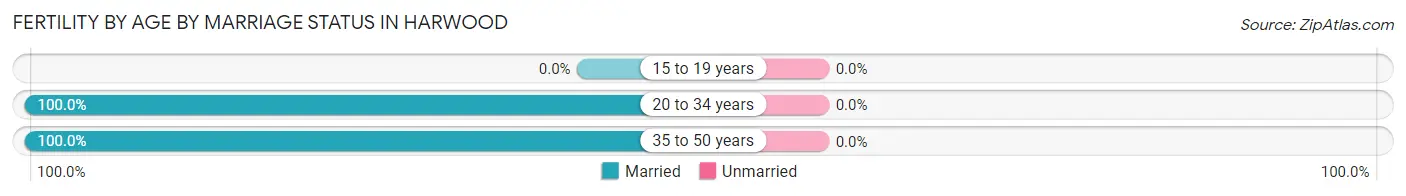
| Age Bracket | Married | Unmarried |
| 15 to 19 years | 0 (0.0%) | 0 (0.0%) |
| 20 to 34 years | 4 (100.0%) | 0 (0.0%) |
| 35 to 50 years | 2 (100.0%) | 0 (0.0%) |
| Total | 6 (100.0%) | 0 (0.0%) |
Fertility by Education in Harwood
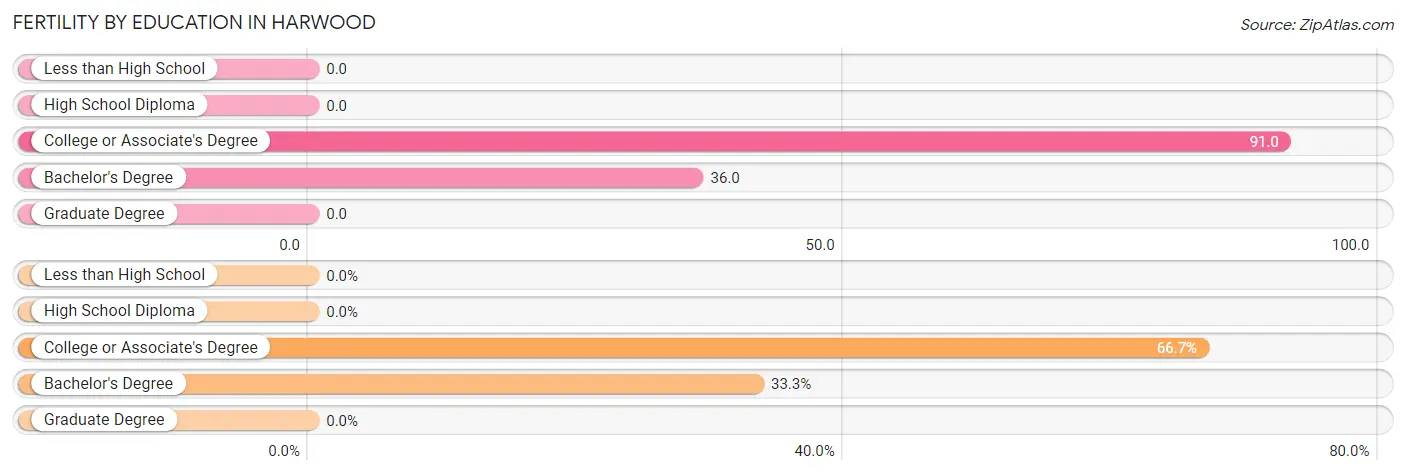
| Educational Attainment | Women with Births | Births / 1,000 Women |
| Less than High School | 0 (0.0%) | 0.0 |
| High School Diploma | 0 (0.0%) | 0.0 |
| College or Associate's Degree | 4 (66.7%) | 91.0 |
| Bachelor's Degree | 2 (33.3%) | 36.0 |
| Graduate Degree | 0 (0.0%) | 0.0 |
| Total | 6 (100.0%) | 39.0 |
Fertility by Education by Marriage Status in Harwood
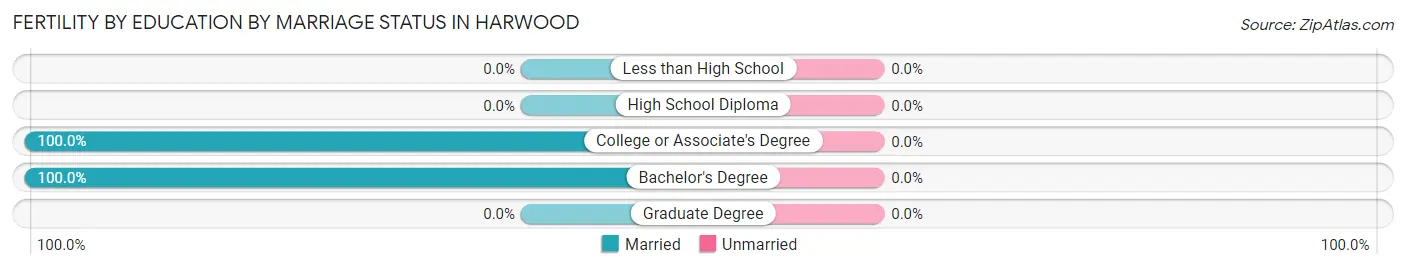
| Educational Attainment | Married | Unmarried |
| Less than High School | 0 (0.0%) | 0 (0.0%) |
| High School Diploma | 0 (0.0%) | 0 (0.0%) |
| College or Associate's Degree | 4 (100.0%) | 0 (0.0%) |
| Bachelor's Degree | 2 (100.0%) | 0 (0.0%) |
| Graduate Degree | 0 (0.0%) | 0 (0.0%) |
| Total | 6 (100.0%) | 0 (0.0%) |
Employment Characteristics in Harwood
Employment by Class of Employer in Harwood
Among the 375 employed individuals in Harwood, private company employees (243 | 64.8%), local government employees (50 | 13.3%), and not-for-profit organizations (29 | 7.7%) make up the most common classes of employment.
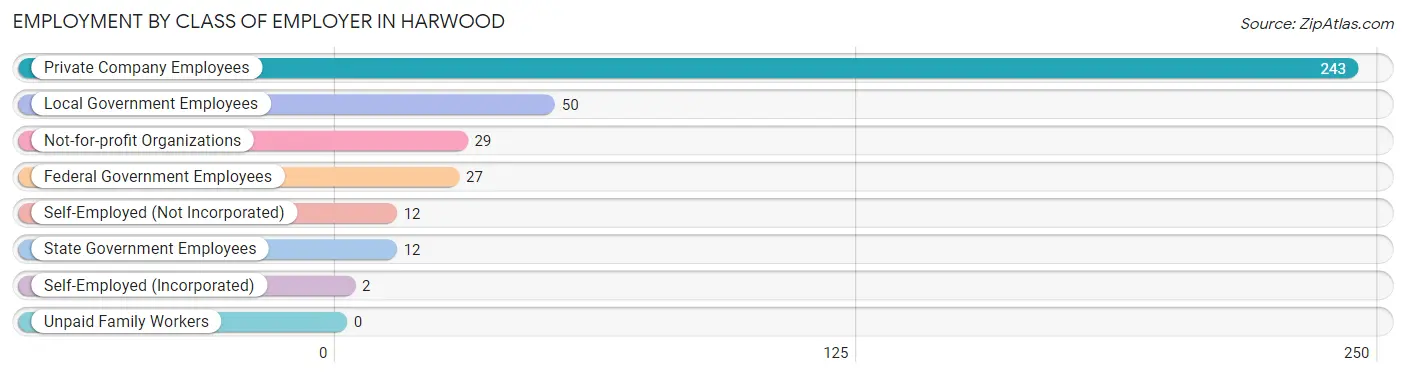
| Employer Class | # Employees | % Employees |
| Private Company Employees | 243 | 64.8% |
| Self-Employed (Incorporated) | 2 | 0.5% |
| Self-Employed (Not Incorporated) | 12 | 3.2% |
| Not-for-profit Organizations | 29 | 7.7% |
| Local Government Employees | 50 | 13.3% |
| State Government Employees | 12 | 3.2% |
| Federal Government Employees | 27 | 7.2% |
| Unpaid Family Workers | 0 | 0.0% |
| Total | 375 | 100.0% |
Employment Status by Age in Harwood
According to the labor force statistics for Harwood, out of the total population over 16 years of age (518), 73.9% or 383 individuals are in the labor force, with 0.8% or 3 of them unemployed. The age group with the highest labor force participation rate is 25 to 29 years, with 100.0% or 15 individuals in the labor force. Within the labor force, the 65 to 74 years age range has the highest percentage of unemployed individuals, with 15.0% or 3 of them being unemployed.
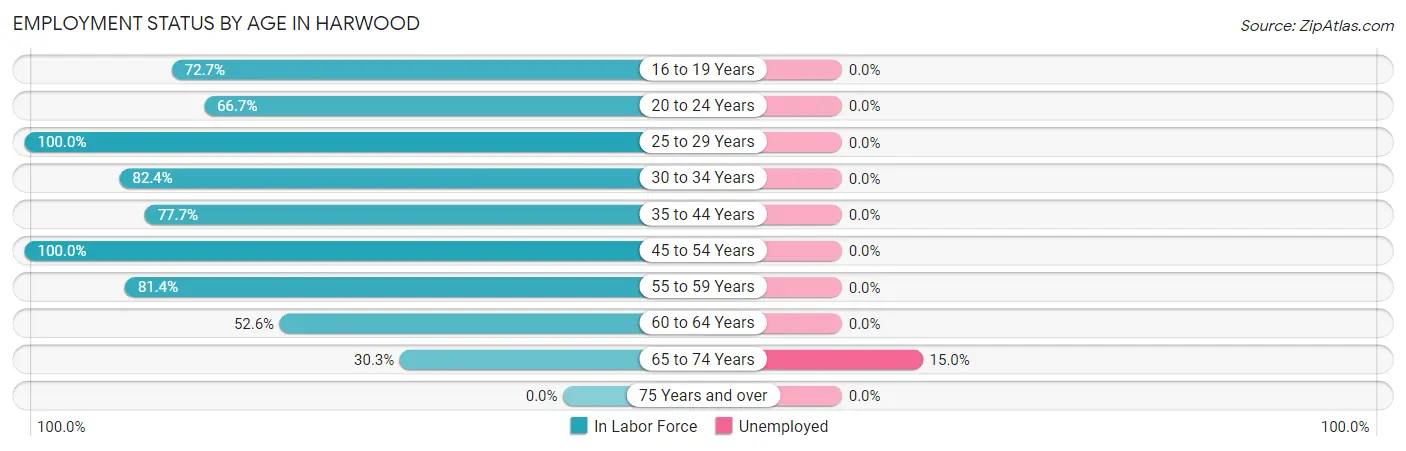
| Age Bracket | In Labor Force | Unemployed |
| 16 to 19 Years | 16 (72.7%) | 0 (0.0%) |
| 20 to 24 Years | 10 (66.7%) | 0 (0.0%) |
| 25 to 29 Years | 15 (100.0%) | 0 (0.0%) |
| 30 to 34 Years | 42 (82.4%) | 0 (0.0%) |
| 35 to 44 Years | 108 (77.7%) | 0 (0.0%) |
| 45 to 54 Years | 104 (100.0%) | 0 (0.0%) |
| 55 to 59 Years | 48 (81.4%) | 0 (0.0%) |
| 60 to 64 Years | 20 (52.6%) | 0 (0.0%) |
| 65 to 74 Years | 20 (30.3%) | 3 (15.0%) |
| 75 Years and over | 0 (0.0%) | 0 (0.0%) |
| Total | 383 (73.9%) | 3 (0.8%) |
Employment Status by Educational Attainment in Harwood
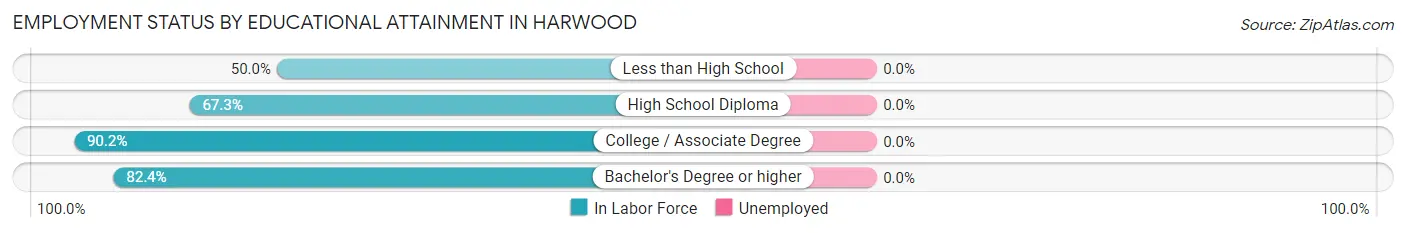
| Educational Attainment | In Labor Force | Unemployed |
| Less than High School | 4 (50.0%) | 0 (0.0%) |
| High School Diploma | 35 (67.3%) | 0 (0.0%) |
| College / Associate Degree | 148 (90.2%) | 0 (0.0%) |
| Bachelor's Degree or higher | 150 (82.4%) | 0 (0.0%) |
| Total | 337 (83.0%) | 0 (0.0%) |
Employment Occupations by Sex in Harwood
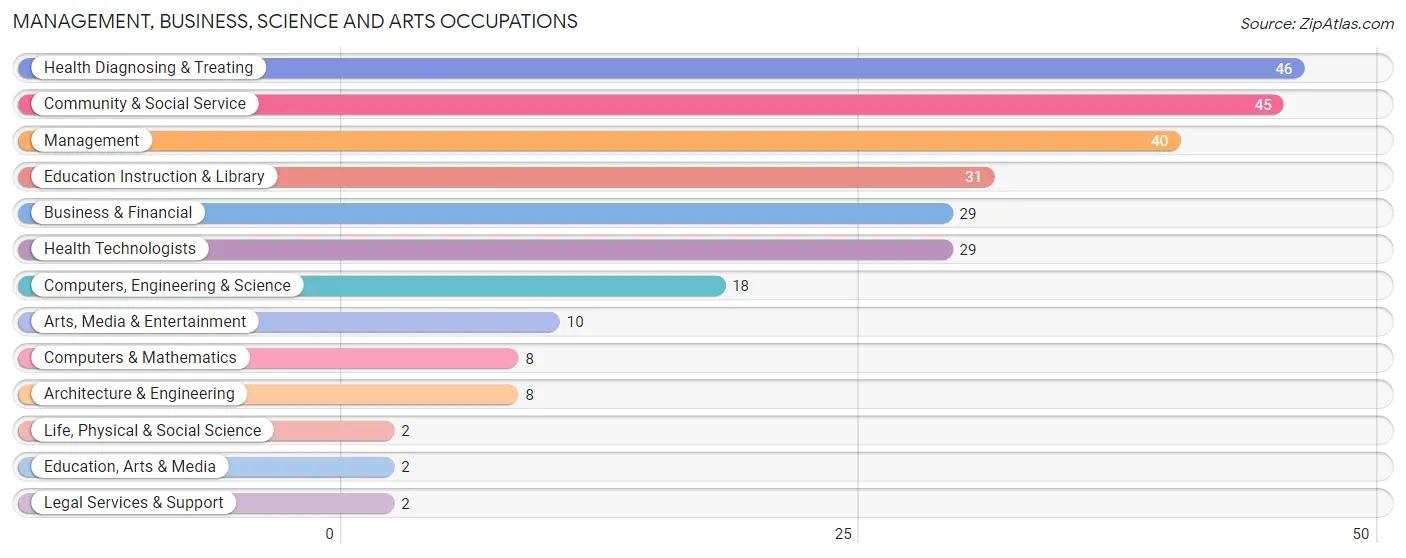
Management, Business, Science and Arts Occupations
The most common Management, Business, Science and Arts occupations in Harwood are Health Diagnosing & Treating (46 | 12.1%), Community & Social Service (45 | 11.8%), Management (40 | 10.5%), Education Instruction & Library (31 | 8.2%), and Business & Financial (29 | 7.6%).
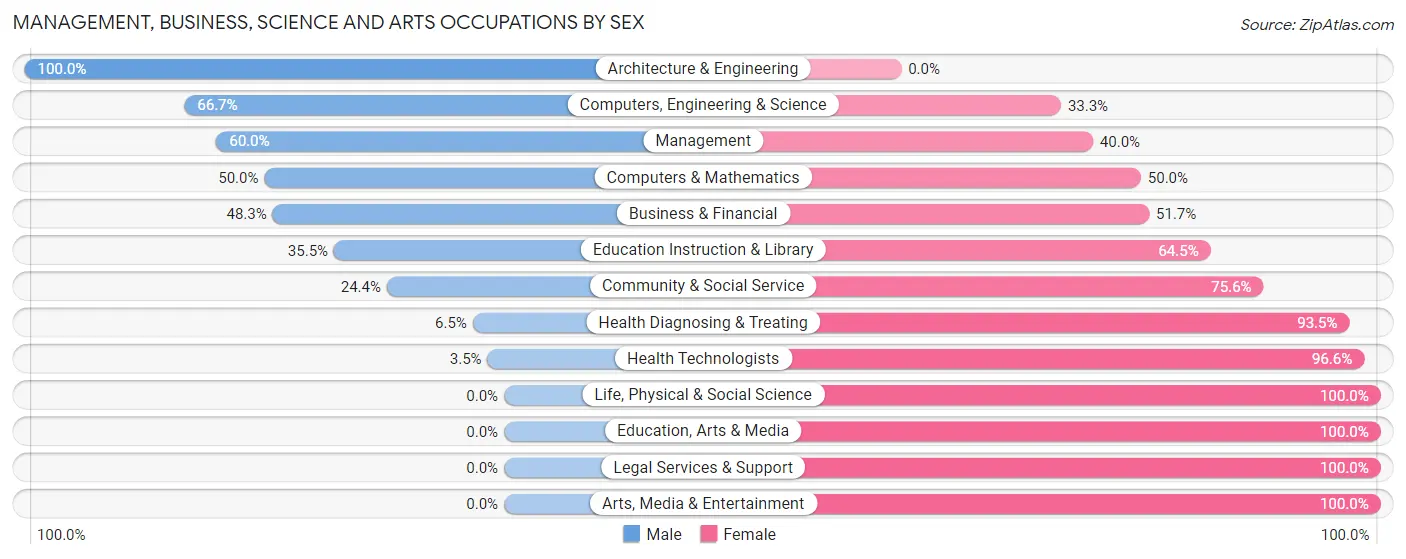
Management, Business, Science and Arts Occupations by Sex
Within the Management, Business, Science and Arts occupations in Harwood, the most male-oriented occupations are Architecture & Engineering (100.0%), Computers, Engineering & Science (66.7%), and Management (60.0%), while the most female-oriented occupations are Life, Physical & Social Science (100.0%), Education, Arts & Media (100.0%), and Legal Services & Support (100.0%).
| Occupation | Male | Female |
| Management | 24 (60.0%) | 16 (40.0%) |
| Business & Financial | 14 (48.3%) | 15 (51.7%) |
| Computers, Engineering & Science | 12 (66.7%) | 6 (33.3%) |
| Computers & Mathematics | 4 (50.0%) | 4 (50.0%) |
| Architecture & Engineering | 8 (100.0%) | 0 (0.0%) |
| Life, Physical & Social Science | 0 (0.0%) | 2 (100.0%) |
| Community & Social Service | 11 (24.4%) | 34 (75.6%) |
| Education, Arts & Media | 0 (0.0%) | 2 (100.0%) |
| Legal Services & Support | 0 (0.0%) | 2 (100.0%) |
| Education Instruction & Library | 11 (35.5%) | 20 (64.5%) |
| Arts, Media & Entertainment | 0 (0.0%) | 10 (100.0%) |
| Health Diagnosing & Treating | 3 (6.5%) | 43 (93.5%) |
| Health Technologists | 1 (3.5%) | 28 (96.6%) |
| Total (Category) | 64 (36.0%) | 114 (64.0%) |
| Total (Overall) | 209 (55.0%) | 171 (45.0%) |
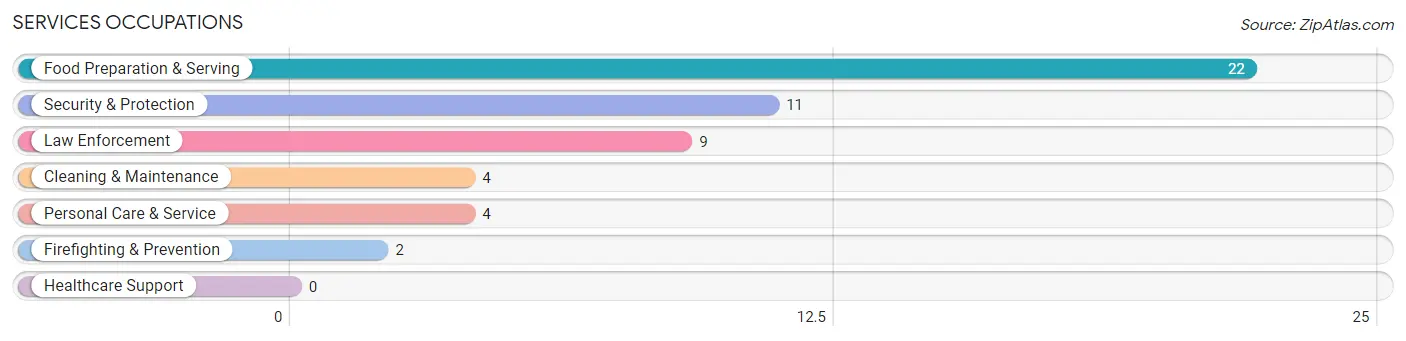
Services Occupations
The most common Services occupations in Harwood are Food Preparation & Serving (22 | 5.8%), Security & Protection (11 | 2.9%), Law Enforcement (9 | 2.4%), Cleaning & Maintenance (4 | 1.1%), and Personal Care & Service (4 | 1.1%).
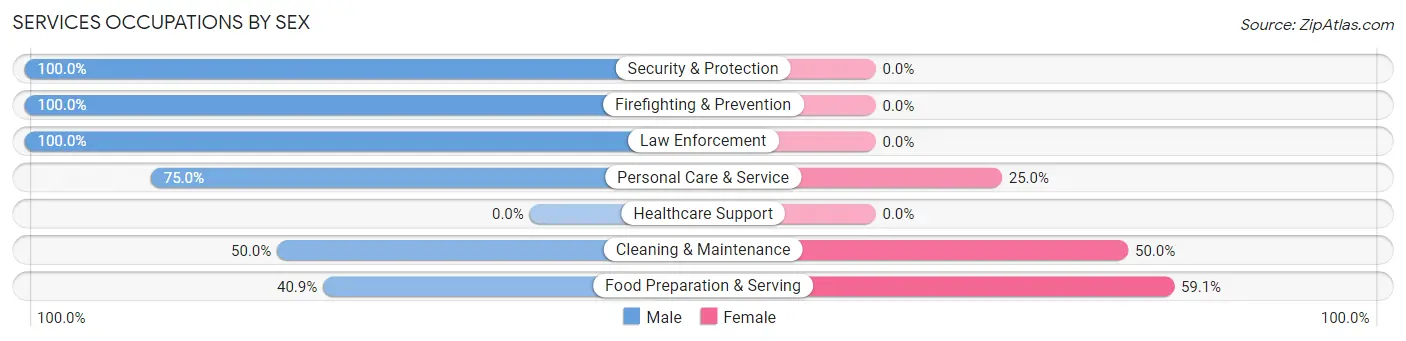
Services Occupations by Sex
Within the Services occupations in Harwood, the most male-oriented occupations are Security & Protection (100.0%), Firefighting & Prevention (100.0%), and Law Enforcement (100.0%), while the most female-oriented occupations are Food Preparation & Serving (59.1%), Cleaning & Maintenance (50.0%), and Personal Care & Service (25.0%).
| Occupation | Male | Female |
| Healthcare Support | 0 (0.0%) | 0 (0.0%) |
| Security & Protection | 11 (100.0%) | 0 (0.0%) |
| Firefighting & Prevention | 2 (100.0%) | 0 (0.0%) |
| Law Enforcement | 9 (100.0%) | 0 (0.0%) |
| Food Preparation & Serving | 9 (40.9%) | 13 (59.1%) |
| Cleaning & Maintenance | 2 (50.0%) | 2 (50.0%) |
| Personal Care & Service | 3 (75.0%) | 1 (25.0%) |
| Total (Category) | 25 (61.0%) | 16 (39.0%) |
| Total (Overall) | 209 (55.0%) | 171 (45.0%) |
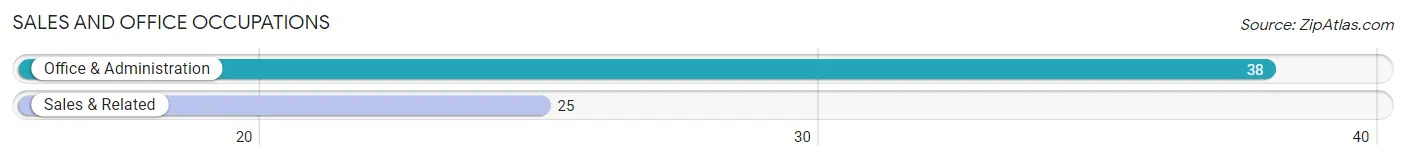
Sales and Office Occupations
The most common Sales and Office occupations in Harwood are Office & Administration (38 | 10.0%), and Sales & Related (25 | 6.6%).
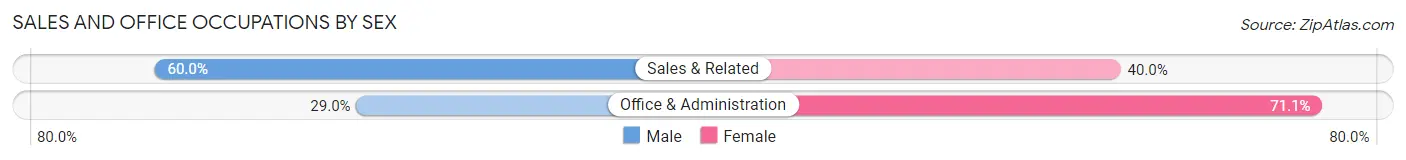
Sales and Office Occupations by Sex
| Occupation | Male | Female |
| Sales & Related | 15 (60.0%) | 10 (40.0%) |
| Office & Administration | 11 (28.9%) | 27 (71.1%) |
| Total (Category) | 26 (41.3%) | 37 (58.7%) |
| Total (Overall) | 209 (55.0%) | 171 (45.0%) |
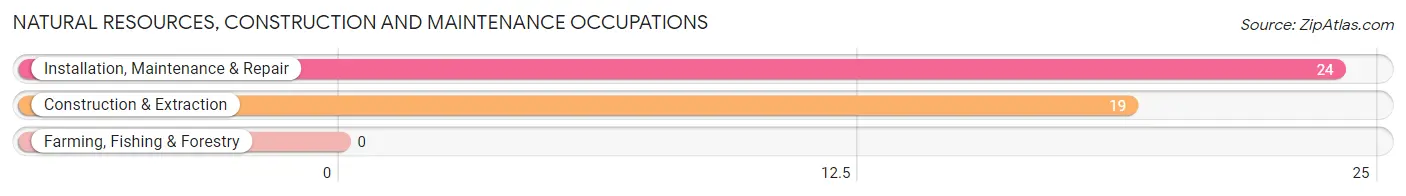
Natural Resources, Construction and Maintenance Occupations
The most common Natural Resources, Construction and Maintenance occupations in Harwood are Installation, Maintenance & Repair (24 | 6.3%), and Construction & Extraction (19 | 5.0%).
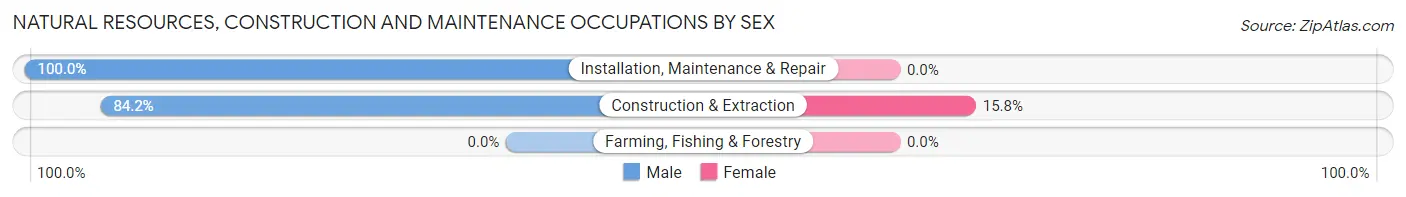
Natural Resources, Construction and Maintenance Occupations by Sex
| Occupation | Male | Female |
| Farming, Fishing & Forestry | 0 (0.0%) | 0 (0.0%) |
| Construction & Extraction | 16 (84.2%) | 3 (15.8%) |
| Installation, Maintenance & Repair | 24 (100.0%) | 0 (0.0%) |
| Total (Category) | 40 (93.0%) | 3 (7.0%) |
| Total (Overall) | 209 (55.0%) | 171 (45.0%) |
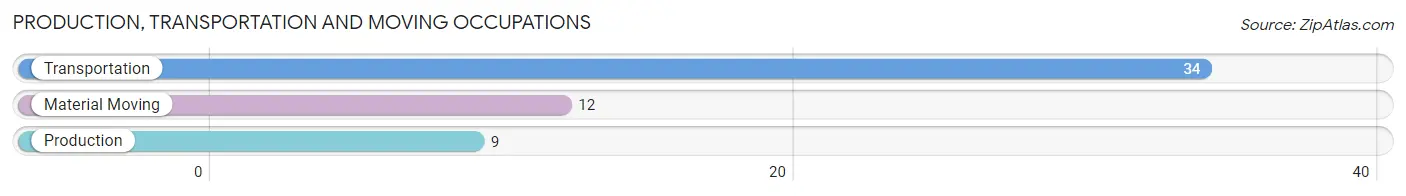
Production, Transportation and Moving Occupations
The most common Production, Transportation and Moving occupations in Harwood are Transportation (34 | 8.9%), Material Moving (12 | 3.2%), and Production (9 | 2.4%).
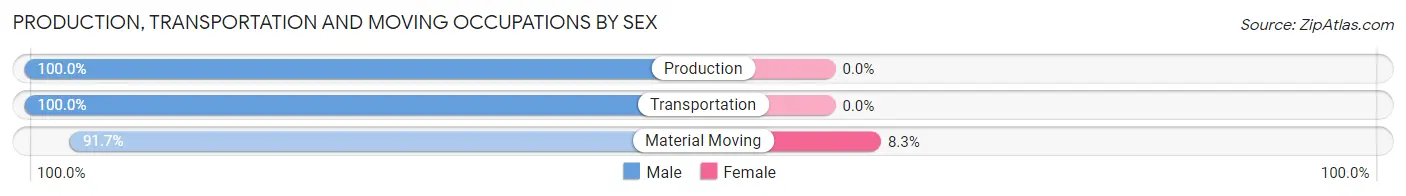
Production, Transportation and Moving Occupations by Sex
| Occupation | Male | Female |
| Production | 9 (100.0%) | 0 (0.0%) |
| Transportation | 34 (100.0%) | 0 (0.0%) |
| Material Moving | 11 (91.7%) | 1 (8.3%) |
| Total (Category) | 54 (98.2%) | 1 (1.8%) |
| Total (Overall) | 209 (55.0%) | 171 (45.0%) |
Employment Industries by Sex in Harwood
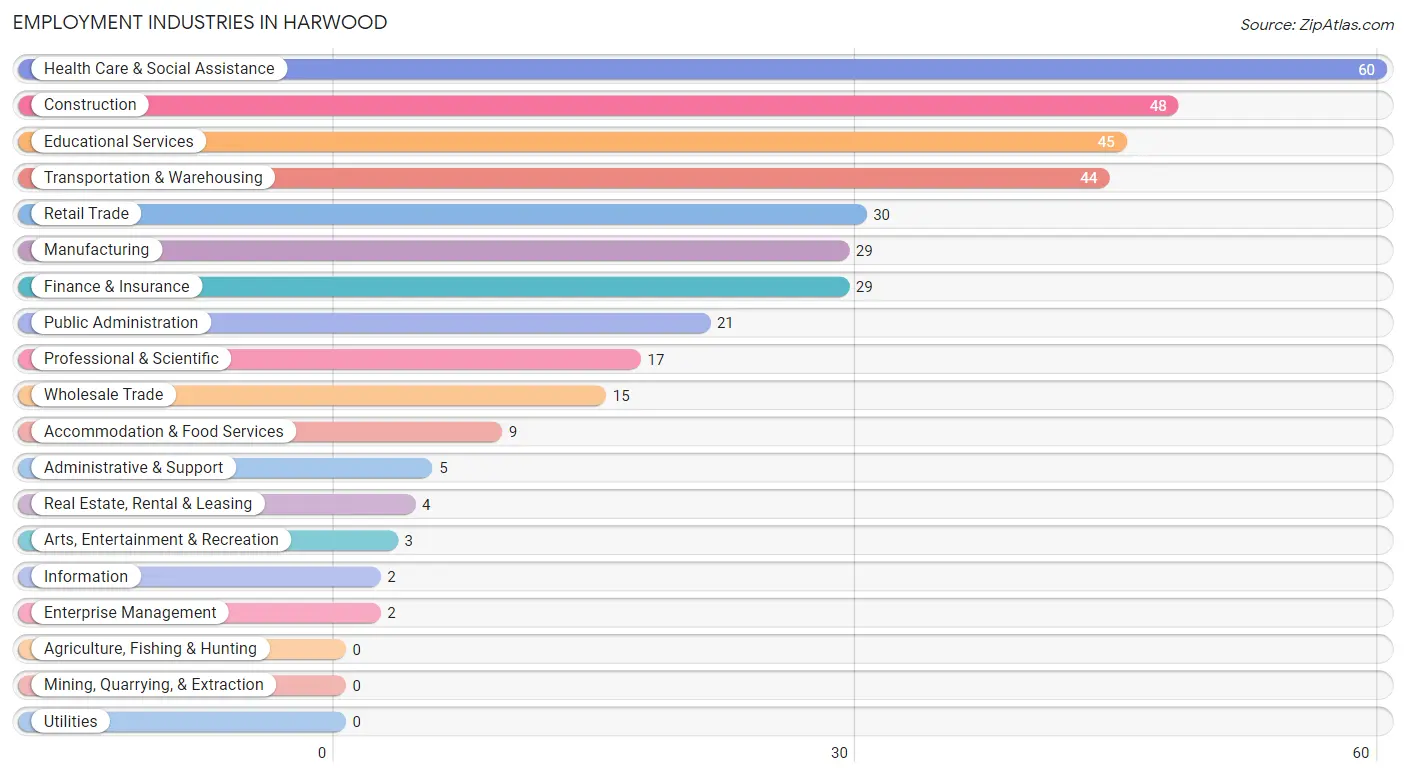
Employment Industries in Harwood
The major employment industries in Harwood include Health Care & Social Assistance (60 | 15.8%), Construction (48 | 12.6%), Educational Services (45 | 11.8%), Transportation & Warehousing (44 | 11.6%), and Retail Trade (30 | 7.9%).
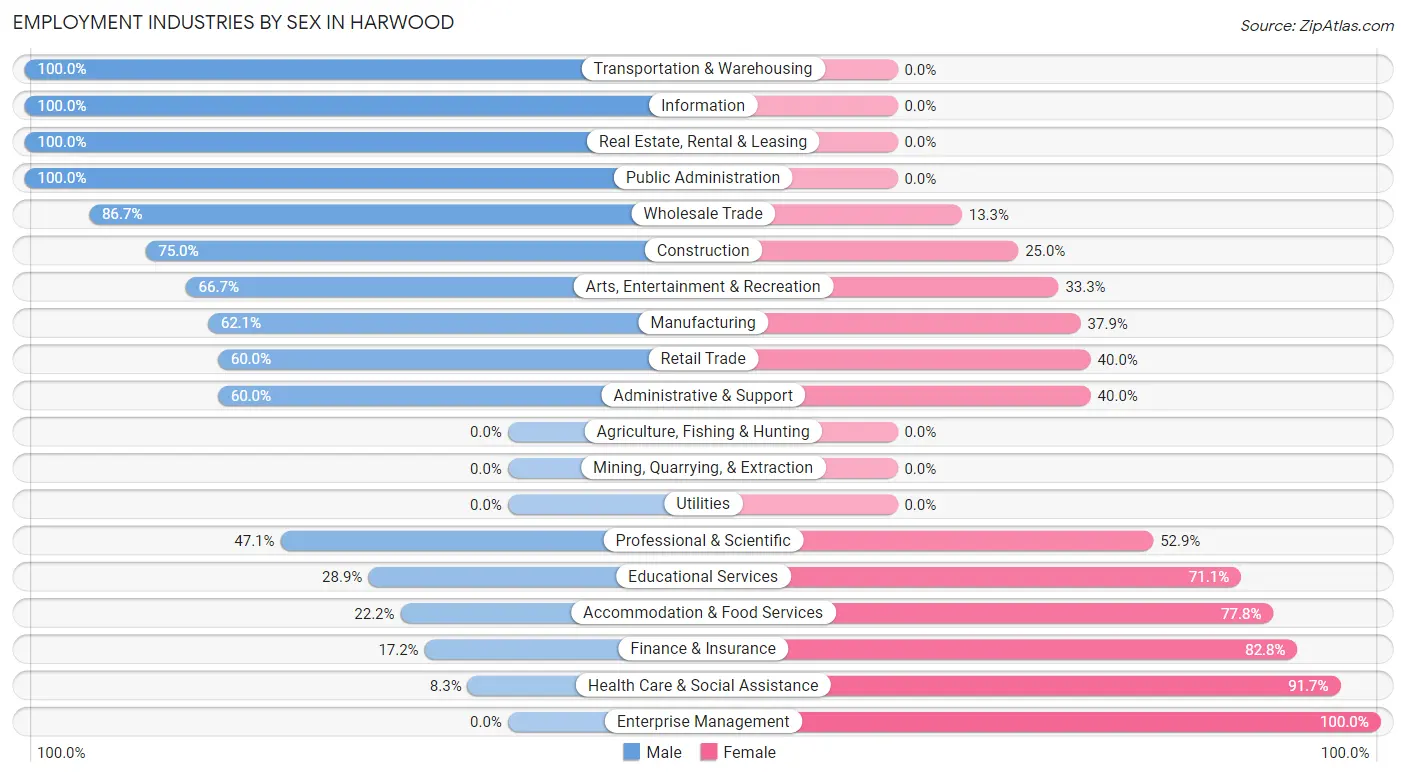
Employment Industries by Sex in Harwood
The Harwood industries that see more men than women are Transportation & Warehousing (100.0%), Information (100.0%), and Real Estate, Rental & Leasing (100.0%), whereas the industries that tend to have a higher number of women are Enterprise Management (100.0%), Health Care & Social Assistance (91.7%), and Finance & Insurance (82.8%).
| Industry | Male | Female |
| Agriculture, Fishing & Hunting | 0 (0.0%) | 0 (0.0%) |
| Mining, Quarrying, & Extraction | 0 (0.0%) | 0 (0.0%) |
| Construction | 36 (75.0%) | 12 (25.0%) |
| Manufacturing | 18 (62.1%) | 11 (37.9%) |
| Wholesale Trade | 13 (86.7%) | 2 (13.3%) |
| Retail Trade | 18 (60.0%) | 12 (40.0%) |
| Transportation & Warehousing | 44 (100.0%) | 0 (0.0%) |
| Utilities | 0 (0.0%) | 0 (0.0%) |
| Information | 2 (100.0%) | 0 (0.0%) |
| Finance & Insurance | 5 (17.2%) | 24 (82.8%) |
| Real Estate, Rental & Leasing | 4 (100.0%) | 0 (0.0%) |
| Professional & Scientific | 8 (47.1%) | 9 (52.9%) |
| Enterprise Management | 0 (0.0%) | 2 (100.0%) |
| Administrative & Support | 3 (60.0%) | 2 (40.0%) |
| Educational Services | 13 (28.9%) | 32 (71.1%) |
| Health Care & Social Assistance | 5 (8.3%) | 55 (91.7%) |
| Arts, Entertainment & Recreation | 2 (66.7%) | 1 (33.3%) |
| Accommodation & Food Services | 2 (22.2%) | 7 (77.8%) |
| Public Administration | 21 (100.0%) | 0 (0.0%) |
| Total | 209 (55.0%) | 171 (45.0%) |
Education in Harwood
School Enrollment in Harwood
The most common levels of schooling among the 232 students in Harwood are middle school (103 | 44.4%), elementary school (57 | 24.6%), and high school (32 | 13.8%).
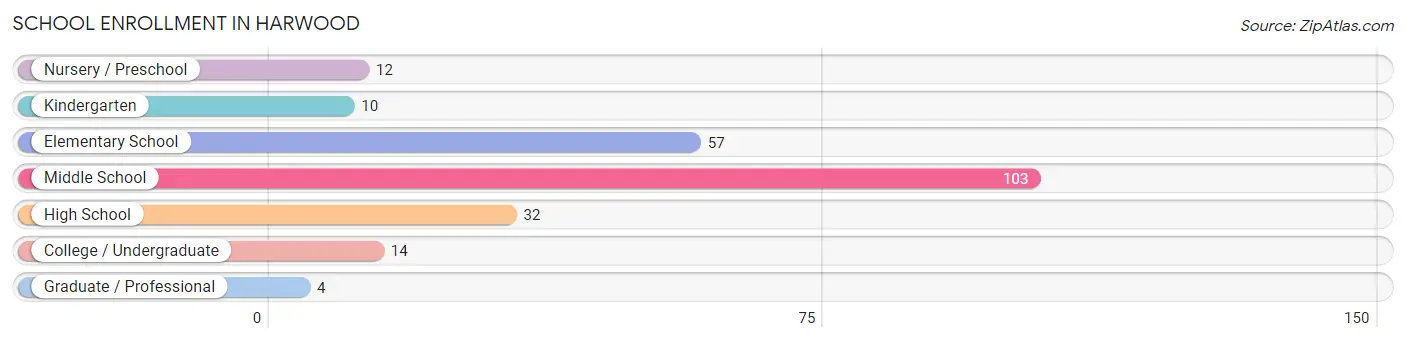
| School Level | # Students | % Students |
| Nursery / Preschool | 12 | 5.2% |
| Kindergarten | 10 | 4.3% |
| Elementary School | 57 | 24.6% |
| Middle School | 103 | 44.4% |
| High School | 32 | 13.8% |
| College / Undergraduate | 14 | 6.0% |
| Graduate / Professional | 4 | 1.7% |
| Total | 232 | 100.0% |
School Enrollment by Age by Funding Source in Harwood
Out of a total of 232 students who are enrolled in schools in Harwood, 77 (33.2%) attend a private institution, while the remaining 155 (66.8%) are enrolled in public schools. The age group of 35 years and over has the highest likelihood of being enrolled in private schools, with 3 (60.0% in the age bracket) enrolled. Conversely, the age group of 3 to 4 year olds has the lowest likelihood of being enrolled in a private school, with 4 (100.0% in the age bracket) attending a public institution.
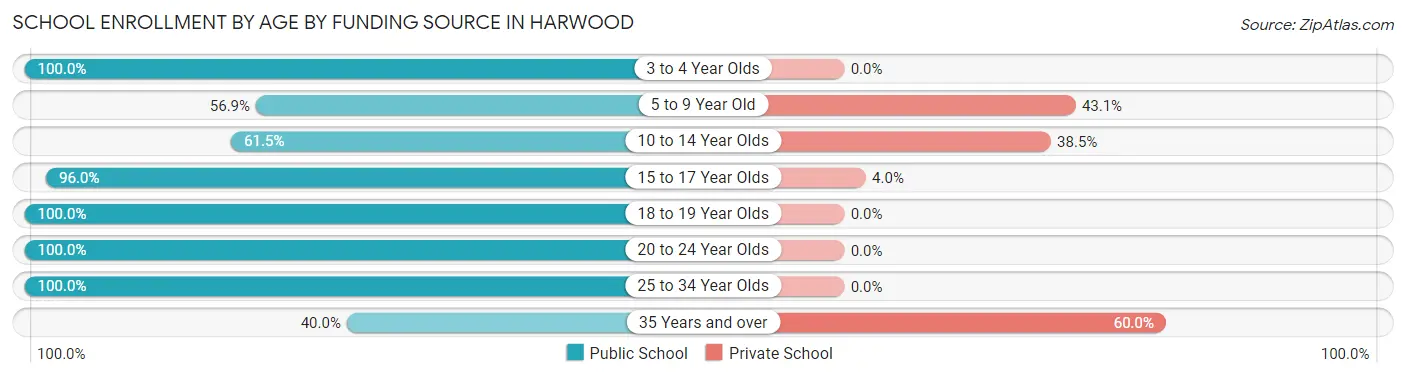
| Age Bracket | Public School | Private School |
| 3 to 4 Year Olds | 4 (100.0%) | 0 (0.0%) |
| 5 to 9 Year Old | 37 (56.9%) | 28 (43.1%) |
| 10 to 14 Year Olds | 72 (61.5%) | 45 (38.5%) |
| 15 to 17 Year Olds | 24 (96.0%) | 1 (4.0%) |
| 18 to 19 Year Olds | 7 (100.0%) | 0 (0.0%) |
| 20 to 24 Year Olds | 5 (100.0%) | 0 (0.0%) |
| 25 to 34 Year Olds | 4 (100.0%) | 0 (0.0%) |
| 35 Years and over | 2 (40.0%) | 3 (60.0%) |
| Total | 155 (66.8%) | 77 (33.2%) |
Educational Attainment by Field of Study in Harwood
Arts & humanities (48 | 22.5%), business (40 | 18.8%), science & technology (34 | 16.0%), communications (26 | 12.2%), and education (24 | 11.3%) are the most common fields of study among 213 individuals in Harwood who have obtained a bachelor's degree or higher.
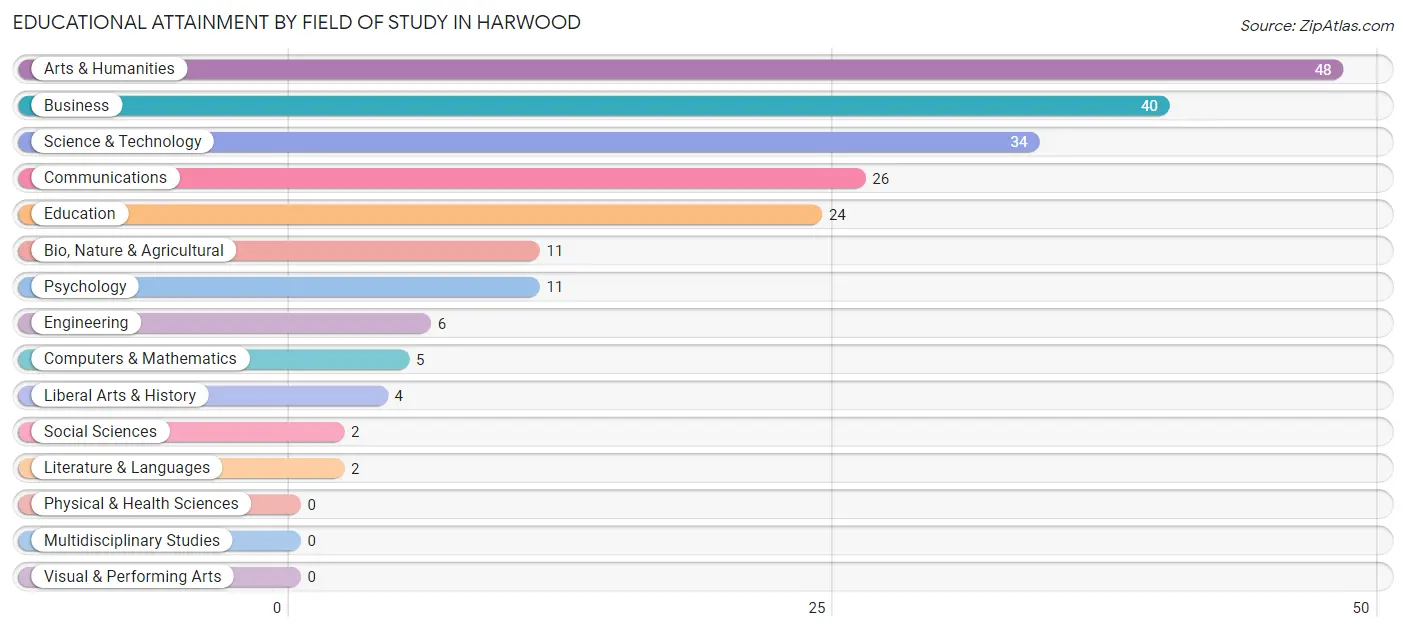
| Field of Study | # Graduates | % Graduates |
| Computers & Mathematics | 5 | 2.4% |
| Bio, Nature & Agricultural | 11 | 5.2% |
| Physical & Health Sciences | 0 | 0.0% |
| Psychology | 11 | 5.2% |
| Social Sciences | 2 | 0.9% |
| Engineering | 6 | 2.8% |
| Multidisciplinary Studies | 0 | 0.0% |
| Science & Technology | 34 | 16.0% |
| Business | 40 | 18.8% |
| Education | 24 | 11.3% |
| Literature & Languages | 2 | 0.9% |
| Liberal Arts & History | 4 | 1.9% |
| Visual & Performing Arts | 0 | 0.0% |
| Communications | 26 | 12.2% |
| Arts & Humanities | 48 | 22.5% |
| Total | 213 | 100.0% |
Transportation & Commute in Harwood
Vehicle Availability by Sex in Harwood
The most prevalent vehicle ownership categories in Harwood are males with 2 vehicles (92, accounting for 44.0%) and females with 2 vehicles (70, making up 55.4%).
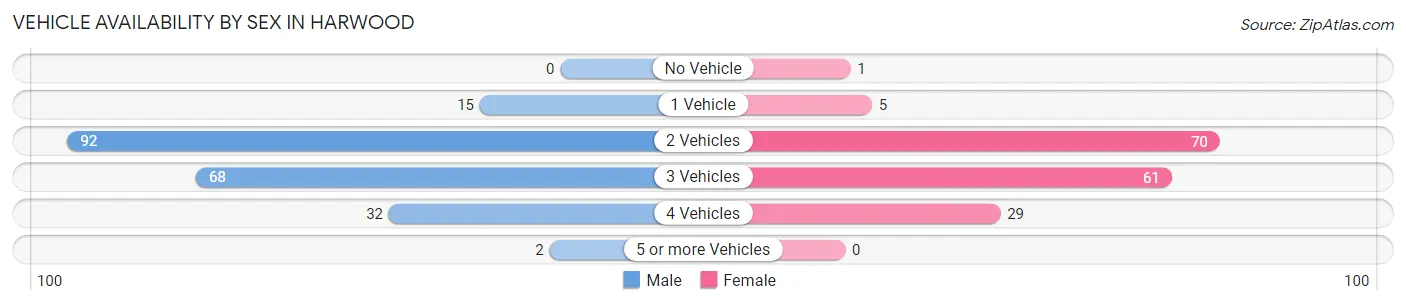
| Vehicles Available | Male | Female |
| No Vehicle | 0 (0.0%) | 1 (0.6%) |
| 1 Vehicle | 15 (7.2%) | 5 (3.0%) |
| 2 Vehicles | 92 (44.0%) | 70 (42.2%) |
| 3 Vehicles | 68 (32.5%) | 61 (36.7%) |
| 4 Vehicles | 32 (15.3%) | 29 (17.5%) |
| 5 or more Vehicles | 2 (1.0%) | 0 (0.0%) |
| Total | 209 (100.0%) | 166 (100.0%) |
Commute Time in Harwood
The most frequently occuring commute durations in Harwood are 15 to 19 minutes (125 commuters, 35.5%), 20 to 24 minutes (71 commuters, 20.2%), and 10 to 14 minutes (61 commuters, 17.3%).
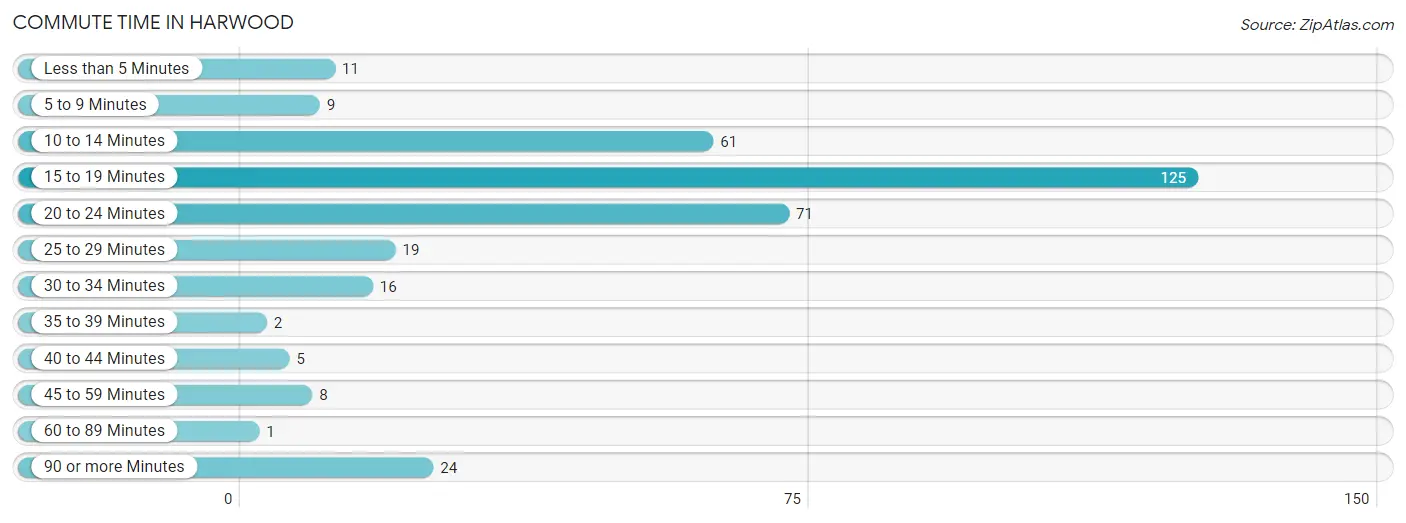
| Commute Time | # Commuters | % Commuters |
| Less than 5 Minutes | 11 | 3.1% |
| 5 to 9 Minutes | 9 | 2.6% |
| 10 to 14 Minutes | 61 | 17.3% |
| 15 to 19 Minutes | 125 | 35.5% |
| 20 to 24 Minutes | 71 | 20.2% |
| 25 to 29 Minutes | 19 | 5.4% |
| 30 to 34 Minutes | 16 | 4.5% |
| 35 to 39 Minutes | 2 | 0.6% |
| 40 to 44 Minutes | 5 | 1.4% |
| 45 to 59 Minutes | 8 | 2.3% |
| 60 to 89 Minutes | 1 | 0.3% |
| 90 or more Minutes | 24 | 6.8% |
Commute Time by Sex in Harwood
The most common commute times in Harwood are 15 to 19 minutes (69 commuters, 33.7%) for males and 15 to 19 minutes (56 commuters, 38.1%) for females.
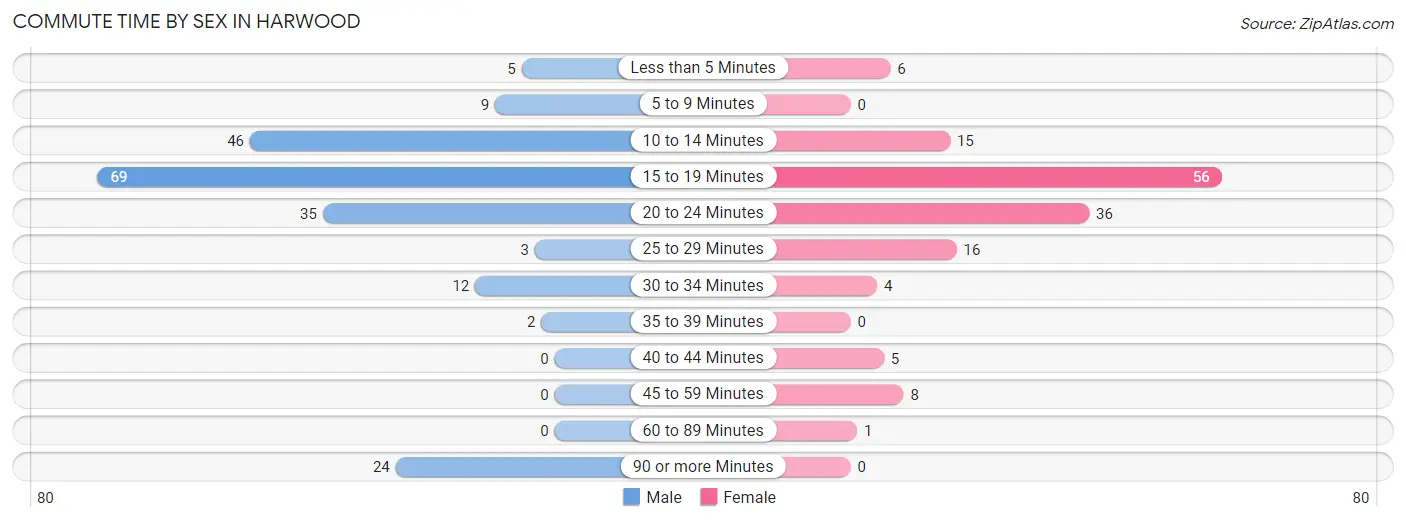
| Commute Time | Male | Female |
| Less than 5 Minutes | 5 (2.4%) | 6 (4.1%) |
| 5 to 9 Minutes | 9 (4.4%) | 0 (0.0%) |
| 10 to 14 Minutes | 46 (22.4%) | 15 (10.2%) |
| 15 to 19 Minutes | 69 (33.7%) | 56 (38.1%) |
| 20 to 24 Minutes | 35 (17.1%) | 36 (24.5%) |
| 25 to 29 Minutes | 3 (1.5%) | 16 (10.9%) |
| 30 to 34 Minutes | 12 (5.9%) | 4 (2.7%) |
| 35 to 39 Minutes | 2 (1.0%) | 0 (0.0%) |
| 40 to 44 Minutes | 0 (0.0%) | 5 (3.4%) |
| 45 to 59 Minutes | 0 (0.0%) | 8 (5.4%) |
| 60 to 89 Minutes | 0 (0.0%) | 1 (0.7%) |
| 90 or more Minutes | 24 (11.7%) | 0 (0.0%) |
Time of Departure to Work by Sex in Harwood
The most frequent times of departure to work in Harwood are 6:30 AM to 6:59 AM (52, 25.4%) for males and 7:30 AM to 7:59 AM (43, 29.2%) for females.
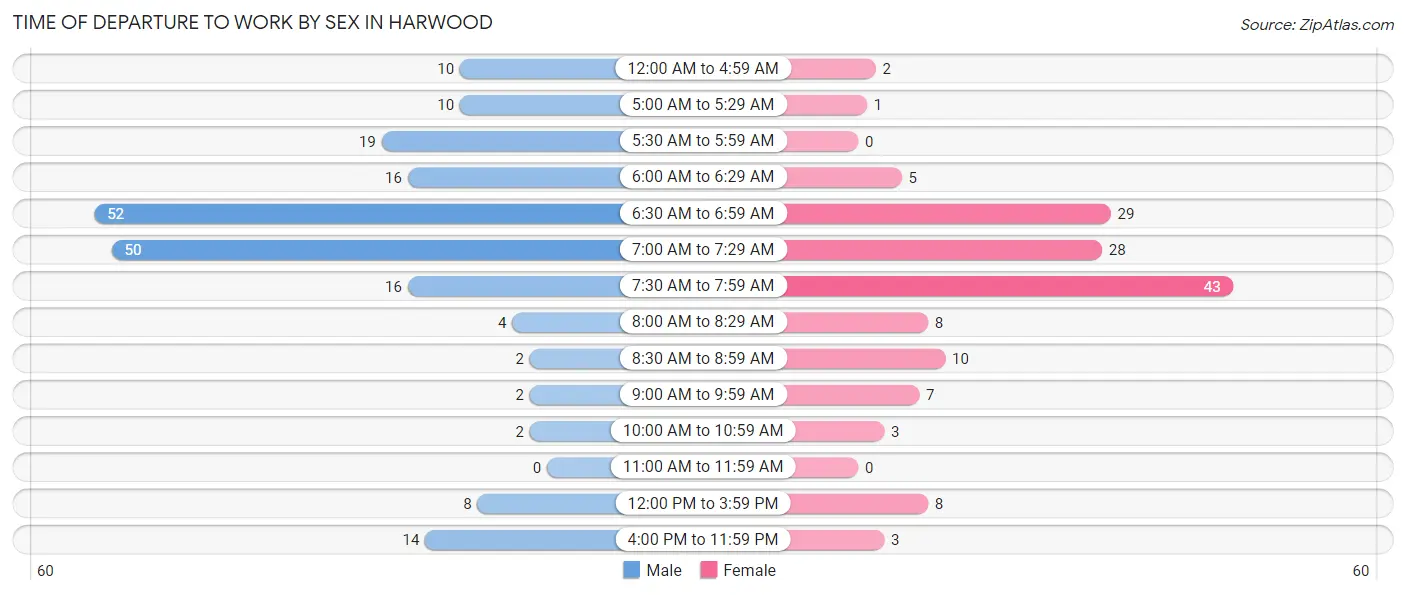
| Time of Departure | Male | Female |
| 12:00 AM to 4:59 AM | 10 (4.9%) | 2 (1.4%) |
| 5:00 AM to 5:29 AM | 10 (4.9%) | 1 (0.7%) |
| 5:30 AM to 5:59 AM | 19 (9.3%) | 0 (0.0%) |
| 6:00 AM to 6:29 AM | 16 (7.8%) | 5 (3.4%) |
| 6:30 AM to 6:59 AM | 52 (25.4%) | 29 (19.7%) |
| 7:00 AM to 7:29 AM | 50 (24.4%) | 28 (19.1%) |
| 7:30 AM to 7:59 AM | 16 (7.8%) | 43 (29.2%) |
| 8:00 AM to 8:29 AM | 4 (1.9%) | 8 (5.4%) |
| 8:30 AM to 8:59 AM | 2 (1.0%) | 10 (6.8%) |
| 9:00 AM to 9:59 AM | 2 (1.0%) | 7 (4.8%) |
| 10:00 AM to 10:59 AM | 2 (1.0%) | 3 (2.0%) |
| 11:00 AM to 11:59 AM | 0 (0.0%) | 0 (0.0%) |
| 12:00 PM to 3:59 PM | 8 (3.9%) | 8 (5.4%) |
| 4:00 PM to 11:59 PM | 14 (6.8%) | 3 (2.0%) |
| Total | 205 (100.0%) | 147 (100.0%) |
Housing Occupancy in Harwood
Occupancy by Ownership in Harwood
Of the total 248 dwellings in Harwood, owner-occupied units account for 246 (99.2%), while renter-occupied units make up 2 (0.8%).
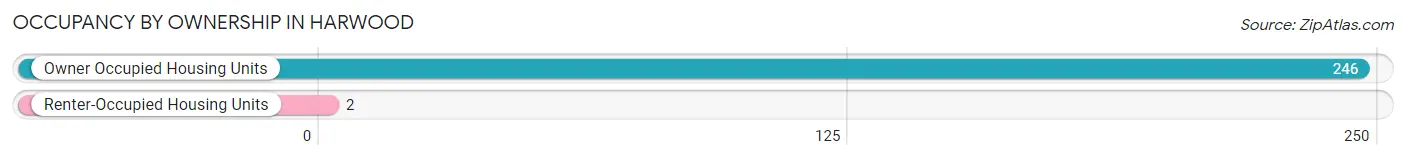
| Occupancy | # Housing Units | % Housing Units |
| Owner Occupied Housing Units | 246 | 99.2% |
| Renter-Occupied Housing Units | 2 | 0.8% |
| Total Occupied Housing Units | 248 | 100.0% |
Occupancy by Household Size in Harwood
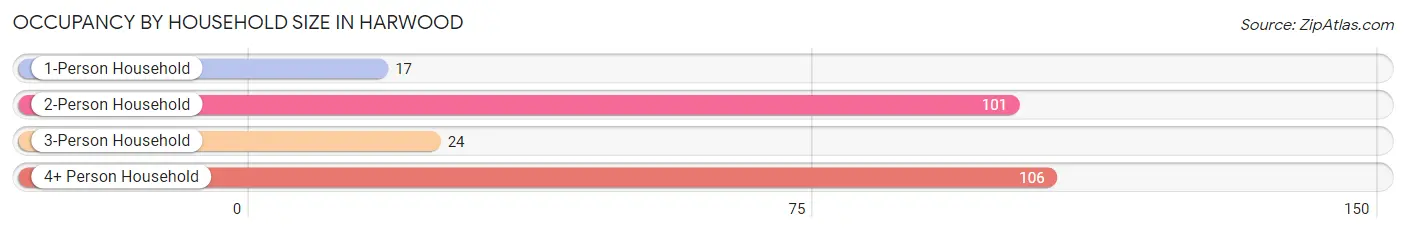
| Household Size | # Housing Units | % Housing Units |
| 1-Person Household | 17 | 6.9% |
| 2-Person Household | 101 | 40.7% |
| 3-Person Household | 24 | 9.7% |
| 4+ Person Household | 106 | 42.7% |
| Total Housing Units | 248 | 100.0% |
Occupancy by Ownership by Household Size in Harwood
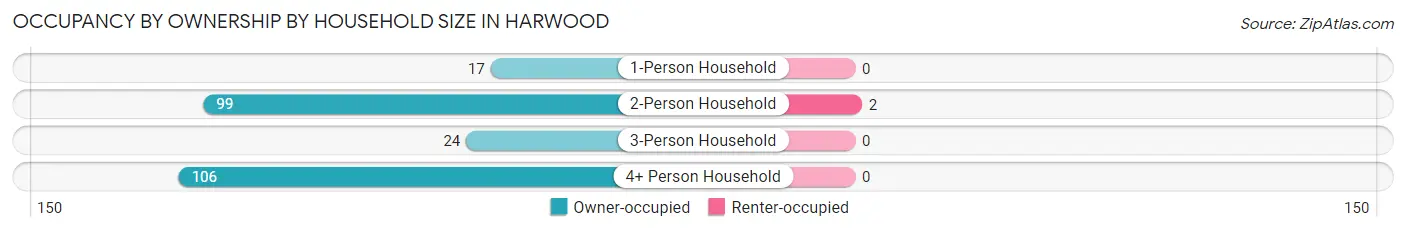
| Household Size | Owner-occupied | Renter-occupied |
| 1-Person Household | 17 (100.0%) | 0 (0.0%) |
| 2-Person Household | 99 (98.0%) | 2 (2.0%) |
| 3-Person Household | 24 (100.0%) | 0 (0.0%) |
| 4+ Person Household | 106 (100.0%) | 0 (0.0%) |
| Total Housing Units | 246 (99.2%) | 2 (0.8%) |
Occupancy by Educational Attainment in Harwood
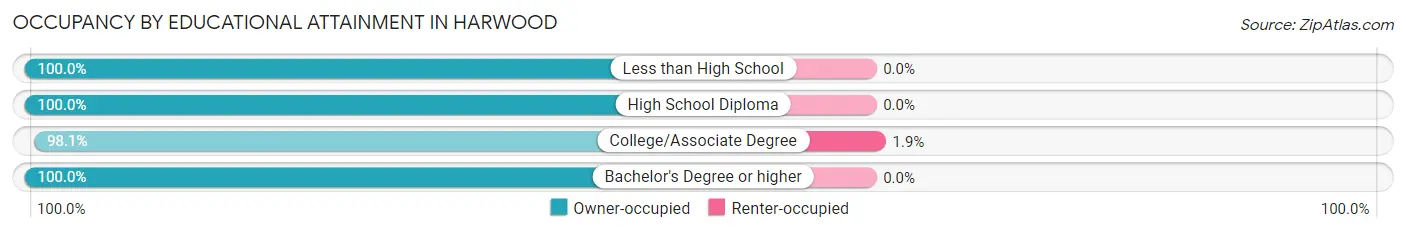
| Household Size | Owner-occupied | Renter-occupied |
| Less than High School | 3 (100.0%) | 0 (0.0%) |
| High School Diploma | 32 (100.0%) | 0 (0.0%) |
| College/Associate Degree | 105 (98.1%) | 2 (1.9%) |
| Bachelor's Degree or higher | 106 (100.0%) | 0 (0.0%) |
Occupancy by Age of Householder in Harwood
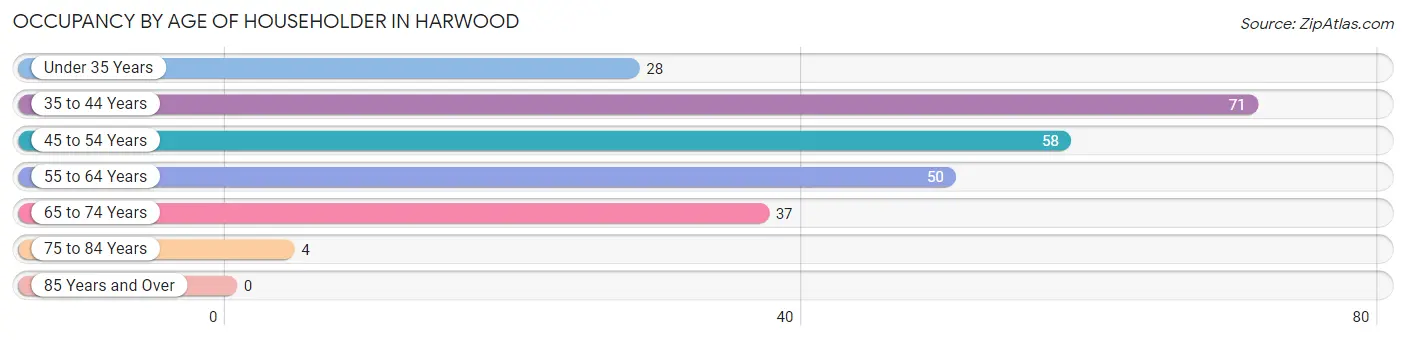
| Age Bracket | # Households | % Households |
| Under 35 Years | 28 | 11.3% |
| 35 to 44 Years | 71 | 28.6% |
| 45 to 54 Years | 58 | 23.4% |
| 55 to 64 Years | 50 | 20.2% |
| 65 to 74 Years | 37 | 14.9% |
| 75 to 84 Years | 4 | 1.6% |
| 85 Years and Over | 0 | 0.0% |
| Total | 248 | 100.0% |
Housing Finances in Harwood
Median Income by Occupancy in Harwood
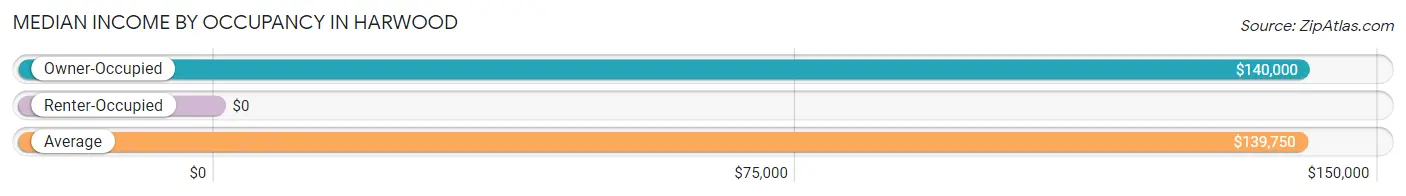
| Occupancy Type | # Households | Median Income |
| Owner-Occupied | 246 (99.2%) | $140,000 |
| Renter-Occupied | 2 (0.8%) | $0 |
| Average | 248 (100.0%) | $139,750 |
Occupancy by Householder Income Bracket in Harwood
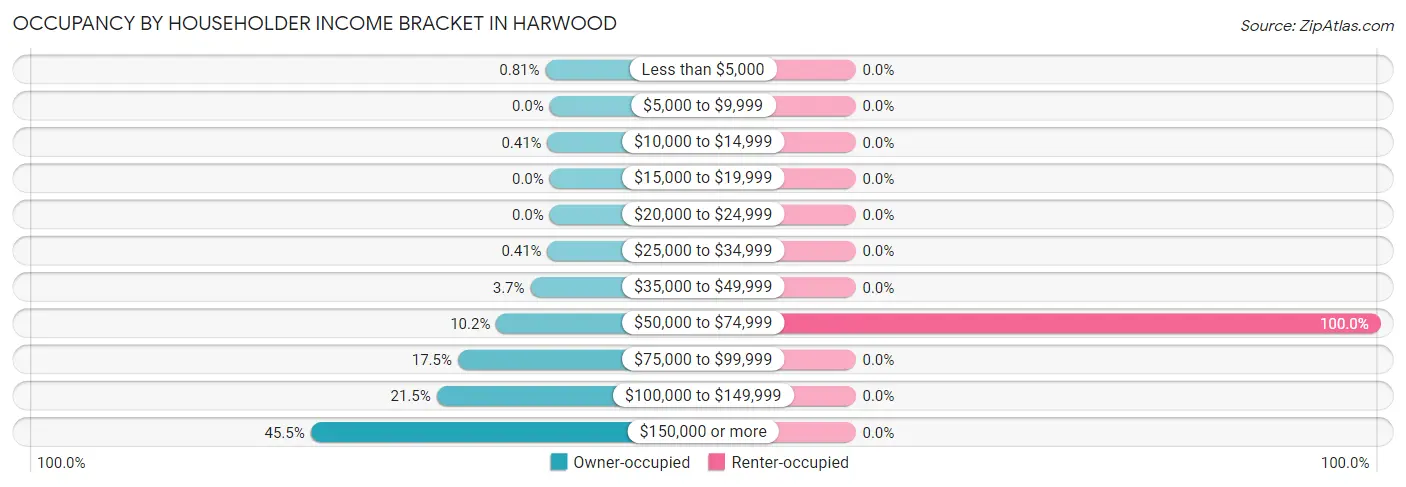
| Income Bracket | Owner-occupied | Renter-occupied |
| Less than $5,000 | 2 (0.8%) | 0 (0.0%) |
| $5,000 to $9,999 | 0 (0.0%) | 0 (0.0%) |
| $10,000 to $14,999 | 1 (0.4%) | 0 (0.0%) |
| $15,000 to $19,999 | 0 (0.0%) | 0 (0.0%) |
| $20,000 to $24,999 | 0 (0.0%) | 0 (0.0%) |
| $25,000 to $34,999 | 1 (0.4%) | 0 (0.0%) |
| $35,000 to $49,999 | 9 (3.7%) | 0 (0.0%) |
| $50,000 to $74,999 | 25 (10.2%) | 2 (100.0%) |
| $75,000 to $99,999 | 43 (17.5%) | 0 (0.0%) |
| $100,000 to $149,999 | 53 (21.5%) | 0 (0.0%) |
| $150,000 or more | 112 (45.5%) | 0 (0.0%) |
| Total | 246 (100.0%) | 2 (100.0%) |
Monthly Housing Cost Tiers in Harwood
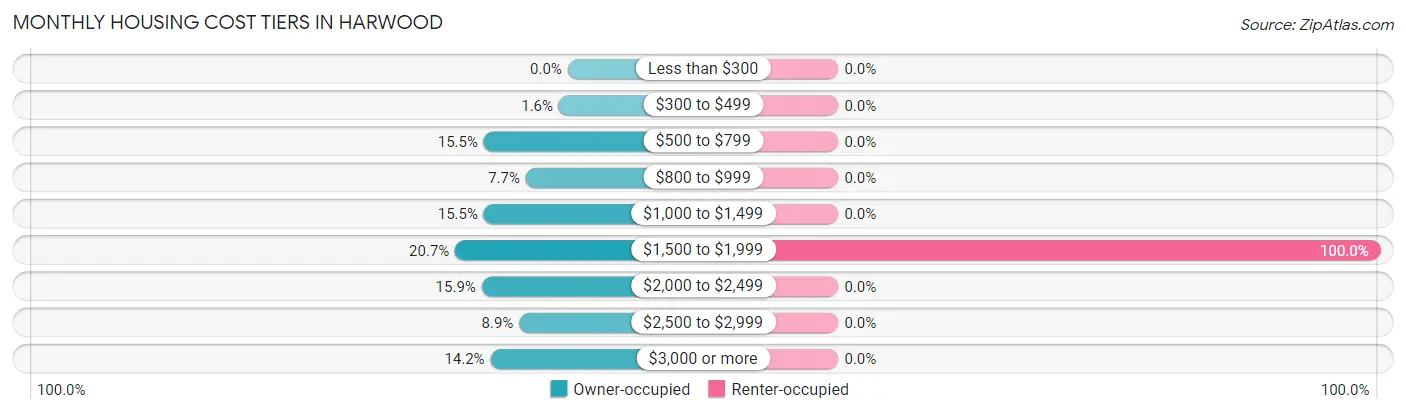
| Monthly Cost | Owner-occupied | Renter-occupied |
| Less than $300 | 0 (0.0%) | 0 (0.0%) |
| $300 to $499 | 4 (1.6%) | 0 (0.0%) |
| $500 to $799 | 38 (15.4%) | 0 (0.0%) |
| $800 to $999 | 19 (7.7%) | 0 (0.0%) |
| $1,000 to $1,499 | 38 (15.4%) | 0 (0.0%) |
| $1,500 to $1,999 | 51 (20.7%) | 2 (100.0%) |
| $2,000 to $2,499 | 39 (15.9%) | 0 (0.0%) |
| $2,500 to $2,999 | 22 (8.9%) | 0 (0.0%) |
| $3,000 or more | 35 (14.2%) | 0 (0.0%) |
| Total | 246 (100.0%) | 2 (100.0%) |
Physical Housing Characteristics in Harwood
Housing Structures in Harwood
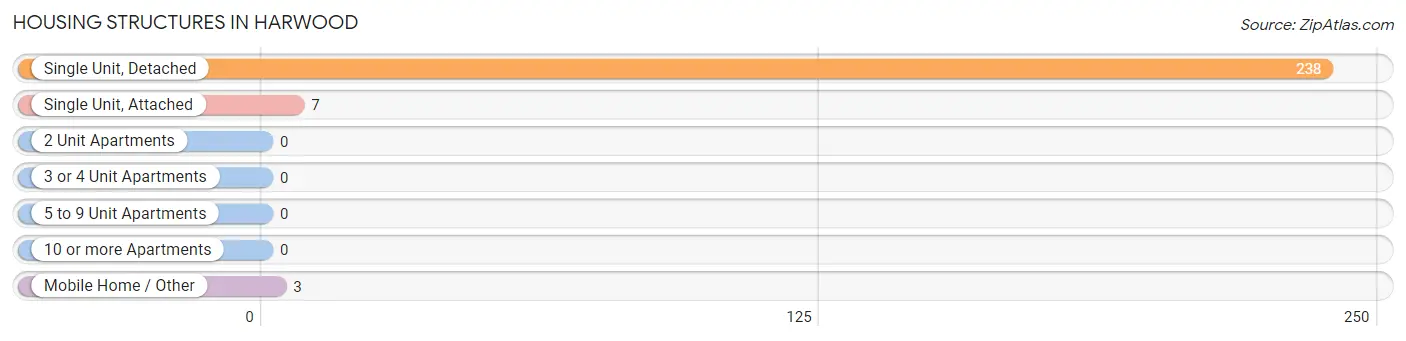
| Structure Type | # Housing Units | % Housing Units |
| Single Unit, Detached | 238 | 96.0% |
| Single Unit, Attached | 7 | 2.8% |
| 2 Unit Apartments | 0 | 0.0% |
| 3 or 4 Unit Apartments | 0 | 0.0% |
| 5 to 9 Unit Apartments | 0 | 0.0% |
| 10 or more Apartments | 0 | 0.0% |
| Mobile Home / Other | 3 | 1.2% |
| Total | 248 | 100.0% |
Housing Structures by Occupancy in Harwood
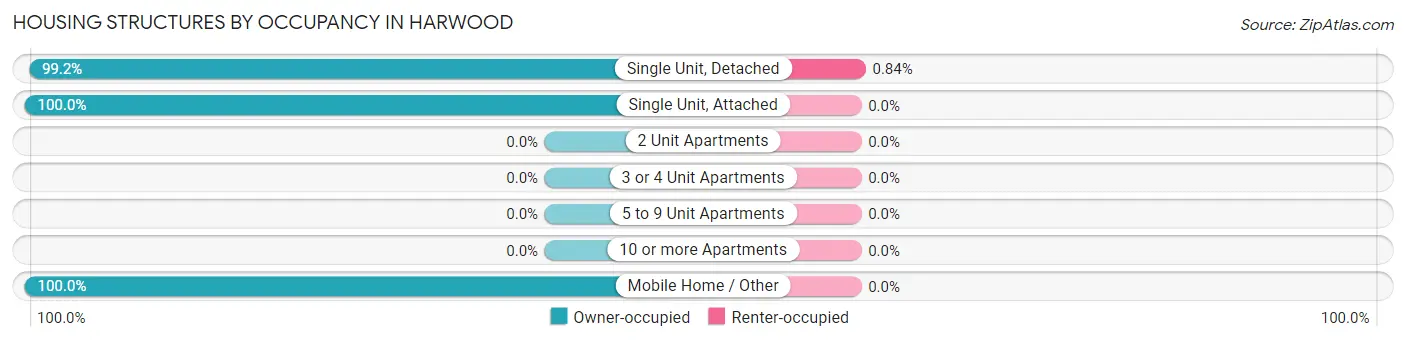
| Structure Type | Owner-occupied | Renter-occupied |
| Single Unit, Detached | 236 (99.2%) | 2 (0.8%) |
| Single Unit, Attached | 7 (100.0%) | 0 (0.0%) |
| 2 Unit Apartments | 0 (0.0%) | 0 (0.0%) |
| 3 or 4 Unit Apartments | 0 (0.0%) | 0 (0.0%) |
| 5 to 9 Unit Apartments | 0 (0.0%) | 0 (0.0%) |
| 10 or more Apartments | 0 (0.0%) | 0 (0.0%) |
| Mobile Home / Other | 3 (100.0%) | 0 (0.0%) |
| Total | 246 (99.2%) | 2 (0.8%) |
Housing Structures by Number of Rooms in Harwood
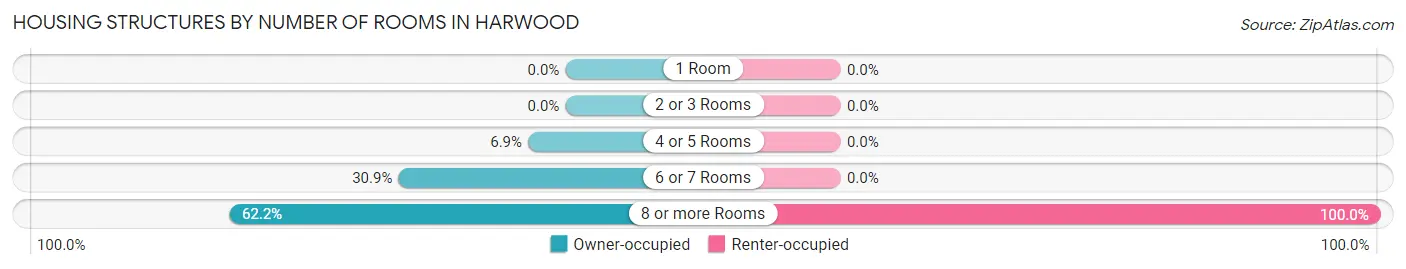
| Number of Rooms | Owner-occupied | Renter-occupied |
| 1 Room | 0 (0.0%) | 0 (0.0%) |
| 2 or 3 Rooms | 0 (0.0%) | 0 (0.0%) |
| 4 or 5 Rooms | 17 (6.9%) | 0 (0.0%) |
| 6 or 7 Rooms | 76 (30.9%) | 0 (0.0%) |
| 8 or more Rooms | 153 (62.2%) | 2 (100.0%) |
| Total | 246 (100.0%) | 2 (100.0%) |
Housing Structure by Heating Type in Harwood
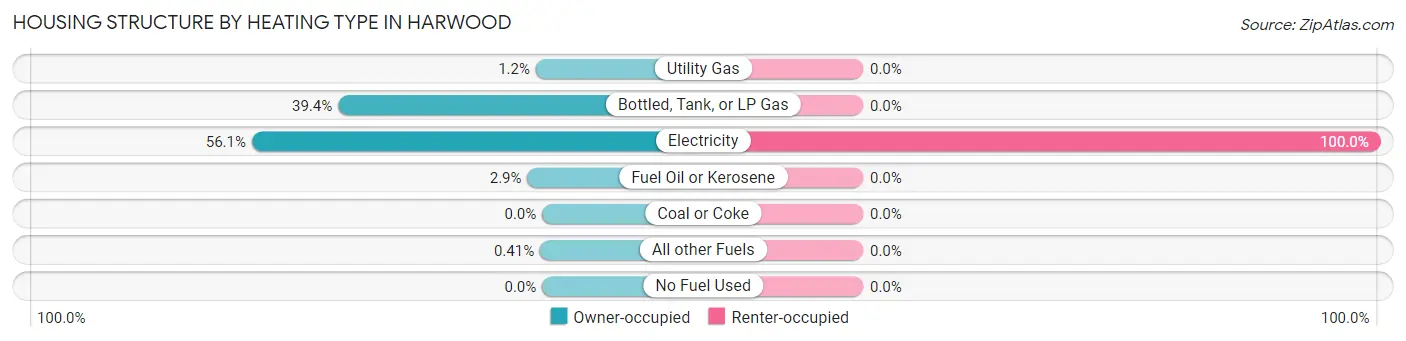
| Heating Type | Owner-occupied | Renter-occupied |
| Utility Gas | 3 (1.2%) | 0 (0.0%) |
| Bottled, Tank, or LP Gas | 97 (39.4%) | 0 (0.0%) |
| Electricity | 138 (56.1%) | 2 (100.0%) |
| Fuel Oil or Kerosene | 7 (2.9%) | 0 (0.0%) |
| Coal or Coke | 0 (0.0%) | 0 (0.0%) |
| All other Fuels | 1 (0.4%) | 0 (0.0%) |
| No Fuel Used | 0 (0.0%) | 0 (0.0%) |
| Total | 246 (100.0%) | 2 (100.0%) |
Household Vehicle Usage in Harwood
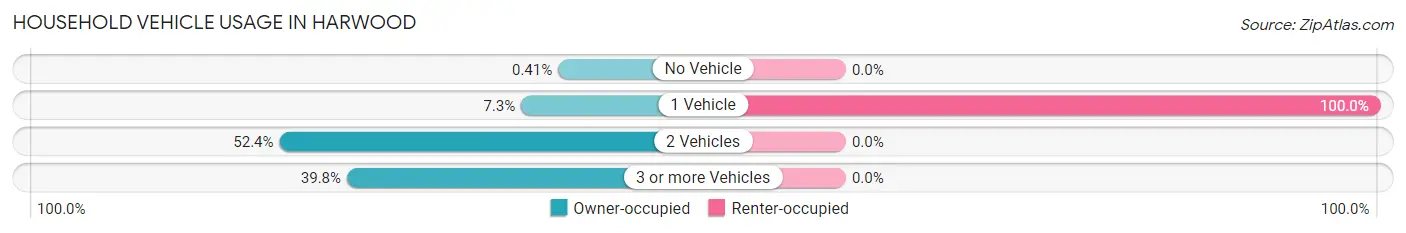
| Vehicles per Household | Owner-occupied | Renter-occupied |
| No Vehicle | 1 (0.4%) | 0 (0.0%) |
| 1 Vehicle | 18 (7.3%) | 2 (100.0%) |
| 2 Vehicles | 129 (52.4%) | 0 (0.0%) |
| 3 or more Vehicles | 98 (39.8%) | 0 (0.0%) |
| Total | 246 (100.0%) | 2 (100.0%) |
Real Estate & Mortgages in Harwood
Real Estate and Mortgage Overview in Harwood
| Characteristic | Without Mortgage | With Mortgage |
| Housing Units | 79 | 167 |
| Median Property Value | $274,200 | $282,500 |
| Median Household Income | $107,813 | $78 |
| Monthly Housing Costs | $777 | $35 |
| Real Estate Taxes | $4,315 | $0 |
Property Value by Mortgage Status in Harwood
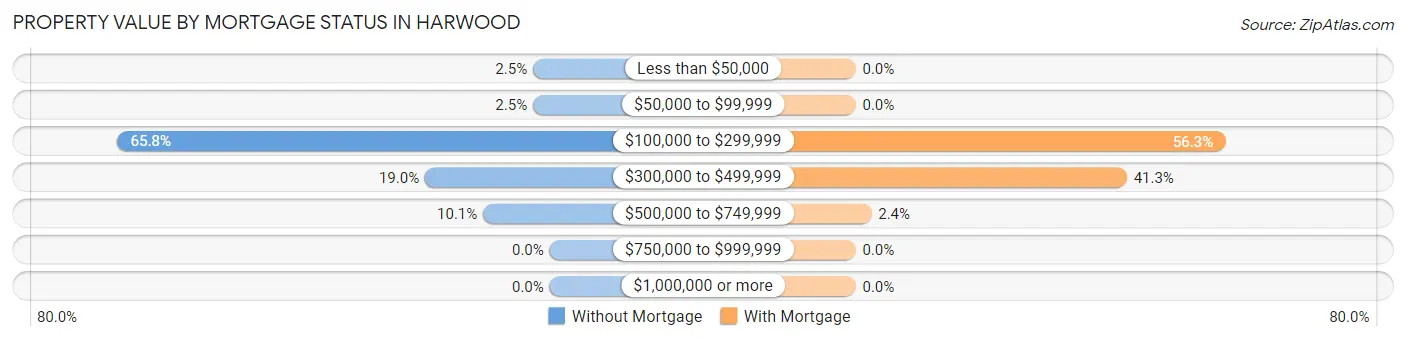
| Property Value | Without Mortgage | With Mortgage |
| Less than $50,000 | 2 (2.5%) | 0 (0.0%) |
| $50,000 to $99,999 | 2 (2.5%) | 0 (0.0%) |
| $100,000 to $299,999 | 52 (65.8%) | 94 (56.3%) |
| $300,000 to $499,999 | 15 (19.0%) | 69 (41.3%) |
| $500,000 to $749,999 | 8 (10.1%) | 4 (2.4%) |
| $750,000 to $999,999 | 0 (0.0%) | 0 (0.0%) |
| $1,000,000 or more | 0 (0.0%) | 0 (0.0%) |
| Total | 79 (100.0%) | 167 (100.0%) |
Household Income by Mortgage Status in Harwood
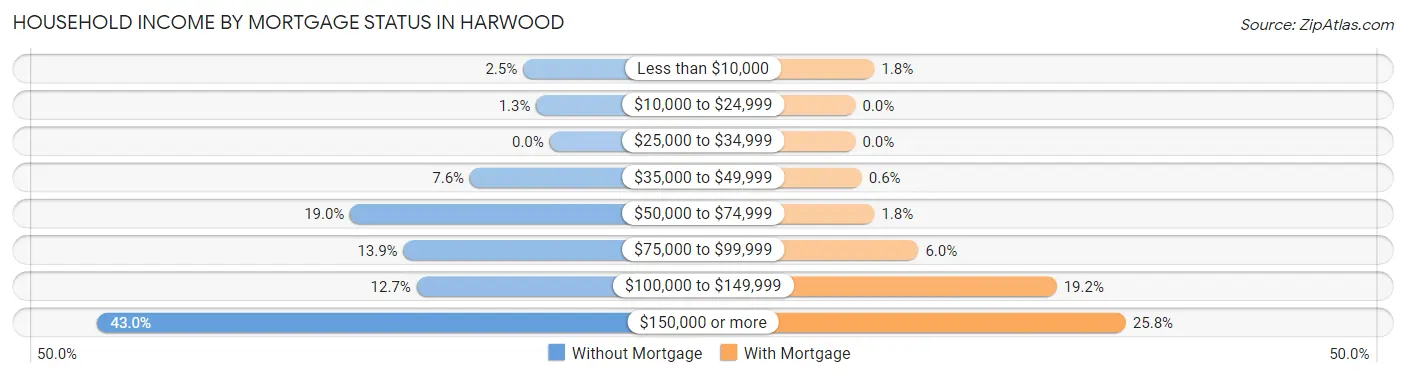
| Household Income | Without Mortgage | With Mortgage |
| Less than $10,000 | 2 (2.5%) | 3 (1.8%) |
| $10,000 to $24,999 | 1 (1.3%) | 0 (0.0%) |
| $25,000 to $34,999 | 0 (0.0%) | 0 (0.0%) |
| $35,000 to $49,999 | 6 (7.6%) | 1 (0.6%) |
| $50,000 to $74,999 | 15 (19.0%) | 3 (1.8%) |
| $75,000 to $99,999 | 11 (13.9%) | 10 (6.0%) |
| $100,000 to $149,999 | 10 (12.7%) | 32 (19.2%) |
| $150,000 or more | 34 (43.0%) | 43 (25.8%) |
| Total | 79 (100.0%) | 167 (100.0%) |
Property Value to Household Income Ratio in Harwood
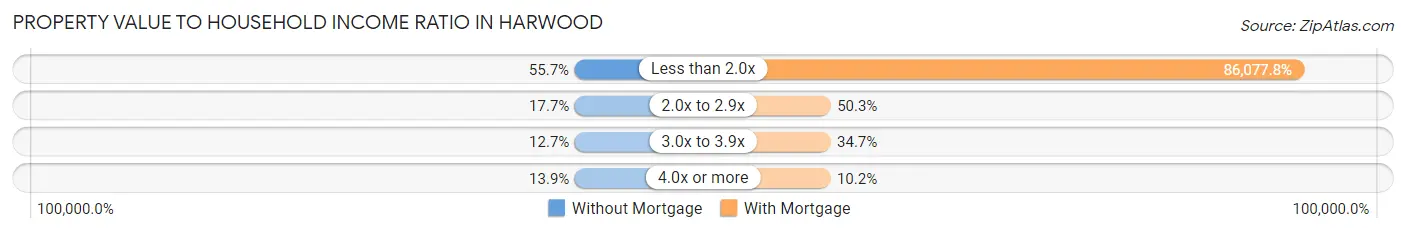
| Value-to-Income Ratio | Without Mortgage | With Mortgage |
| Less than 2.0x | 44 (55.7%) | 143,750 (86,077.8%) |
| 2.0x to 2.9x | 14 (17.7%) | 84 (50.3%) |
| 3.0x to 3.9x | 10 (12.7%) | 58 (34.7%) |
| 4.0x or more | 11 (13.9%) | 17 (10.2%) |
| Total | 79 (100.0%) | 167 (100.0%) |
Real Estate Taxes by Mortgage Status in Harwood
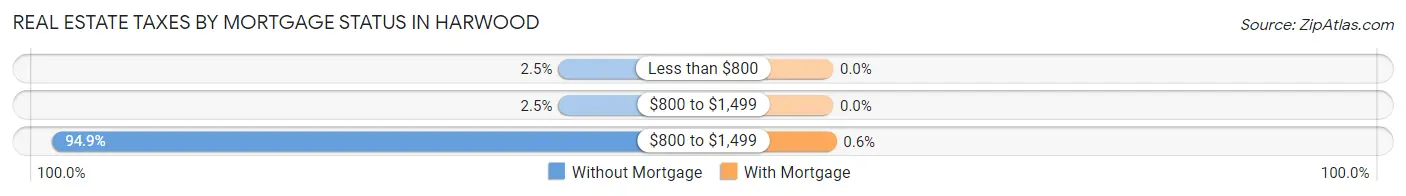
| Property Taxes | Without Mortgage | With Mortgage |
| Less than $800 | 2 (2.5%) | 0 (0.0%) |
| $800 to $1,499 | 2 (2.5%) | 0 (0.0%) |
| $800 to $1,499 | 75 (94.9%) | 1 (0.6%) |
| Total | 79 (100.0%) | 167 (100.0%) |
Health & Disability in Harwood
Health Insurance Coverage by Age in Harwood
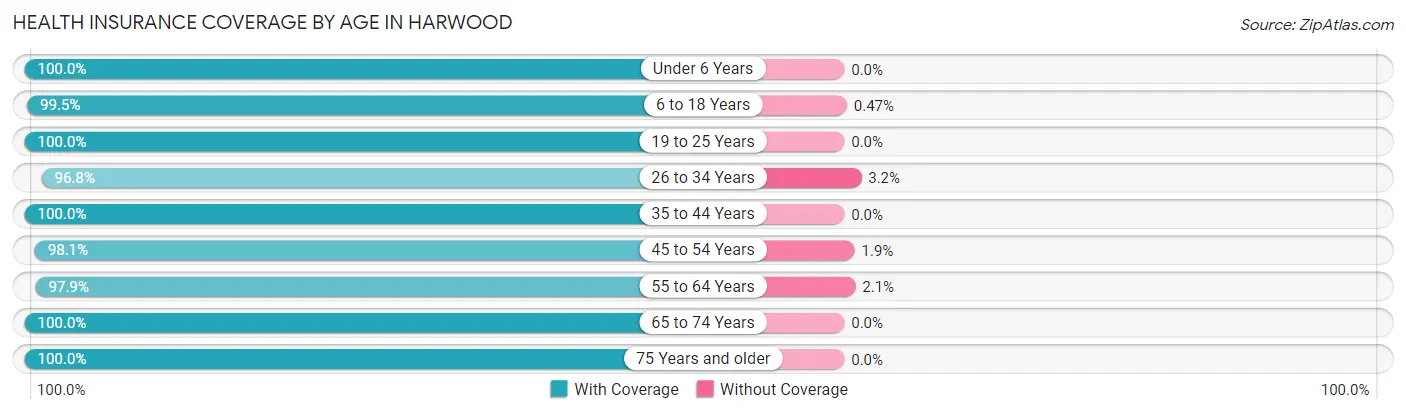
| Age Bracket | With Coverage | Without Coverage |
| Under 6 Years | 49 (100.0%) | 0 (0.0%) |
| 6 to 18 Years | 213 (99.5%) | 1 (0.5%) |
| 19 to 25 Years | 18 (100.0%) | 0 (0.0%) |
| 26 to 34 Years | 61 (96.8%) | 2 (3.2%) |
| 35 to 44 Years | 139 (100.0%) | 0 (0.0%) |
| 45 to 54 Years | 102 (98.1%) | 2 (1.9%) |
| 55 to 64 Years | 95 (97.9%) | 2 (2.1%) |
| 65 to 74 Years | 66 (100.0%) | 0 (0.0%) |
| 75 Years and older | 9 (100.0%) | 0 (0.0%) |
| Total | 752 (99.1%) | 7 (0.9%) |
Health Insurance Coverage by Citizenship Status in Harwood
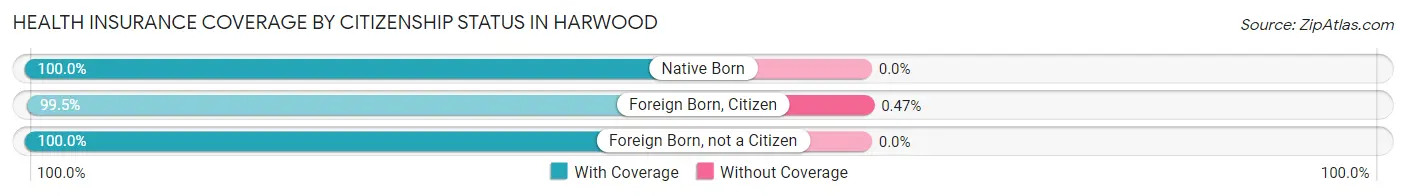
| Citizenship Status | With Coverage | Without Coverage |
| Native Born | 49 (100.0%) | 0 (0.0%) |
| Foreign Born, Citizen | 213 (99.5%) | 1 (0.5%) |
| Foreign Born, not a Citizen | 18 (100.0%) | 0 (0.0%) |
Health Insurance Coverage by Household Income in Harwood
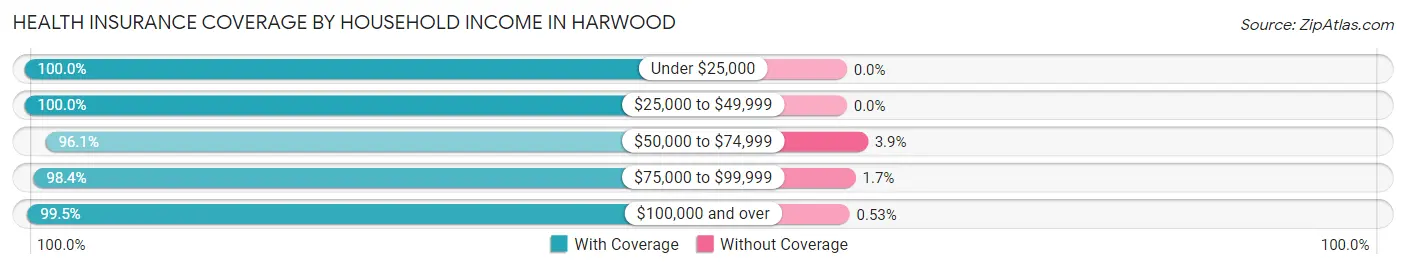
| Household Income | With Coverage | Without Coverage |
| Under $25,000 | 4 (100.0%) | 0 (0.0%) |
| $25,000 to $49,999 | 20 (100.0%) | 0 (0.0%) |
| $50,000 to $74,999 | 49 (96.1%) | 2 (3.9%) |
| $75,000 to $99,999 | 119 (98.4%) | 2 (1.7%) |
| $100,000 and over | 560 (99.5%) | 3 (0.5%) |
Public vs Private Health Insurance Coverage by Age in Harwood
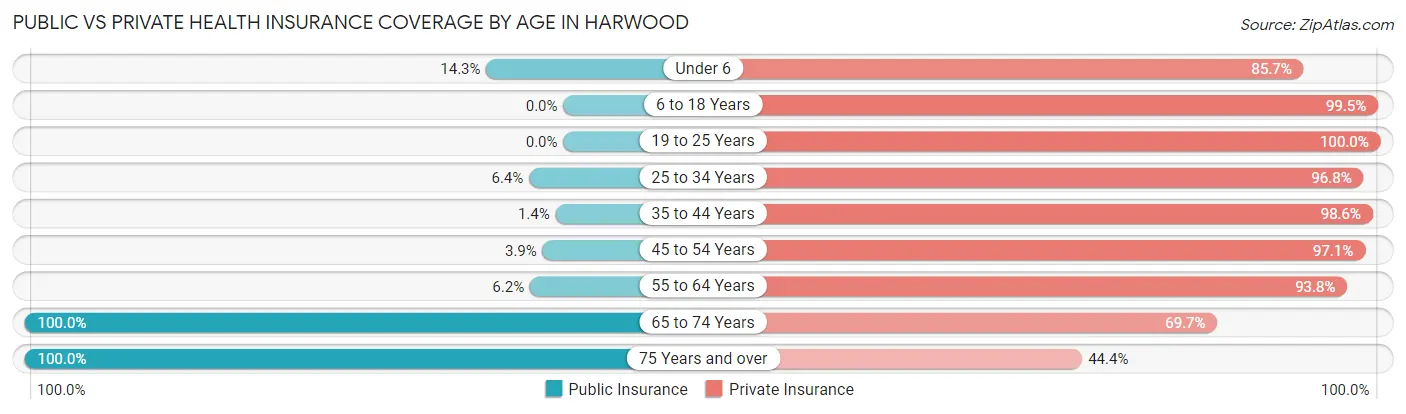
| Age Bracket | Public Insurance | Private Insurance |
| Under 6 | 7 (14.3%) | 42 (85.7%) |
| 6 to 18 Years | 0 (0.0%) | 213 (99.5%) |
| 19 to 25 Years | 0 (0.0%) | 18 (100.0%) |
| 25 to 34 Years | 4 (6.4%) | 61 (96.8%) |
| 35 to 44 Years | 2 (1.4%) | 137 (98.6%) |
| 45 to 54 Years | 4 (3.8%) | 101 (97.1%) |
| 55 to 64 Years | 6 (6.2%) | 91 (93.8%) |
| 65 to 74 Years | 66 (100.0%) | 46 (69.7%) |
| 75 Years and over | 9 (100.0%) | 4 (44.4%) |
| Total | 98 (12.9%) | 713 (93.9%) |
Disability Status by Sex by Age in Harwood
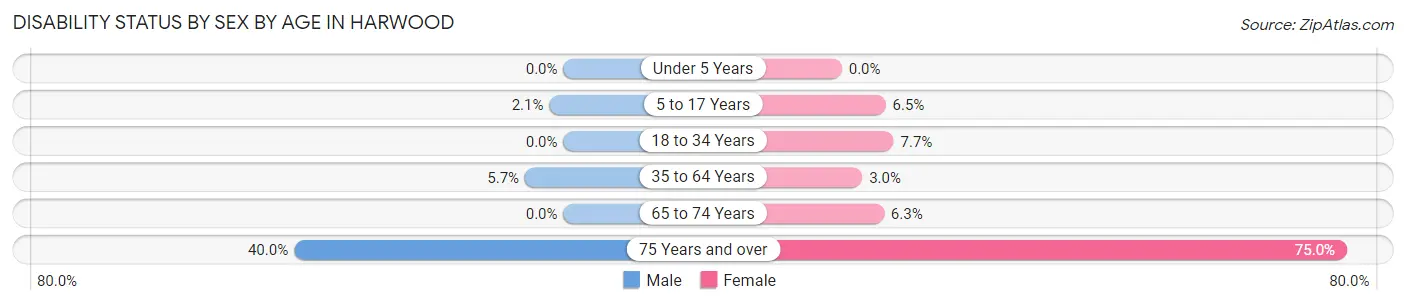
| Age Bracket | Male | Female |
| Under 5 Years | 0 (0.0%) | 0 (0.0%) |
| 5 to 17 Years | 2 (2.1%) | 8 (6.5%) |
| 18 to 34 Years | 0 (0.0%) | 4 (7.7%) |
| 35 to 64 Years | 10 (5.7%) | 5 (3.0%) |
| 65 to 74 Years | 0 (0.0%) | 2 (6.2%) |
| 75 Years and over | 2 (40.0%) | 3 (75.0%) |
Disability Class by Sex by Age in Harwood
Disability Class: Hearing Difficulty
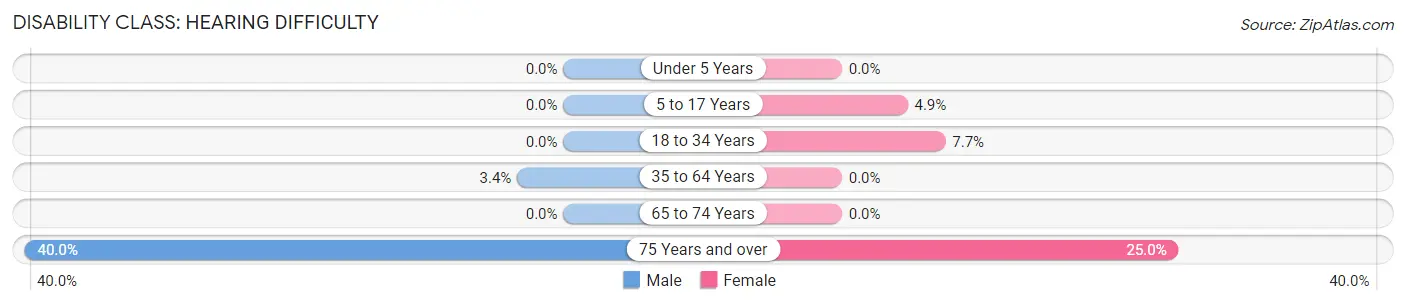
| Age Bracket | Male | Female |
| Under 5 Years | 0 (0.0%) | 0 (0.0%) |
| 5 to 17 Years | 0 (0.0%) | 6 (4.9%) |
| 18 to 34 Years | 0 (0.0%) | 4 (7.7%) |
| 35 to 64 Years | 6 (3.4%) | 0 (0.0%) |
| 65 to 74 Years | 0 (0.0%) | 0 (0.0%) |
| 75 Years and over | 2 (40.0%) | 1 (25.0%) |
Disability Class: Vision Difficulty
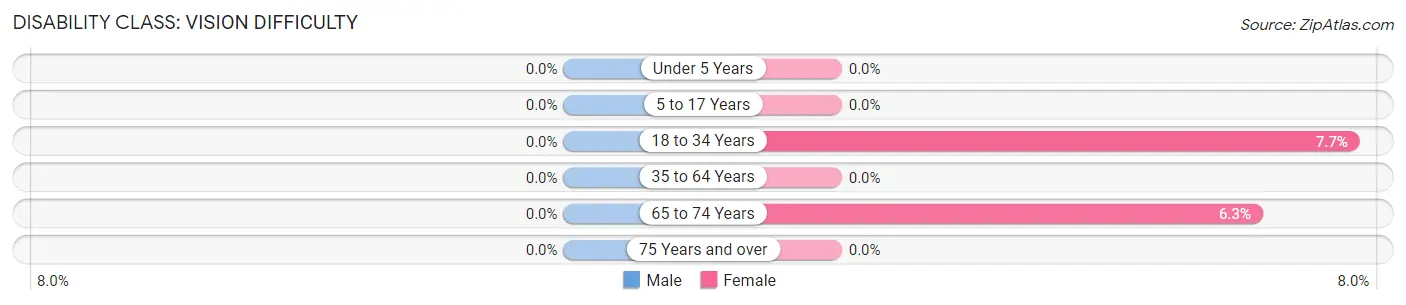
| Age Bracket | Male | Female |
| Under 5 Years | 0 (0.0%) | 0 (0.0%) |
| 5 to 17 Years | 0 (0.0%) | 0 (0.0%) |
| 18 to 34 Years | 0 (0.0%) | 4 (7.7%) |
| 35 to 64 Years | 0 (0.0%) | 0 (0.0%) |
| 65 to 74 Years | 0 (0.0%) | 2 (6.2%) |
| 75 Years and over | 0 (0.0%) | 0 (0.0%) |
Disability Class: Cognitive Difficulty
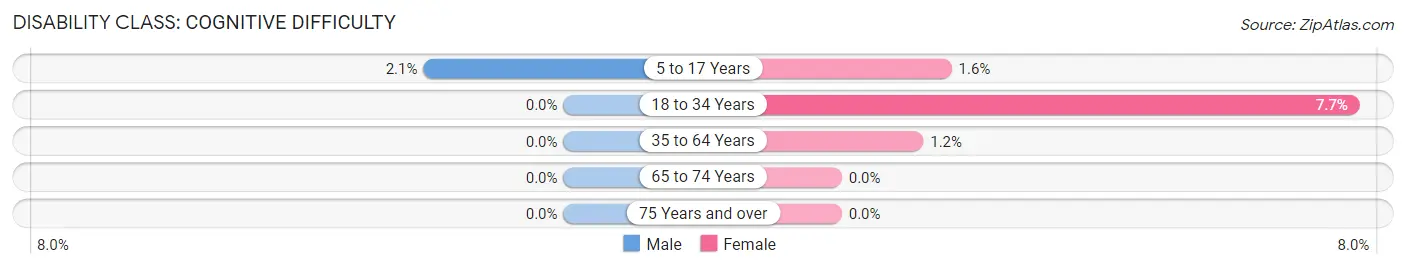
| Age Bracket | Male | Female |
| 5 to 17 Years | 2 (2.1%) | 2 (1.6%) |
| 18 to 34 Years | 0 (0.0%) | 4 (7.7%) |
| 35 to 64 Years | 0 (0.0%) | 2 (1.2%) |
| 65 to 74 Years | 0 (0.0%) | 0 (0.0%) |
| 75 Years and over | 0 (0.0%) | 0 (0.0%) |
Disability Class: Ambulatory Difficulty
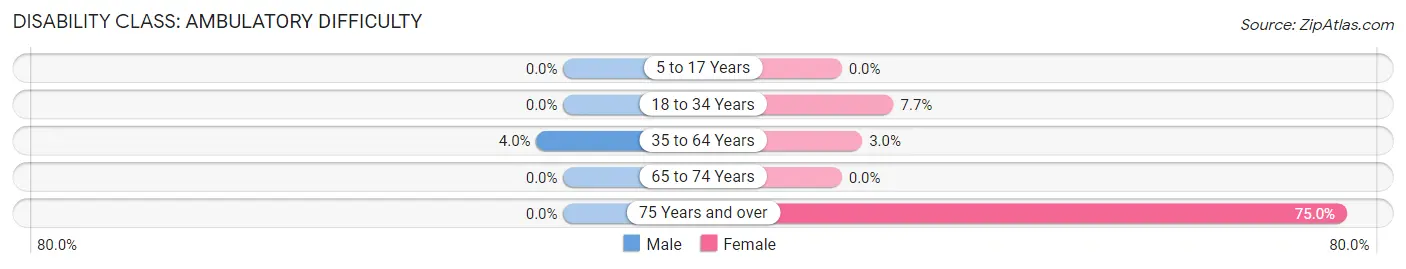
| Age Bracket | Male | Female |
| 5 to 17 Years | 0 (0.0%) | 0 (0.0%) |
| 18 to 34 Years | 0 (0.0%) | 4 (7.7%) |
| 35 to 64 Years | 7 (4.0%) | 5 (3.0%) |
| 65 to 74 Years | 0 (0.0%) | 0 (0.0%) |
| 75 Years and over | 0 (0.0%) | 3 (75.0%) |
Disability Class: Self-Care Difficulty
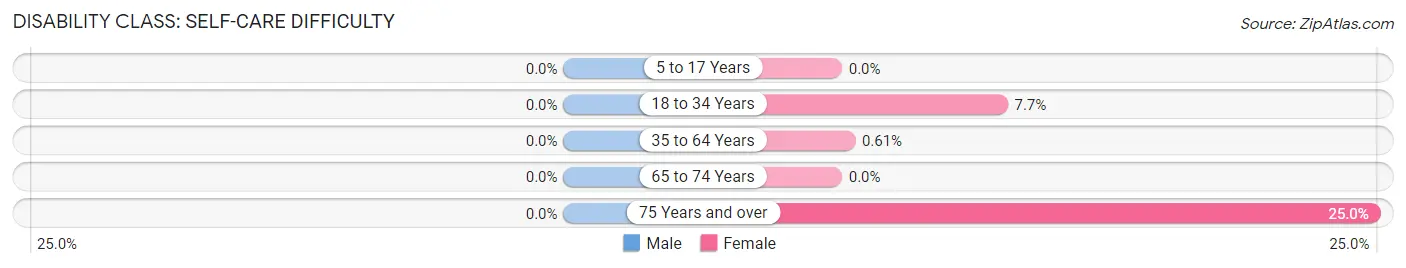
| Age Bracket | Male | Female |
| 5 to 17 Years | 0 (0.0%) | 0 (0.0%) |
| 18 to 34 Years | 0 (0.0%) | 4 (7.7%) |
| 35 to 64 Years | 0 (0.0%) | 1 (0.6%) |
| 65 to 74 Years | 0 (0.0%) | 0 (0.0%) |
| 75 Years and over | 0 (0.0%) | 1 (25.0%) |
Technology Access in Harwood
Computing Device Access in Harwood
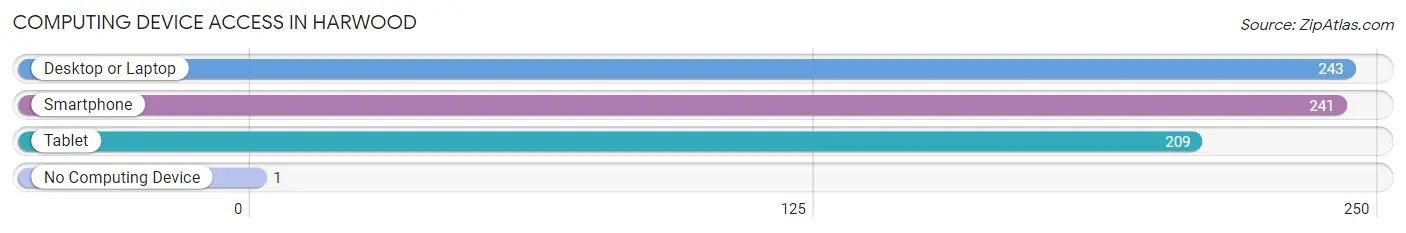
| Device Type | # Households | % Households |
| Desktop or Laptop | 243 | 98.0% |
| Smartphone | 241 | 97.2% |
| Tablet | 209 | 84.3% |
| No Computing Device | 1 | 0.4% |
| Total | 248 | 100.0% |
Internet Access in Harwood
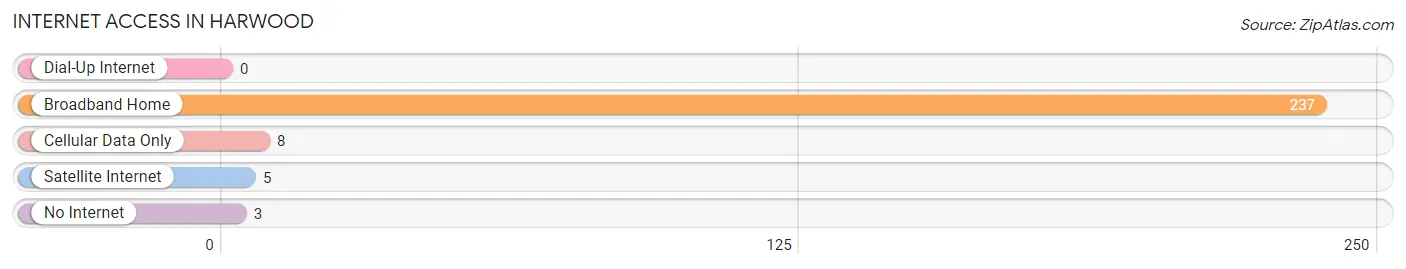
| Internet Type | # Households | % Households |
| Dial-Up Internet | 0 | 0.0% |
| Broadband Home | 237 | 95.6% |
| Cellular Data Only | 8 | 3.2% |
| Satellite Internet | 5 | 2.0% |
| No Internet | 3 | 1.2% |
| Total | 248 | 100.0% |
Harwood Summary
Harwood is a small city located in Cass County, North Dakota. It is situated on the banks of the Red River of the North, approximately 20 miles north of Fargo. The city was founded in 1881 and has a population of approximately 1,000 people.
Geography
Harwood is located in the Red River Valley, a flat, fertile region of the Great Plains. The city is situated on the banks of the Red River of the North, which forms the border between North Dakota and Minnesota. The city is surrounded by agricultural land, with the nearest major city being Fargo, located 20 miles to the south.
Climate
Harwood has a humid continental climate, with cold winters and hot summers. The average annual temperature is 45°F (7°C), with an average high of 68°F (20°C) in the summer and an average low of 22°F (-6°C) in the winter. The average annual precipitation is 22 inches (56 cm).
Economy
Harwood’s economy is largely based on agriculture. The city is home to several grain elevators, as well as a number of small businesses. The city is also home to a number of manufacturing companies, including a furniture factory and a plastics plant.
Demographics
As of the 2010 census, the population of Harwood was 1,000. The racial makeup of the city was 97.2% White, 0.7% African American, 0.3% Native American, 0.2% Asian, 0.1% Pacific Islander, and 1.5% from two or more races. The median household income was $45,000, and the median family income was $50,000.
Education
Harwood is served by the Harwood Public School District, which includes an elementary school, a middle school, and a high school. The city is also home to a number of private schools, including a Catholic school and a Lutheran school.
Culture
Harwood is home to a number of cultural attractions, including the Harwood Historical Museum, which houses artifacts from the city’s history. The city also hosts a number of annual events, including the Harwood Days Festival, which features a parade, live music, and a carnival.
Conclusion
Harwood is a small city located in Cass County, North Dakota. It is situated on the banks of the Red River of the North, approximately 20 miles north of Fargo. The city was founded in 1881 and has a population of approximately 1,000 people. The economy of Harwood is largely based on agriculture, and the city is home to a number of small businesses and manufacturing companies. The city is served by the Harwood Public School District, and is home to a number of cultural attractions, including the Harwood Historical Museum. Harwood is a vibrant city with a rich history and a bright future.
Common Questions
What is Per Capita Income in Harwood?
Per Capita income in Harwood is $64,938.
What is the Median Family Income in Harwood?
Median Family Income in Harwood is $144,500.
What is the Median Household income in Harwood?
Median Household Income in Harwood is $139,750.
What is Income or Wage Gap in Harwood?
Income or Wage Gap in Harwood is 33.1%.
Women in Harwood earn 66.9 cents for every dollar earned by a man.
What is Inequality or Gini Index in Harwood?
Inequality or Gini Index in Harwood is 0.44.
What is the Total Population of Harwood?
Total Population of Harwood is 759.
What is the Total Male Population of Harwood?
Total Male Population of Harwood is 352.
What is the Total Female Population of Harwood?
Total Female Population of Harwood is 407.
What is the Ratio of Males per 100 Females in Harwood?
There are 86.49 Males per 100 Females in Harwood.
What is the Ratio of Females per 100 Males in Harwood?
There are 115.62 Females per 100 Males in Harwood.
What is the Median Population Age in Harwood?
Median Population Age in Harwood is 39.5 Years.
What is the Average Family Size in Harwood
Average Family Size in Harwood is 3.2 People.
What is the Average Household Size in Harwood
Average Household Size in Harwood is 3.1 People.
How Large is the Labor Force in Harwood?
There are 383 People in the Labor Forcein in Harwood.
What is the Percentage of People in the Labor Force in Harwood?
73.9% of People are in the Labor Force in Harwood.
What is the Unemployment Rate in Harwood?
Unemployment Rate in Harwood is 0.8%.