Sherwood, ND Map & Demographics
Sherwood Map
Sherwood Overview
$29,526
PER CAPITA INCOME
$75,859
AVG FAMILY INCOME
$64,375
AVG HOUSEHOLD INCOME
0.41
INEQUALITY / GINI INDEX
236
TOTAL POPULATION
132
MALE POPULATION
104
FEMALE POPULATION
126.92
MALES / 100 FEMALES
78.79
FEMALES / 100 MALES
49.3
MEDIAN AGE
3.1
AVG FAMILY SIZE
2.4
AVG HOUSEHOLD SIZE
96
LABOR FORCE [ PEOPLE ]
49.2%
PERCENT IN LABOR FORCE
Sherwood Zip Codes
Sherwood Area Codes
Income in Sherwood
Income Overview in Sherwood
Per Capita Income in Sherwood is $29,526, while median incomes of families and households are $75,859 and $64,375 respectively.
| Characteristic | Number | Measure |
| Per Capita Income | 236 | $29,526 |
| Median Family Income | 59 | $75,859 |
| Mean Family Income | 59 | $75,993 |
| Median Household Income | 99 | $64,375 |
| Mean Household Income | 99 | $69,507 |
| Income Deficit | 59 | $0 |
| Wage / Income Gap (%) | 236 | 0.00% |
| Wage / Income Gap ($) | 236 | 100.00¢ per $1 |
| Gini / Inequality Index | 236 | 0.41 |
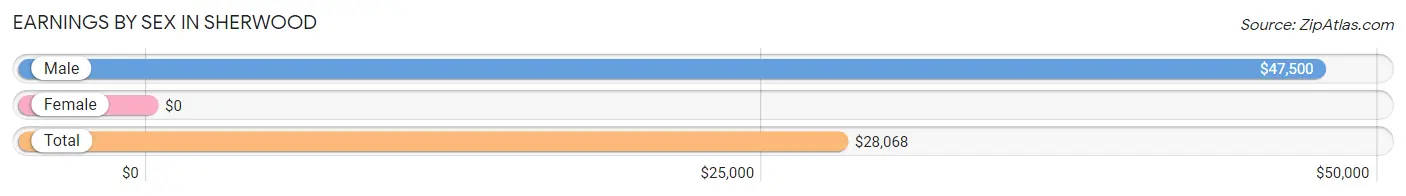
Earnings by Sex in Sherwood
| Sex | Number | Average Earnings |
| Male | 62 (53.9%) | $47,500 |
| Female | 53 (46.1%) | $0 |
| Total | 115 (100.0%) | $28,068 |
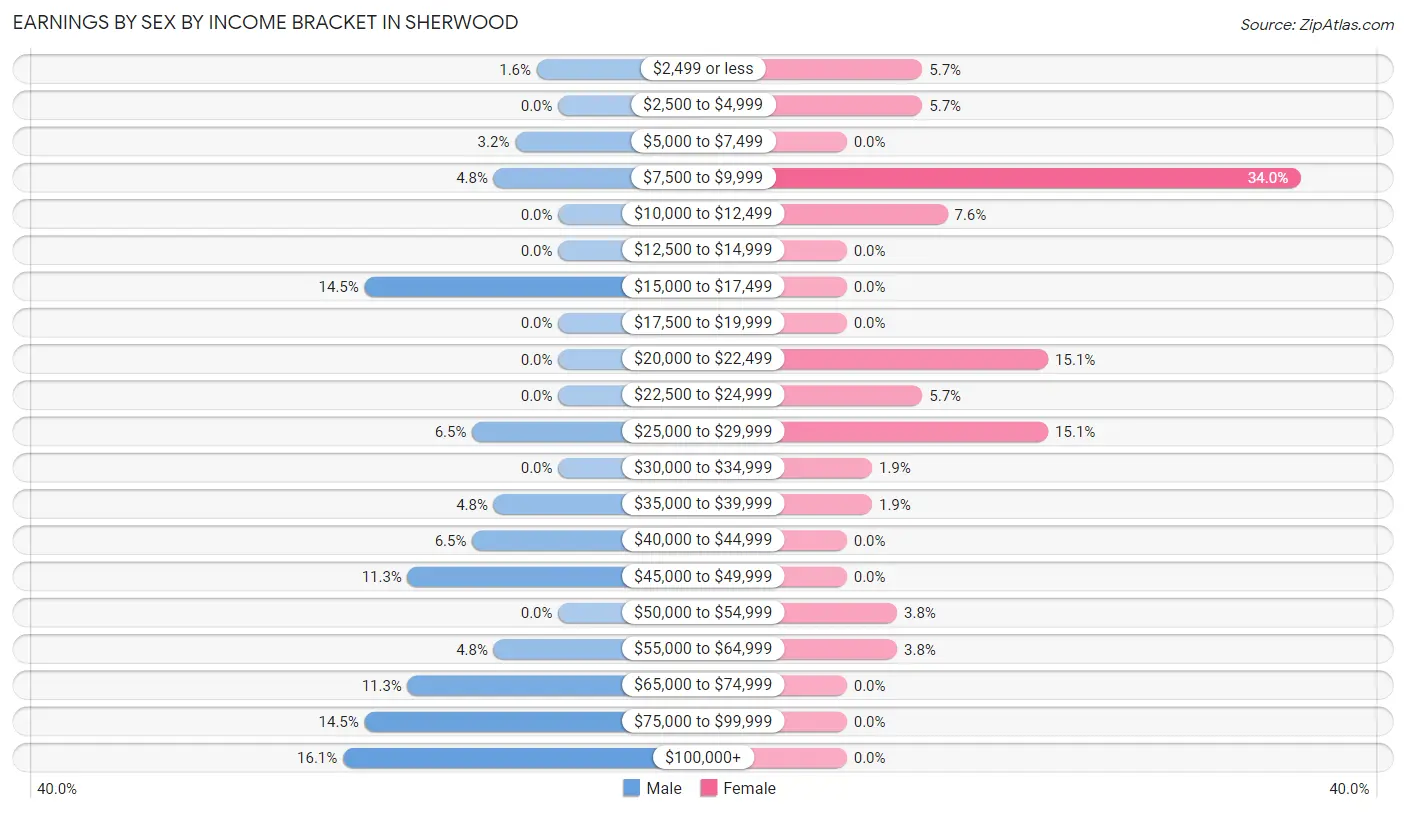
Earnings by Sex by Income Bracket in Sherwood
The most common earnings brackets in Sherwood are $100,000+ for men (10 | 16.1%) and $7,500 to $9,999 for women (18 | 34.0%).
| Income | Male | Female |
| $2,499 or less | 1 (1.6%) | 3 (5.7%) |
| $2,500 to $4,999 | 0 (0.0%) | 3 (5.7%) |
| $5,000 to $7,499 | 2 (3.2%) | 0 (0.0%) |
| $7,500 to $9,999 | 3 (4.8%) | 18 (34.0%) |
| $10,000 to $12,499 | 0 (0.0%) | 4 (7.5%) |
| $12,500 to $14,999 | 0 (0.0%) | 0 (0.0%) |
| $15,000 to $17,499 | 9 (14.5%) | 0 (0.0%) |
| $17,500 to $19,999 | 0 (0.0%) | 0 (0.0%) |
| $20,000 to $22,499 | 0 (0.0%) | 8 (15.1%) |
| $22,500 to $24,999 | 0 (0.0%) | 3 (5.7%) |
| $25,000 to $29,999 | 4 (6.5%) | 8 (15.1%) |
| $30,000 to $34,999 | 0 (0.0%) | 1 (1.9%) |
| $35,000 to $39,999 | 3 (4.8%) | 1 (1.9%) |
| $40,000 to $44,999 | 4 (6.5%) | 0 (0.0%) |
| $45,000 to $49,999 | 7 (11.3%) | 0 (0.0%) |
| $50,000 to $54,999 | 0 (0.0%) | 2 (3.8%) |
| $55,000 to $64,999 | 3 (4.8%) | 2 (3.8%) |
| $65,000 to $74,999 | 7 (11.3%) | 0 (0.0%) |
| $75,000 to $99,999 | 9 (14.5%) | 0 (0.0%) |
| $100,000+ | 10 (16.1%) | 0 (0.0%) |
| Total | 62 (100.0%) | 53 (100.0%) |
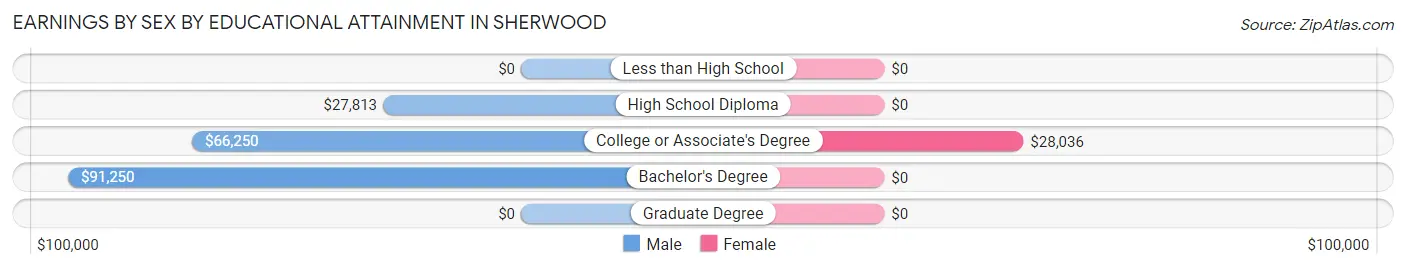
Earnings by Sex by Educational Attainment in Sherwood
| Educational Attainment | Male Income | Female Income |
| Less than High School | - | - |
| High School Diploma | $27,813 | $0 |
| College or Associate's Degree | $66,250 | $28,036 |
| Bachelor's Degree | $91,250 | $0 |
| Graduate Degree | - | - |
| Total | $47,500 | $0 |
Family Income in Sherwood
Family Income Brackets in Sherwood
According to the Sherwood family income data, there are 24 families falling into the $75,000 to $99,999 income range, which is the most common income bracket and makes up 40.7% of all families.
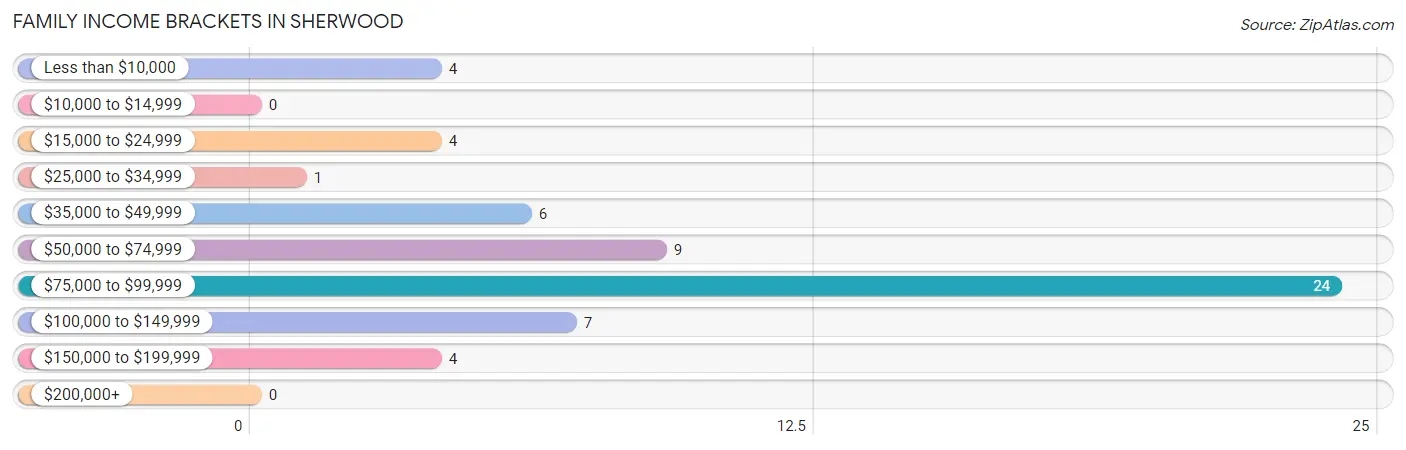
| Income Bracket | # Families | % Families |
| Less than $10,000 | 4 | 6.8% |
| $10,000 to $14,999 | 0 | 0.0% |
| $15,000 to $24,999 | 4 | 6.8% |
| $25,000 to $34,999 | 1 | 1.7% |
| $35,000 to $49,999 | 6 | 10.2% |
| $50,000 to $74,999 | 9 | 15.3% |
| $75,000 to $99,999 | 24 | 40.7% |
| $100,000 to $149,999 | 7 | 11.9% |
| $150,000 to $199,999 | 4 | 6.8% |
| $200,000+ | 0 | 0.0% |
Family Income by Famaliy Size in Sherwood
2-person families (42 | 71.2%) account for the highest median family income in Sherwood with $75,469 per family, while 2-person families (42 | 71.2%) have the highest median income of $37,734 per family member.
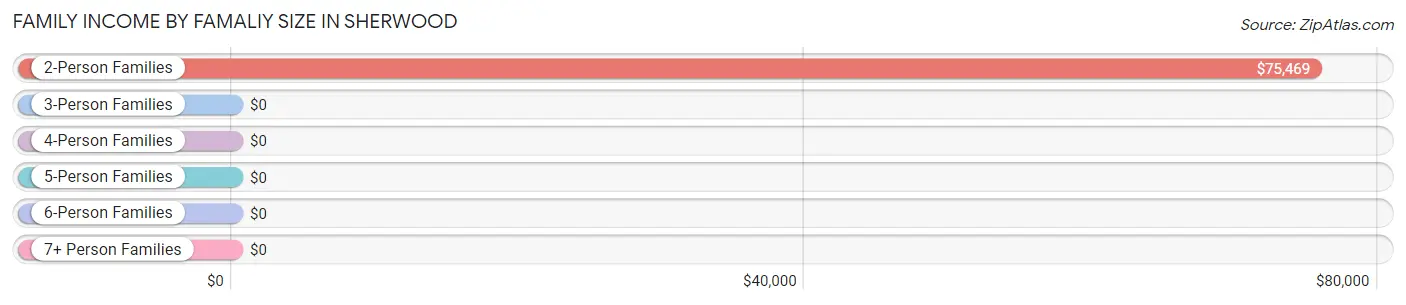
| Income Bracket | # Families | Median Income |
| 2-Person Families | 42 (71.2%) | $75,469 |
| 3-Person Families | 2 (3.4%) | $0 |
| 4-Person Families | 11 (18.6%) | $0 |
| 5-Person Families | 0 (0.0%) | $0 |
| 6-Person Families | 4 (6.8%) | $0 |
| 7+ Person Families | 0 (0.0%) | $0 |
| Total | 59 (100.0%) | $75,859 |
Family Income by Number of Earners in Sherwood
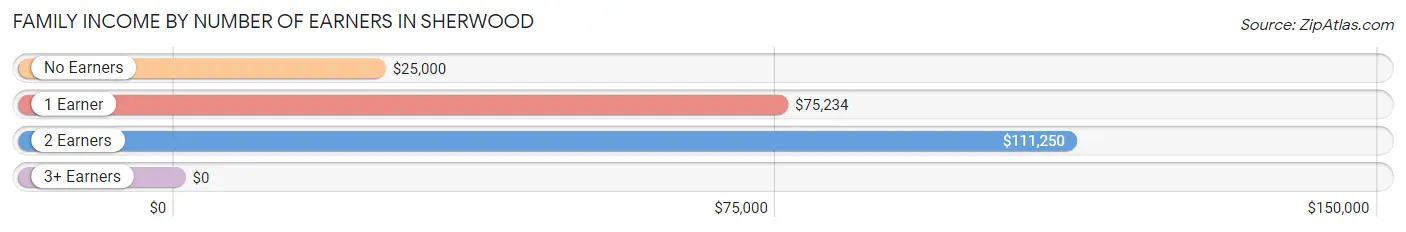
| Number of Earners | # Families | Median Income |
| No Earners | 10 (17.0%) | $25,000 |
| 1 Earner | 29 (49.1%) | $75,234 |
| 2 Earners | 15 (25.4%) | $111,250 |
| 3+ Earners | 5 (8.5%) | $0 |
| Total | 59 (100.0%) | $75,859 |
Household Income in Sherwood
Household Income Brackets in Sherwood
With 24 households falling in the category, the $75,000 to $99,999 income range is the most frequent in Sherwood, accounting for 24.2% of all households.
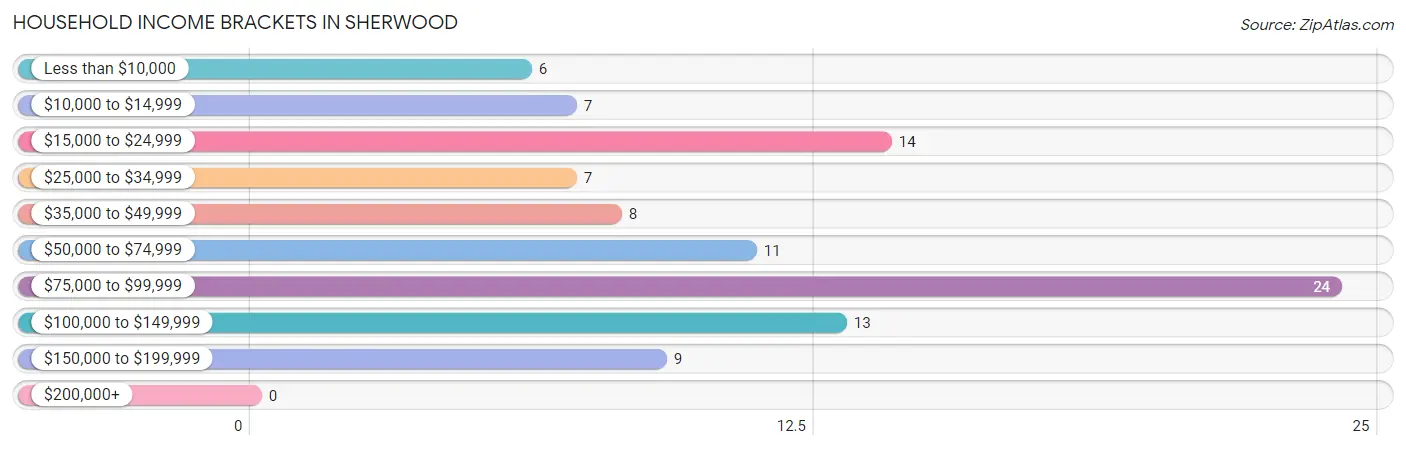
| Income Bracket | # Households | % Households |
| Less than $10,000 | 6 | 6.1% |
| $10,000 to $14,999 | 7 | 7.1% |
| $15,000 to $24,999 | 14 | 14.1% |
| $25,000 to $34,999 | 7 | 7.1% |
| $35,000 to $49,999 | 8 | 8.1% |
| $50,000 to $74,999 | 11 | 11.1% |
| $75,000 to $99,999 | 24 | 24.2% |
| $100,000 to $149,999 | 13 | 13.1% |
| $150,000 to $199,999 | 9 | 9.1% |
| $200,000+ | 0 | 0.0% |
Household Income by Householder Age in Sherwood
The median household income in Sherwood is $64,375, with the highest median household income of $96,964 found in the 25 to 44 years age bracket for the primary householder. A total of 29 households (29.3%) fall into this category. Meanwhile, the 15 to 24 years age bracket for the primary householder has the lowest median household income of $0, with 1 households (1.0%) in this group.
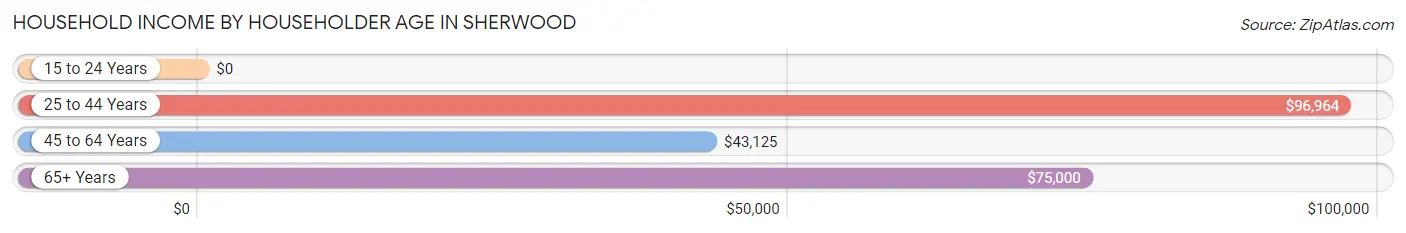
| Income Bracket | # Households | Median Income |
| 15 to 24 Years | 1 (1.0%) | $0 |
| 25 to 44 Years | 29 (29.3%) | $96,964 |
| 45 to 64 Years | 35 (35.3%) | $43,125 |
| 65+ Years | 34 (34.3%) | $75,000 |
| Total | 99 (100.0%) | $64,375 |
Poverty in Sherwood
Income Below Poverty by Sex and Age in Sherwood
With 15.0% poverty level for males and 8.6% for females among the residents of Sherwood, 18 to 24 year old males and 45 to 54 year old females are the most vulnerable to poverty, with 10 males (90.9%) and 3 females (30.0%) in their respective age groups living below the poverty level.
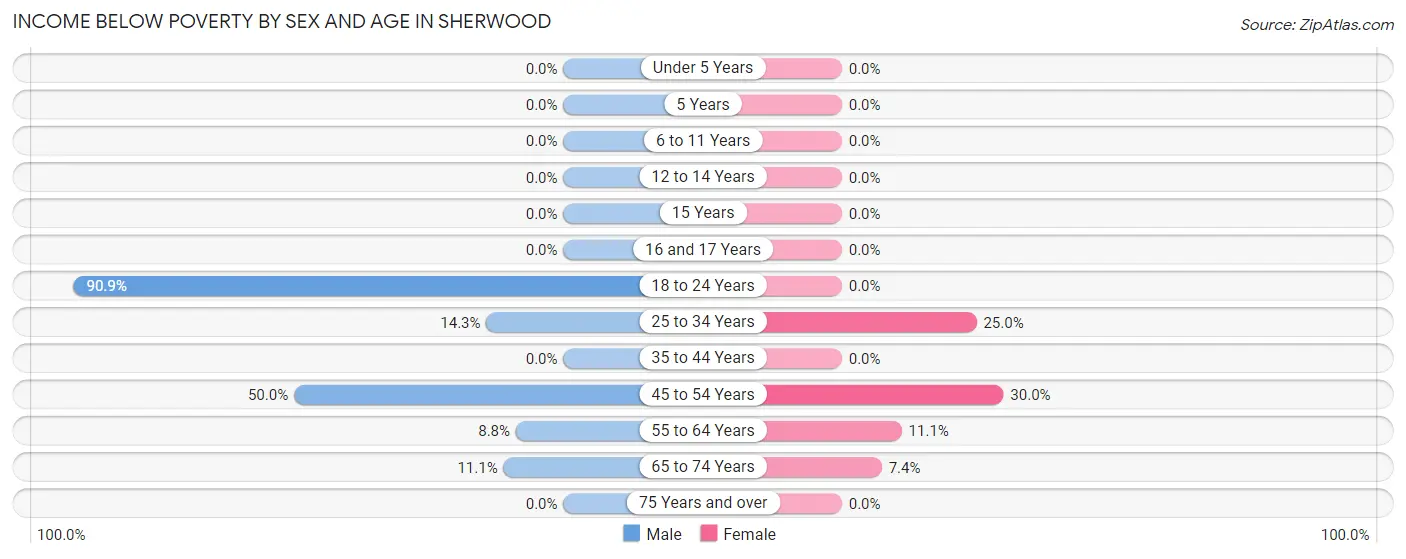
| Age Bracket | Male | Female |
| Under 5 Years | 0 (0.0%) | 0 (0.0%) |
| 5 Years | 0 (0.0%) | 0 (0.0%) |
| 6 to 11 Years | 0 (0.0%) | 0 (0.0%) |
| 12 to 14 Years | 0 (0.0%) | 0 (0.0%) |
| 15 Years | 0 (0.0%) | 0 (0.0%) |
| 16 and 17 Years | 0 (0.0%) | 0 (0.0%) |
| 18 to 24 Years | 10 (90.9%) | 0 (0.0%) |
| 25 to 34 Years | 2 (14.3%) | 3 (25.0%) |
| 35 to 44 Years | 0 (0.0%) | 0 (0.0%) |
| 45 to 54 Years | 3 (50.0%) | 3 (30.0%) |
| 55 to 64 Years | 3 (8.8%) | 1 (11.1%) |
| 65 to 74 Years | 1 (11.1%) | 2 (7.4%) |
| 75 Years and over | 0 (0.0%) | 0 (0.0%) |
| Total | 19 (15.0%) | 9 (8.6%) |
Income Above Poverty by Sex and Age in Sherwood
According to the poverty statistics in Sherwood, males aged under 5 years and females aged 5 years are the age groups that are most secure financially, with 100.0% of males and 100.0% of females in these age groups living above the poverty line.
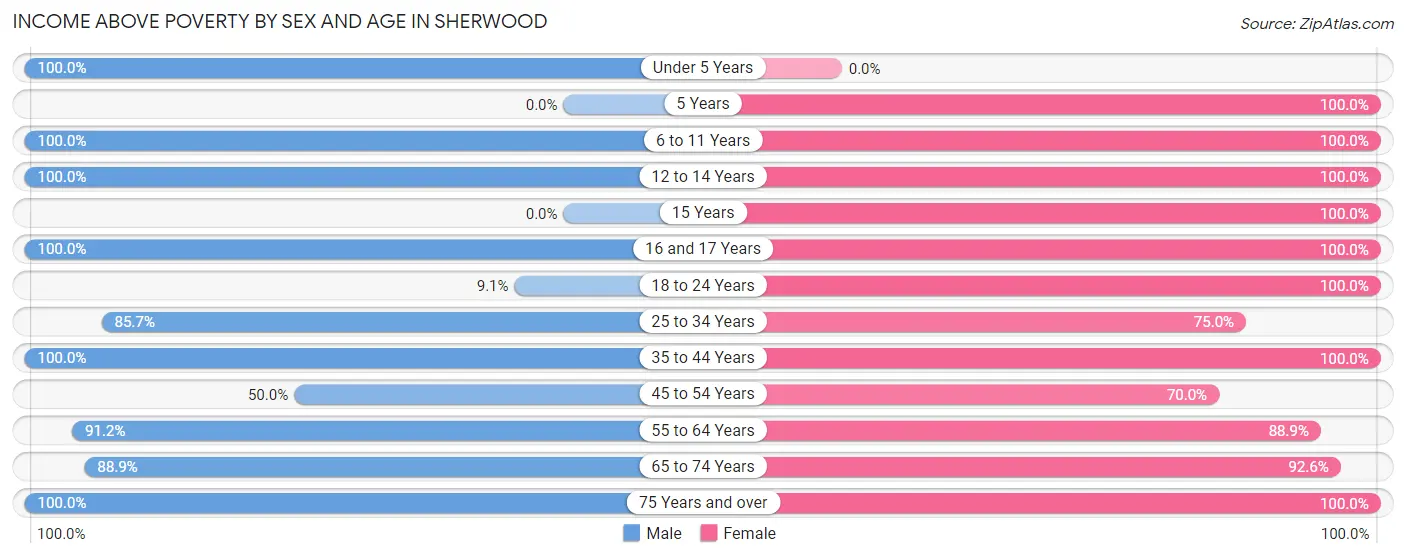
| Age Bracket | Male | Female |
| Under 5 Years | 5 (100.0%) | 0 (0.0%) |
| 5 Years | 0 (0.0%) | 4 (100.0%) |
| 6 to 11 Years | 12 (100.0%) | 2 (100.0%) |
| 12 to 14 Years | 3 (100.0%) | 2 (100.0%) |
| 15 Years | 0 (0.0%) | 8 (100.0%) |
| 16 and 17 Years | 1 (100.0%) | 15 (100.0%) |
| 18 to 24 Years | 1 (9.1%) | 5 (100.0%) |
| 25 to 34 Years | 12 (85.7%) | 9 (75.0%) |
| 35 to 44 Years | 10 (100.0%) | 4 (100.0%) |
| 45 to 54 Years | 3 (50.0%) | 7 (70.0%) |
| 55 to 64 Years | 31 (91.2%) | 8 (88.9%) |
| 65 to 74 Years | 8 (88.9%) | 25 (92.6%) |
| 75 Years and over | 22 (100.0%) | 6 (100.0%) |
| Total | 108 (85.0%) | 95 (91.3%) |
Income Below Poverty Among Married-Couple Families in Sherwood
The poverty statistics for married-couple families in Sherwood show that 2.0% or 1 of the total 50 families live below the poverty line. Families with no children have the highest poverty rate of 2.6%, comprising of 1 families. On the other hand, families with 1 or 2 children have the lowest poverty rate of 0.0%, which includes 0 families.
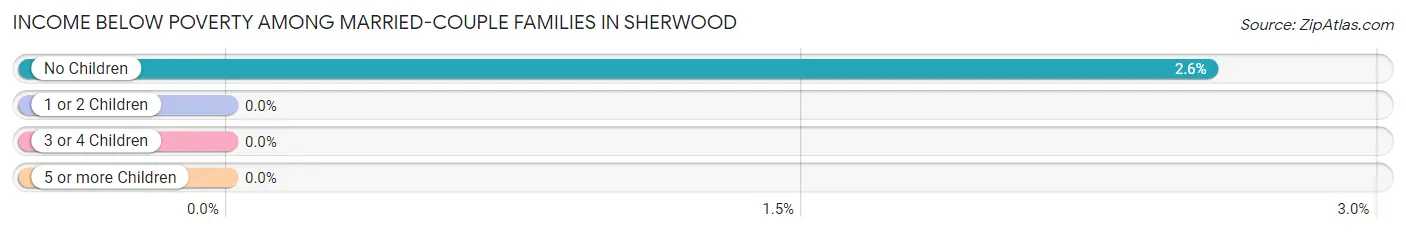
| Children | Above Poverty | Below Poverty |
| No Children | 38 (97.4%) | 1 (2.6%) |
| 1 or 2 Children | 7 (100.0%) | 0 (0.0%) |
| 3 or 4 Children | 4 (100.0%) | 0 (0.0%) |
| 5 or more Children | 0 (0.0%) | 0 (0.0%) |
| Total | 49 (98.0%) | 1 (2.0%) |
Income Below Poverty Among Single-Parent Households in Sherwood
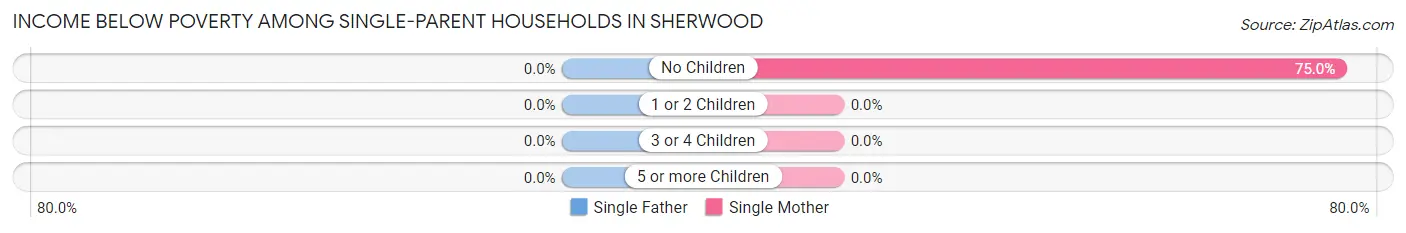
| Children | Single Father | Single Mother |
| No Children | 0 (0.0%) | 3 (75.0%) |
| 1 or 2 Children | 0 (0.0%) | 0 (0.0%) |
| 3 or 4 Children | 0 (0.0%) | 0 (0.0%) |
| 5 or more Children | 0 (0.0%) | 0 (0.0%) |
| Total | 0 (0.0%) | 3 (75.0%) |
Income Below Poverty Among Married-Couple vs Single-Parent Households in Sherwood
The poverty data for Sherwood shows that 1 of the married-couple family households (2.0%) and 3 of the single-parent households (33.3%) are living below the poverty level. Within the married-couple family households, those with no children have the highest poverty rate, with 1 households (2.6%) falling below the poverty line. Among the single-parent households, those with no children have the highest poverty rate, with 3 household (60.0%) living below poverty.
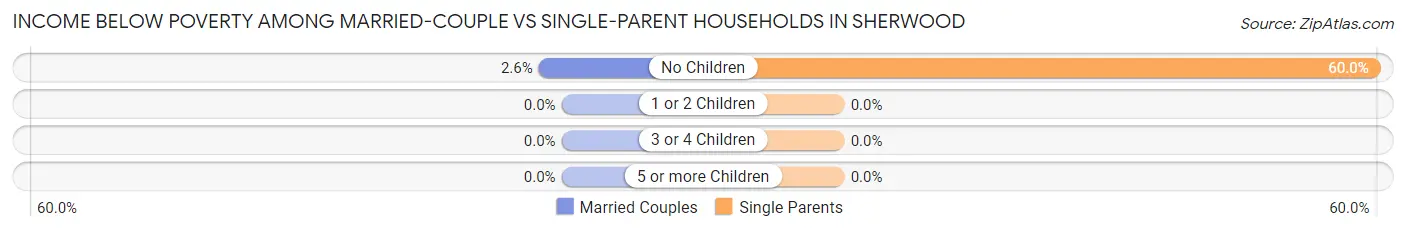
| Children | Married-Couple Families | Single-Parent Households |
| No Children | 1 (2.6%) | 3 (60.0%) |
| 1 or 2 Children | 0 (0.0%) | 0 (0.0%) |
| 3 or 4 Children | 0 (0.0%) | 0 (0.0%) |
| 5 or more Children | 0 (0.0%) | 0 (0.0%) |
| Total | 1 (2.0%) | 3 (33.3%) |
Race in Sherwood
The most populous races in Sherwood are White / Caucasian (235 | 99.6%), and Two or more Races (1 | 0.4%).
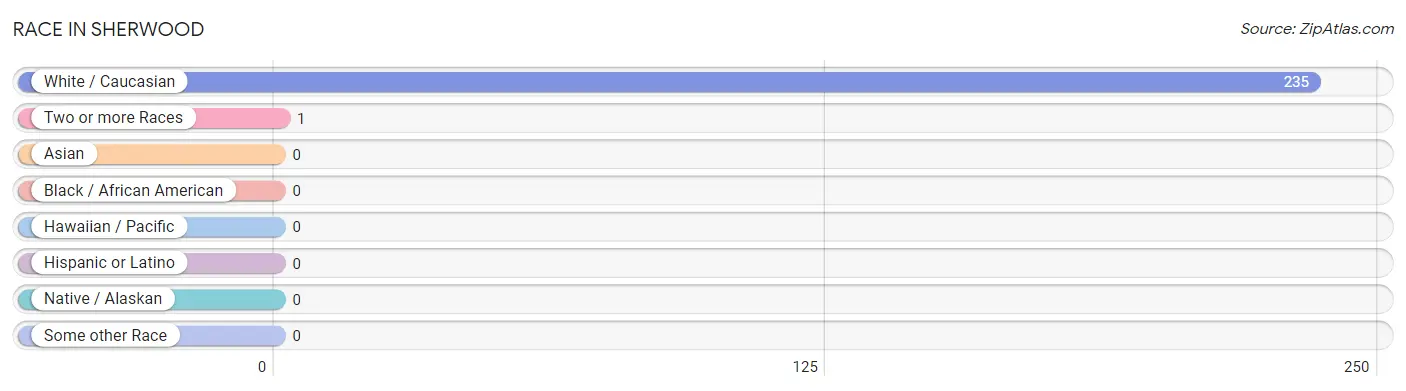
| Race | # Population | % Population |
| Asian | 0 | 0.0% |
| Black / African American | 0 | 0.0% |
| Hawaiian / Pacific | 0 | 0.0% |
| Hispanic or Latino | 0 | 0.0% |
| Native / Alaskan | 0 | 0.0% |
| White / Caucasian | 235 | 99.6% |
| Two or more Races | 1 | 0.4% |
| Some other Race | 0 | 0.0% |
| Total | 236 | 100.0% |
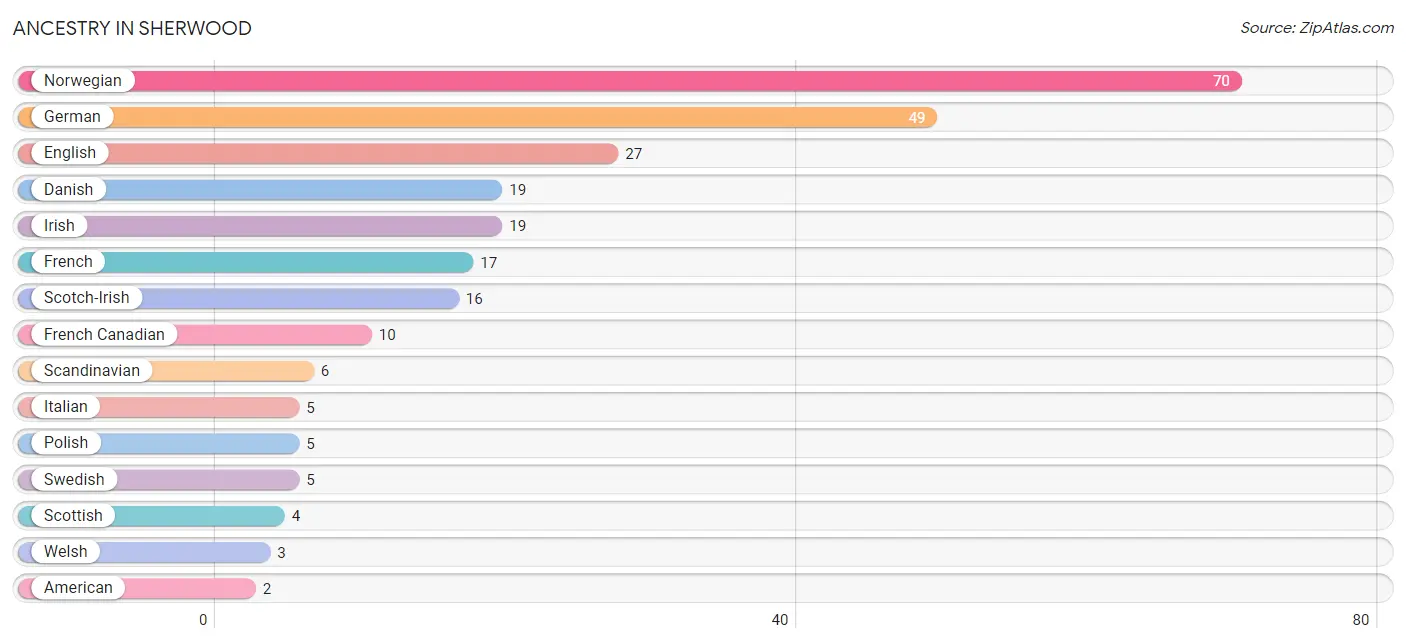
Ancestry in Sherwood
The most populous ancestries reported in Sherwood are Norwegian (70 | 29.7%), German (49 | 20.8%), English (27 | 11.4%), Danish (19 | 8.1%), and Irish (19 | 8.1%), together accounting for 78.0% of all Sherwood residents.
| Ancestry | # Population | % Population |
| American | 2 | 0.9% |
| Danish | 19 | 8.1% |
| Dutch | 1 | 0.4% |
| English | 27 | 11.4% |
| French | 17 | 7.2% |
| French Canadian | 10 | 4.2% |
| German | 49 | 20.8% |
| Irish | 19 | 8.1% |
| Italian | 5 | 2.1% |
| Norwegian | 70 | 29.7% |
| Polish | 5 | 2.1% |
| Scandinavian | 6 | 2.5% |
| Scotch-Irish | 16 | 6.8% |
| Scottish | 4 | 1.7% |
| Swedish | 5 | 2.1% |
| Ukrainian | 1 | 0.4% |
| Welsh | 3 | 1.3% | View All 17 Rows |
Immigrants in Sherwood
The most numerous immigrant groups reported in Sherwood came from , and Canada (6 | 2.5%), together accounting for 2.5% of all Sherwood residents.

| Immigration Origin | # Population | % Population |
| Canada | 6 | 2.5% | View All 1 Rows |
Sex and Age in Sherwood
Sex and Age in Sherwood
The most populous age groups in Sherwood are 55 to 59 Years (23 | 17.4%) for men and 15 to 19 Years (26 | 25.0%) for women.
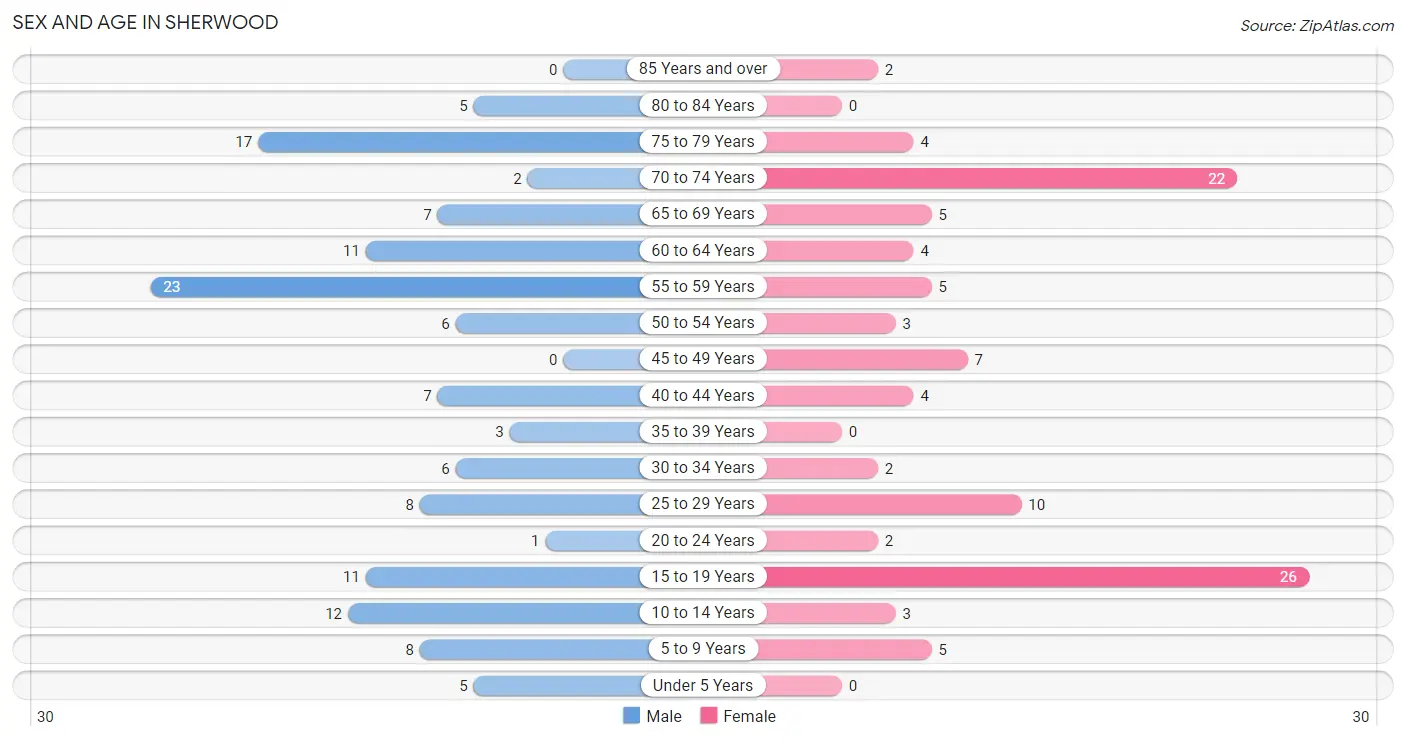
| Age Bracket | Male | Female |
| Under 5 Years | 5 (3.8%) | 0 (0.0%) |
| 5 to 9 Years | 8 (6.1%) | 5 (4.8%) |
| 10 to 14 Years | 12 (9.1%) | 3 (2.9%) |
| 15 to 19 Years | 11 (8.3%) | 26 (25.0%) |
| 20 to 24 Years | 1 (0.8%) | 2 (1.9%) |
| 25 to 29 Years | 8 (6.1%) | 10 (9.6%) |
| 30 to 34 Years | 6 (4.5%) | 2 (1.9%) |
| 35 to 39 Years | 3 (2.3%) | 0 (0.0%) |
| 40 to 44 Years | 7 (5.3%) | 4 (3.8%) |
| 45 to 49 Years | 0 (0.0%) | 7 (6.7%) |
| 50 to 54 Years | 6 (4.5%) | 3 (2.9%) |
| 55 to 59 Years | 23 (17.4%) | 5 (4.8%) |
| 60 to 64 Years | 11 (8.3%) | 4 (3.8%) |
| 65 to 69 Years | 7 (5.3%) | 5 (4.8%) |
| 70 to 74 Years | 2 (1.5%) | 22 (21.1%) |
| 75 to 79 Years | 17 (12.9%) | 4 (3.8%) |
| 80 to 84 Years | 5 (3.8%) | 0 (0.0%) |
| 85 Years and over | 0 (0.0%) | 2 (1.9%) |
| Total | 132 (100.0%) | 104 (100.0%) |
Families and Households in Sherwood
Median Family Size in Sherwood
The median family size in Sherwood is 3.10 persons per family, with single male/father families (5 | 8.5%) accounting for the largest median family size of 6.2 persons per family. On the other hand, married-couple families (50 | 84.8%) represent the smallest median family size with 2.68 persons per family.
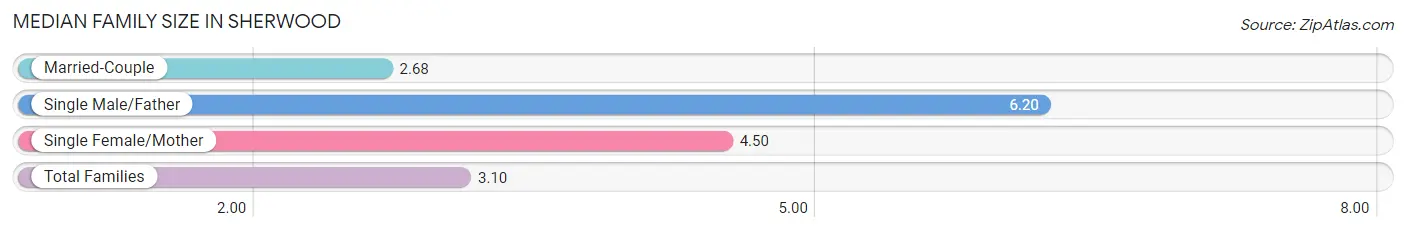
| Family Type | # Families | Family Size |
| Married-Couple | 50 (84.8%) | 2.68 |
| Single Male/Father | 5 (8.5%) | 6.20 |
| Single Female/Mother | 4 (6.8%) | 4.50 |
| Total Families | 59 (100.0%) | 3.10 |
Median Household Size in Sherwood
The median household size in Sherwood is 2.38 persons per household, with single male/father households (5 | 5.1%) accounting for the largest median household size of 6.2 persons per household. non-family households (40 | 40.4%) represent the smallest median household size with 1.33 persons per household.
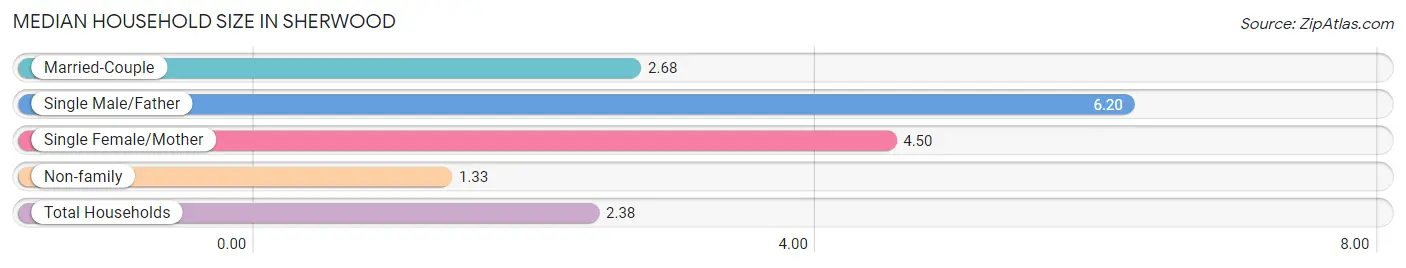
| Household Type | # Households | Household Size |
| Married-Couple | 50 (50.5%) | 2.68 |
| Single Male/Father | 5 (5.1%) | 6.20 |
| Single Female/Mother | 4 (4.0%) | 4.50 |
| Non-family | 40 (40.4%) | 1.33 |
| Total Households | 99 (100.0%) | 2.38 |
Household Size by Marriage Status in Sherwood
Out of a total of 99 households in Sherwood, 59 (59.6%) are family households, while 40 (40.4%) are nonfamily households. The most numerous type of family households are 2-person households, comprising 42, and the most common type of nonfamily households are 1-person households, comprising 35.
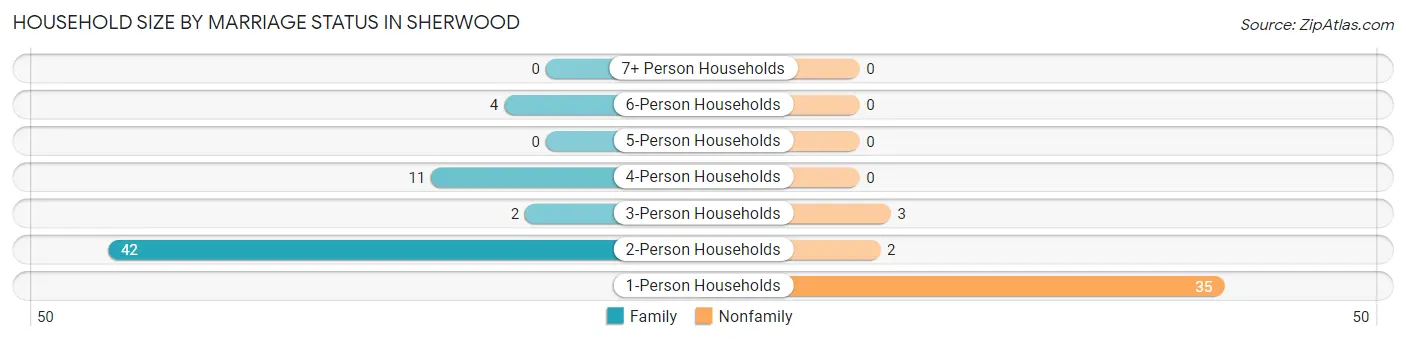
| Household Size | Family Households | Nonfamily Households |
| 1-Person Households | - | 35 (35.3%) |
| 2-Person Households | 42 (42.4%) | 2 (2.0%) |
| 3-Person Households | 2 (2.0%) | 3 (3.0%) |
| 4-Person Households | 11 (11.1%) | 0 (0.0%) |
| 5-Person Households | 0 (0.0%) | 0 (0.0%) |
| 6-Person Households | 4 (4.0%) | 0 (0.0%) |
| 7+ Person Households | 0 (0.0%) | 0 (0.0%) |
| Total | 59 (59.6%) | 40 (40.4%) |
Female Fertility in Sherwood
Fertility by Age in Sherwood
| Age Bracket | Women with Births | Births / 1,000 Women |
| 15 to 19 years | 0 (0.0%) | 0.0 |
| 20 to 34 years | 0 (0.0%) | 0.0 |
| 35 to 50 years | 0 (0.0%) | 0.0 |
| Total | 0 (0.0%) | 0.0 |
Fertility by Age by Marriage Status in Sherwood
| Age Bracket | Married | Unmarried |
| 15 to 19 years | 0 (0.0%) | 0 (0.0%) |
| 20 to 34 years | 0 (0.0%) | 0 (0.0%) |
| 35 to 50 years | 0 (0.0%) | 0 (0.0%) |
| Total | 0 (0.0%) | 0 (0.0%) |
Fertility by Education in Sherwood
| Educational Attainment | Women with Births | Births / 1,000 Women |
| Less than High School | 0 (0.0%) | 0.0 |
| High School Diploma | 0 (0.0%) | 0.0 |
| College or Associate's Degree | 0 (0.0%) | 0.0 |
| Bachelor's Degree | 0 (0.0%) | 0.0 |
| Graduate Degree | 0 (0.0%) | 0.0 |
| Total | 0 (0.0%) | 0.0 |
Fertility by Education by Marriage Status in Sherwood
| Educational Attainment | Married | Unmarried |
| Less than High School | 0 (0.0%) | 0 (0.0%) |
| High School Diploma | 0 (0.0%) | 0 (0.0%) |
| College or Associate's Degree | 0 (0.0%) | 0 (0.0%) |
| Bachelor's Degree | 0 (0.0%) | 0 (0.0%) |
| Graduate Degree | 0 (0.0%) | 0 (0.0%) |
| Total | 0 (0.0%) | 0 (0.0%) |
Employment Characteristics in Sherwood
Employment by Class of Employer in Sherwood
Among the 96 employed individuals in Sherwood, private company employees (45 | 46.9%), self-employed (incorporated) (15 | 15.6%), and self-employed (not incorporated) (14 | 14.6%) make up the most common classes of employment.
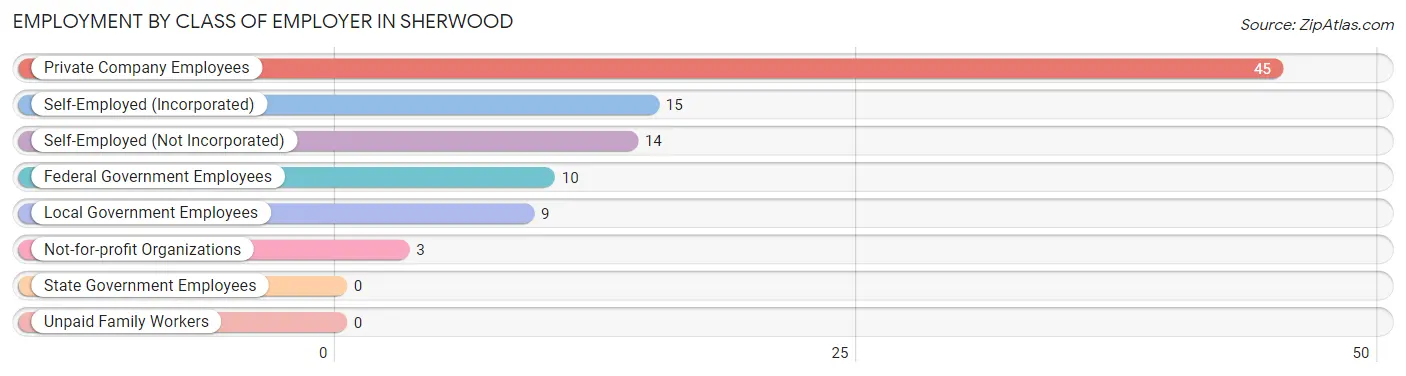
| Employer Class | # Employees | % Employees |
| Private Company Employees | 45 | 46.9% |
| Self-Employed (Incorporated) | 15 | 15.6% |
| Self-Employed (Not Incorporated) | 14 | 14.6% |
| Not-for-profit Organizations | 3 | 3.1% |
| Local Government Employees | 9 | 9.4% |
| State Government Employees | 0 | 0.0% |
| Federal Government Employees | 10 | 10.4% |
| Unpaid Family Workers | 0 | 0.0% |
| Total | 96 | 100.0% |
Employment Status by Age in Sherwood
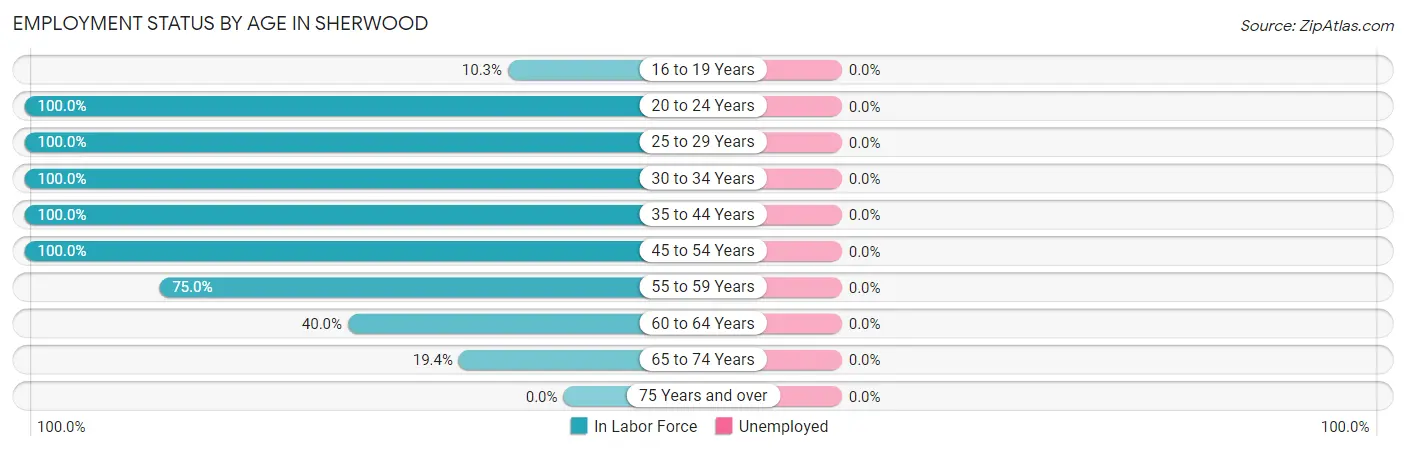
| Age Bracket | In Labor Force | Unemployed |
| 16 to 19 Years | 3 (10.3%) | 0 (0.0%) |
| 20 to 24 Years | 3 (100.0%) | 0 (0.0%) |
| 25 to 29 Years | 18 (100.0%) | 0 (0.0%) |
| 30 to 34 Years | 8 (100.0%) | 0 (0.0%) |
| 35 to 44 Years | 14 (100.0%) | 0 (0.0%) |
| 45 to 54 Years | 16 (100.0%) | 0 (0.0%) |
| 55 to 59 Years | 21 (75.0%) | 0 (0.0%) |
| 60 to 64 Years | 6 (40.0%) | 0 (0.0%) |
| 65 to 74 Years | 7 (19.4%) | 0 (0.0%) |
| 75 Years and over | 0 (0.0%) | 0 (0.0%) |
| Total | 96 (49.2%) | 0 (0.0%) |
Employment Status by Educational Attainment in Sherwood
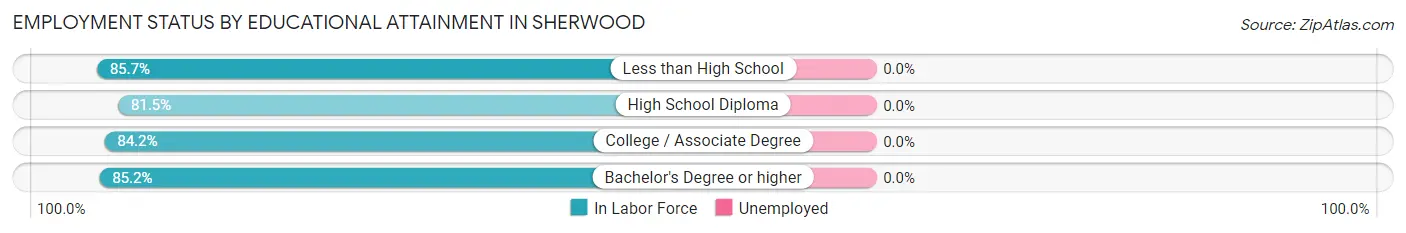
| Educational Attainment | In Labor Force | Unemployed |
| Less than High School | 6 (85.7%) | 0 (0.0%) |
| High School Diploma | 22 (81.5%) | 0 (0.0%) |
| College / Associate Degree | 32 (84.2%) | 0 (0.0%) |
| Bachelor's Degree or higher | 23 (85.2%) | 0 (0.0%) |
| Total | 83 (83.8%) | 0 (0.0%) |
Employment Occupations by Sex in Sherwood
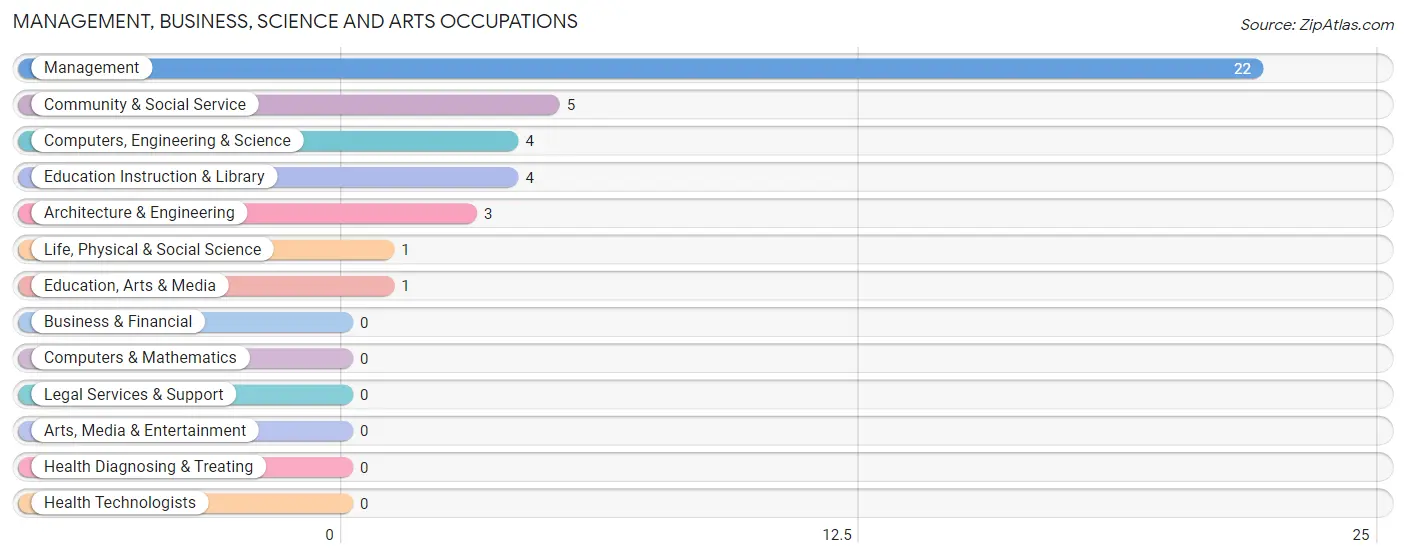
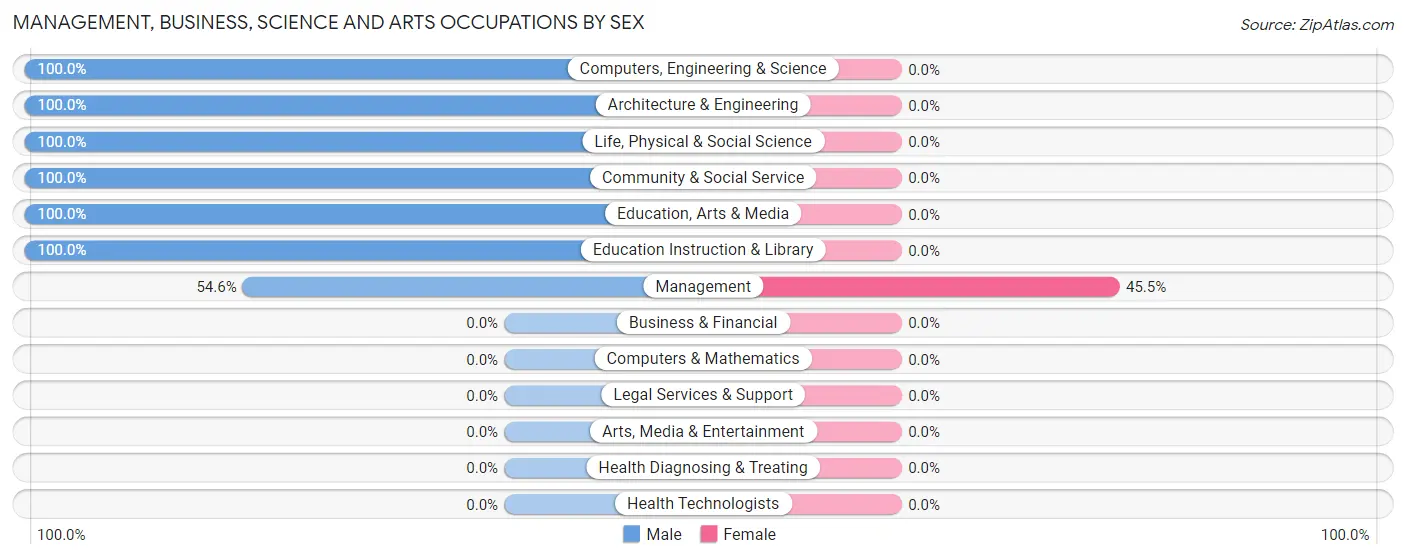
Management, Business, Science and Arts Occupations
The most common Management, Business, Science and Arts occupations in Sherwood are Management (22 | 22.9%), Community & Social Service (5 | 5.2%), Computers, Engineering & Science (4 | 4.2%), Education Instruction & Library (4 | 4.2%), and Architecture & Engineering (3 | 3.1%).
Management, Business, Science and Arts Occupations by Sex
| Occupation | Male | Female |
| Management | 12 (54.5%) | 10 (45.5%) |
| Business & Financial | 0 (0.0%) | 0 (0.0%) |
| Computers, Engineering & Science | 4 (100.0%) | 0 (0.0%) |
| Computers & Mathematics | 0 (0.0%) | 0 (0.0%) |
| Architecture & Engineering | 3 (100.0%) | 0 (0.0%) |
| Life, Physical & Social Science | 1 (100.0%) | 0 (0.0%) |
| Community & Social Service | 5 (100.0%) | 0 (0.0%) |
| Education, Arts & Media | 1 (100.0%) | 0 (0.0%) |
| Legal Services & Support | 0 (0.0%) | 0 (0.0%) |
| Education Instruction & Library | 4 (100.0%) | 0 (0.0%) |
| Arts, Media & Entertainment | 0 (0.0%) | 0 (0.0%) |
| Health Diagnosing & Treating | 0 (0.0%) | 0 (0.0%) |
| Health Technologists | 0 (0.0%) | 0 (0.0%) |
| Total (Category) | 21 (67.7%) | 10 (32.3%) |
| Total (Overall) | 61 (63.5%) | 35 (36.5%) |
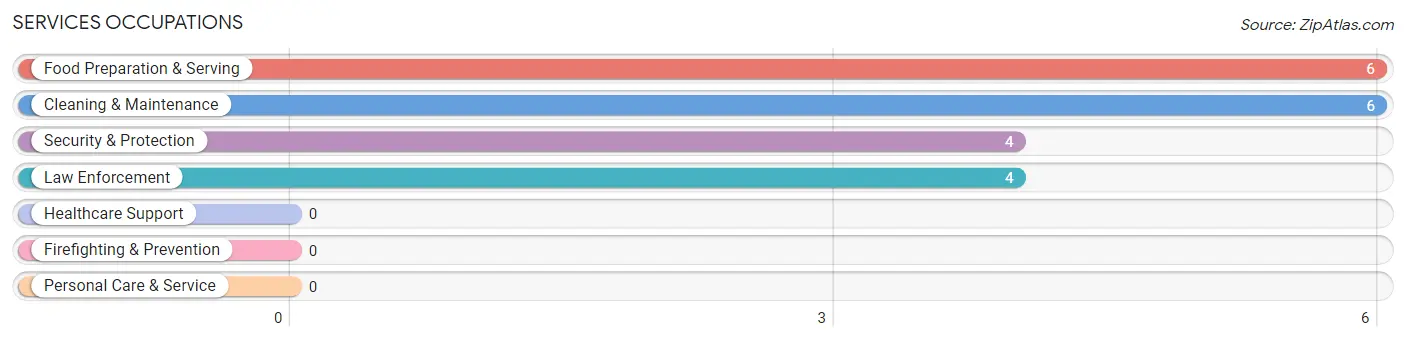
Services Occupations
The most common Services occupations in Sherwood are Food Preparation & Serving (6 | 6.2%), Cleaning & Maintenance (6 | 6.2%), Security & Protection (4 | 4.2%), and Law Enforcement (4 | 4.2%).
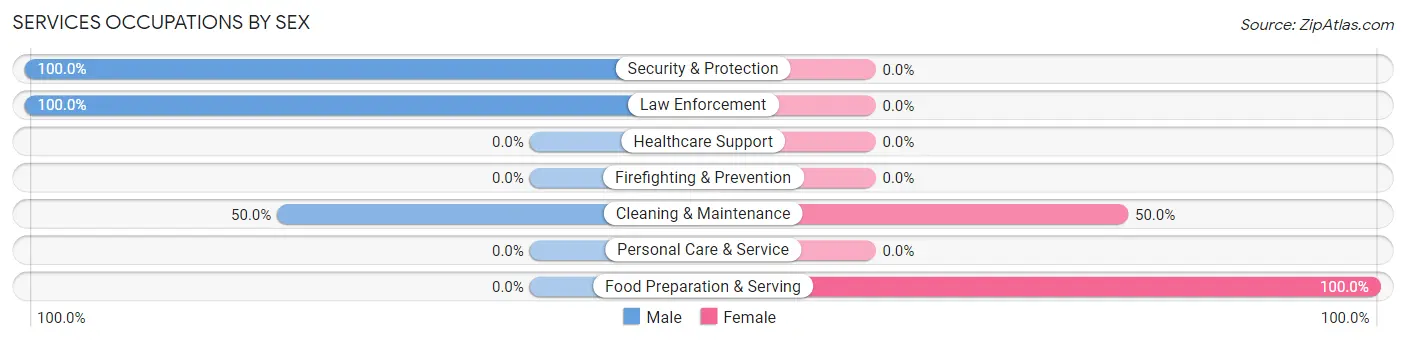
Services Occupations by Sex
Within the Services occupations in Sherwood, the most male-oriented occupations are Security & Protection (100.0%), Law Enforcement (100.0%), and Cleaning & Maintenance (50.0%), while the most female-oriented occupations are Food Preparation & Serving (100.0%), and Cleaning & Maintenance (50.0%).
| Occupation | Male | Female |
| Healthcare Support | 0 (0.0%) | 0 (0.0%) |
| Security & Protection | 4 (100.0%) | 0 (0.0%) |
| Firefighting & Prevention | 0 (0.0%) | 0 (0.0%) |
| Law Enforcement | 4 (100.0%) | 0 (0.0%) |
| Food Preparation & Serving | 0 (0.0%) | 6 (100.0%) |
| Cleaning & Maintenance | 3 (50.0%) | 3 (50.0%) |
| Personal Care & Service | 0 (0.0%) | 0 (0.0%) |
| Total (Category) | 7 (43.8%) | 9 (56.2%) |
| Total (Overall) | 61 (63.5%) | 35 (36.5%) |
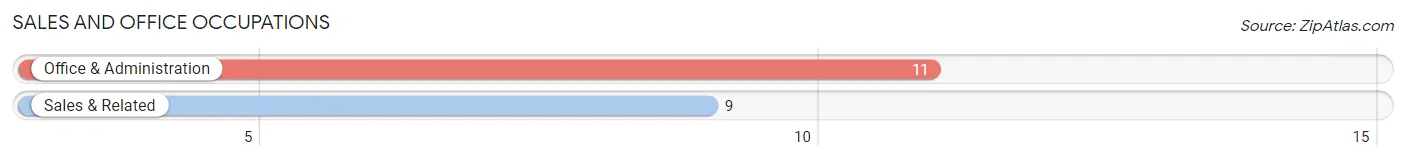
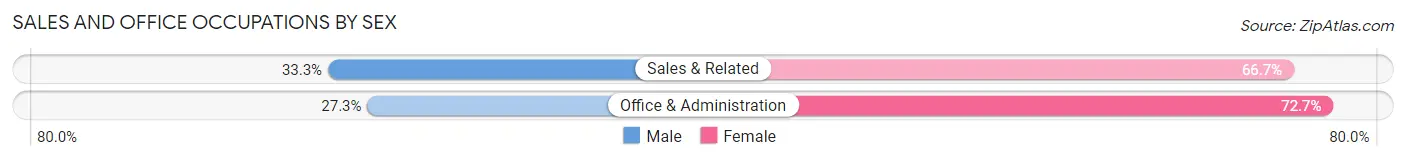
Sales and Office Occupations
The most common Sales and Office occupations in Sherwood are Office & Administration (11 | 11.5%), and Sales & Related (9 | 9.4%).
Sales and Office Occupations by Sex
| Occupation | Male | Female |
| Sales & Related | 3 (33.3%) | 6 (66.7%) |
| Office & Administration | 3 (27.3%) | 8 (72.7%) |
| Total (Category) | 6 (30.0%) | 14 (70.0%) |
| Total (Overall) | 61 (63.5%) | 35 (36.5%) |
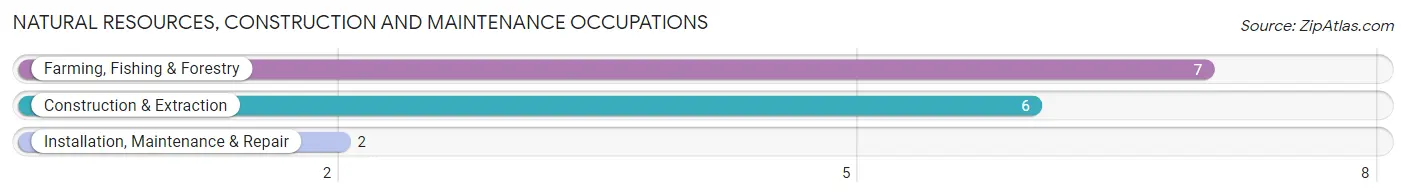
Natural Resources, Construction and Maintenance Occupations
The most common Natural Resources, Construction and Maintenance occupations in Sherwood are Farming, Fishing & Forestry (7 | 7.3%), Construction & Extraction (6 | 6.2%), and Installation, Maintenance & Repair (2 | 2.1%).
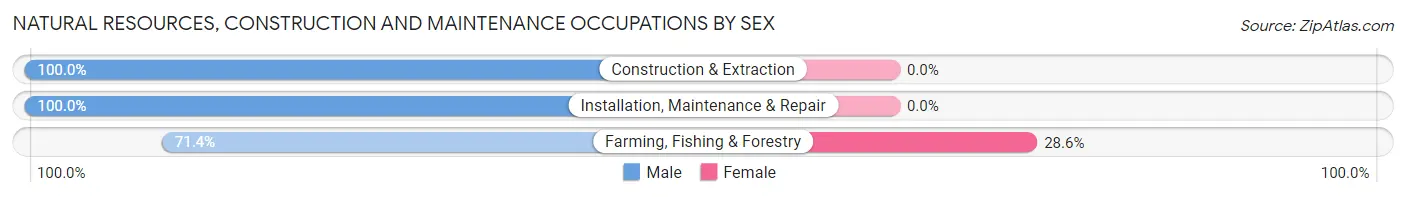
Natural Resources, Construction and Maintenance Occupations by Sex
| Occupation | Male | Female |
| Farming, Fishing & Forestry | 5 (71.4%) | 2 (28.6%) |
| Construction & Extraction | 6 (100.0%) | 0 (0.0%) |
| Installation, Maintenance & Repair | 2 (100.0%) | 0 (0.0%) |
| Total (Category) | 13 (86.7%) | 2 (13.3%) |
| Total (Overall) | 61 (63.5%) | 35 (36.5%) |
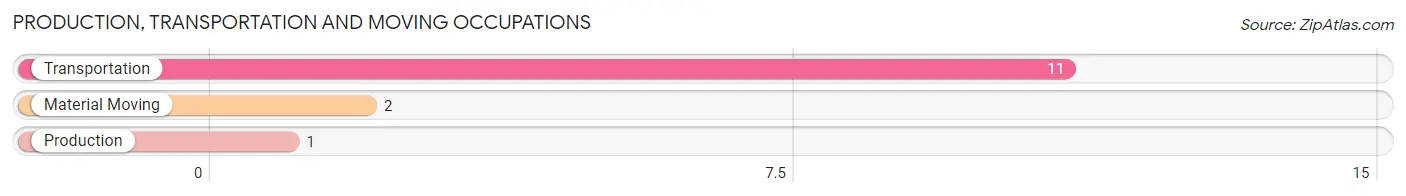
Production, Transportation and Moving Occupations
The most common Production, Transportation and Moving occupations in Sherwood are Transportation (11 | 11.5%), Material Moving (2 | 2.1%), and Production (1 | 1.0%).
Production, Transportation and Moving Occupations by Sex
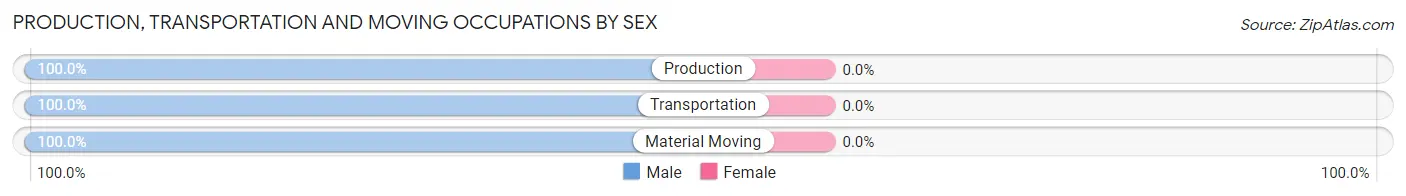
| Occupation | Male | Female |
| Production | 1 (100.0%) | 0 (0.0%) |
| Transportation | 11 (100.0%) | 0 (0.0%) |
| Material Moving | 2 (100.0%) | 0 (0.0%) |
| Total (Category) | 14 (100.0%) | 0 (0.0%) |
| Total (Overall) | 61 (63.5%) | 35 (36.5%) |
Employment Industries by Sex in Sherwood
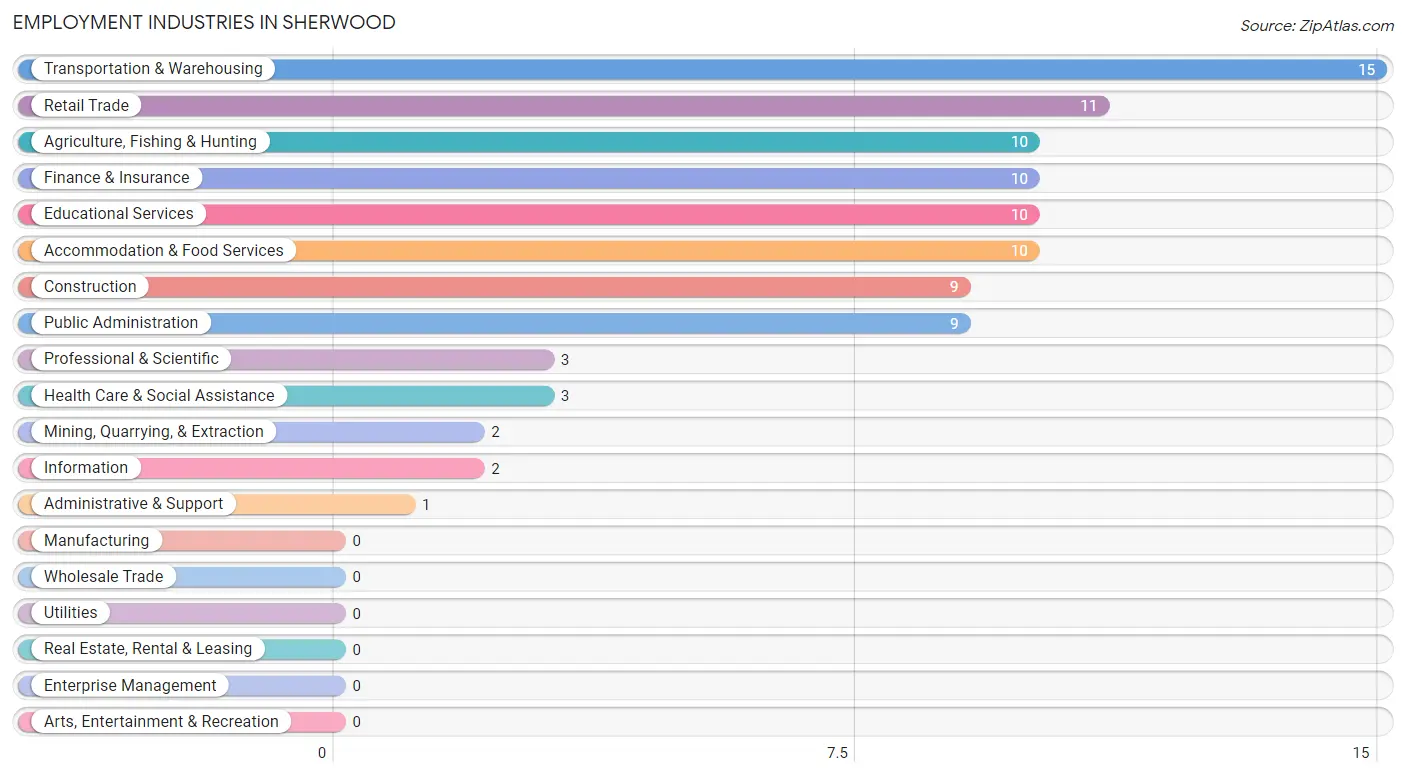
Employment Industries in Sherwood
The major employment industries in Sherwood include Transportation & Warehousing (15 | 15.6%), Retail Trade (11 | 11.5%), Agriculture, Fishing & Hunting (10 | 10.4%), Finance & Insurance (10 | 10.4%), and Educational Services (10 | 10.4%).
Employment Industries by Sex in Sherwood
The Sherwood industries that see more men than women are Agriculture, Fishing & Hunting (100.0%), Mining, Quarrying, & Extraction (100.0%), and Professional & Scientific (100.0%), whereas the industries that tend to have a higher number of women are Information (100.0%), Health Care & Social Assistance (100.0%), and Accommodation & Food Services (100.0%).
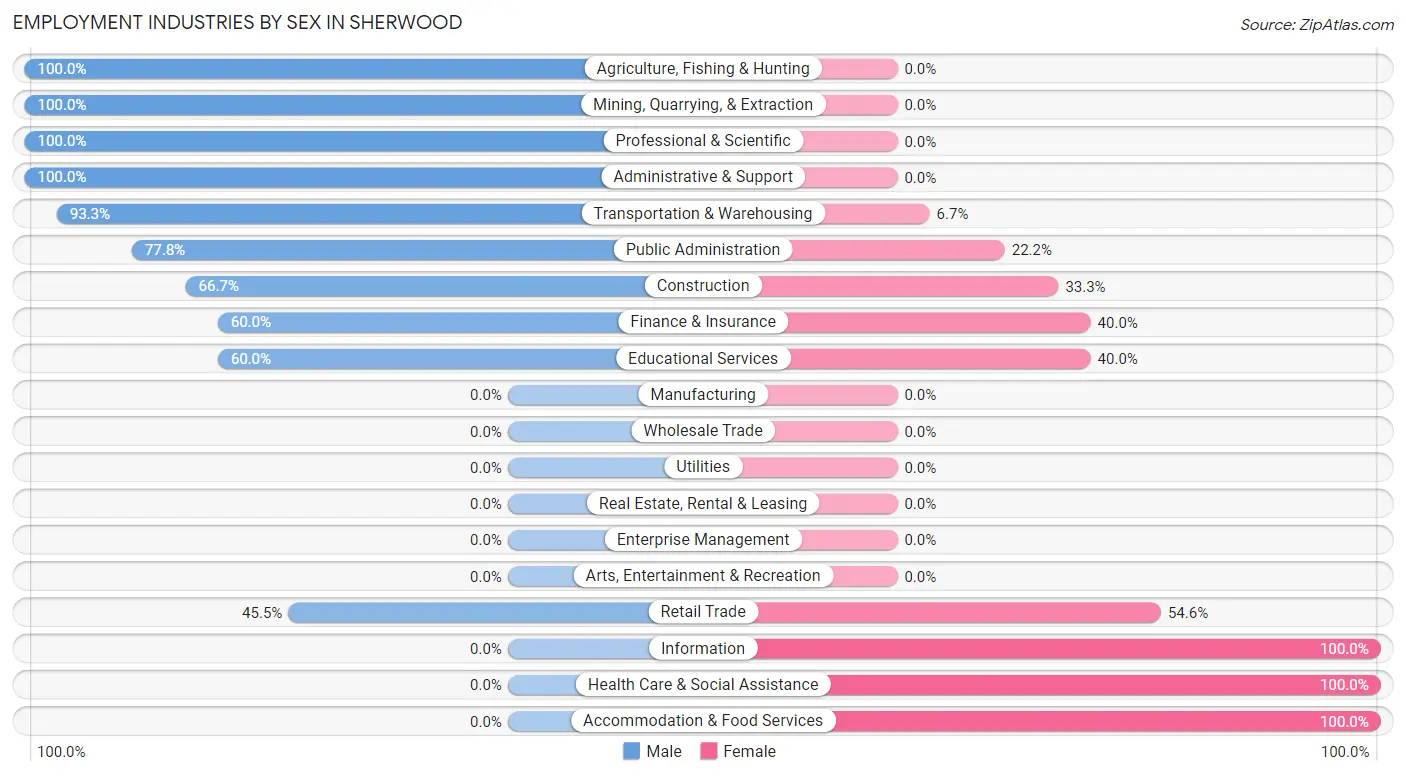
| Industry | Male | Female |
| Agriculture, Fishing & Hunting | 10 (100.0%) | 0 (0.0%) |
| Mining, Quarrying, & Extraction | 2 (100.0%) | 0 (0.0%) |
| Construction | 6 (66.7%) | 3 (33.3%) |
| Manufacturing | 0 (0.0%) | 0 (0.0%) |
| Wholesale Trade | 0 (0.0%) | 0 (0.0%) |
| Retail Trade | 5 (45.5%) | 6 (54.5%) |
| Transportation & Warehousing | 14 (93.3%) | 1 (6.7%) |
| Utilities | 0 (0.0%) | 0 (0.0%) |
| Information | 0 (0.0%) | 2 (100.0%) |
| Finance & Insurance | 6 (60.0%) | 4 (40.0%) |
| Real Estate, Rental & Leasing | 0 (0.0%) | 0 (0.0%) |
| Professional & Scientific | 3 (100.0%) | 0 (0.0%) |
| Enterprise Management | 0 (0.0%) | 0 (0.0%) |
| Administrative & Support | 1 (100.0%) | 0 (0.0%) |
| Educational Services | 6 (60.0%) | 4 (40.0%) |
| Health Care & Social Assistance | 0 (0.0%) | 3 (100.0%) |
| Arts, Entertainment & Recreation | 0 (0.0%) | 0 (0.0%) |
| Accommodation & Food Services | 0 (0.0%) | 10 (100.0%) |
| Public Administration | 7 (77.8%) | 2 (22.2%) |
| Total | 61 (63.5%) | 35 (36.5%) |
Education in Sherwood
School Enrollment in Sherwood
The most common levels of schooling among the 52 students in Sherwood are high school (23 | 44.2%), elementary school (9 | 17.3%), and middle school (8 | 15.4%).
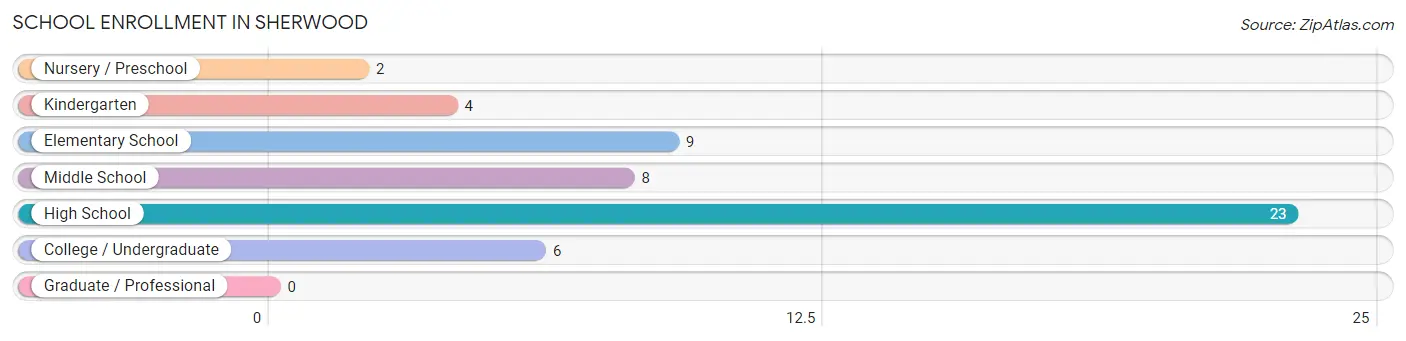
| School Level | # Students | % Students |
| Nursery / Preschool | 2 | 3.8% |
| Kindergarten | 4 | 7.7% |
| Elementary School | 9 | 17.3% |
| Middle School | 8 | 15.4% |
| High School | 23 | 44.2% |
| College / Undergraduate | 6 | 11.5% |
| Graduate / Professional | 0 | 0.0% |
| Total | 52 | 100.0% |
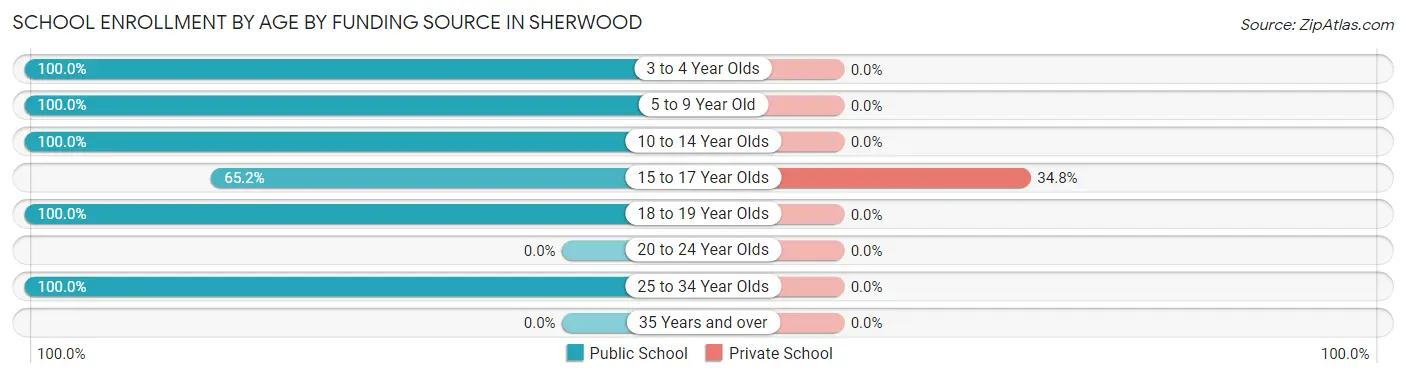
School Enrollment by Age by Funding Source in Sherwood
Out of a total of 52 students who are enrolled in schools in Sherwood, 8 (15.4%) attend a private institution, while the remaining 44 (84.6%) are enrolled in public schools. The age group of 15 to 17 year olds has the highest likelihood of being enrolled in private schools, with 8 (34.8% in the age bracket) enrolled. Conversely, the age group of 3 to 4 year olds has the lowest likelihood of being enrolled in a private school, with 2 (100.0% in the age bracket) attending a public institution.
| Age Bracket | Public School | Private School |
| 3 to 4 Year Olds | 2 (100.0%) | 0 (0.0%) |
| 5 to 9 Year Old | 13 (100.0%) | 0 (0.0%) |
| 10 to 14 Year Olds | 8 (100.0%) | 0 (0.0%) |
| 15 to 17 Year Olds | 15 (65.2%) | 8 (34.8%) |
| 18 to 19 Year Olds | 3 (100.0%) | 0 (0.0%) |
| 20 to 24 Year Olds | 0 (0.0%) | 0 (0.0%) |
| 25 to 34 Year Olds | 3 (100.0%) | 0 (0.0%) |
| 35 Years and over | 0 (0.0%) | 0 (0.0%) |
| Total | 44 (84.6%) | 8 (15.4%) |
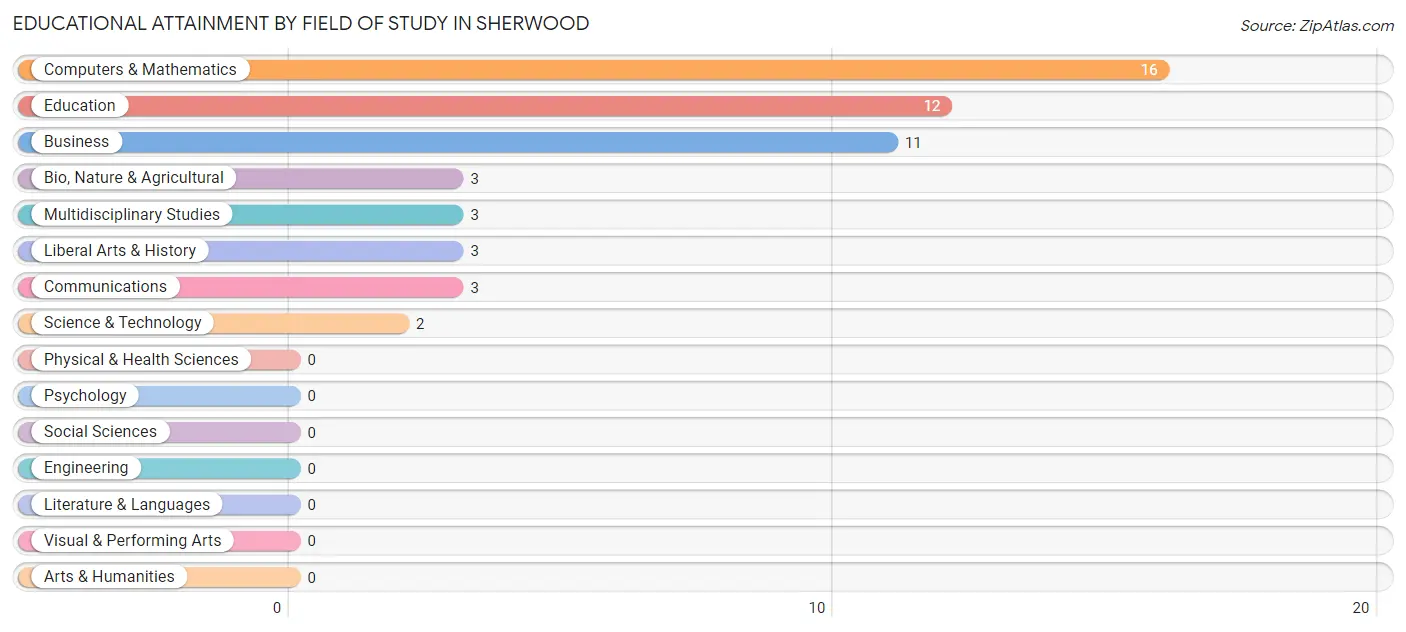
Educational Attainment by Field of Study in Sherwood
Computers & mathematics (16 | 30.2%), education (12 | 22.6%), business (11 | 20.7%), bio, nature & agricultural (3 | 5.7%), and multidisciplinary studies (3 | 5.7%) are the most common fields of study among 53 individuals in Sherwood who have obtained a bachelor's degree or higher.
| Field of Study | # Graduates | % Graduates |
| Computers & Mathematics | 16 | 30.2% |
| Bio, Nature & Agricultural | 3 | 5.7% |
| Physical & Health Sciences | 0 | 0.0% |
| Psychology | 0 | 0.0% |
| Social Sciences | 0 | 0.0% |
| Engineering | 0 | 0.0% |
| Multidisciplinary Studies | 3 | 5.7% |
| Science & Technology | 2 | 3.8% |
| Business | 11 | 20.7% |
| Education | 12 | 22.6% |
| Literature & Languages | 0 | 0.0% |
| Liberal Arts & History | 3 | 5.7% |
| Visual & Performing Arts | 0 | 0.0% |
| Communications | 3 | 5.7% |
| Arts & Humanities | 0 | 0.0% |
| Total | 53 | 100.0% |
Transportation & Commute in Sherwood
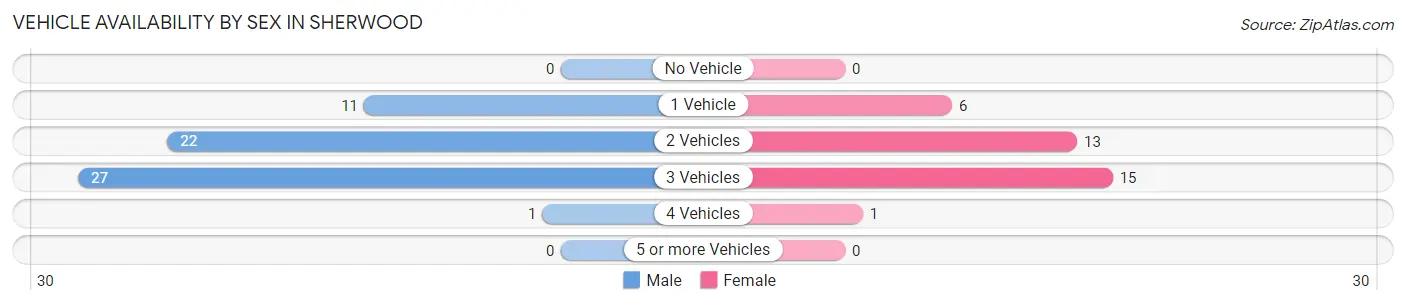
Vehicle Availability by Sex in Sherwood
The most prevalent vehicle ownership categories in Sherwood are males with 3 vehicles (27, accounting for 44.3%) and females with 3 vehicles (15, making up 77.1%).
| Vehicles Available | Male | Female |
| No Vehicle | 0 (0.0%) | 0 (0.0%) |
| 1 Vehicle | 11 (18.0%) | 6 (17.1%) |
| 2 Vehicles | 22 (36.1%) | 13 (37.1%) |
| 3 Vehicles | 27 (44.3%) | 15 (42.9%) |
| 4 Vehicles | 1 (1.6%) | 1 (2.9%) |
| 5 or more Vehicles | 0 (0.0%) | 0 (0.0%) |
| Total | 61 (100.0%) | 35 (100.0%) |
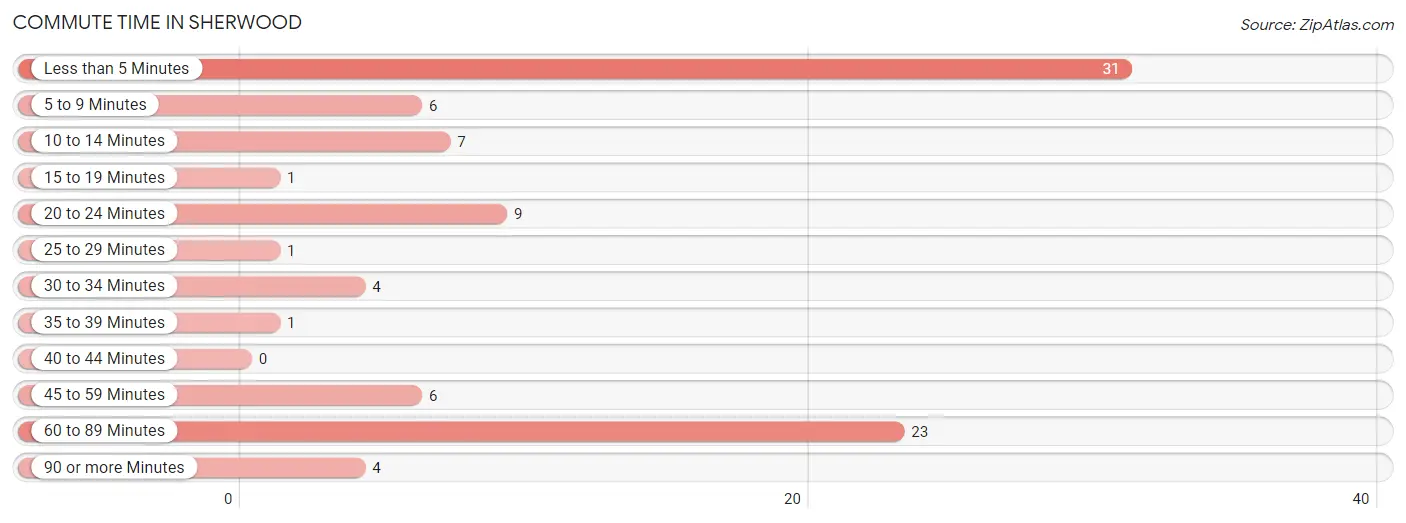
Commute Time in Sherwood
The most frequently occuring commute durations in Sherwood are less than 5 minutes (31 commuters, 33.3%), 60 to 89 minutes (23 commuters, 24.7%), and 20 to 24 minutes (9 commuters, 9.7%).
| Commute Time | # Commuters | % Commuters |
| Less than 5 Minutes | 31 | 33.3% |
| 5 to 9 Minutes | 6 | 6.5% |
| 10 to 14 Minutes | 7 | 7.5% |
| 15 to 19 Minutes | 1 | 1.1% |
| 20 to 24 Minutes | 9 | 9.7% |
| 25 to 29 Minutes | 1 | 1.1% |
| 30 to 34 Minutes | 4 | 4.3% |
| 35 to 39 Minutes | 1 | 1.1% |
| 40 to 44 Minutes | 0 | 0.0% |
| 45 to 59 Minutes | 6 | 6.5% |
| 60 to 89 Minutes | 23 | 24.7% |
| 90 or more Minutes | 4 | 4.3% |
Commute Time by Sex in Sherwood
The most common commute times in Sherwood are less than 5 minutes (20 commuters, 32.8%) for males and less than 5 minutes (11 commuters, 34.4%) for females.
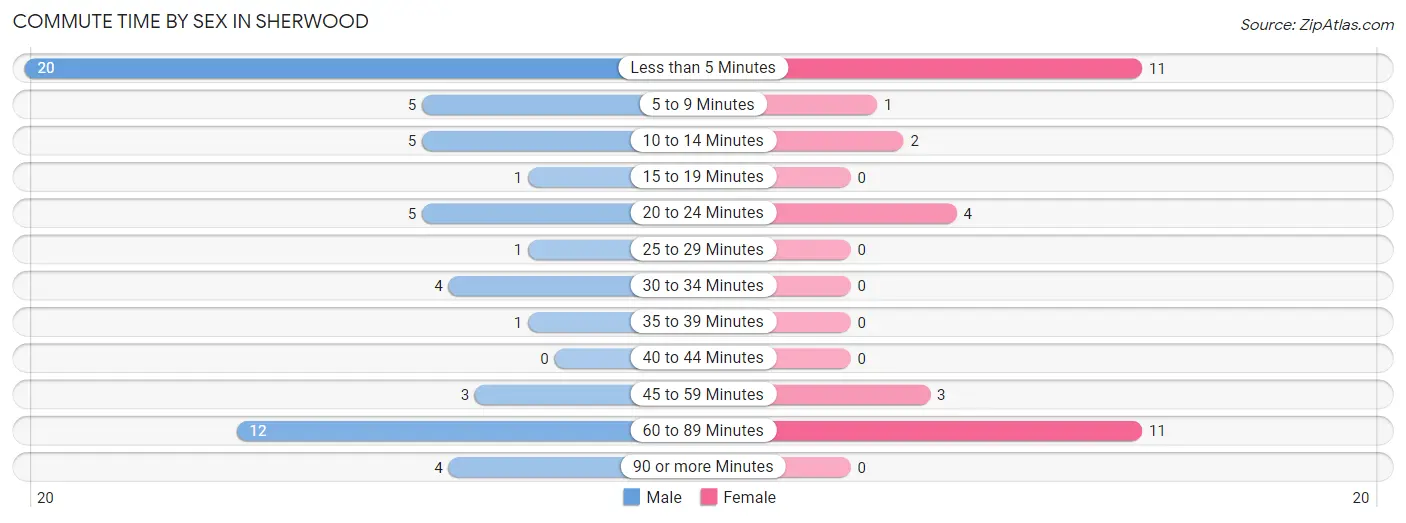
| Commute Time | Male | Female |
| Less than 5 Minutes | 20 (32.8%) | 11 (34.4%) |
| 5 to 9 Minutes | 5 (8.2%) | 1 (3.1%) |
| 10 to 14 Minutes | 5 (8.2%) | 2 (6.2%) |
| 15 to 19 Minutes | 1 (1.6%) | 0 (0.0%) |
| 20 to 24 Minutes | 5 (8.2%) | 4 (12.5%) |
| 25 to 29 Minutes | 1 (1.6%) | 0 (0.0%) |
| 30 to 34 Minutes | 4 (6.6%) | 0 (0.0%) |
| 35 to 39 Minutes | 1 (1.6%) | 0 (0.0%) |
| 40 to 44 Minutes | 0 (0.0%) | 0 (0.0%) |
| 45 to 59 Minutes | 3 (4.9%) | 3 (9.4%) |
| 60 to 89 Minutes | 12 (19.7%) | 11 (34.4%) |
| 90 or more Minutes | 4 (6.6%) | 0 (0.0%) |
Time of Departure to Work by Sex in Sherwood
The most frequent times of departure to work in Sherwood are 8:00 AM to 8:29 AM (24, 39.3%) for males and 8:00 AM to 8:29 AM (10, 31.2%) for females.
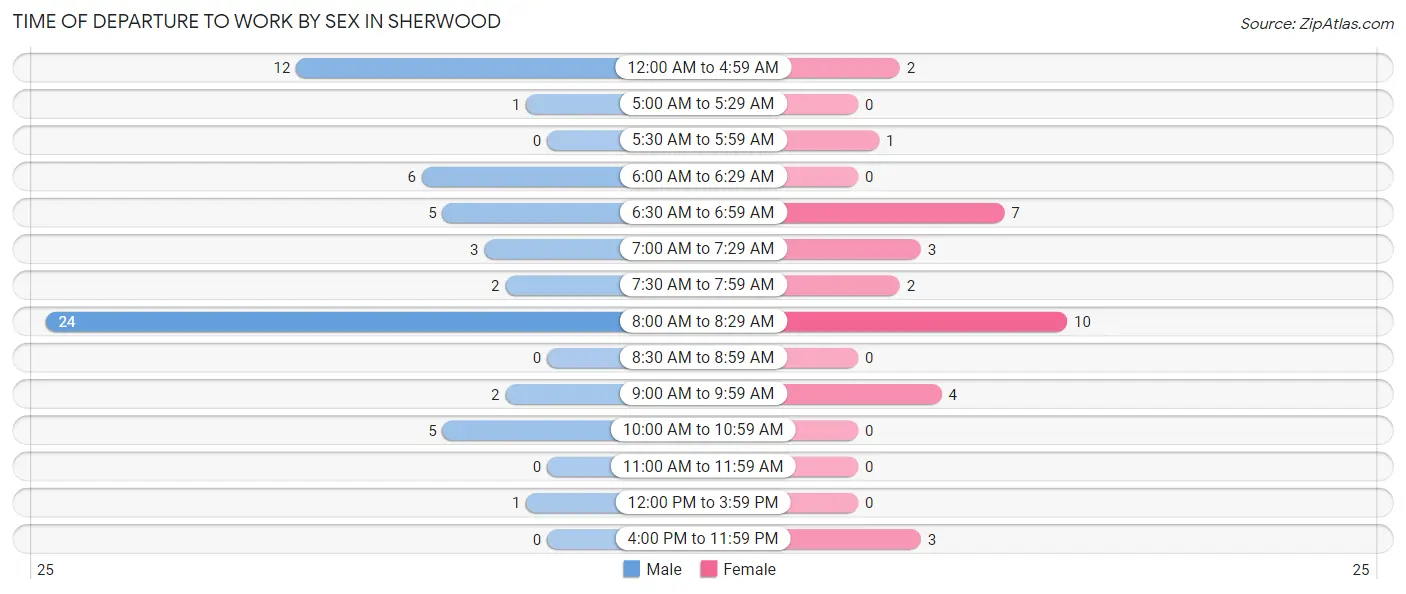
| Time of Departure | Male | Female |
| 12:00 AM to 4:59 AM | 12 (19.7%) | 2 (6.2%) |
| 5:00 AM to 5:29 AM | 1 (1.6%) | 0 (0.0%) |
| 5:30 AM to 5:59 AM | 0 (0.0%) | 1 (3.1%) |
| 6:00 AM to 6:29 AM | 6 (9.8%) | 0 (0.0%) |
| 6:30 AM to 6:59 AM | 5 (8.2%) | 7 (21.9%) |
| 7:00 AM to 7:29 AM | 3 (4.9%) | 3 (9.4%) |
| 7:30 AM to 7:59 AM | 2 (3.3%) | 2 (6.2%) |
| 8:00 AM to 8:29 AM | 24 (39.3%) | 10 (31.2%) |
| 8:30 AM to 8:59 AM | 0 (0.0%) | 0 (0.0%) |
| 9:00 AM to 9:59 AM | 2 (3.3%) | 4 (12.5%) |
| 10:00 AM to 10:59 AM | 5 (8.2%) | 0 (0.0%) |
| 11:00 AM to 11:59 AM | 0 (0.0%) | 0 (0.0%) |
| 12:00 PM to 3:59 PM | 1 (1.6%) | 0 (0.0%) |
| 4:00 PM to 11:59 PM | 0 (0.0%) | 3 (9.4%) |
| Total | 61 (100.0%) | 32 (100.0%) |
Housing Occupancy in Sherwood
Occupancy by Ownership in Sherwood
Of the total 99 dwellings in Sherwood, owner-occupied units account for 87 (87.9%), while renter-occupied units make up 12 (12.1%).
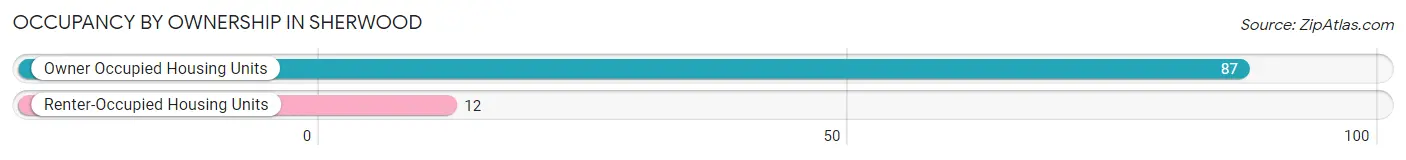
| Occupancy | # Housing Units | % Housing Units |
| Owner Occupied Housing Units | 87 | 87.9% |
| Renter-Occupied Housing Units | 12 | 12.1% |
| Total Occupied Housing Units | 99 | 100.0% |
Occupancy by Household Size in Sherwood
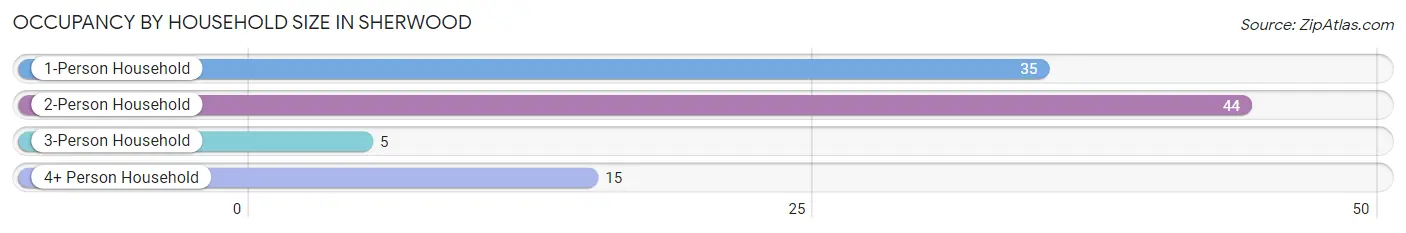
| Household Size | # Housing Units | % Housing Units |
| 1-Person Household | 35 | 35.3% |
| 2-Person Household | 44 | 44.4% |
| 3-Person Household | 5 | 5.1% |
| 4+ Person Household | 15 | 15.1% |
| Total Housing Units | 99 | 100.0% |
Occupancy by Ownership by Household Size in Sherwood
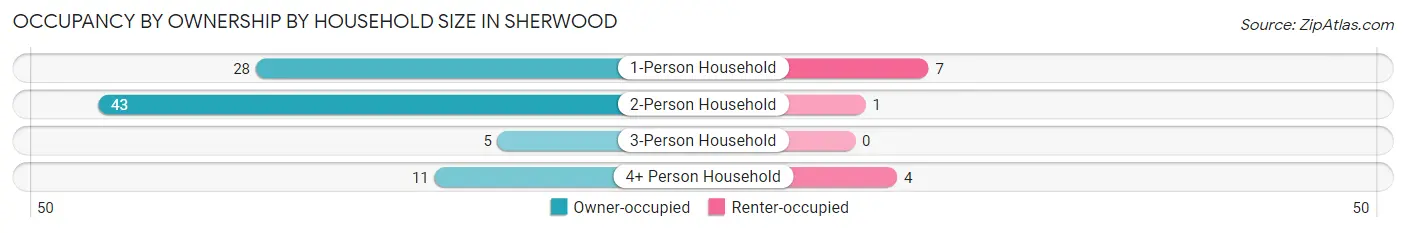
| Household Size | Owner-occupied | Renter-occupied |
| 1-Person Household | 28 (80.0%) | 7 (20.0%) |
| 2-Person Household | 43 (97.7%) | 1 (2.3%) |
| 3-Person Household | 5 (100.0%) | 0 (0.0%) |
| 4+ Person Household | 11 (73.3%) | 4 (26.7%) |
| Total Housing Units | 87 (87.9%) | 12 (12.1%) |
Occupancy by Educational Attainment in Sherwood
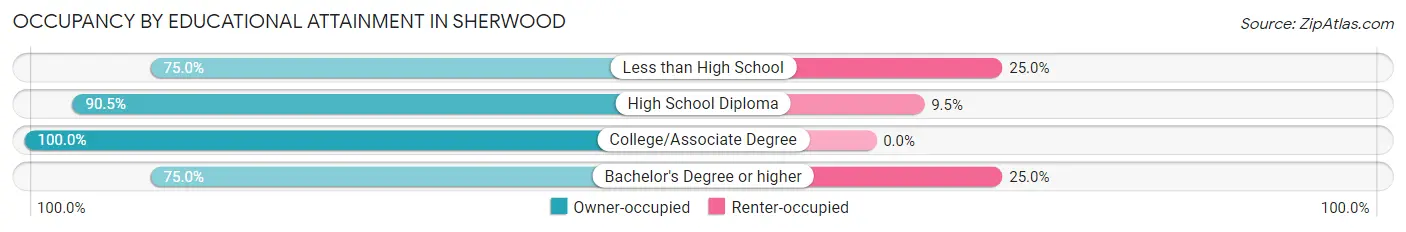
| Household Size | Owner-occupied | Renter-occupied |
| Less than High School | 3 (75.0%) | 1 (25.0%) |
| High School Diploma | 19 (90.5%) | 2 (9.5%) |
| College/Associate Degree | 38 (100.0%) | 0 (0.0%) |
| Bachelor's Degree or higher | 27 (75.0%) | 9 (25.0%) |
Occupancy by Age of Householder in Sherwood
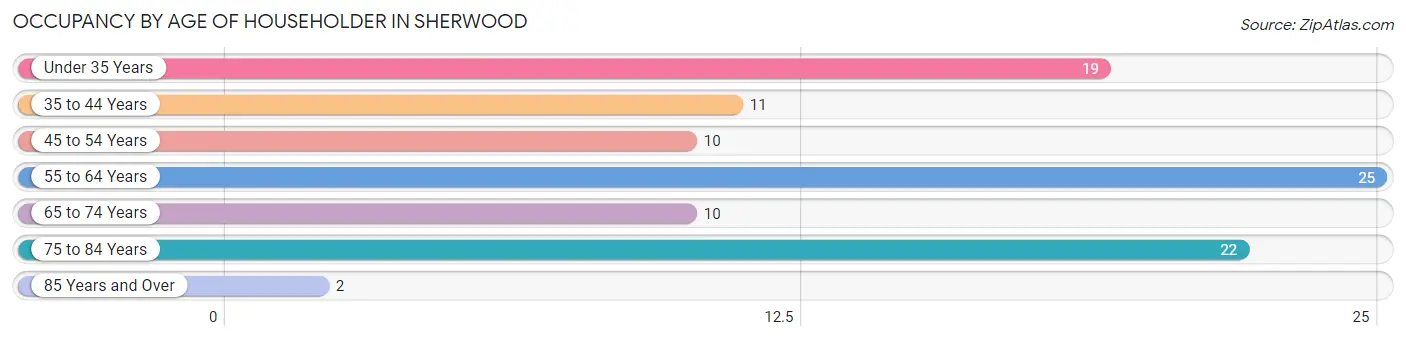
| Age Bracket | # Households | % Households |
| Under 35 Years | 19 | 19.2% |
| 35 to 44 Years | 11 | 11.1% |
| 45 to 54 Years | 10 | 10.1% |
| 55 to 64 Years | 25 | 25.3% |
| 65 to 74 Years | 10 | 10.1% |
| 75 to 84 Years | 22 | 22.2% |
| 85 Years and Over | 2 | 2.0% |
| Total | 99 | 100.0% |
Housing Finances in Sherwood
Median Income by Occupancy in Sherwood
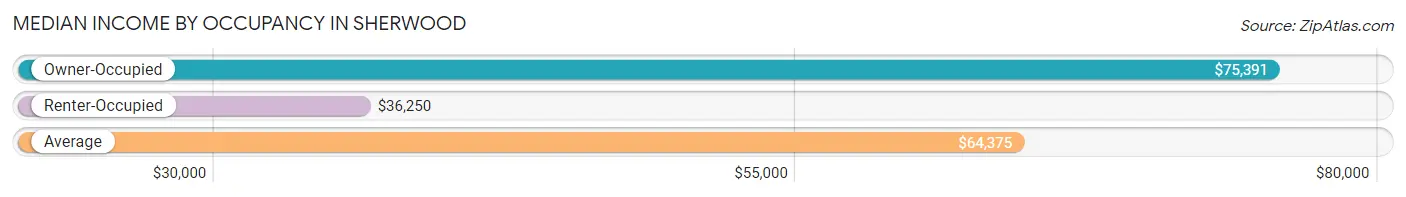
| Occupancy Type | # Households | Median Income |
| Owner-Occupied | 87 (87.9%) | $75,391 |
| Renter-Occupied | 12 (12.1%) | $36,250 |
| Average | 99 (100.0%) | $64,375 |
Occupancy by Householder Income Bracket in Sherwood
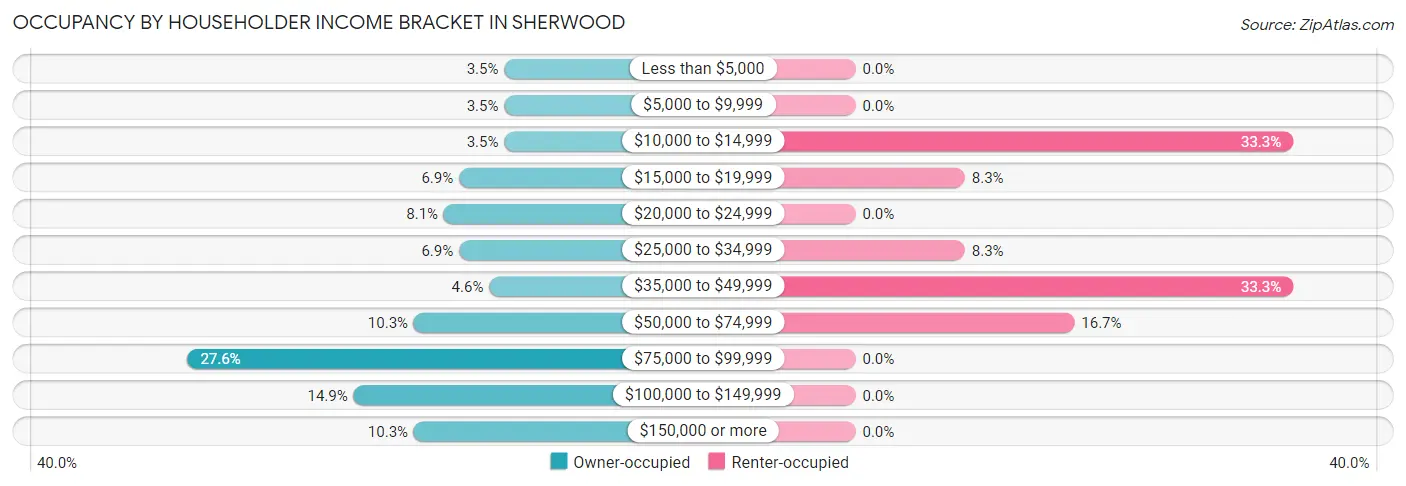
| Income Bracket | Owner-occupied | Renter-occupied |
| Less than $5,000 | 3 (3.5%) | 0 (0.0%) |
| $5,000 to $9,999 | 3 (3.5%) | 0 (0.0%) |
| $10,000 to $14,999 | 3 (3.5%) | 4 (33.3%) |
| $15,000 to $19,999 | 6 (6.9%) | 1 (8.3%) |
| $20,000 to $24,999 | 7 (8.1%) | 0 (0.0%) |
| $25,000 to $34,999 | 6 (6.9%) | 1 (8.3%) |
| $35,000 to $49,999 | 4 (4.6%) | 4 (33.3%) |
| $50,000 to $74,999 | 9 (10.3%) | 2 (16.7%) |
| $75,000 to $99,999 | 24 (27.6%) | 0 (0.0%) |
| $100,000 to $149,999 | 13 (14.9%) | 0 (0.0%) |
| $150,000 or more | 9 (10.3%) | 0 (0.0%) |
| Total | 87 (100.0%) | 12 (100.0%) |
Monthly Housing Cost Tiers in Sherwood
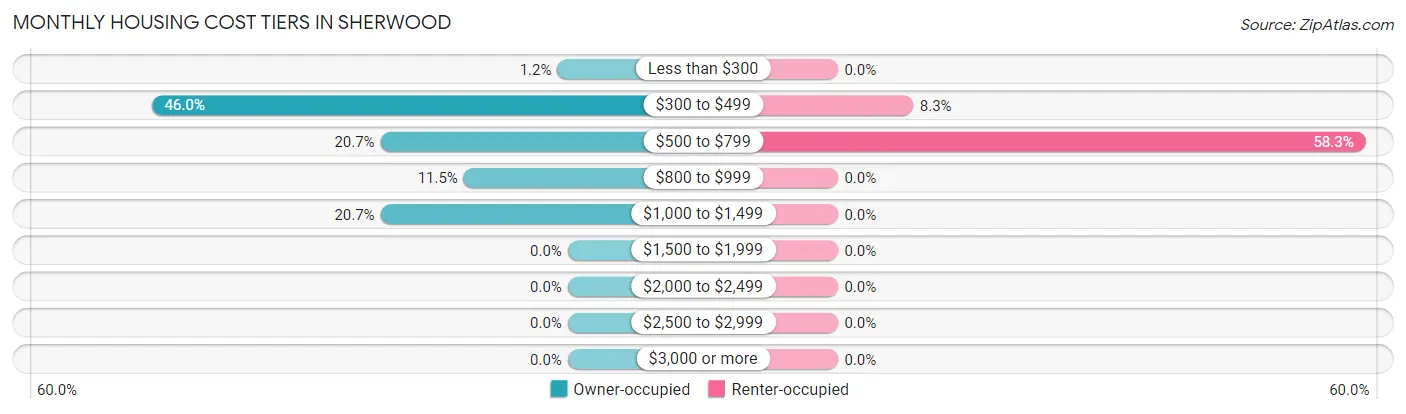
| Monthly Cost | Owner-occupied | Renter-occupied |
| Less than $300 | 1 (1.1%) | 0 (0.0%) |
| $300 to $499 | 40 (46.0%) | 1 (8.3%) |
| $500 to $799 | 18 (20.7%) | 7 (58.3%) |
| $800 to $999 | 10 (11.5%) | 0 (0.0%) |
| $1,000 to $1,499 | 18 (20.7%) | 0 (0.0%) |
| $1,500 to $1,999 | 0 (0.0%) | 0 (0.0%) |
| $2,000 to $2,499 | 0 (0.0%) | 0 (0.0%) |
| $2,500 to $2,999 | 0 (0.0%) | 0 (0.0%) |
| $3,000 or more | 0 (0.0%) | 0 (0.0%) |
| Total | 87 (100.0%) | 12 (100.0%) |
Physical Housing Characteristics in Sherwood
Housing Structures in Sherwood
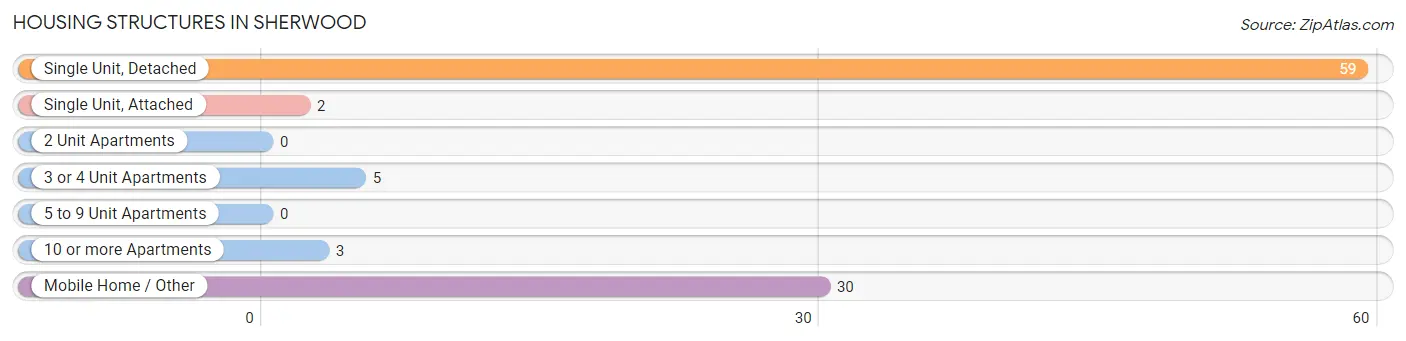
| Structure Type | # Housing Units | % Housing Units |
| Single Unit, Detached | 59 | 59.6% |
| Single Unit, Attached | 2 | 2.0% |
| 2 Unit Apartments | 0 | 0.0% |
| 3 or 4 Unit Apartments | 5 | 5.1% |
| 5 to 9 Unit Apartments | 0 | 0.0% |
| 10 or more Apartments | 3 | 3.0% |
| Mobile Home / Other | 30 | 30.3% |
| Total | 99 | 100.0% |
Housing Structures by Occupancy in Sherwood
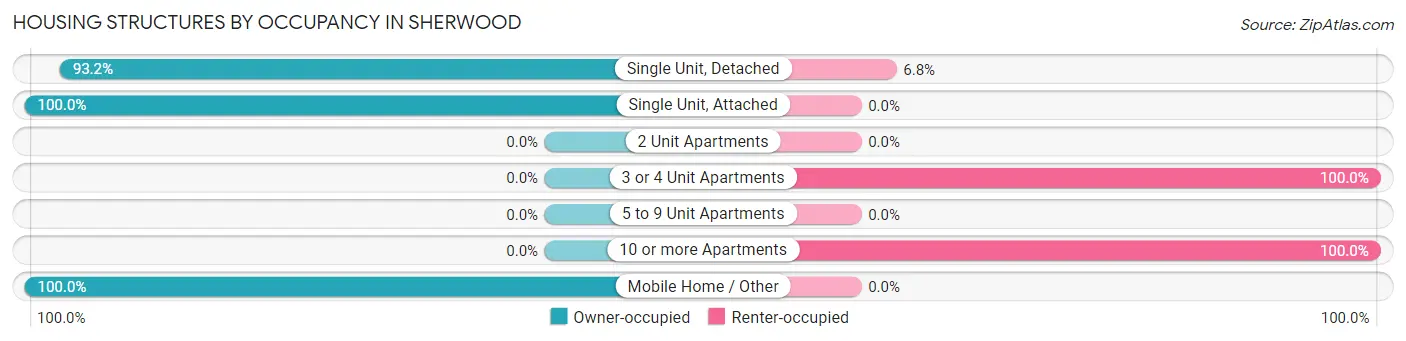
| Structure Type | Owner-occupied | Renter-occupied |
| Single Unit, Detached | 55 (93.2%) | 4 (6.8%) |
| Single Unit, Attached | 2 (100.0%) | 0 (0.0%) |
| 2 Unit Apartments | 0 (0.0%) | 0 (0.0%) |
| 3 or 4 Unit Apartments | 0 (0.0%) | 5 (100.0%) |
| 5 to 9 Unit Apartments | 0 (0.0%) | 0 (0.0%) |
| 10 or more Apartments | 0 (0.0%) | 3 (100.0%) |
| Mobile Home / Other | 30 (100.0%) | 0 (0.0%) |
| Total | 87 (87.9%) | 12 (12.1%) |
Housing Structures by Number of Rooms in Sherwood
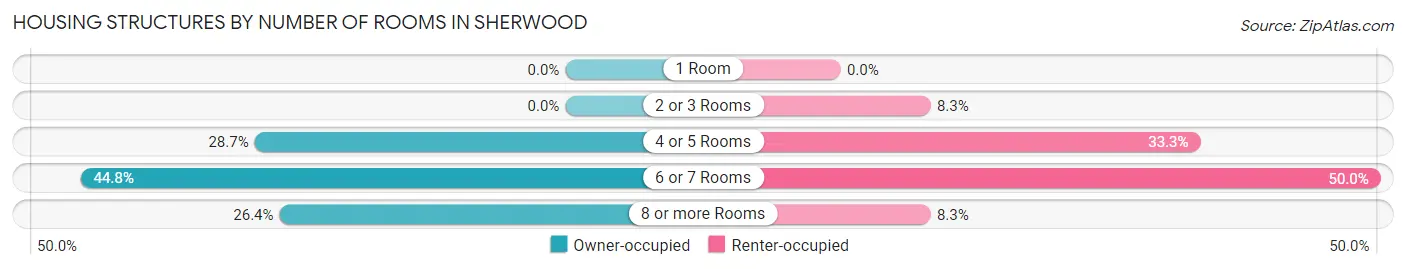
| Number of Rooms | Owner-occupied | Renter-occupied |
| 1 Room | 0 (0.0%) | 0 (0.0%) |
| 2 or 3 Rooms | 0 (0.0%) | 1 (8.3%) |
| 4 or 5 Rooms | 25 (28.7%) | 4 (33.3%) |
| 6 or 7 Rooms | 39 (44.8%) | 6 (50.0%) |
| 8 or more Rooms | 23 (26.4%) | 1 (8.3%) |
| Total | 87 (100.0%) | 12 (100.0%) |
Housing Structure by Heating Type in Sherwood
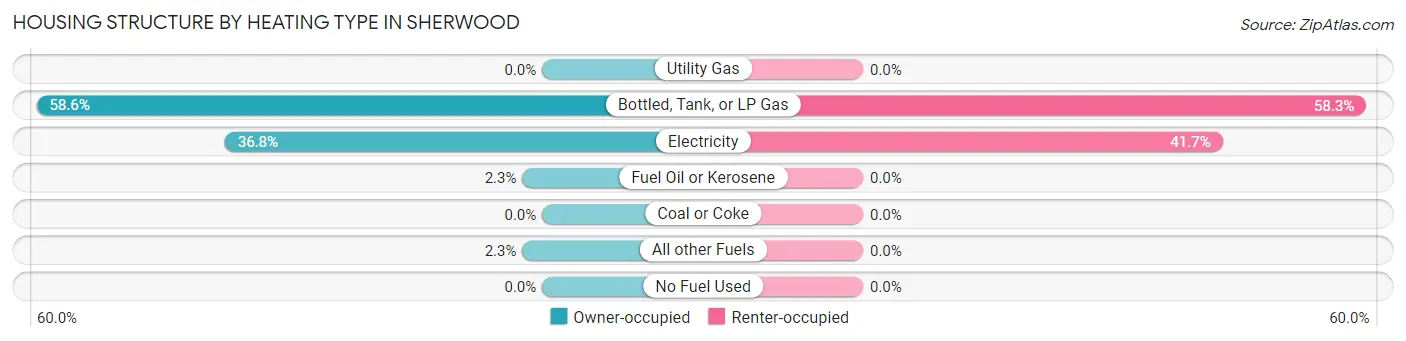
| Heating Type | Owner-occupied | Renter-occupied |
| Utility Gas | 0 (0.0%) | 0 (0.0%) |
| Bottled, Tank, or LP Gas | 51 (58.6%) | 7 (58.3%) |
| Electricity | 32 (36.8%) | 5 (41.7%) |
| Fuel Oil or Kerosene | 2 (2.3%) | 0 (0.0%) |
| Coal or Coke | 0 (0.0%) | 0 (0.0%) |
| All other Fuels | 2 (2.3%) | 0 (0.0%) |
| No Fuel Used | 0 (0.0%) | 0 (0.0%) |
| Total | 87 (100.0%) | 12 (100.0%) |
Household Vehicle Usage in Sherwood
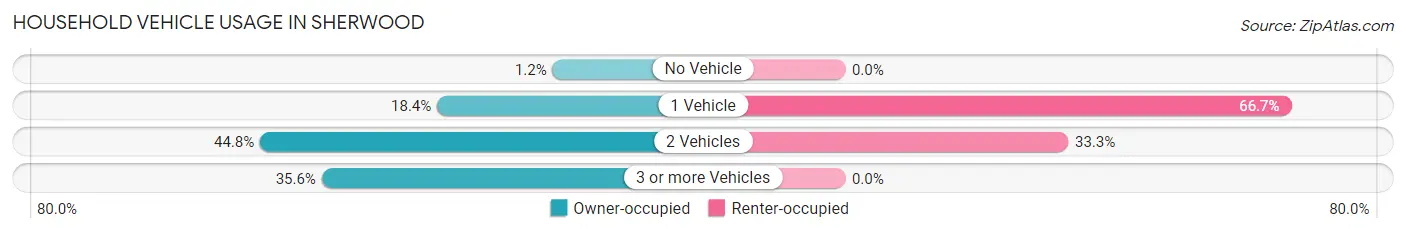
| Vehicles per Household | Owner-occupied | Renter-occupied |
| No Vehicle | 1 (1.1%) | 0 (0.0%) |
| 1 Vehicle | 16 (18.4%) | 8 (66.7%) |
| 2 Vehicles | 39 (44.8%) | 4 (33.3%) |
| 3 or more Vehicles | 31 (35.6%) | 0 (0.0%) |
| Total | 87 (100.0%) | 12 (100.0%) |
Real Estate & Mortgages in Sherwood
Real Estate and Mortgage Overview in Sherwood
| Characteristic | Without Mortgage | With Mortgage |
| Housing Units | 48 | 39 |
| Median Property Value | $32,100 | $112,500 |
| Median Household Income | $74,167 | $7 |
| Monthly Housing Costs | $400 | $0 |
| Real Estate Taxes | $391 | $2 |
Property Value by Mortgage Status in Sherwood
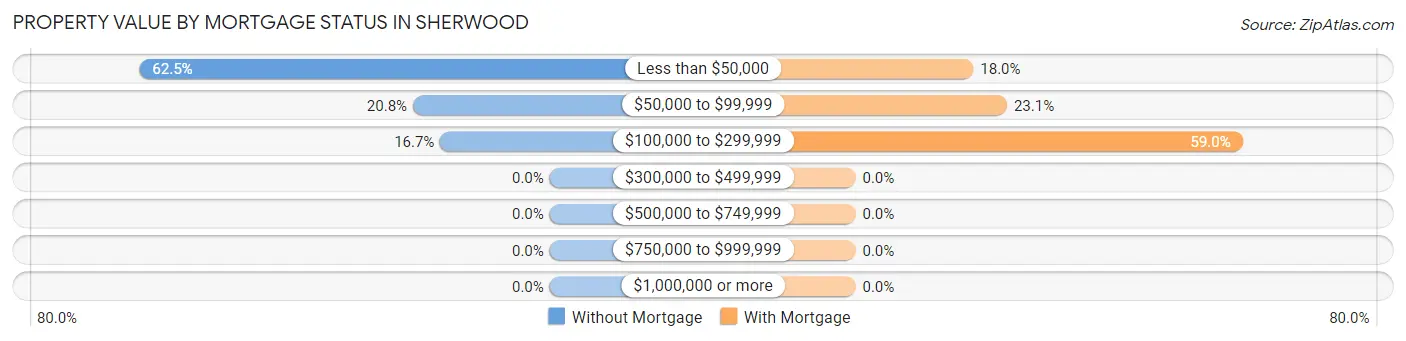
| Property Value | Without Mortgage | With Mortgage |
| Less than $50,000 | 30 (62.5%) | 7 (17.9%) |
| $50,000 to $99,999 | 10 (20.8%) | 9 (23.1%) |
| $100,000 to $299,999 | 8 (16.7%) | 23 (59.0%) |
| $300,000 to $499,999 | 0 (0.0%) | 0 (0.0%) |
| $500,000 to $749,999 | 0 (0.0%) | 0 (0.0%) |
| $750,000 to $999,999 | 0 (0.0%) | 0 (0.0%) |
| $1,000,000 or more | 0 (0.0%) | 0 (0.0%) |
| Total | 48 (100.0%) | 39 (100.0%) |
Household Income by Mortgage Status in Sherwood
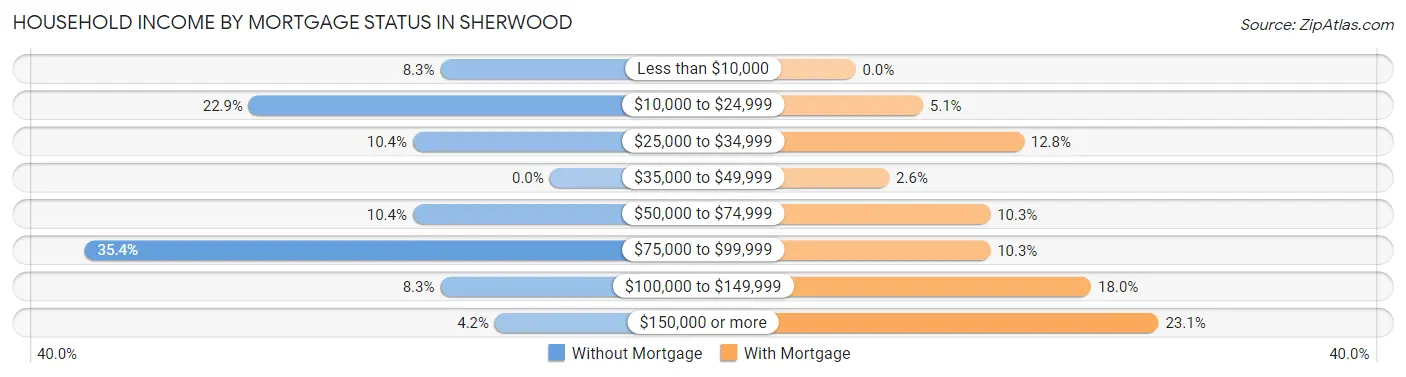
| Household Income | Without Mortgage | With Mortgage |
| Less than $10,000 | 4 (8.3%) | 0 (0.0%) |
| $10,000 to $24,999 | 11 (22.9%) | 2 (5.1%) |
| $25,000 to $34,999 | 5 (10.4%) | 5 (12.8%) |
| $35,000 to $49,999 | 0 (0.0%) | 1 (2.6%) |
| $50,000 to $74,999 | 5 (10.4%) | 4 (10.3%) |
| $75,000 to $99,999 | 17 (35.4%) | 4 (10.3%) |
| $100,000 to $149,999 | 4 (8.3%) | 7 (17.9%) |
| $150,000 or more | 2 (4.2%) | 9 (23.1%) |
| Total | 48 (100.0%) | 39 (100.0%) |
Property Value to Household Income Ratio in Sherwood
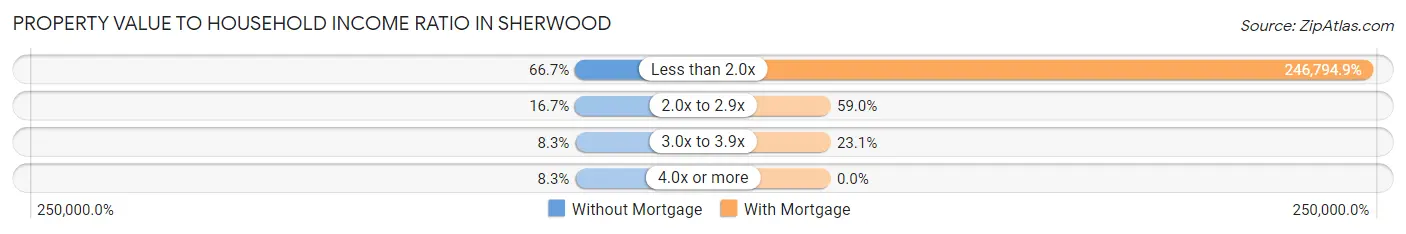
| Value-to-Income Ratio | Without Mortgage | With Mortgage |
| Less than 2.0x | 32 (66.7%) | 96,250 (246,794.9%) |
| 2.0x to 2.9x | 8 (16.7%) | 23 (59.0%) |
| 3.0x to 3.9x | 4 (8.3%) | 9 (23.1%) |
| 4.0x or more | 4 (8.3%) | 0 (0.0%) |
| Total | 48 (100.0%) | 39 (100.0%) |
Real Estate Taxes by Mortgage Status in Sherwood
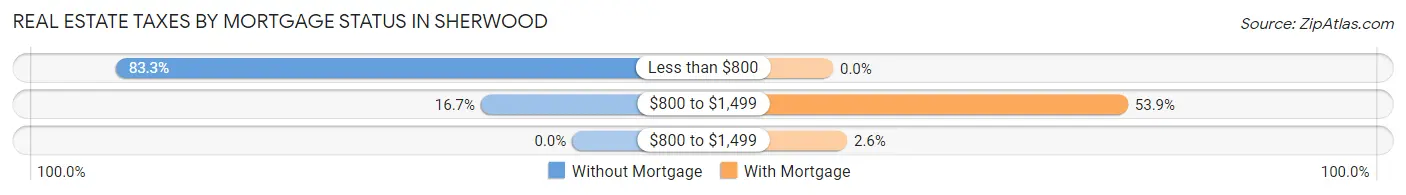
| Property Taxes | Without Mortgage | With Mortgage |
| Less than $800 | 40 (83.3%) | 0 (0.0%) |
| $800 to $1,499 | 8 (16.7%) | 21 (53.8%) |
| $800 to $1,499 | 0 (0.0%) | 1 (2.6%) |
| Total | 48 (100.0%) | 39 (100.0%) |
Health & Disability in Sherwood
Health Insurance Coverage by Age in Sherwood
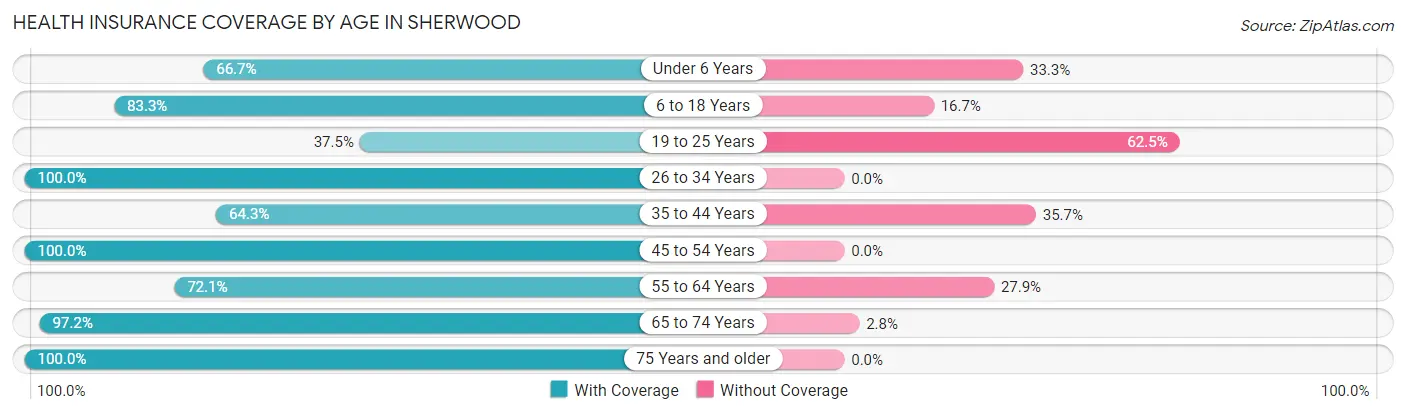
| Age Bracket | With Coverage | Without Coverage |
| Under 6 Years | 6 (66.7%) | 3 (33.3%) |
| 6 to 18 Years | 40 (83.3%) | 8 (16.7%) |
| 19 to 25 Years | 6 (37.5%) | 10 (62.5%) |
| 26 to 34 Years | 26 (100.0%) | 0 (0.0%) |
| 35 to 44 Years | 9 (64.3%) | 5 (35.7%) |
| 45 to 54 Years | 16 (100.0%) | 0 (0.0%) |
| 55 to 64 Years | 31 (72.1%) | 12 (27.9%) |
| 65 to 74 Years | 35 (97.2%) | 1 (2.8%) |
| 75 Years and older | 28 (100.0%) | 0 (0.0%) |
| Total | 197 (83.5%) | 39 (16.5%) |
Health Insurance Coverage by Citizenship Status in Sherwood
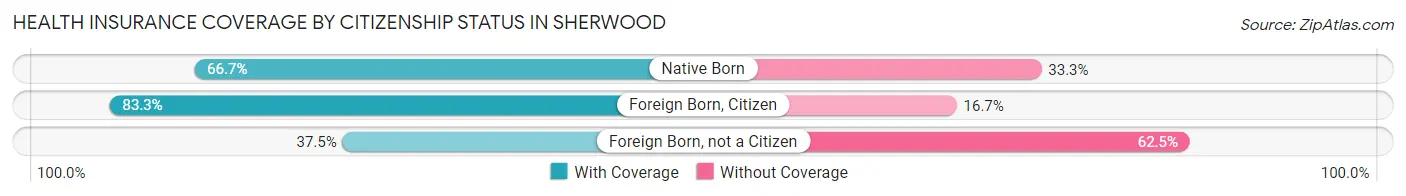
| Citizenship Status | With Coverage | Without Coverage |
| Native Born | 6 (66.7%) | 3 (33.3%) |
| Foreign Born, Citizen | 40 (83.3%) | 8 (16.7%) |
| Foreign Born, not a Citizen | 6 (37.5%) | 10 (62.5%) |
Health Insurance Coverage by Household Income in Sherwood
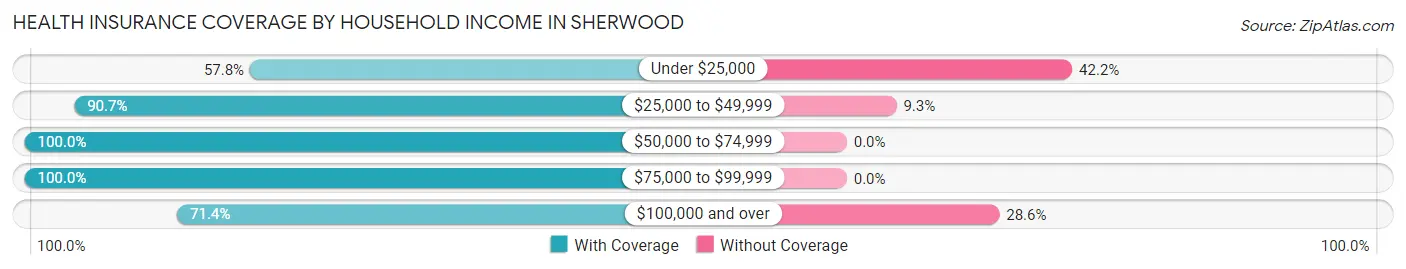
| Household Income | With Coverage | Without Coverage |
| Under $25,000 | 26 (57.8%) | 19 (42.2%) |
| $25,000 to $49,999 | 39 (90.7%) | 4 (9.3%) |
| $50,000 to $74,999 | 31 (100.0%) | 0 (0.0%) |
| $75,000 to $99,999 | 61 (100.0%) | 0 (0.0%) |
| $100,000 and over | 40 (71.4%) | 16 (28.6%) |
Public vs Private Health Insurance Coverage by Age in Sherwood
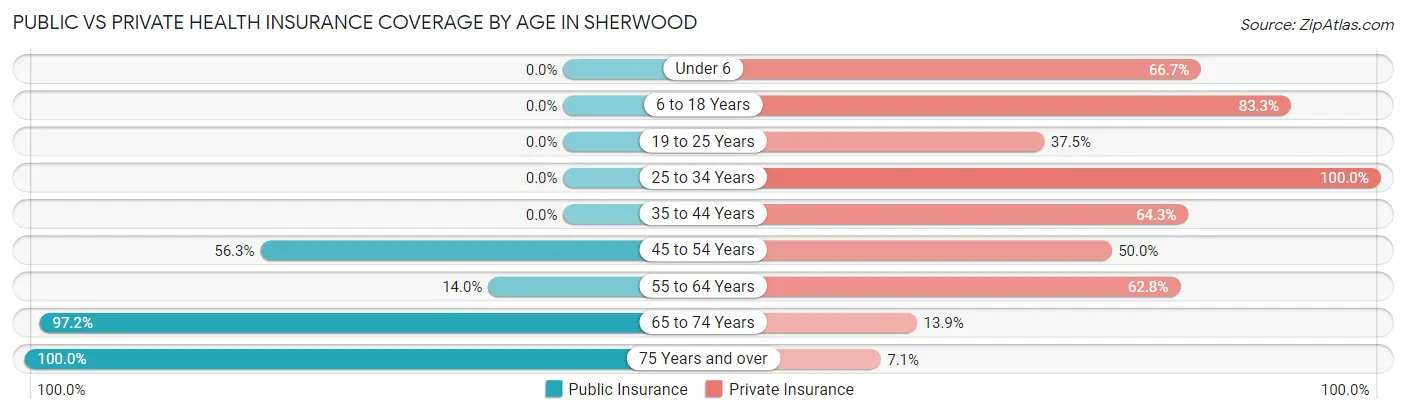
| Age Bracket | Public Insurance | Private Insurance |
| Under 6 | 0 (0.0%) | 6 (66.7%) |
| 6 to 18 Years | 0 (0.0%) | 40 (83.3%) |
| 19 to 25 Years | 0 (0.0%) | 6 (37.5%) |
| 25 to 34 Years | 0 (0.0%) | 26 (100.0%) |
| 35 to 44 Years | 0 (0.0%) | 9 (64.3%) |
| 45 to 54 Years | 9 (56.2%) | 8 (50.0%) |
| 55 to 64 Years | 6 (14.0%) | 27 (62.8%) |
| 65 to 74 Years | 35 (97.2%) | 5 (13.9%) |
| 75 Years and over | 28 (100.0%) | 2 (7.1%) |
| Total | 78 (33.1%) | 129 (54.7%) |
Disability Status by Sex by Age in Sherwood
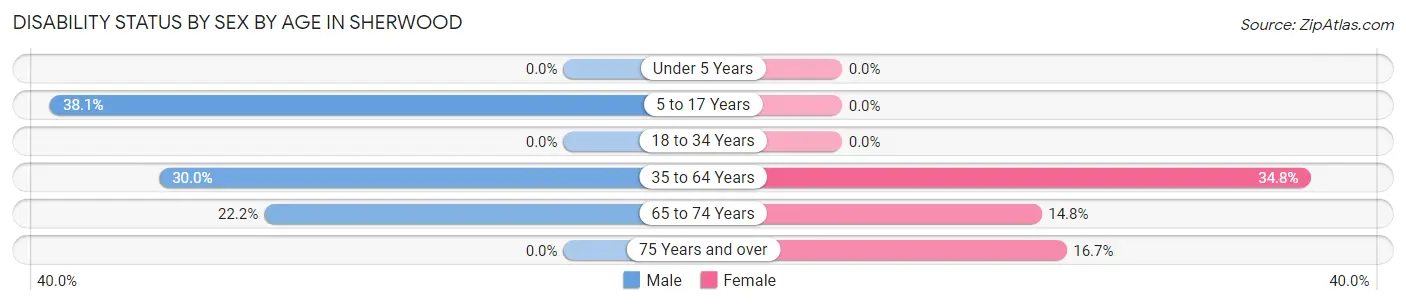
| Age Bracket | Male | Female |
| Under 5 Years | 0 (0.0%) | 0 (0.0%) |
| 5 to 17 Years | 8 (38.1%) | 0 (0.0%) |
| 18 to 34 Years | 0 (0.0%) | 0 (0.0%) |
| 35 to 64 Years | 15 (30.0%) | 8 (34.8%) |
| 65 to 74 Years | 2 (22.2%) | 4 (14.8%) |
| 75 Years and over | 0 (0.0%) | 1 (16.7%) |
Disability Class by Sex by Age in Sherwood
Disability Class: Hearing Difficulty
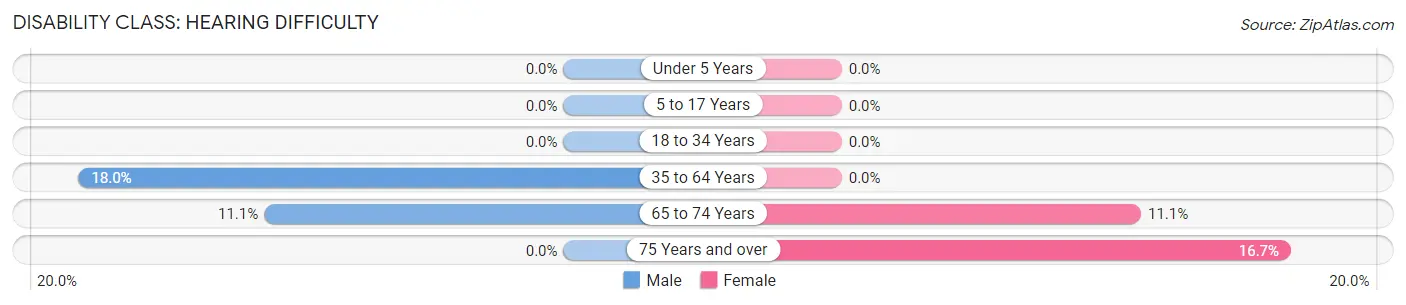
| Age Bracket | Male | Female |
| Under 5 Years | 0 (0.0%) | 0 (0.0%) |
| 5 to 17 Years | 0 (0.0%) | 0 (0.0%) |
| 18 to 34 Years | 0 (0.0%) | 0 (0.0%) |
| 35 to 64 Years | 9 (18.0%) | 0 (0.0%) |
| 65 to 74 Years | 1 (11.1%) | 3 (11.1%) |
| 75 Years and over | 0 (0.0%) | 1 (16.7%) |
Disability Class: Vision Difficulty
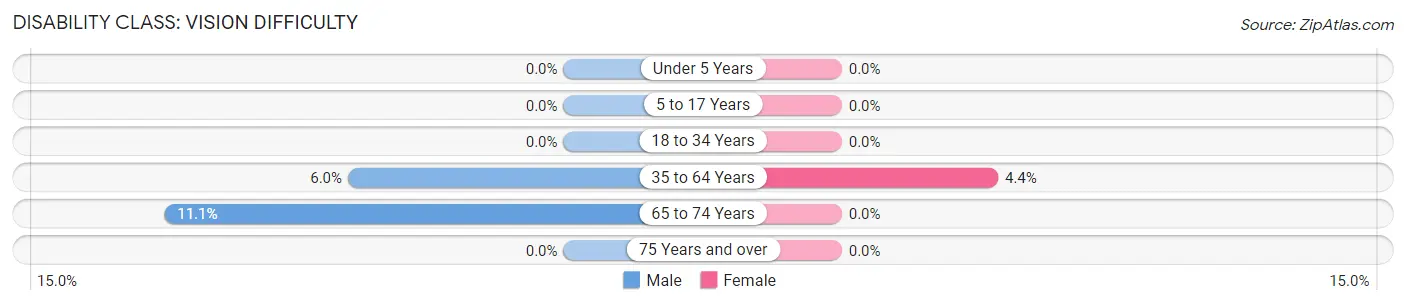
| Age Bracket | Male | Female |
| Under 5 Years | 0 (0.0%) | 0 (0.0%) |
| 5 to 17 Years | 0 (0.0%) | 0 (0.0%) |
| 18 to 34 Years | 0 (0.0%) | 0 (0.0%) |
| 35 to 64 Years | 3 (6.0%) | 1 (4.3%) |
| 65 to 74 Years | 1 (11.1%) | 0 (0.0%) |
| 75 Years and over | 0 (0.0%) | 0 (0.0%) |
Disability Class: Cognitive Difficulty
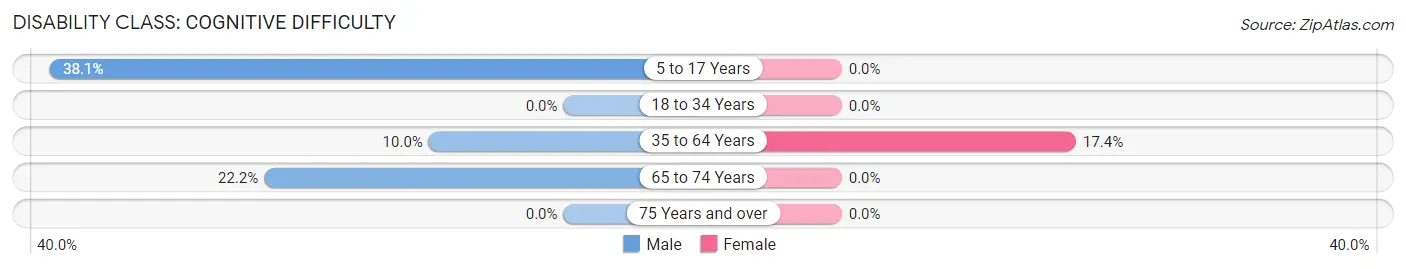
| Age Bracket | Male | Female |
| 5 to 17 Years | 8 (38.1%) | 0 (0.0%) |
| 18 to 34 Years | 0 (0.0%) | 0 (0.0%) |
| 35 to 64 Years | 5 (10.0%) | 4 (17.4%) |
| 65 to 74 Years | 2 (22.2%) | 0 (0.0%) |
| 75 Years and over | 0 (0.0%) | 0 (0.0%) |
Disability Class: Ambulatory Difficulty
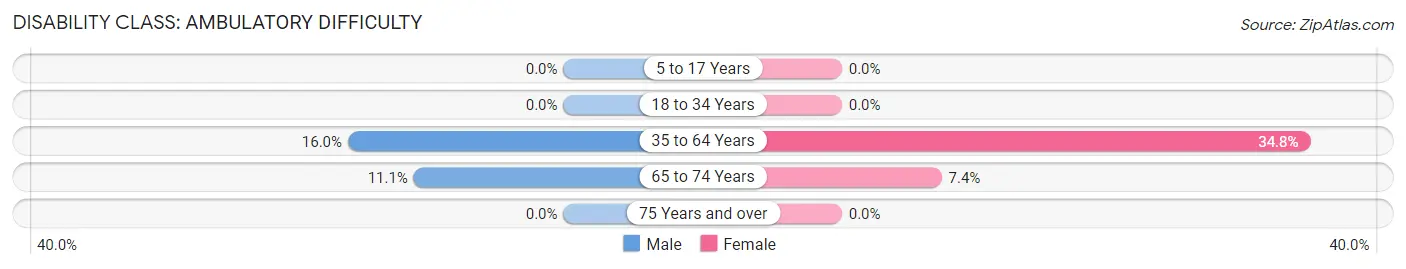
| Age Bracket | Male | Female |
| 5 to 17 Years | 0 (0.0%) | 0 (0.0%) |
| 18 to 34 Years | 0 (0.0%) | 0 (0.0%) |
| 35 to 64 Years | 8 (16.0%) | 8 (34.8%) |
| 65 to 74 Years | 1 (11.1%) | 2 (7.4%) |
| 75 Years and over | 0 (0.0%) | 0 (0.0%) |
Disability Class: Self-Care Difficulty
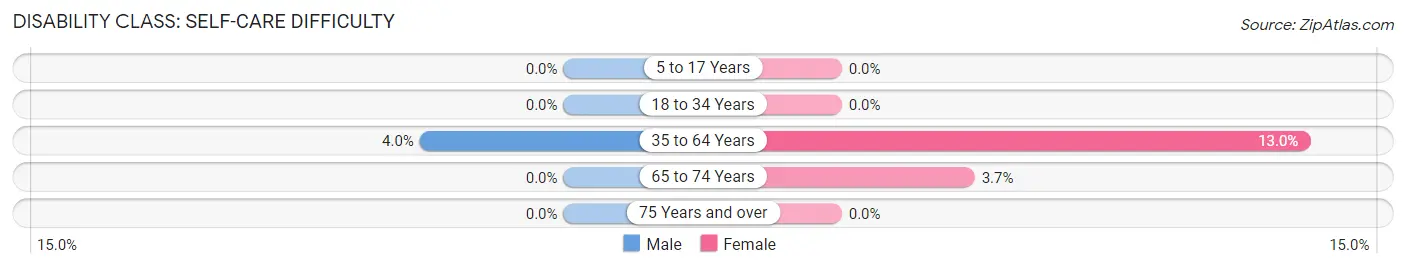
| Age Bracket | Male | Female |
| 5 to 17 Years | 0 (0.0%) | 0 (0.0%) |
| 18 to 34 Years | 0 (0.0%) | 0 (0.0%) |
| 35 to 64 Years | 2 (4.0%) | 3 (13.0%) |
| 65 to 74 Years | 0 (0.0%) | 1 (3.7%) |
| 75 Years and over | 0 (0.0%) | 0 (0.0%) |
Technology Access in Sherwood
Computing Device Access in Sherwood
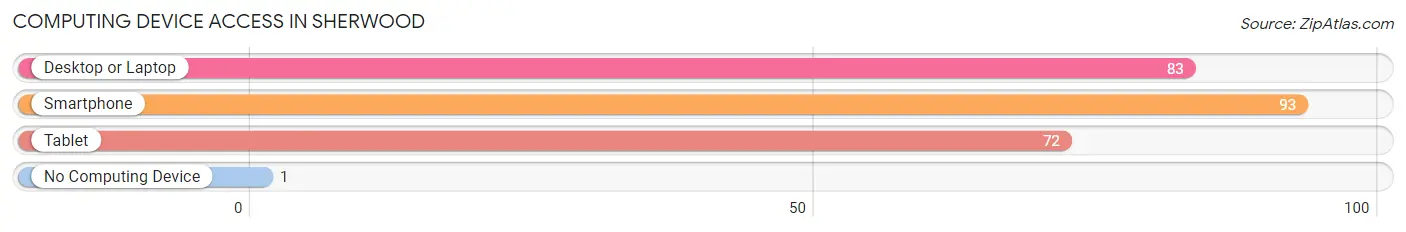
| Device Type | # Households | % Households |
| Desktop or Laptop | 83 | 83.8% |
| Smartphone | 93 | 93.9% |
| Tablet | 72 | 72.7% |
| No Computing Device | 1 | 1.0% |
| Total | 99 | 100.0% |
Internet Access in Sherwood
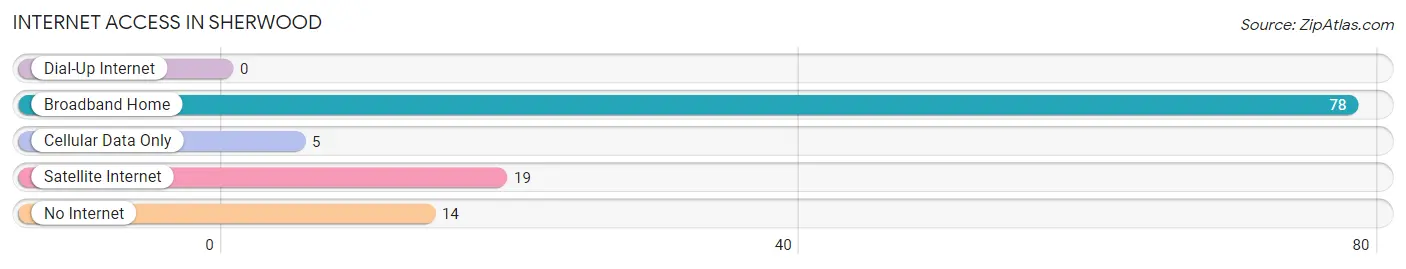
| Internet Type | # Households | % Households |
| Dial-Up Internet | 0 | 0.0% |
| Broadband Home | 78 | 78.8% |
| Cellular Data Only | 5 | 5.1% |
| Satellite Internet | 19 | 19.2% |
| No Internet | 14 | 14.1% |
| Total | 99 | 100.0% |
Sherwood Summary
Sherwood, North Dakota is a small town located in the southeastern corner of the state. It is situated in the heart of the Red River Valley, a region known for its rich agricultural heritage. The town was founded in 1883 and has a population of just over 500 people.
Geographically, Sherwood is located in the Red River Valley, which is a flat, fertile plain that stretches from the Canadian border to the Minnesota border. The valley is bordered by the Red River of the North to the east and the Pembina River to the west. The area is known for its rich soil and abundant rainfall, making it ideal for farming and ranching. The town is situated on the banks of the Red River, and the surrounding area is characterized by rolling hills and prairies.
The economy of Sherwood is largely based on agriculture. The town is home to several large farms and ranches, as well as a number of smaller family-owned operations. The area is also known for its production of sugar beets, which are used to make sugar. Other crops grown in the area include wheat, corn, soybeans, and sunflowers. In addition to farming, the town is home to a number of small businesses, including a grocery store, a hardware store, and a few restaurants.
The demographics of Sherwood are largely homogeneous. The majority of the population is of German descent, with a small percentage of other European and Native American ancestry. The town is predominantly white, with a small percentage of African American and Hispanic residents. The median household income in Sherwood is slightly below the state average, and the poverty rate is slightly higher than the state average.
Sherwood is a small town with a rich history and a strong sense of community. The town is home to a number of historic buildings, including the old Sherwood Schoolhouse, which was built in 1883. The town also hosts a number of annual events, such as the Sherwood Days Festival, which celebrates the town’s history and culture. The town is also home to a number of parks and recreational areas, including the Sherwood Park, which offers a variety of outdoor activities.
Sherwood is a small town with a big heart. The town is home to a tight-knit community of friendly people who are proud of their heritage and their town. The town is a great place to live, work, and raise a family, and it is a great place to visit.
Common Questions
What is Per Capita Income in Sherwood?
Per Capita income in Sherwood is $29,526.
What is the Median Family Income in Sherwood?
Median Family Income in Sherwood is $75,859.
What is the Median Household income in Sherwood?
Median Household Income in Sherwood is $64,375.
What is Inequality or Gini Index in Sherwood?
Inequality or Gini Index in Sherwood is 0.41.
What is the Total Population of Sherwood?
Total Population of Sherwood is 236.
What is the Total Male Population of Sherwood?
Total Male Population of Sherwood is 132.
What is the Total Female Population of Sherwood?
Total Female Population of Sherwood is 104.
What is the Ratio of Males per 100 Females in Sherwood?
There are 126.92 Males per 100 Females in Sherwood.
What is the Ratio of Females per 100 Males in Sherwood?
There are 78.79 Females per 100 Males in Sherwood.
What is the Median Population Age in Sherwood?
Median Population Age in Sherwood is 49.3 Years.
What is the Average Family Size in Sherwood
Average Family Size in Sherwood is 3.1 People.
What is the Average Household Size in Sherwood
Average Household Size in Sherwood is 2.4 People.
How Large is the Labor Force in Sherwood?
There are 96 People in the Labor Forcein in Sherwood.
What is the Percentage of People in the Labor Force in Sherwood?
49.2% of People are in the Labor Force in Sherwood.