Rolla, ND Map & Demographics
Rolla Map
Rolla Overview
$30,377
PER CAPITA INCOME
$63,938
AVG FAMILY INCOME
$58,036
AVG HOUSEHOLD INCOME
13.7%
WAGE / INCOME GAP [ % ]
86.3¢/ $1
WAGE / INCOME GAP [ $ ]
0.43
INEQUALITY / GINI INDEX
1,190
TOTAL POPULATION
583
MALE POPULATION
607
FEMALE POPULATION
96.05
MALES / 100 FEMALES
104.12
FEMALES / 100 MALES
33.8
MEDIAN AGE
4.2
AVG FAMILY SIZE
3.0
AVG HOUSEHOLD SIZE
493
LABOR FORCE [ PEOPLE ]
64.3%
PERCENT IN LABOR FORCE
9.3%
UNEMPLOYMENT RATE
Rolla Zip Codes
Rolla Area Codes
Income in Rolla
Income Overview in Rolla
Per Capita Income in Rolla is $30,377, while median incomes of families and households are $63,938 and $58,036 respectively.
| Characteristic | Number | Measure |
| Per Capita Income | 1,190 | $30,377 |
| Median Family Income | 227 | $63,938 |
| Mean Family Income | 227 | $85,336 |
| Median Household Income | 389 | $58,036 |
| Mean Household Income | 389 | $70,119 |
| Income Deficit | 227 | $0 |
| Wage / Income Gap (%) | 1,190 | 13.75% |
| Wage / Income Gap ($) | 1,190 | 86.25¢ per $1 |
| Gini / Inequality Index | 1,190 | 0.43 |
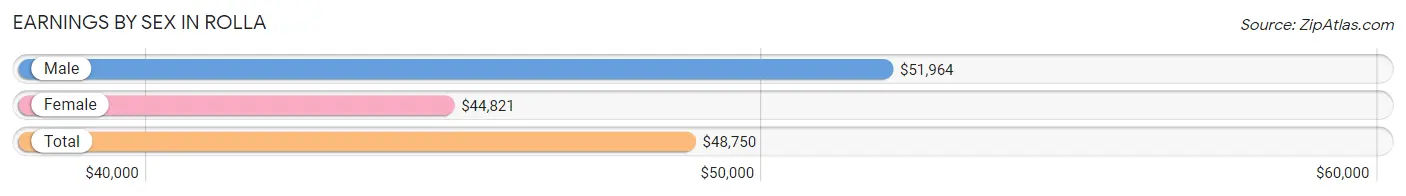
Earnings by Sex in Rolla
Average Earnings in Rolla are $48,750, $51,964 for men and $44,821 for women, a difference of 13.8%.
| Sex | Number | Average Earnings |
| Male | 284 (53.1%) | $51,964 |
| Female | 251 (46.9%) | $44,821 |
| Total | 535 (100.0%) | $48,750 |
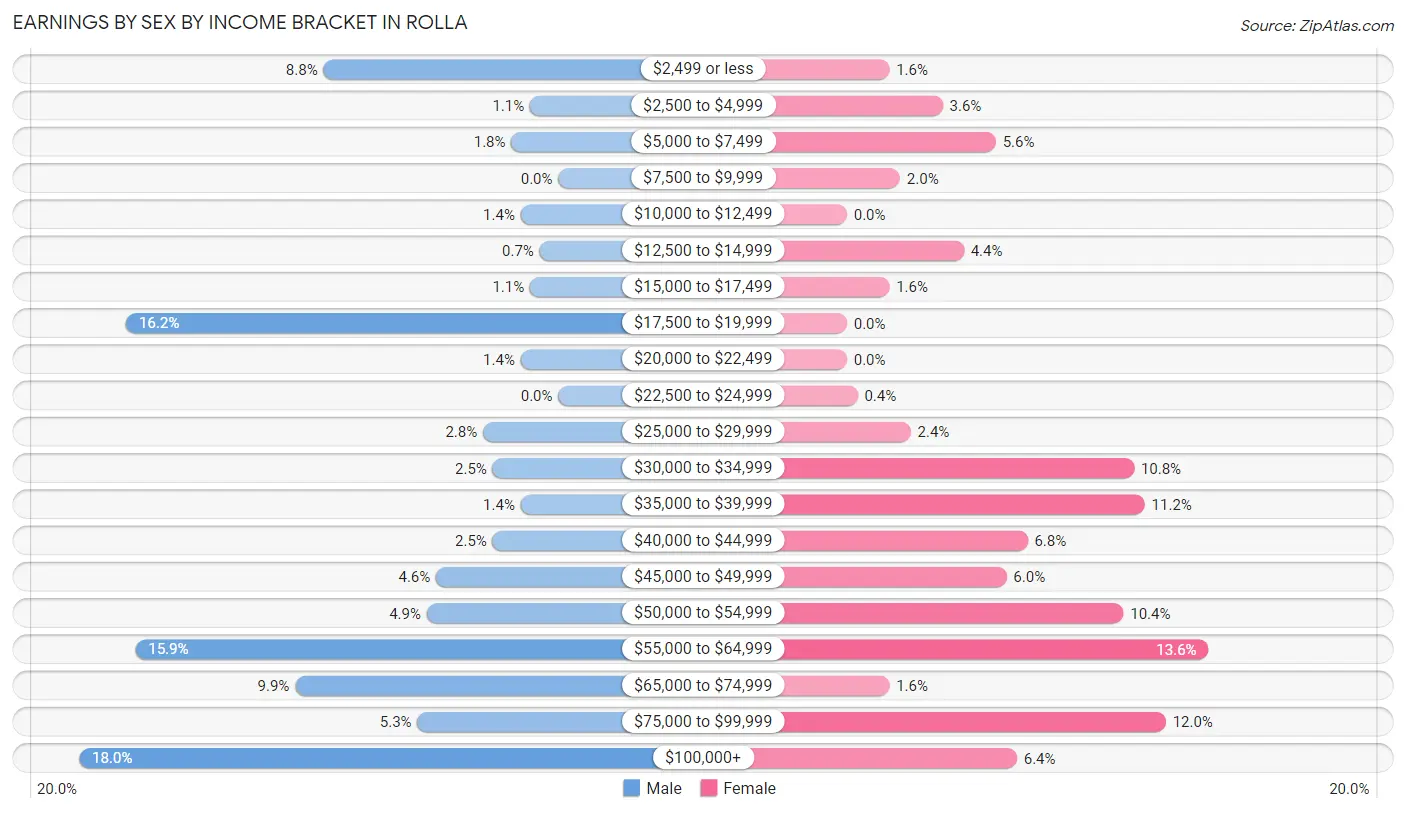
Earnings by Sex by Income Bracket in Rolla
The most common earnings brackets in Rolla are $100,000+ for men (51 | 18.0%) and $55,000 to $64,999 for women (34 | 13.6%).
| Income | Male | Female |
| $2,499 or less | 25 (8.8%) | 4 (1.6%) |
| $2,500 to $4,999 | 3 (1.1%) | 9 (3.6%) |
| $5,000 to $7,499 | 5 (1.8%) | 14 (5.6%) |
| $7,500 to $9,999 | 0 (0.0%) | 5 (2.0%) |
| $10,000 to $12,499 | 4 (1.4%) | 0 (0.0%) |
| $12,500 to $14,999 | 2 (0.7%) | 11 (4.4%) |
| $15,000 to $17,499 | 3 (1.1%) | 4 (1.6%) |
| $17,500 to $19,999 | 46 (16.2%) | 0 (0.0%) |
| $20,000 to $22,499 | 4 (1.4%) | 0 (0.0%) |
| $22,500 to $24,999 | 0 (0.0%) | 1 (0.4%) |
| $25,000 to $29,999 | 8 (2.8%) | 6 (2.4%) |
| $30,000 to $34,999 | 7 (2.5%) | 27 (10.8%) |
| $35,000 to $39,999 | 4 (1.4%) | 28 (11.2%) |
| $40,000 to $44,999 | 7 (2.5%) | 17 (6.8%) |
| $45,000 to $49,999 | 13 (4.6%) | 15 (6.0%) |
| $50,000 to $54,999 | 14 (4.9%) | 26 (10.4%) |
| $55,000 to $64,999 | 45 (15.9%) | 34 (13.6%) |
| $65,000 to $74,999 | 28 (9.9%) | 4 (1.6%) |
| $75,000 to $99,999 | 15 (5.3%) | 30 (11.9%) |
| $100,000+ | 51 (18.0%) | 16 (6.4%) |
| Total | 284 (100.0%) | 251 (100.0%) |
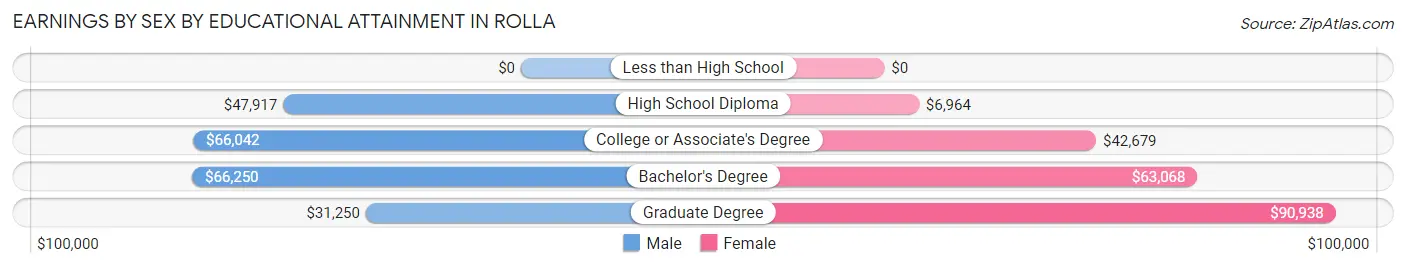
Earnings by Sex by Educational Attainment in Rolla
Average earnings in Rolla are $58,000 for men and $46,417 for women, a difference of 20.0%. Men with an educational attainment of bachelor's degree enjoy the highest average annual earnings of $66,250, while those with graduate degree education earn the least with $31,250. Women with an educational attainment of graduate degree earn the most with the average annual earnings of $90,938, while those with high school diploma education have the smallest earnings of $6,964.
| Educational Attainment | Male Income | Female Income |
| Less than High School | - | - |
| High School Diploma | $47,917 | $6,964 |
| College or Associate's Degree | $66,042 | $42,679 |
| Bachelor's Degree | $66,250 | $63,068 |
| Graduate Degree | $31,250 | $90,938 |
| Total | $58,000 | $46,417 |
Family Income in Rolla
Family Income Brackets in Rolla
According to the Rolla family income data, there are 53 families falling into the $50,000 to $74,999 income range, which is the most common income bracket and makes up 23.4% of all families.
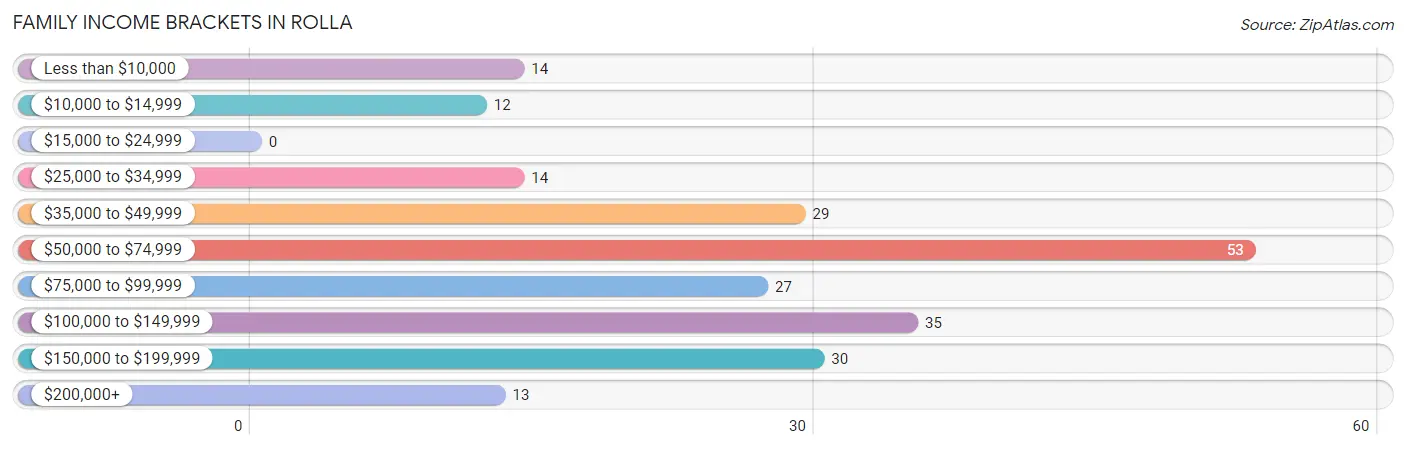
| Income Bracket | # Families | % Families |
| Less than $10,000 | 14 | 6.2% |
| $10,000 to $14,999 | 12 | 5.3% |
| $15,000 to $24,999 | 0 | 0.0% |
| $25,000 to $34,999 | 14 | 6.2% |
| $35,000 to $49,999 | 29 | 12.8% |
| $50,000 to $74,999 | 53 | 23.3% |
| $75,000 to $99,999 | 27 | 11.9% |
| $100,000 to $149,999 | 35 | 15.4% |
| $150,000 to $199,999 | 30 | 13.2% |
| $200,000+ | 13 | 5.7% |
Family Income by Famaliy Size in Rolla
2-person families (82 | 36.1%) account for the highest median family income in Rolla with $100,714 per family, while 2-person families (82 | 36.1%) have the highest median income of $50,357 per family member.
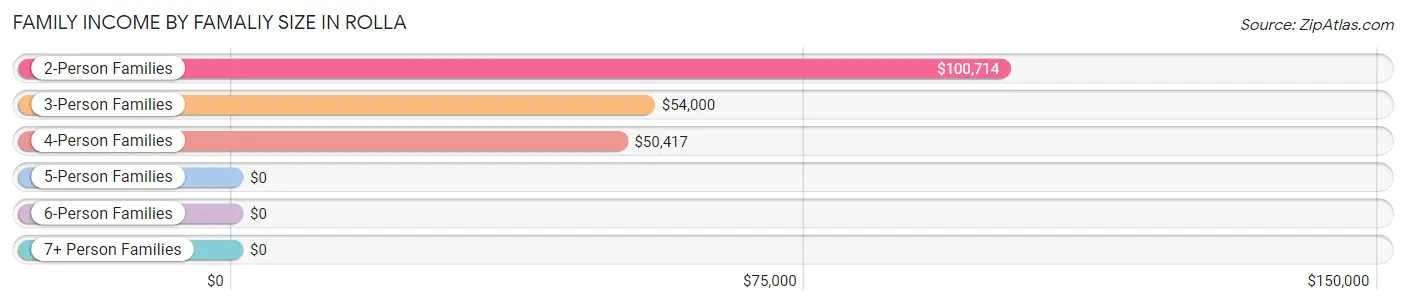
| Income Bracket | # Families | Median Income |
| 2-Person Families | 82 (36.1%) | $100,714 |
| 3-Person Families | 62 (27.3%) | $54,000 |
| 4-Person Families | 35 (15.4%) | $50,417 |
| 5-Person Families | 34 (15.0%) | $0 |
| 6-Person Families | 9 (4.0%) | $0 |
| 7+ Person Families | 5 (2.2%) | $0 |
| Total | 227 (100.0%) | $63,938 |
Family Income by Number of Earners in Rolla
The median family income in Rolla is $63,938, with families comprising 3+ earners (12) having the highest median family income of $140,417, while families with no earners (41) have the lowest median family income of $44,688, accounting for 5.3% and 18.1% of families, respectively.
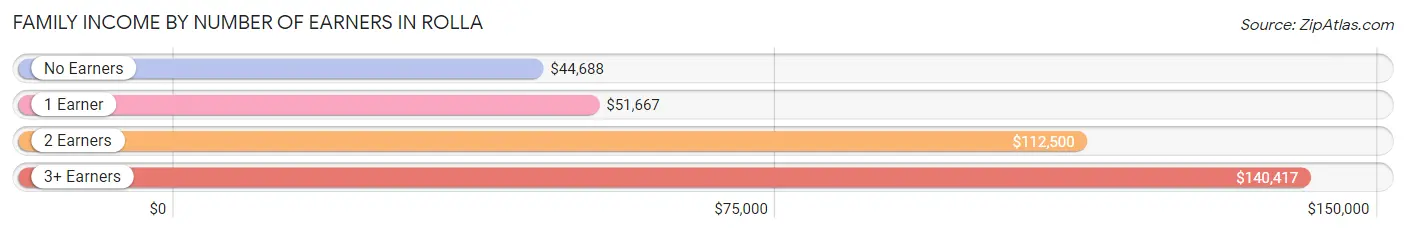
| Number of Earners | # Families | Median Income |
| No Earners | 41 (18.1%) | $44,688 |
| 1 Earner | 90 (39.7%) | $51,667 |
| 2 Earners | 84 (37.0%) | $112,500 |
| 3+ Earners | 12 (5.3%) | $140,417 |
| Total | 227 (100.0%) | $63,938 |
Household Income in Rolla
Household Income Brackets in Rolla
With 78 households falling in the category, the $50,000 to $74,999 income range is the most frequent in Rolla, accounting for 20.1% of all households. In contrast, only 13 households (3.3%) fall into the $200,000+ income bracket, making it the least populous group.
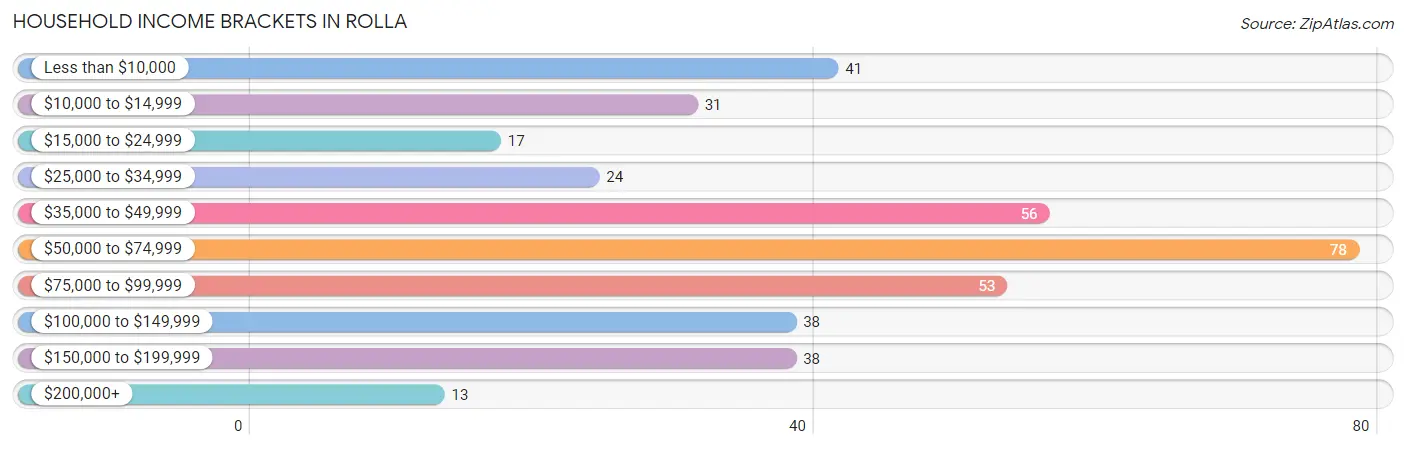
| Income Bracket | # Households | % Households |
| Less than $10,000 | 41 | 10.5% |
| $10,000 to $14,999 | 31 | 8.0% |
| $15,000 to $24,999 | 17 | 4.4% |
| $25,000 to $34,999 | 24 | 6.2% |
| $35,000 to $49,999 | 56 | 14.4% |
| $50,000 to $74,999 | 78 | 20.1% |
| $75,000 to $99,999 | 53 | 13.6% |
| $100,000 to $149,999 | 38 | 9.8% |
| $150,000 to $199,999 | 38 | 9.8% |
| $200,000+ | 13 | 3.3% |
Household Income by Householder Age in Rolla
The median household income in Rolla is $58,036, with the highest median household income of $71,250 found in the 45 to 64 years age bracket for the primary householder. A total of 98 households (25.2%) fall into this category. Meanwhile, the 15 to 24 years age bracket for the primary householder has the lowest median household income of $0, with 9 households (2.3%) in this group.
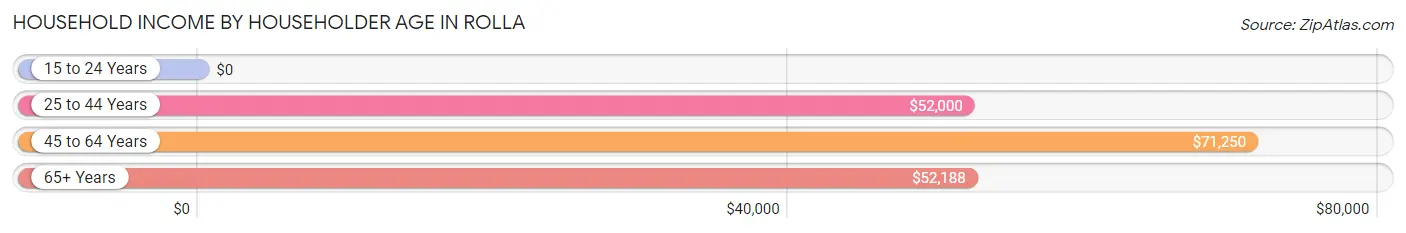
| Income Bracket | # Households | Median Income |
| 15 to 24 Years | 9 (2.3%) | $0 |
| 25 to 44 Years | 152 (39.1%) | $52,000 |
| 45 to 64 Years | 98 (25.2%) | $71,250 |
| 65+ Years | 130 (33.4%) | $52,188 |
| Total | 389 (100.0%) | $58,036 |
Poverty in Rolla
Income Below Poverty by Sex and Age in Rolla
With 14.6% poverty level for males and 19.8% for females among the residents of Rolla, under 5 year old males and 16 and 17 year old females are the most vulnerable to poverty, with 26 males (47.3%) and 11 females (100.0%) in their respective age groups living below the poverty level.
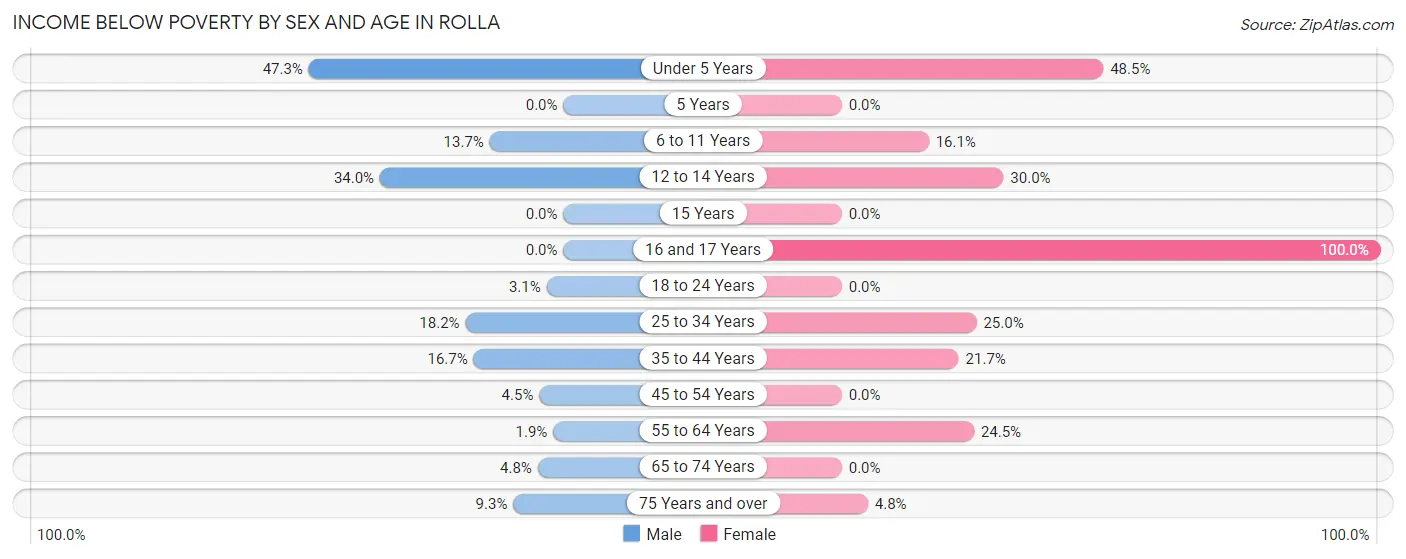
| Age Bracket | Male | Female |
| Under 5 Years | 26 (47.3%) | 33 (48.5%) |
| 5 Years | 0 (0.0%) | 0 (0.0%) |
| 6 to 11 Years | 13 (13.7%) | 20 (16.1%) |
| 12 to 14 Years | 16 (34.0%) | 3 (30.0%) |
| 15 Years | 0 (0.0%) | 0 (0.0%) |
| 16 and 17 Years | 0 (0.0%) | 11 (100.0%) |
| 18 to 24 Years | 1 (3.1%) | 0 (0.0%) |
| 25 to 34 Years | 10 (18.2%) | 15 (25.0%) |
| 35 to 44 Years | 6 (16.7%) | 18 (21.7%) |
| 45 to 54 Years | 3 (4.5%) | 0 (0.0%) |
| 55 to 64 Years | 1 (1.9%) | 13 (24.5%) |
| 65 to 74 Years | 3 (4.8%) | 0 (0.0%) |
| 75 Years and over | 4 (9.3%) | 3 (4.8%) |
| Total | 83 (14.6%) | 116 (19.8%) |
Income Above Poverty by Sex and Age in Rolla
According to the poverty statistics in Rolla, males aged 5 years and females aged 5 years are the age groups that are most secure financially, with 100.0% of males and 100.0% of females in these age groups living above the poverty line.
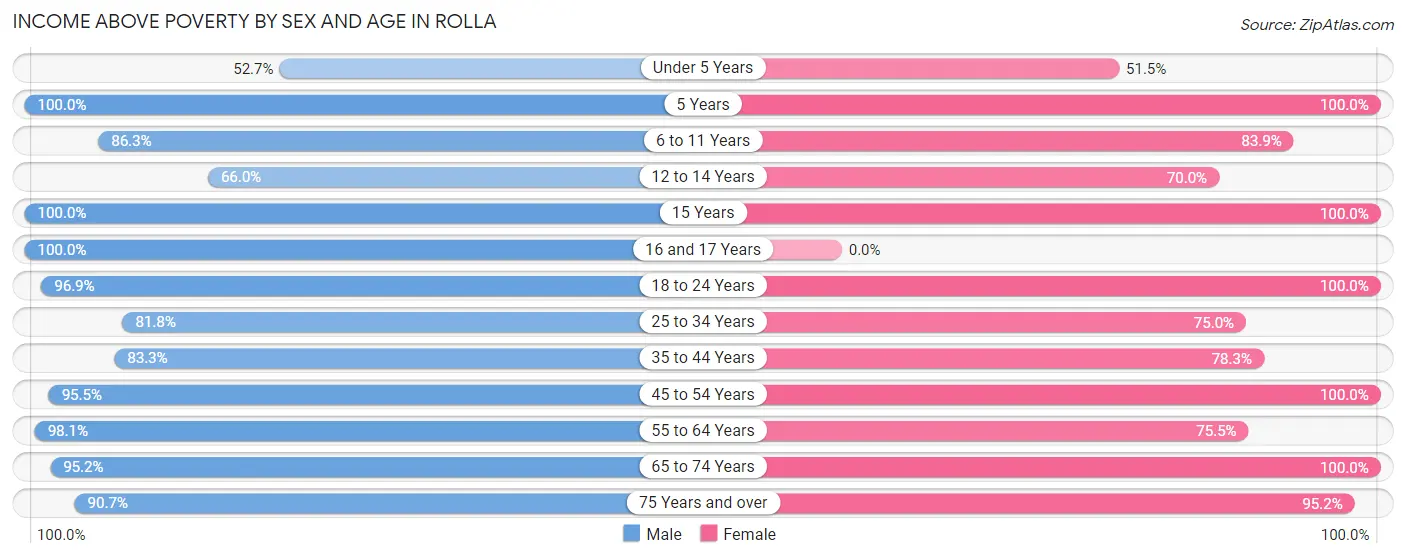
| Age Bracket | Male | Female |
| Under 5 Years | 29 (52.7%) | 35 (51.5%) |
| 5 Years | 5 (100.0%) | 5 (100.0%) |
| 6 to 11 Years | 82 (86.3%) | 104 (83.9%) |
| 12 to 14 Years | 31 (66.0%) | 7 (70.0%) |
| 15 Years | 5 (100.0%) | 9 (100.0%) |
| 16 and 17 Years | 11 (100.0%) | 0 (0.0%) |
| 18 to 24 Years | 31 (96.9%) | 18 (100.0%) |
| 25 to 34 Years | 45 (81.8%) | 45 (75.0%) |
| 35 to 44 Years | 30 (83.3%) | 65 (78.3%) |
| 45 to 54 Years | 64 (95.5%) | 33 (100.0%) |
| 55 to 64 Years | 52 (98.1%) | 40 (75.5%) |
| 65 to 74 Years | 60 (95.2%) | 50 (100.0%) |
| 75 Years and over | 39 (90.7%) | 59 (95.2%) |
| Total | 484 (85.4%) | 470 (80.2%) |
Income Below Poverty Among Married-Couple Families in Rolla
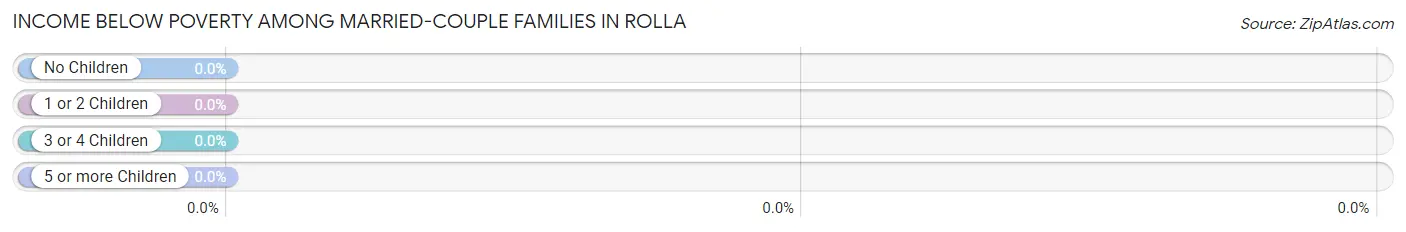
| Children | Above Poverty | Below Poverty |
| No Children | 60 (100.0%) | 0 (0.0%) |
| 1 or 2 Children | 34 (100.0%) | 0 (0.0%) |
| 3 or 4 Children | 18 (100.0%) | 0 (0.0%) |
| 5 or more Children | 0 (0.0%) | 0 (0.0%) |
| Total | 112 (100.0%) | 0 (0.0%) |
Income Below Poverty Among Single-Parent Households in Rolla
According to the poverty data in Rolla, 11.5% or 3 single-father households and 25.8% or 23 single-mother households are living below the poverty line. Among single-father households, those with 1 or 2 children have the highest poverty rate, with 3 households (30.0%) experiencing poverty. Likewise, among single-mother households, those with 3 or 4 children have the highest poverty rate, with 14 households (50.0%) falling below the poverty line.
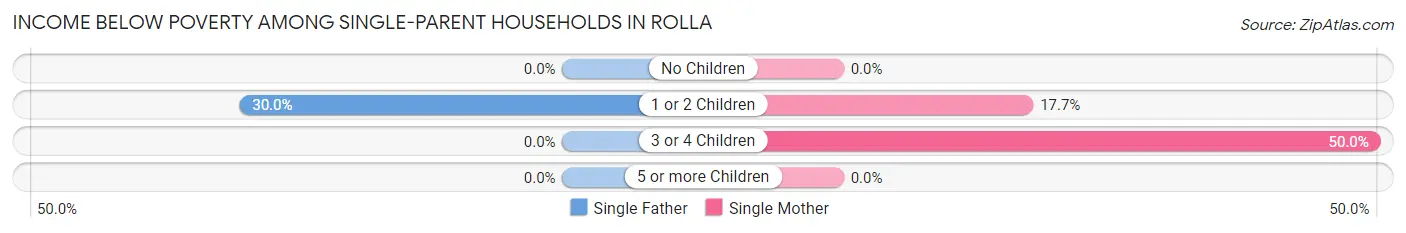
| Children | Single Father | Single Mother |
| No Children | 0 (0.0%) | 0 (0.0%) |
| 1 or 2 Children | 3 (30.0%) | 9 (17.6%) |
| 3 or 4 Children | 0 (0.0%) | 14 (50.0%) |
| 5 or more Children | 0 (0.0%) | 0 (0.0%) |
| Total | 3 (11.5%) | 23 (25.8%) |
Income Below Poverty Among Married-Couple vs Single-Parent Households in Rolla
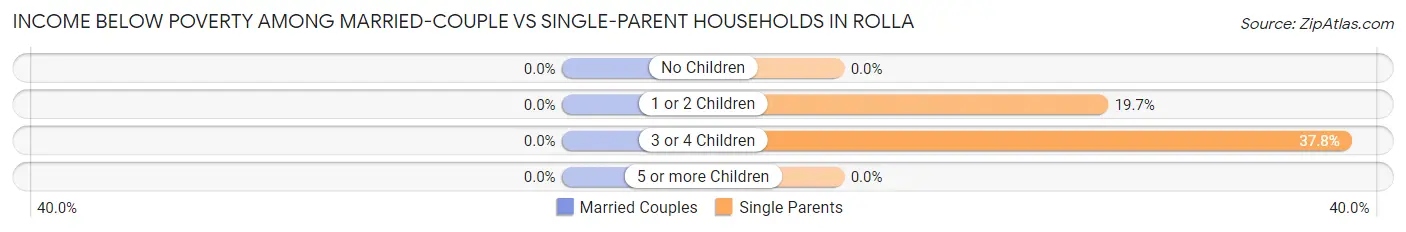
| Children | Married-Couple Families | Single-Parent Households |
| No Children | 0 (0.0%) | 0 (0.0%) |
| 1 or 2 Children | 0 (0.0%) | 12 (19.7%) |
| 3 or 4 Children | 0 (0.0%) | 14 (37.8%) |
| 5 or more Children | 0 (0.0%) | 0 (0.0%) |
| Total | 0 (0.0%) | 26 (22.6%) |
Race in Rolla
The most populous races in Rolla are Native / Alaskan (540 | 45.4%), White / Caucasian (519 | 43.6%), and Two or more Races (81 | 6.8%).
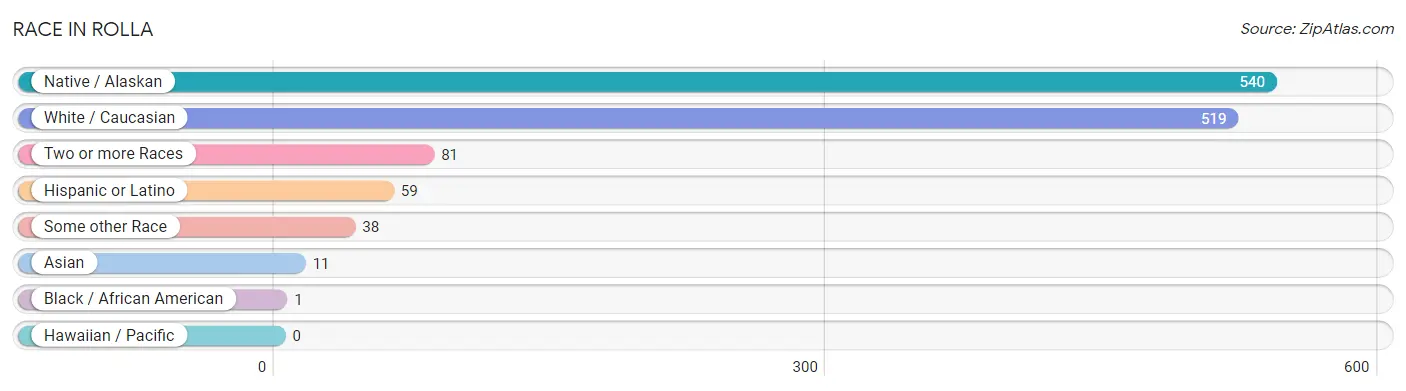
| Race | # Population | % Population |
| Asian | 11 | 0.9% |
| Black / African American | 1 | 0.1% |
| Hawaiian / Pacific | 0 | 0.0% |
| Hispanic or Latino | 59 | 5.0% |
| Native / Alaskan | 540 | 45.4% |
| White / Caucasian | 519 | 43.6% |
| Two or more Races | 81 | 6.8% |
| Some other Race | 38 | 3.2% |
| Total | 1,190 | 100.0% |
Ancestry in Rolla
The most populous ancestries reported in Rolla are Chippewa (569 | 47.8%), German (304 | 25.6%), Norwegian (153 | 12.9%), Finnish (144 | 12.1%), and French (75 | 6.3%), together accounting for 104.6% of all Rolla residents.
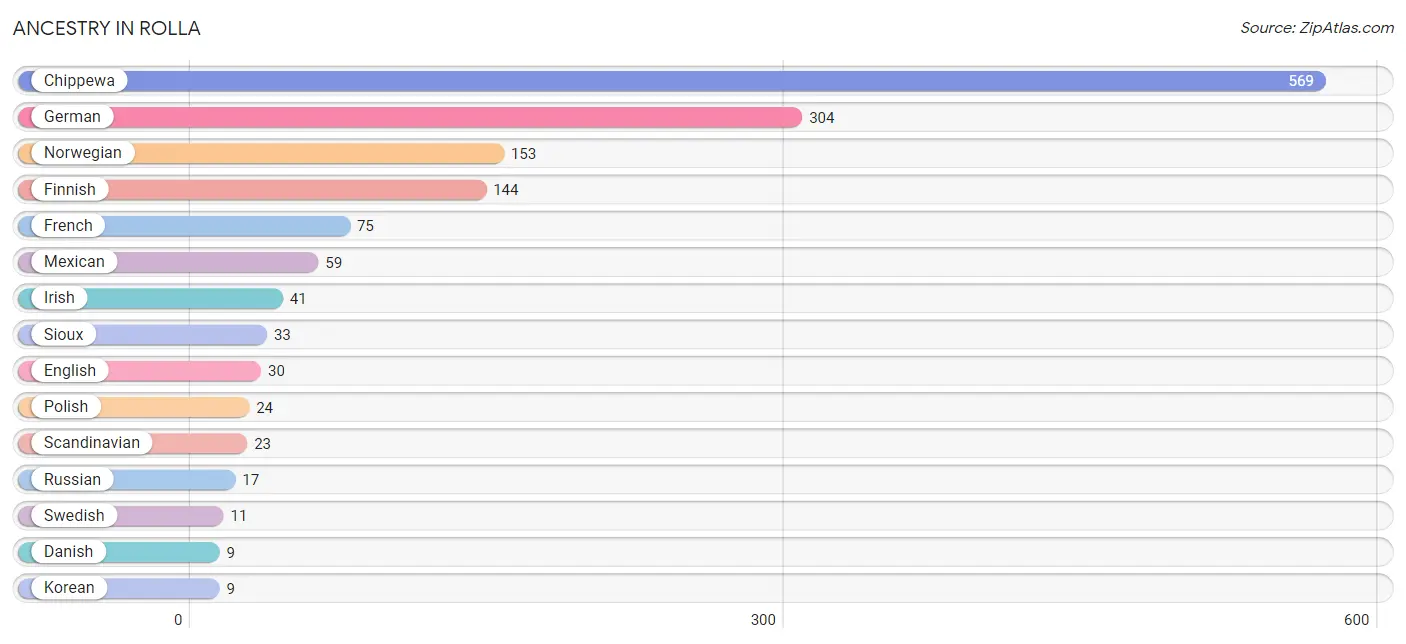
| Ancestry | # Population | % Population |
| American | 4 | 0.3% |
| Canadian | 2 | 0.2% |
| Chippewa | 569 | 47.8% |
| Danish | 9 | 0.8% |
| English | 30 | 2.5% |
| Finnish | 144 | 12.1% |
| French | 75 | 6.3% |
| French Canadian | 5 | 0.4% |
| German | 304 | 25.6% |
| Irish | 41 | 3.5% |
| Italian | 4 | 0.3% |
| Korean | 9 | 0.8% |
| Mexican | 59 | 5.0% |
| Norwegian | 153 | 12.9% |
| Polish | 24 | 2.0% |
| Russian | 17 | 1.4% |
| Scandinavian | 23 | 1.9% |
| Sioux | 33 | 2.8% |
| Swedish | 11 | 0.9% |
| Thai | 2 | 0.2% | View All 20 Rows |
Immigrants in Rolla
The most numerous immigrant groups reported in Rolla came from Asia (11 | 0.9%), Philippines (9 | 0.8%), South Eastern Asia (9 | 0.8%), Europe (7 | 0.6%), and Eastern Europe (5 | 0.4%), together accounting for 3.4% of all Rolla residents.
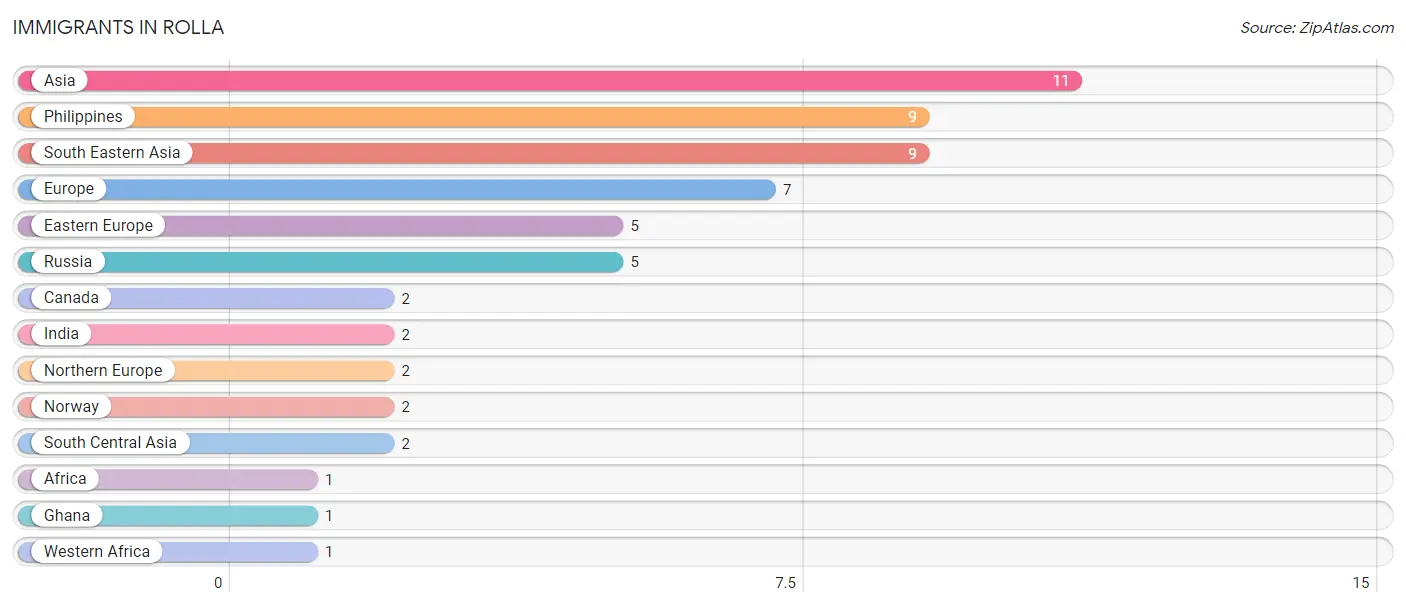
| Immigration Origin | # Population | % Population |
| Africa | 1 | 0.1% |
| Asia | 11 | 0.9% |
| Canada | 2 | 0.2% |
| Eastern Europe | 5 | 0.4% |
| Europe | 7 | 0.6% |
| Ghana | 1 | 0.1% |
| India | 2 | 0.2% |
| Northern Europe | 2 | 0.2% |
| Norway | 2 | 0.2% |
| Philippines | 9 | 0.8% |
| Russia | 5 | 0.4% |
| South Central Asia | 2 | 0.2% |
| South Eastern Asia | 9 | 0.8% |
| Western Africa | 1 | 0.1% | View All 14 Rows |
Sex and Age in Rolla
Sex and Age in Rolla
The most populous age groups in Rolla are 10 to 14 Years (85 | 14.6%) for men and 10 to 14 Years (73 | 12.0%) for women.
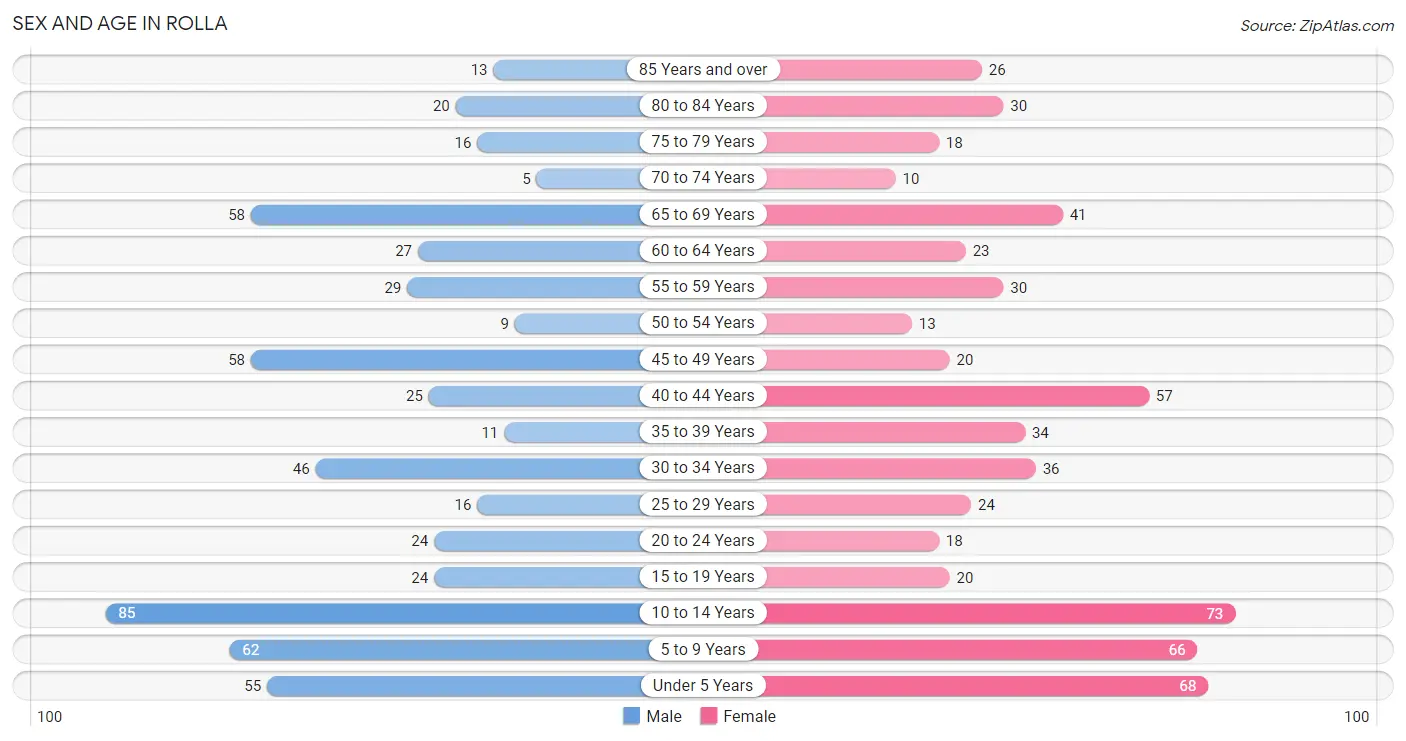
| Age Bracket | Male | Female |
| Under 5 Years | 55 (9.4%) | 68 (11.2%) |
| 5 to 9 Years | 62 (10.6%) | 66 (10.9%) |
| 10 to 14 Years | 85 (14.6%) | 73 (12.0%) |
| 15 to 19 Years | 24 (4.1%) | 20 (3.3%) |
| 20 to 24 Years | 24 (4.1%) | 18 (3.0%) |
| 25 to 29 Years | 16 (2.7%) | 24 (4.0%) |
| 30 to 34 Years | 46 (7.9%) | 36 (5.9%) |
| 35 to 39 Years | 11 (1.9%) | 34 (5.6%) |
| 40 to 44 Years | 25 (4.3%) | 57 (9.4%) |
| 45 to 49 Years | 58 (10.0%) | 20 (3.3%) |
| 50 to 54 Years | 9 (1.5%) | 13 (2.1%) |
| 55 to 59 Years | 29 (5.0%) | 30 (4.9%) |
| 60 to 64 Years | 27 (4.6%) | 23 (3.8%) |
| 65 to 69 Years | 58 (10.0%) | 41 (6.8%) |
| 70 to 74 Years | 5 (0.9%) | 10 (1.7%) |
| 75 to 79 Years | 16 (2.7%) | 18 (3.0%) |
| 80 to 84 Years | 20 (3.4%) | 30 (4.9%) |
| 85 Years and over | 13 (2.2%) | 26 (4.3%) |
| Total | 583 (100.0%) | 607 (100.0%) |
Families and Households in Rolla
Median Family Size in Rolla
The median family size in Rolla is 4.18 persons per family, with married-couple families (112 | 49.3%) accounting for the largest median family size of 4.61 persons per family. On the other hand, single male/father families (26 | 11.5%) represent the smallest median family size with 3.15 persons per family.
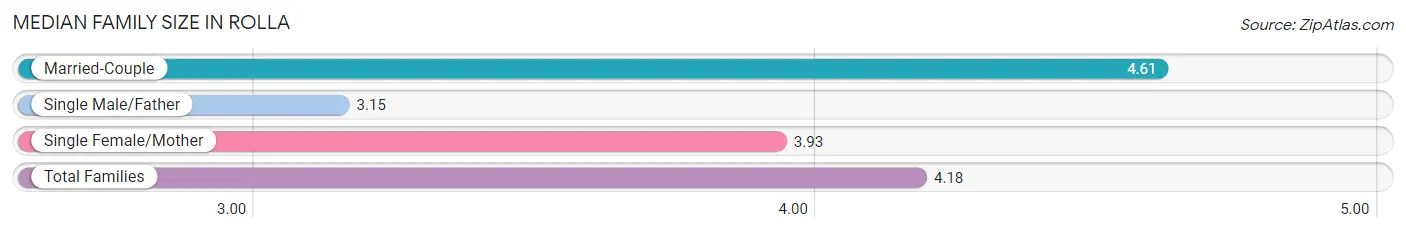
| Family Type | # Families | Family Size |
| Married-Couple | 112 (49.3%) | 4.61 |
| Single Male/Father | 26 (11.5%) | 3.15 |
| Single Female/Mother | 89 (39.2%) | 3.93 |
| Total Families | 227 (100.0%) | 4.18 |
Median Household Size in Rolla
The median household size in Rolla is 2.95 persons per household, with married-couple households (112 | 28.8%) accounting for the largest median household size of 4.61 persons per household. non-family households (162 | 41.6%) represent the smallest median household size with 1.12 persons per household.
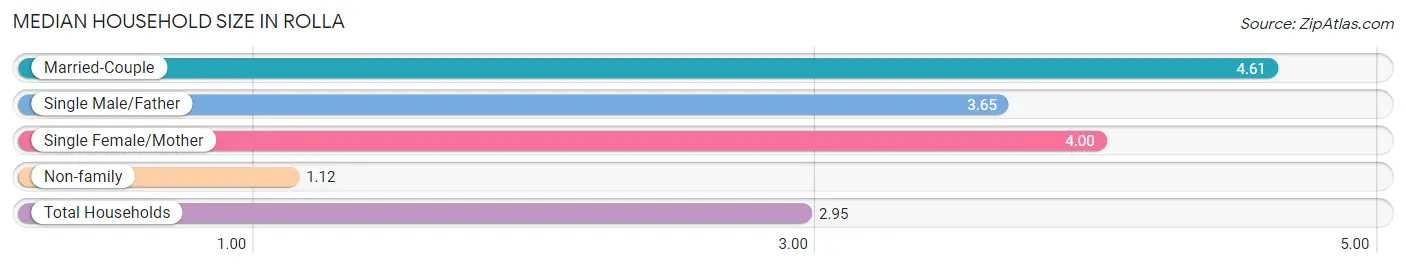
| Household Type | # Households | Household Size |
| Married-Couple | 112 (28.8%) | 4.61 |
| Single Male/Father | 26 (6.7%) | 3.65 |
| Single Female/Mother | 89 (22.9%) | 4.00 |
| Non-family | 162 (41.6%) | 1.12 |
| Total Households | 389 (100.0%) | 2.95 |
Household Size by Marriage Status in Rolla
Out of a total of 389 households in Rolla, 227 (58.4%) are family households, while 162 (41.6%) are nonfamily households. The most numerous type of family households are 2-person households, comprising 72, and the most common type of nonfamily households are 1-person households, comprising 145.
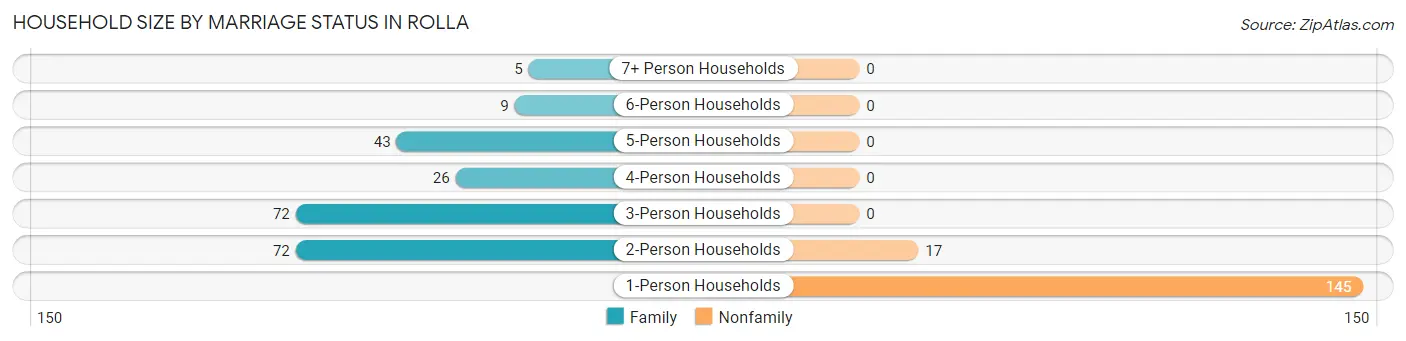
| Household Size | Family Households | Nonfamily Households |
| 1-Person Households | - | 145 (37.3%) |
| 2-Person Households | 72 (18.5%) | 17 (4.4%) |
| 3-Person Households | 72 (18.5%) | 0 (0.0%) |
| 4-Person Households | 26 (6.7%) | 0 (0.0%) |
| 5-Person Households | 43 (11.1%) | 0 (0.0%) |
| 6-Person Households | 9 (2.3%) | 0 (0.0%) |
| 7+ Person Households | 5 (1.3%) | 0 (0.0%) |
| Total | 227 (58.4%) | 162 (41.6%) |
Female Fertility in Rolla
Fertility by Age in Rolla
Average fertility rate in Rolla is 53.0 births per 1,000 women. Women in the age bracket of 20 to 34 years have the highest fertility rate with 90.0 births per 1,000 women. Women in the age bracket of 20 to 34 years acount for 63.6% of all women with births.
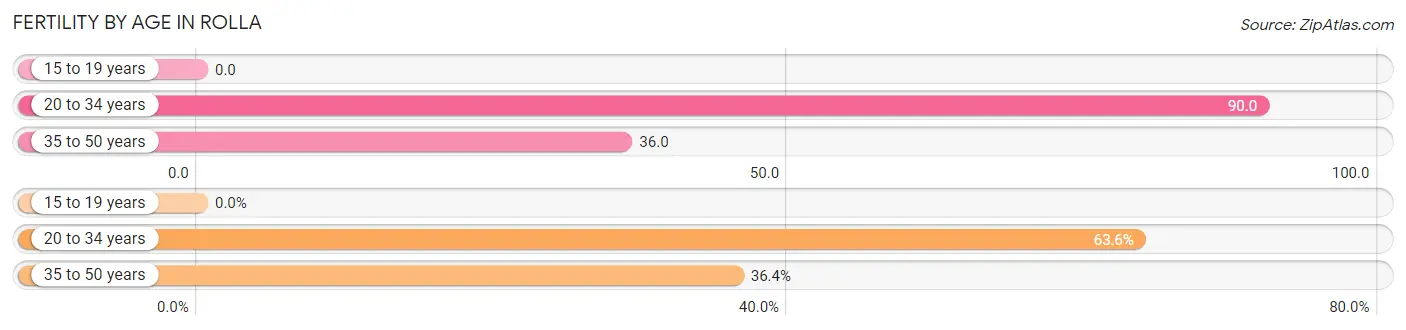
| Age Bracket | Women with Births | Births / 1,000 Women |
| 15 to 19 years | 0 (0.0%) | 0.0 |
| 20 to 34 years | 7 (63.6%) | 90.0 |
| 35 to 50 years | 4 (36.4%) | 36.0 |
| Total | 11 (100.0%) | 53.0 |
Fertility by Age by Marriage Status in Rolla
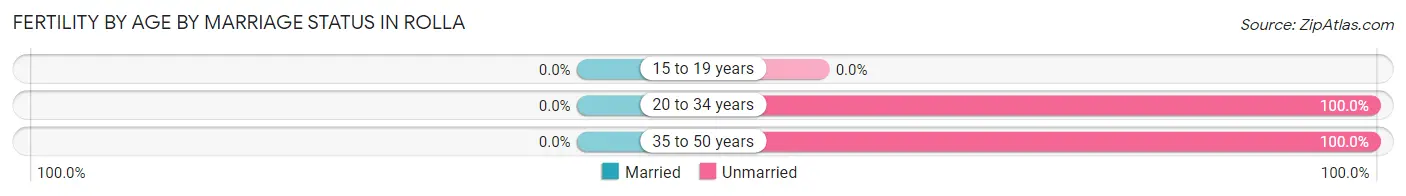
| Age Bracket | Married | Unmarried |
| 15 to 19 years | 0 (0.0%) | 0 (0.0%) |
| 20 to 34 years | 0 (0.0%) | 7 (100.0%) |
| 35 to 50 years | 0 (0.0%) | 4 (100.0%) |
| Total | 0 (0.0%) | 11 (100.0%) |
Fertility by Education in Rolla
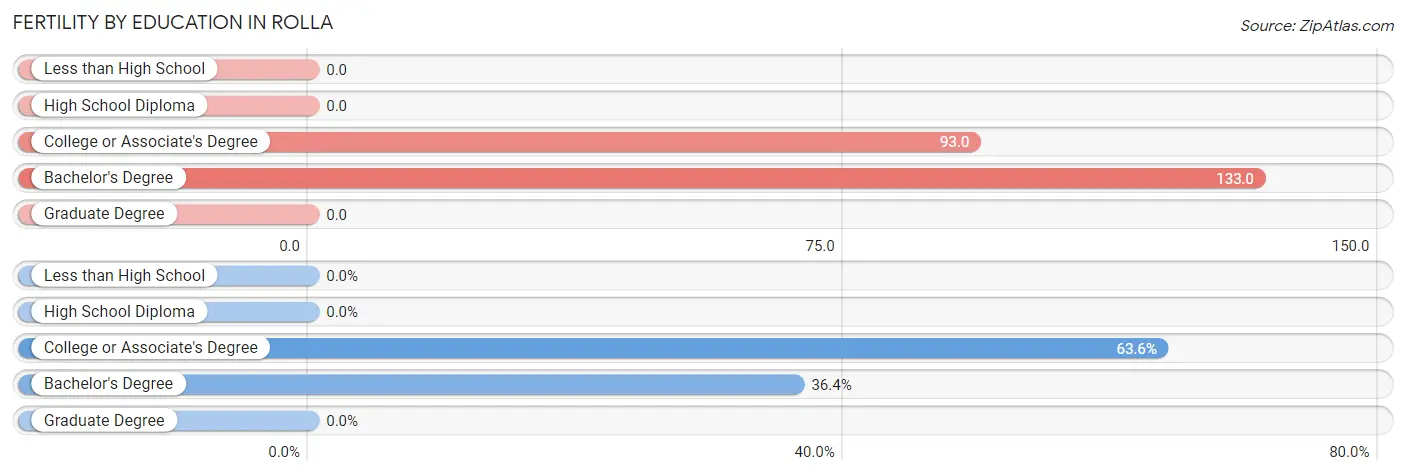
| Educational Attainment | Women with Births | Births / 1,000 Women |
| Less than High School | 0 (0.0%) | 0.0 |
| High School Diploma | 0 (0.0%) | 0.0 |
| College or Associate's Degree | 7 (63.6%) | 93.0 |
| Bachelor's Degree | 4 (36.4%) | 133.0 |
| Graduate Degree | 0 (0.0%) | 0.0 |
| Total | 11 (100.0%) | 53.0 |
Fertility by Education by Marriage Status in Rolla
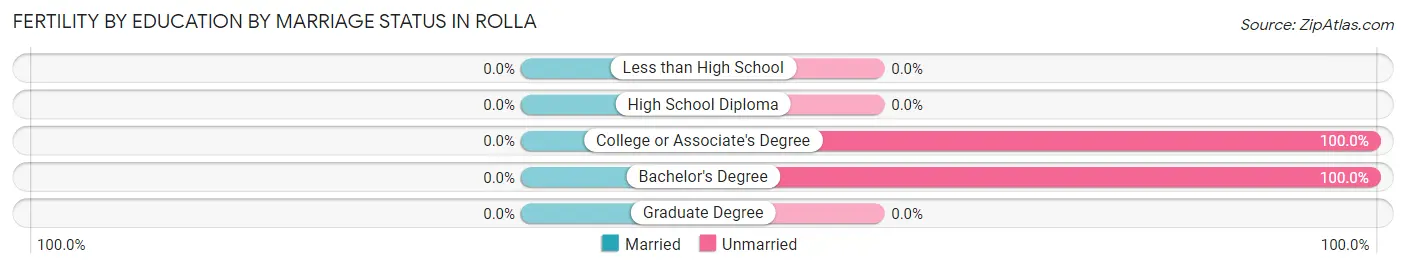
| Educational Attainment | Married | Unmarried |
| Less than High School | 0 (0.0%) | 0 (0.0%) |
| High School Diploma | 0 (0.0%) | 0 (0.0%) |
| College or Associate's Degree | 0 (0.0%) | 7 (100.0%) |
| Bachelor's Degree | 0 (0.0%) | 4 (100.0%) |
| Graduate Degree | 0 (0.0%) | 0 (0.0%) |
| Total | 0 (0.0%) | 11 (100.0%) |
Employment Characteristics in Rolla
Employment by Class of Employer in Rolla
Among the 443 employed individuals in Rolla, private company employees (228 | 51.5%), self-employed (not incorporated) (61 | 13.8%), and state government employees (53 | 12.0%) make up the most common classes of employment.
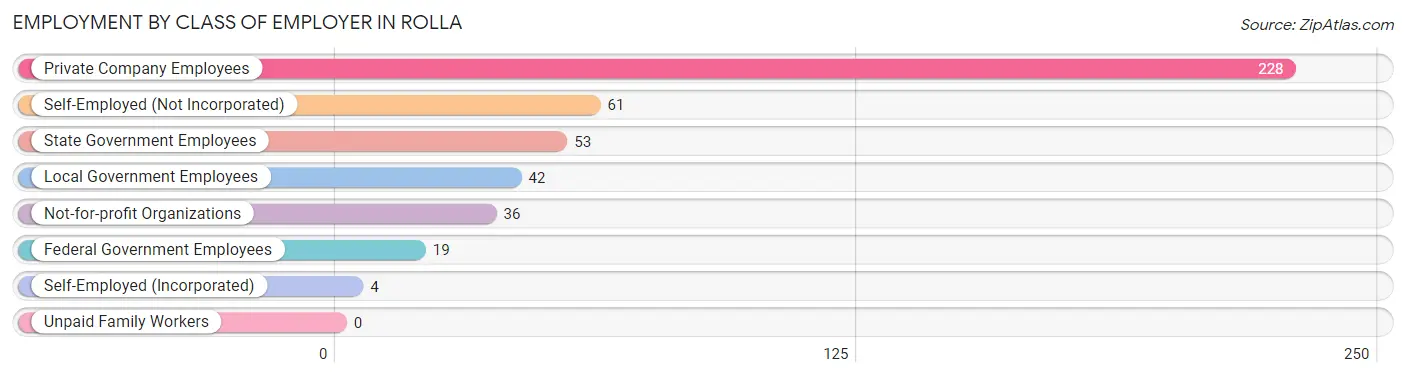
| Employer Class | # Employees | % Employees |
| Private Company Employees | 228 | 51.5% |
| Self-Employed (Incorporated) | 4 | 0.9% |
| Self-Employed (Not Incorporated) | 61 | 13.8% |
| Not-for-profit Organizations | 36 | 8.1% |
| Local Government Employees | 42 | 9.5% |
| State Government Employees | 53 | 12.0% |
| Federal Government Employees | 19 | 4.3% |
| Unpaid Family Workers | 0 | 0.0% |
| Total | 443 | 100.0% |
Employment Status by Age in Rolla
According to the labor force statistics for Rolla, out of the total population over 16 years of age (767), 64.3% or 493 individuals are in the labor force, with 9.3% or 46 of them unemployed. The age group with the highest labor force participation rate is 25 to 29 years, with 100.0% or 40 individuals in the labor force. Within the labor force, the 20 to 24 years age range has the highest percentage of unemployed individuals, with 34.1% or 14 of them being unemployed.
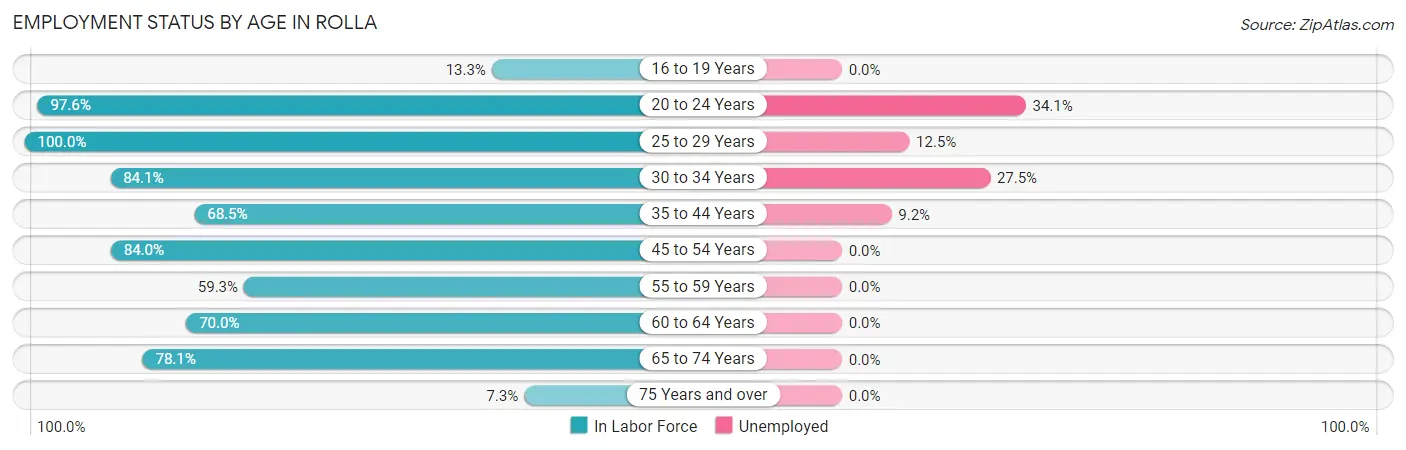
| Age Bracket | In Labor Force | Unemployed |
| 16 to 19 Years | 4 (13.3%) | 0 (0.0%) |
| 20 to 24 Years | 41 (97.6%) | 14 (34.1%) |
| 25 to 29 Years | 40 (100.0%) | 5 (12.5%) |
| 30 to 34 Years | 69 (84.1%) | 19 (27.5%) |
| 35 to 44 Years | 87 (68.5%) | 8 (9.2%) |
| 45 to 54 Years | 84 (84.0%) | 0 (0.0%) |
| 55 to 59 Years | 35 (59.3%) | 0 (0.0%) |
| 60 to 64 Years | 35 (70.0%) | 0 (0.0%) |
| 65 to 74 Years | 89 (78.1%) | 0 (0.0%) |
| 75 Years and over | 9 (7.3%) | 0 (0.0%) |
| Total | 493 (64.3%) | 46 (9.3%) |
Employment Status by Educational Attainment in Rolla
According to labor force statistics for Rolla, 76.4% of individuals (350) out of the total population between 25 and 64 years of age (458) are in the labor force, with 9.1% or 32 of them being unemployed. The group with the highest labor force participation rate are those with the educational attainment of college / associate degree, with 87.7% or 207 individuals in the labor force. Within the labor force, individuals with less than high school education have the highest percentage of unemployment, with 88.9% or 8 of them being unemployed.
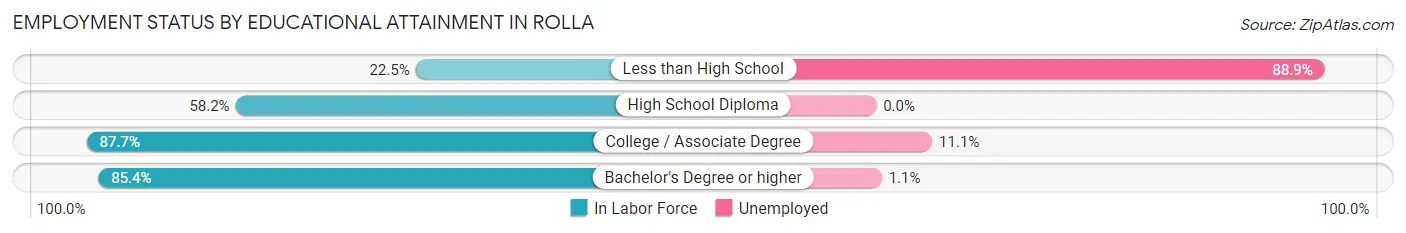
| Educational Attainment | In Labor Force | Unemployed |
| Less than High School | 9 (22.5%) | 36 (88.9%) |
| High School Diploma | 46 (58.2%) | 0 (0.0%) |
| College / Associate Degree | 207 (87.7%) | 26 (11.1%) |
| Bachelor's Degree or higher | 88 (85.4%) | 1 (1.1%) |
| Total | 350 (76.4%) | 42 (9.1%) |
Employment Occupations by Sex in Rolla
Management, Business, Science and Arts Occupations
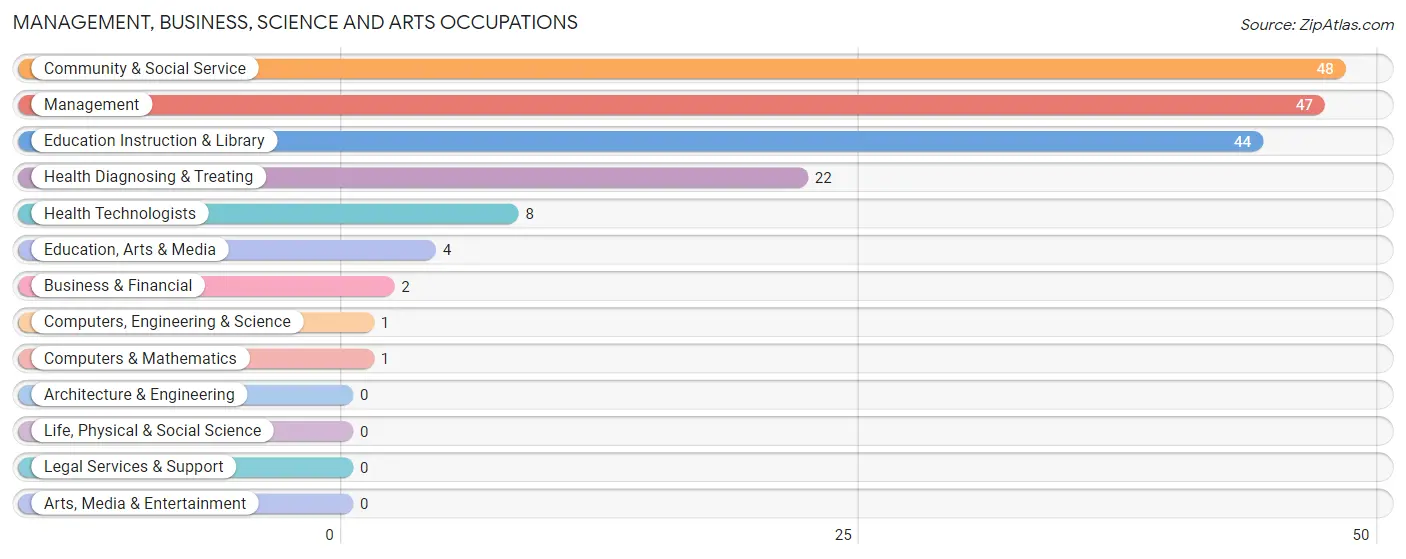
The most common Management, Business, Science and Arts occupations in Rolla are Community & Social Service (48 | 10.7%), Management (47 | 10.5%), Education Instruction & Library (44 | 9.8%), Health Diagnosing & Treating (22 | 4.9%), and Health Technologists (8 | 1.8%).
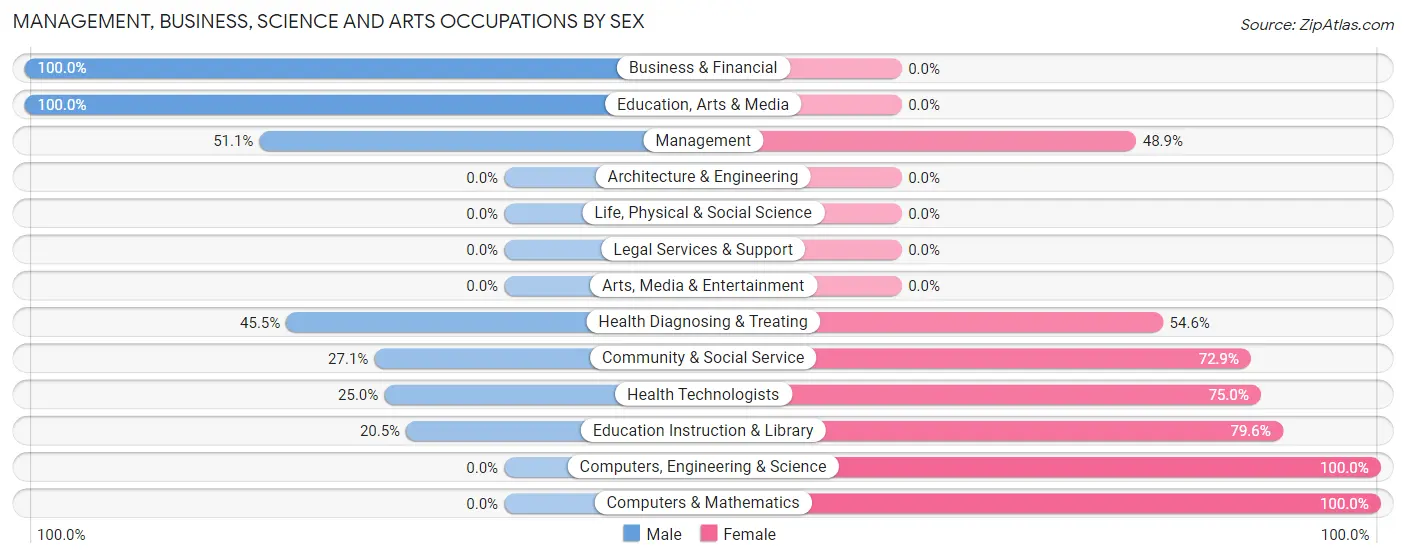
Management, Business, Science and Arts Occupations by Sex
Within the Management, Business, Science and Arts occupations in Rolla, the most male-oriented occupations are Business & Financial (100.0%), Education, Arts & Media (100.0%), and Management (51.1%), while the most female-oriented occupations are Computers, Engineering & Science (100.0%), Computers & Mathematics (100.0%), and Education Instruction & Library (79.5%).
| Occupation | Male | Female |
| Management | 24 (51.1%) | 23 (48.9%) |
| Business & Financial | 2 (100.0%) | 0 (0.0%) |
| Computers, Engineering & Science | 0 (0.0%) | 1 (100.0%) |
| Computers & Mathematics | 0 (0.0%) | 1 (100.0%) |
| Architecture & Engineering | 0 (0.0%) | 0 (0.0%) |
| Life, Physical & Social Science | 0 (0.0%) | 0 (0.0%) |
| Community & Social Service | 13 (27.1%) | 35 (72.9%) |
| Education, Arts & Media | 4 (100.0%) | 0 (0.0%) |
| Legal Services & Support | 0 (0.0%) | 0 (0.0%) |
| Education Instruction & Library | 9 (20.4%) | 35 (79.5%) |
| Arts, Media & Entertainment | 0 (0.0%) | 0 (0.0%) |
| Health Diagnosing & Treating | 10 (45.5%) | 12 (54.5%) |
| Health Technologists | 2 (25.0%) | 6 (75.0%) |
| Total (Category) | 49 (40.8%) | 71 (59.2%) |
| Total (Overall) | 232 (51.9%) | 215 (48.1%) |
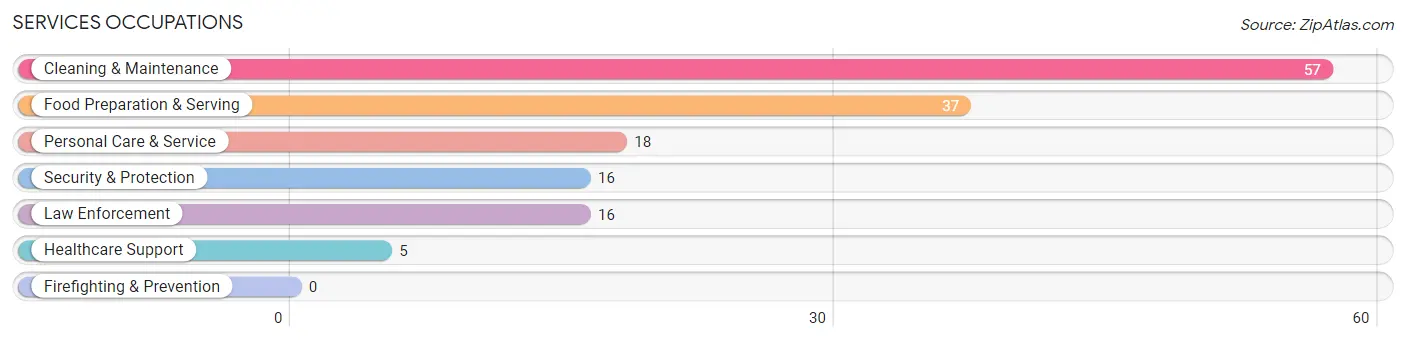
Services Occupations
The most common Services occupations in Rolla are Cleaning & Maintenance (57 | 12.8%), Food Preparation & Serving (37 | 8.3%), Personal Care & Service (18 | 4.0%), Security & Protection (16 | 3.6%), and Law Enforcement (16 | 3.6%).
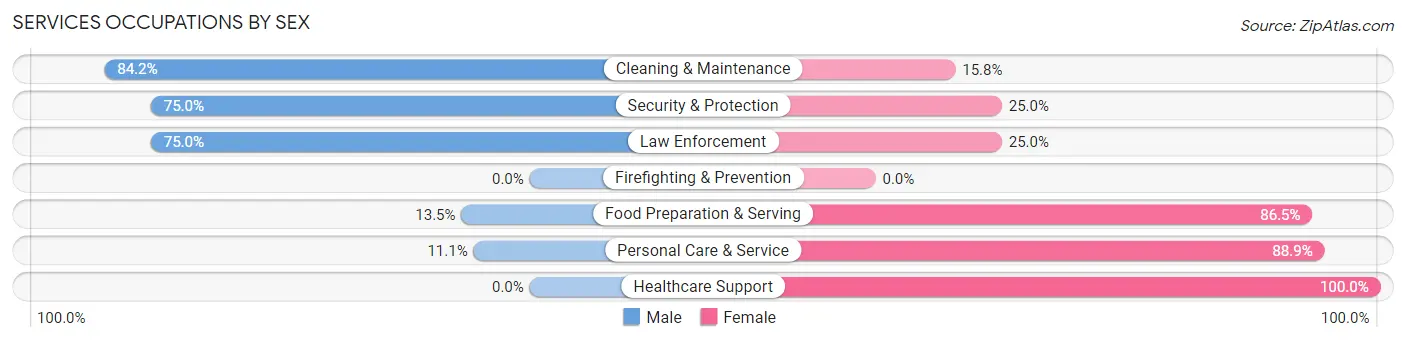
Services Occupations by Sex
Within the Services occupations in Rolla, the most male-oriented occupations are Cleaning & Maintenance (84.2%), Security & Protection (75.0%), and Law Enforcement (75.0%), while the most female-oriented occupations are Healthcare Support (100.0%), Personal Care & Service (88.9%), and Food Preparation & Serving (86.5%).
| Occupation | Male | Female |
| Healthcare Support | 0 (0.0%) | 5 (100.0%) |
| Security & Protection | 12 (75.0%) | 4 (25.0%) |
| Firefighting & Prevention | 0 (0.0%) | 0 (0.0%) |
| Law Enforcement | 12 (75.0%) | 4 (25.0%) |
| Food Preparation & Serving | 5 (13.5%) | 32 (86.5%) |
| Cleaning & Maintenance | 48 (84.2%) | 9 (15.8%) |
| Personal Care & Service | 2 (11.1%) | 16 (88.9%) |
| Total (Category) | 67 (50.4%) | 66 (49.6%) |
| Total (Overall) | 232 (51.9%) | 215 (48.1%) |
Sales and Office Occupations
The most common Sales and Office occupations in Rolla are Sales & Related (84 | 18.8%), and Office & Administration (43 | 9.6%).
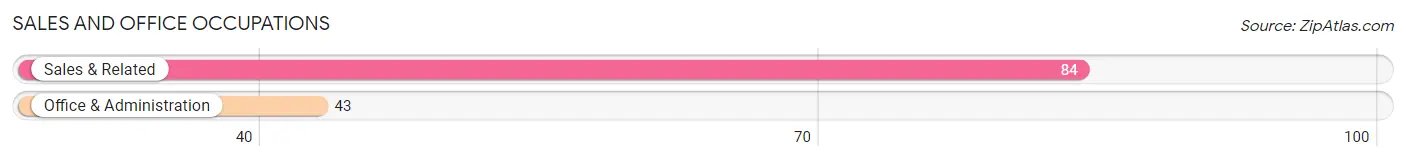
Sales and Office Occupations by Sex
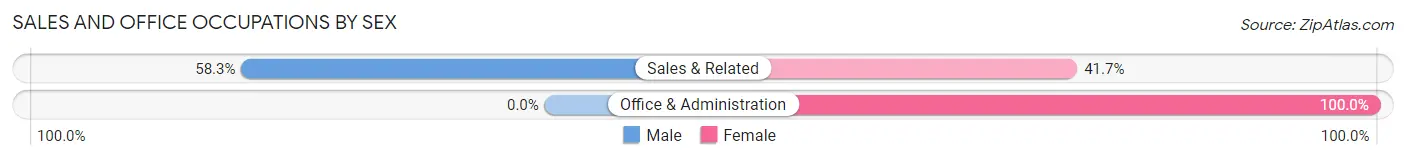
| Occupation | Male | Female |
| Sales & Related | 49 (58.3%) | 35 (41.7%) |
| Office & Administration | 0 (0.0%) | 43 (100.0%) |
| Total (Category) | 49 (38.6%) | 78 (61.4%) |
| Total (Overall) | 232 (51.9%) | 215 (48.1%) |
Natural Resources, Construction and Maintenance Occupations
The most common Natural Resources, Construction and Maintenance occupations in Rolla are Farming, Fishing & Forestry (12 | 2.7%), Installation, Maintenance & Repair (12 | 2.7%), and Construction & Extraction (10 | 2.2%).
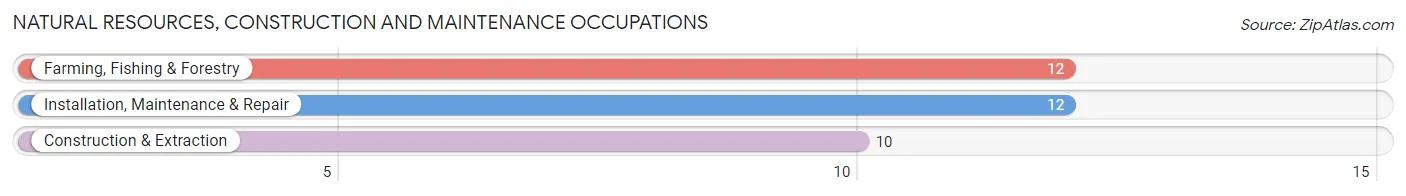
Natural Resources, Construction and Maintenance Occupations by Sex
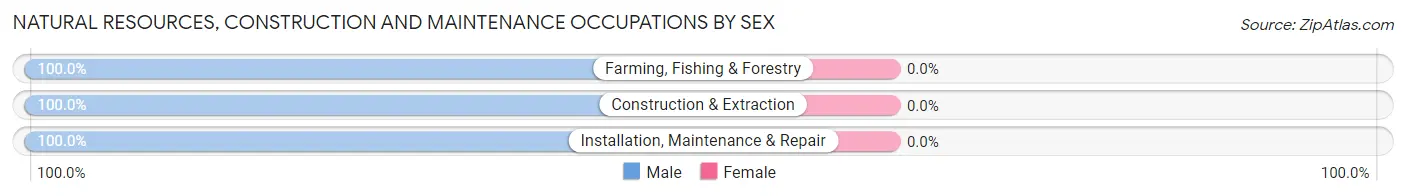
| Occupation | Male | Female |
| Farming, Fishing & Forestry | 12 (100.0%) | 0 (0.0%) |
| Construction & Extraction | 10 (100.0%) | 0 (0.0%) |
| Installation, Maintenance & Repair | 12 (100.0%) | 0 (0.0%) |
| Total (Category) | 34 (100.0%) | 0 (0.0%) |
| Total (Overall) | 232 (51.9%) | 215 (48.1%) |
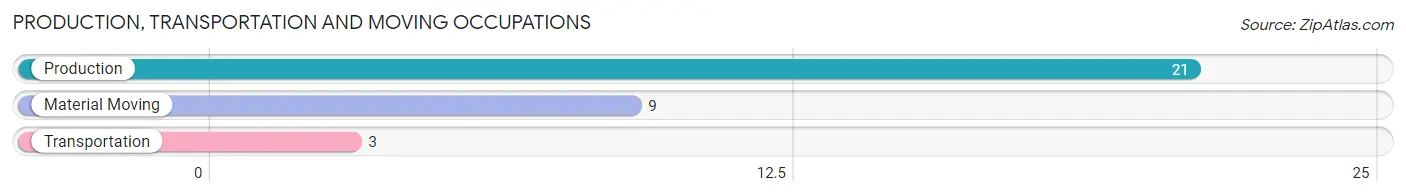
Production, Transportation and Moving Occupations
The most common Production, Transportation and Moving occupations in Rolla are Production (21 | 4.7%), Material Moving (9 | 2.0%), and Transportation (3 | 0.7%).
Production, Transportation and Moving Occupations by Sex
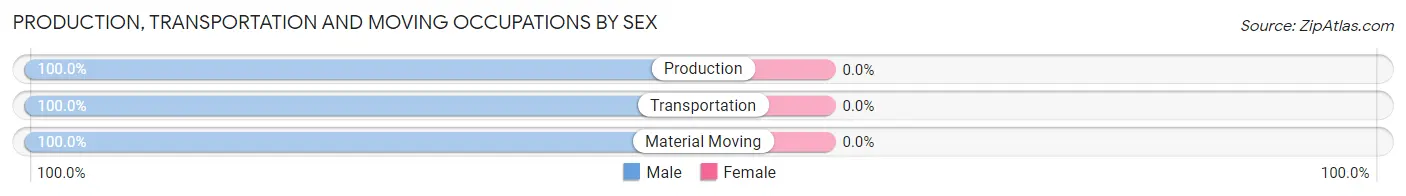
| Occupation | Male | Female |
| Production | 21 (100.0%) | 0 (0.0%) |
| Transportation | 3 (100.0%) | 0 (0.0%) |
| Material Moving | 9 (100.0%) | 0 (0.0%) |
| Total (Category) | 33 (100.0%) | 0 (0.0%) |
| Total (Overall) | 232 (51.9%) | 215 (48.1%) |
Employment Industries by Sex in Rolla
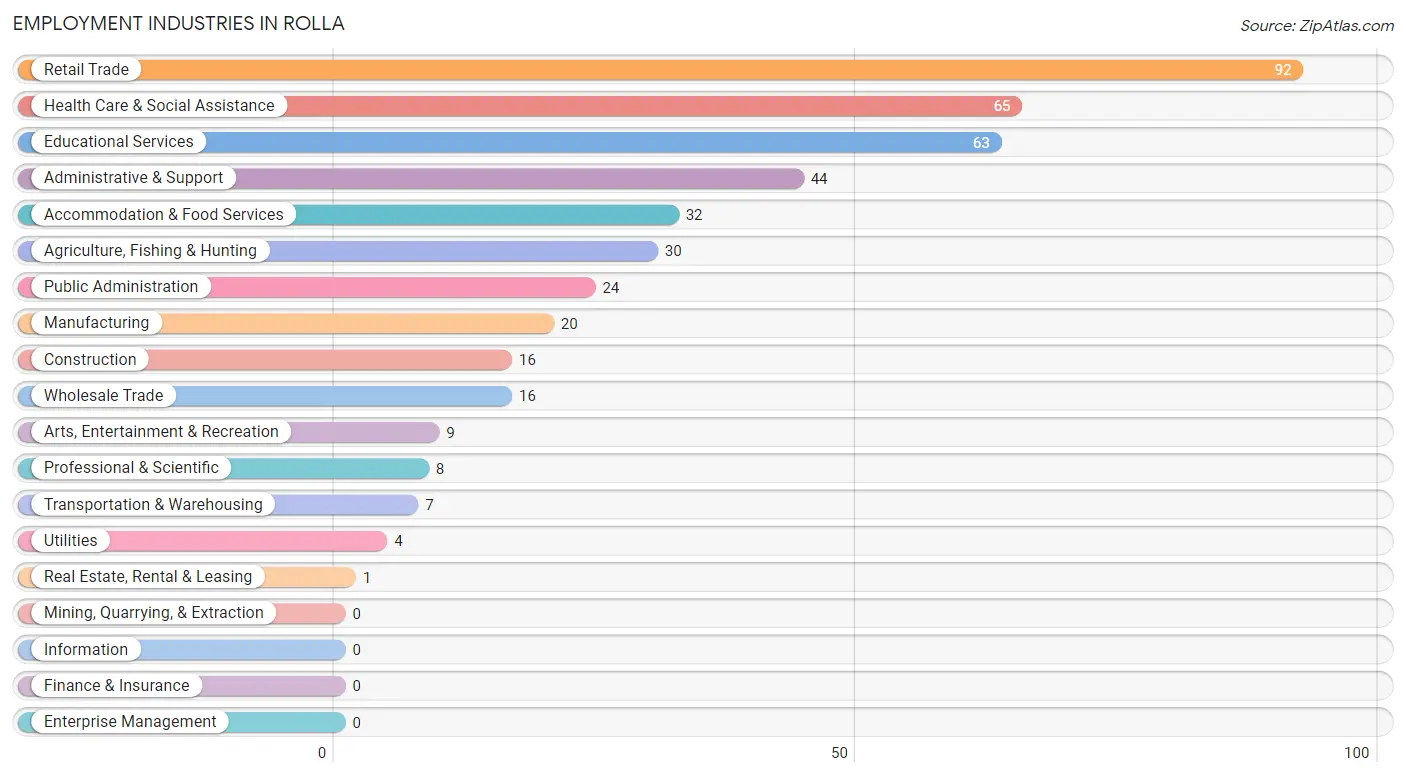
Employment Industries in Rolla
The major employment industries in Rolla include Retail Trade (92 | 20.6%), Health Care & Social Assistance (65 | 14.5%), Educational Services (63 | 14.1%), Administrative & Support (44 | 9.8%), and Accommodation & Food Services (32 | 7.2%).
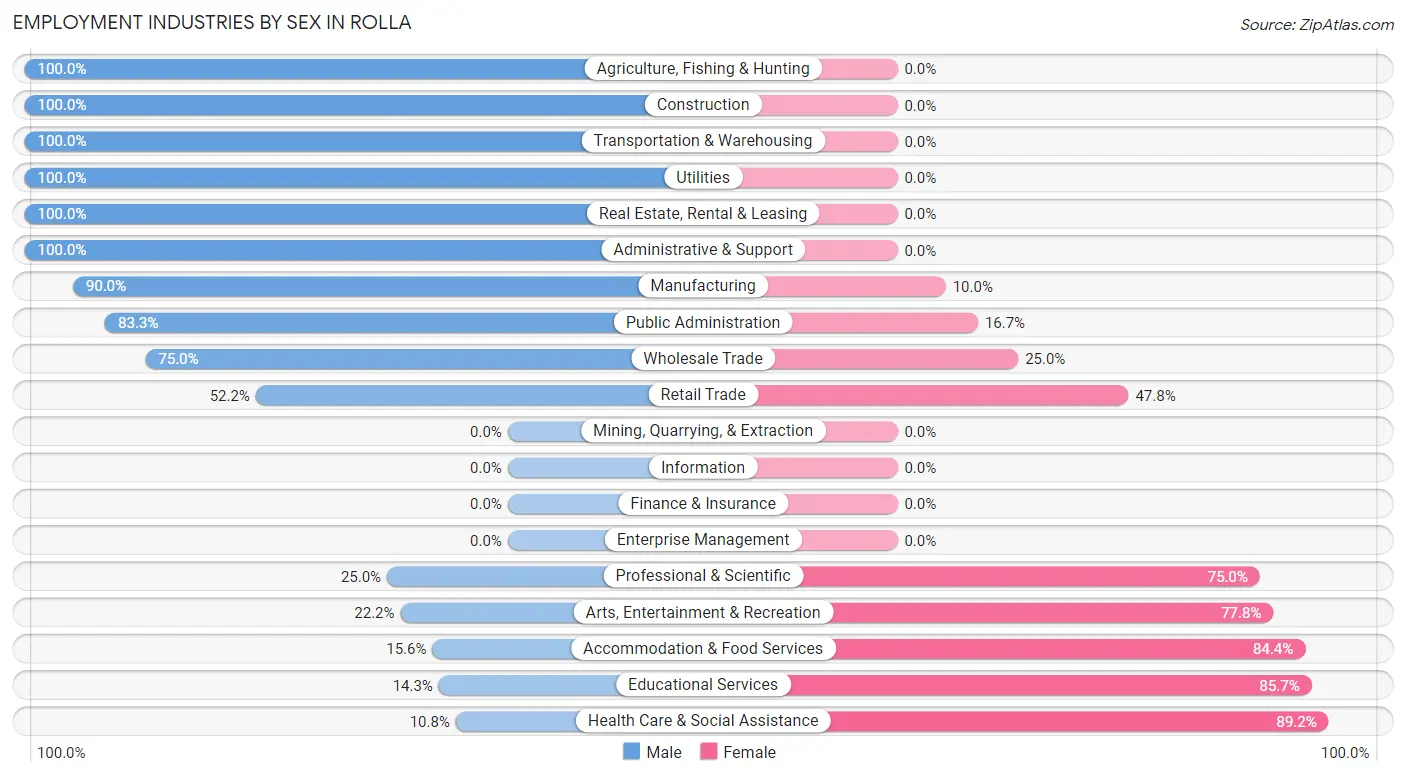
Employment Industries by Sex in Rolla
The Rolla industries that see more men than women are Agriculture, Fishing & Hunting (100.0%), Construction (100.0%), and Transportation & Warehousing (100.0%), whereas the industries that tend to have a higher number of women are Health Care & Social Assistance (89.2%), Educational Services (85.7%), and Accommodation & Food Services (84.4%).
| Industry | Male | Female |
| Agriculture, Fishing & Hunting | 30 (100.0%) | 0 (0.0%) |
| Mining, Quarrying, & Extraction | 0 (0.0%) | 0 (0.0%) |
| Construction | 16 (100.0%) | 0 (0.0%) |
| Manufacturing | 18 (90.0%) | 2 (10.0%) |
| Wholesale Trade | 12 (75.0%) | 4 (25.0%) |
| Retail Trade | 48 (52.2%) | 44 (47.8%) |
| Transportation & Warehousing | 7 (100.0%) | 0 (0.0%) |
| Utilities | 4 (100.0%) | 0 (0.0%) |
| Information | 0 (0.0%) | 0 (0.0%) |
| Finance & Insurance | 0 (0.0%) | 0 (0.0%) |
| Real Estate, Rental & Leasing | 1 (100.0%) | 0 (0.0%) |
| Professional & Scientific | 2 (25.0%) | 6 (75.0%) |
| Enterprise Management | 0 (0.0%) | 0 (0.0%) |
| Administrative & Support | 44 (100.0%) | 0 (0.0%) |
| Educational Services | 9 (14.3%) | 54 (85.7%) |
| Health Care & Social Assistance | 7 (10.8%) | 58 (89.2%) |
| Arts, Entertainment & Recreation | 2 (22.2%) | 7 (77.8%) |
| Accommodation & Food Services | 5 (15.6%) | 27 (84.4%) |
| Public Administration | 20 (83.3%) | 4 (16.7%) |
| Total | 232 (51.9%) | 215 (48.1%) |
Education in Rolla
School Enrollment in Rolla
The most common levels of schooling among the 400 students in Rolla are elementary school (167 | 41.7%), middle school (81 | 20.3%), and high school (56 | 14.0%).
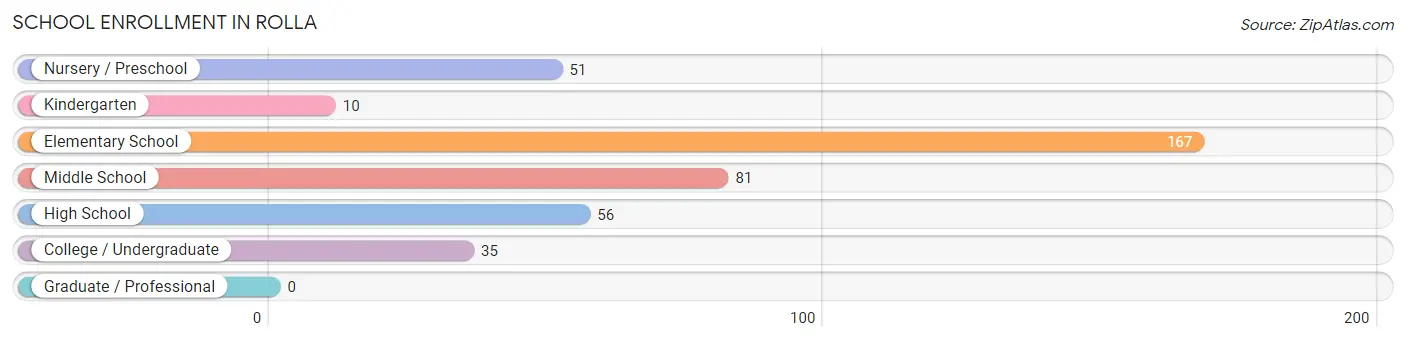
| School Level | # Students | % Students |
| Nursery / Preschool | 51 | 12.8% |
| Kindergarten | 10 | 2.5% |
| Elementary School | 167 | 41.7% |
| Middle School | 81 | 20.3% |
| High School | 56 | 14.0% |
| College / Undergraduate | 35 | 8.7% |
| Graduate / Professional | 0 | 0.0% |
| Total | 400 | 100.0% |
School Enrollment by Age by Funding Source in Rolla
Out of a total of 400 students who are enrolled in schools in Rolla, 33 (8.3%) attend a private institution, while the remaining 367 (91.7%) are enrolled in public schools. The age group of 10 to 14 year olds has the highest likelihood of being enrolled in private schools, with 26 (18.4% in the age bracket) enrolled. Conversely, the age group of 3 to 4 year olds has the lowest likelihood of being enrolled in a private school, with 51 (100.0% in the age bracket) attending a public institution.
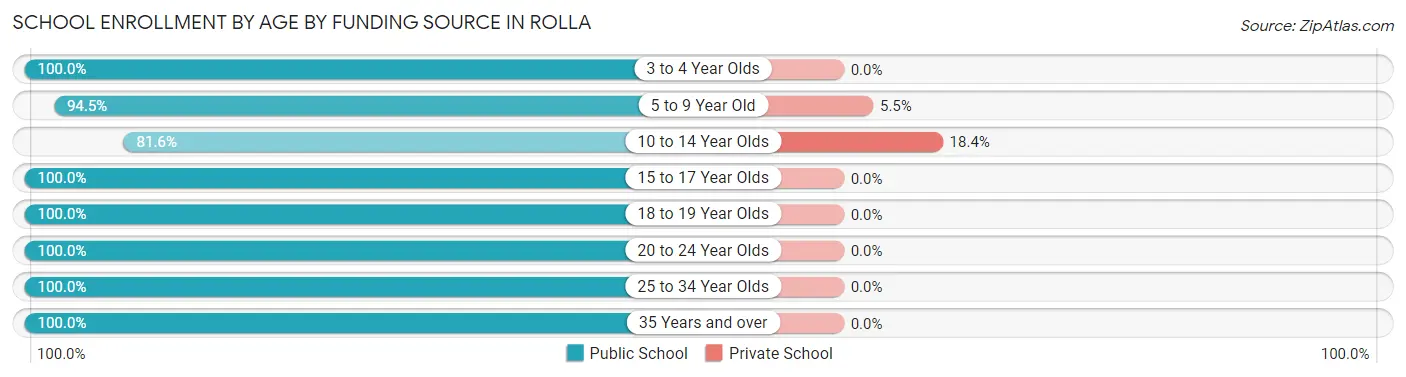
| Age Bracket | Public School | Private School |
| 3 to 4 Year Olds | 51 (100.0%) | 0 (0.0%) |
| 5 to 9 Year Old | 121 (94.5%) | 7 (5.5%) |
| 10 to 14 Year Olds | 115 (81.6%) | 26 (18.4%) |
| 15 to 17 Year Olds | 36 (100.0%) | 0 (0.0%) |
| 18 to 19 Year Olds | 8 (100.0%) | 0 (0.0%) |
| 20 to 24 Year Olds | 7 (100.0%) | 0 (0.0%) |
| 25 to 34 Year Olds | 18 (100.0%) | 0 (0.0%) |
| 35 Years and over | 11 (100.0%) | 0 (0.0%) |
| Total | 367 (91.8%) | 33 (8.3%) |
Educational Attainment by Field of Study in Rolla
Education (79 | 52.7%), science & technology (23 | 15.3%), physical & health sciences (11 | 7.3%), business (11 | 7.3%), and literature & languages (9 | 6.0%) are the most common fields of study among 150 individuals in Rolla who have obtained a bachelor's degree or higher.
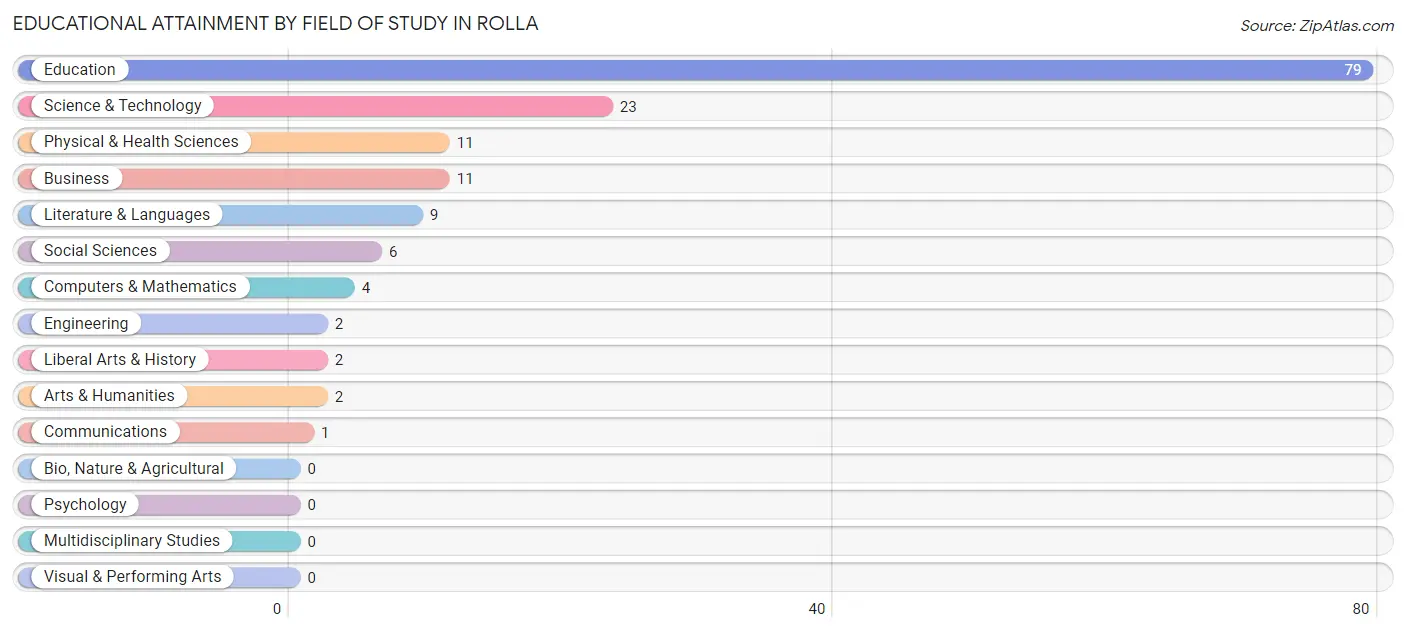
| Field of Study | # Graduates | % Graduates |
| Computers & Mathematics | 4 | 2.7% |
| Bio, Nature & Agricultural | 0 | 0.0% |
| Physical & Health Sciences | 11 | 7.3% |
| Psychology | 0 | 0.0% |
| Social Sciences | 6 | 4.0% |
| Engineering | 2 | 1.3% |
| Multidisciplinary Studies | 0 | 0.0% |
| Science & Technology | 23 | 15.3% |
| Business | 11 | 7.3% |
| Education | 79 | 52.7% |
| Literature & Languages | 9 | 6.0% |
| Liberal Arts & History | 2 | 1.3% |
| Visual & Performing Arts | 0 | 0.0% |
| Communications | 1 | 0.7% |
| Arts & Humanities | 2 | 1.3% |
| Total | 150 | 100.0% |
Transportation & Commute in Rolla
Vehicle Availability by Sex in Rolla
The most prevalent vehicle ownership categories in Rolla are males with 3 vehicles (135, accounting for 59.5%) and females with 3 vehicles (77, making up 62.8%).
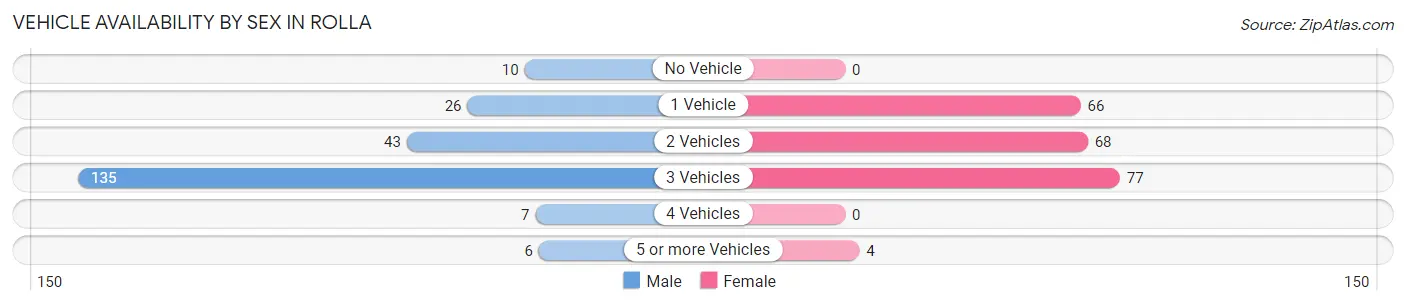
| Vehicles Available | Male | Female |
| No Vehicle | 10 (4.4%) | 0 (0.0%) |
| 1 Vehicle | 26 (11.5%) | 66 (30.7%) |
| 2 Vehicles | 43 (18.9%) | 68 (31.6%) |
| 3 Vehicles | 135 (59.5%) | 77 (35.8%) |
| 4 Vehicles | 7 (3.1%) | 0 (0.0%) |
| 5 or more Vehicles | 6 (2.6%) | 4 (1.9%) |
| Total | 227 (100.0%) | 215 (100.0%) |
Commute Time in Rolla
The most frequently occuring commute durations in Rolla are 5 to 9 minutes (154 commuters, 35.4%), less than 5 minutes (86 commuters, 19.8%), and 10 to 14 minutes (71 commuters, 16.3%).
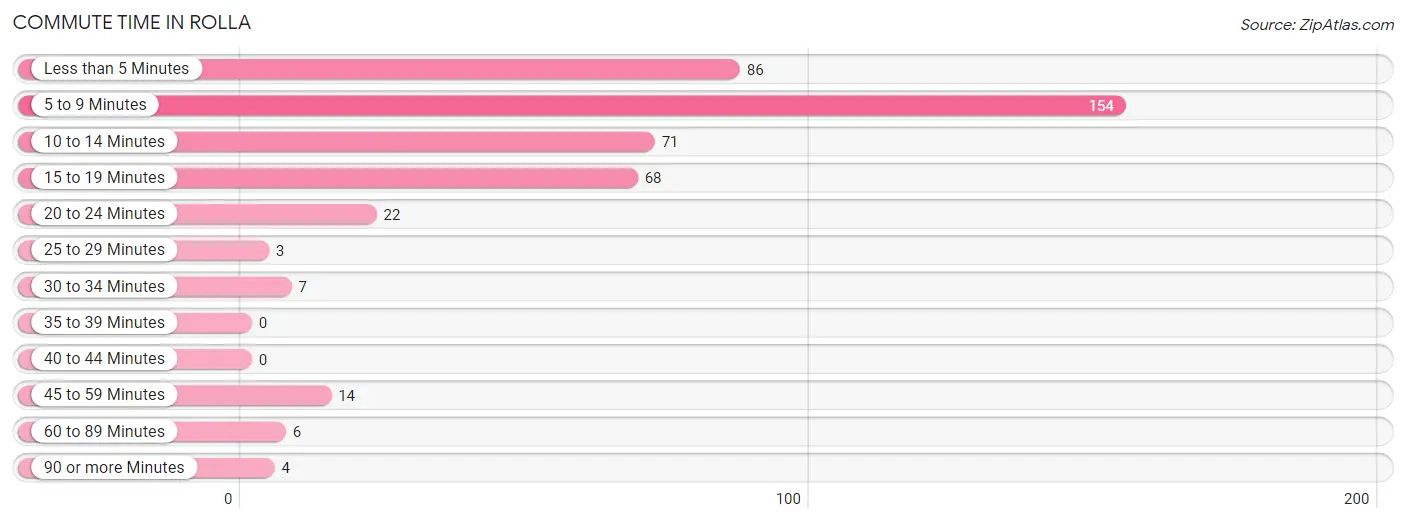
| Commute Time | # Commuters | % Commuters |
| Less than 5 Minutes | 86 | 19.8% |
| 5 to 9 Minutes | 154 | 35.4% |
| 10 to 14 Minutes | 71 | 16.3% |
| 15 to 19 Minutes | 68 | 15.6% |
| 20 to 24 Minutes | 22 | 5.1% |
| 25 to 29 Minutes | 3 | 0.7% |
| 30 to 34 Minutes | 7 | 1.6% |
| 35 to 39 Minutes | 0 | 0.0% |
| 40 to 44 Minutes | 0 | 0.0% |
| 45 to 59 Minutes | 14 | 3.2% |
| 60 to 89 Minutes | 6 | 1.4% |
| 90 or more Minutes | 4 | 0.9% |
Commute Time by Sex in Rolla
The most common commute times in Rolla are 5 to 9 minutes (76 commuters, 33.9%) for males and 5 to 9 minutes (78 commuters, 37.0%) for females.
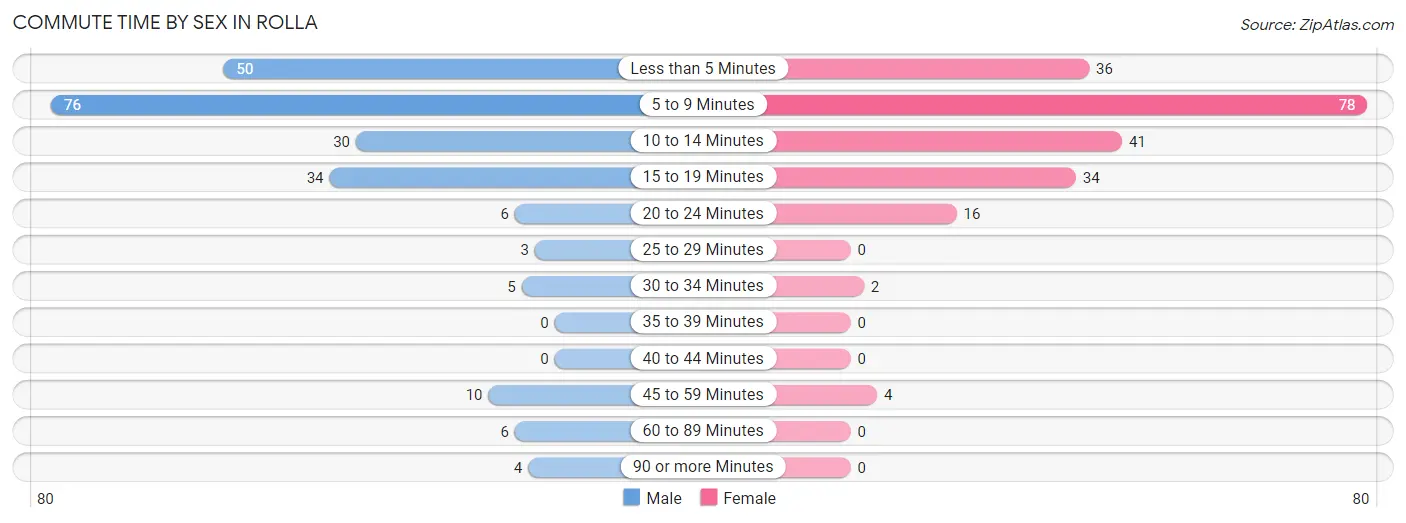
| Commute Time | Male | Female |
| Less than 5 Minutes | 50 (22.3%) | 36 (17.1%) |
| 5 to 9 Minutes | 76 (33.9%) | 78 (37.0%) |
| 10 to 14 Minutes | 30 (13.4%) | 41 (19.4%) |
| 15 to 19 Minutes | 34 (15.2%) | 34 (16.1%) |
| 20 to 24 Minutes | 6 (2.7%) | 16 (7.6%) |
| 25 to 29 Minutes | 3 (1.3%) | 0 (0.0%) |
| 30 to 34 Minutes | 5 (2.2%) | 2 (0.9%) |
| 35 to 39 Minutes | 0 (0.0%) | 0 (0.0%) |
| 40 to 44 Minutes | 0 (0.0%) | 0 (0.0%) |
| 45 to 59 Minutes | 10 (4.5%) | 4 (1.9%) |
| 60 to 89 Minutes | 6 (2.7%) | 0 (0.0%) |
| 90 or more Minutes | 4 (1.8%) | 0 (0.0%) |
Time of Departure to Work by Sex in Rolla
The most frequent times of departure to work in Rolla are 7:30 AM to 7:59 AM (73, 32.6%) for males and 7:30 AM to 7:59 AM (59, 28.0%) for females.
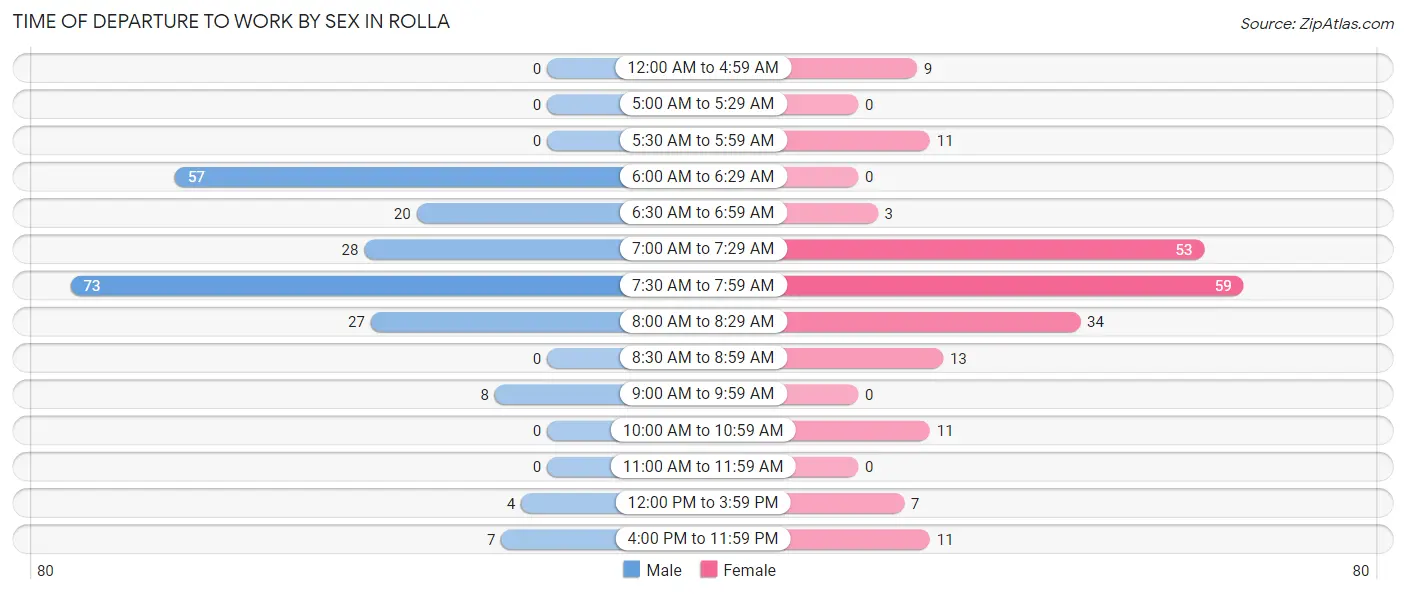
| Time of Departure | Male | Female |
| 12:00 AM to 4:59 AM | 0 (0.0%) | 9 (4.3%) |
| 5:00 AM to 5:29 AM | 0 (0.0%) | 0 (0.0%) |
| 5:30 AM to 5:59 AM | 0 (0.0%) | 11 (5.2%) |
| 6:00 AM to 6:29 AM | 57 (25.5%) | 0 (0.0%) |
| 6:30 AM to 6:59 AM | 20 (8.9%) | 3 (1.4%) |
| 7:00 AM to 7:29 AM | 28 (12.5%) | 53 (25.1%) |
| 7:30 AM to 7:59 AM | 73 (32.6%) | 59 (28.0%) |
| 8:00 AM to 8:29 AM | 27 (12.0%) | 34 (16.1%) |
| 8:30 AM to 8:59 AM | 0 (0.0%) | 13 (6.2%) |
| 9:00 AM to 9:59 AM | 8 (3.6%) | 0 (0.0%) |
| 10:00 AM to 10:59 AM | 0 (0.0%) | 11 (5.2%) |
| 11:00 AM to 11:59 AM | 0 (0.0%) | 0 (0.0%) |
| 12:00 PM to 3:59 PM | 4 (1.8%) | 7 (3.3%) |
| 4:00 PM to 11:59 PM | 7 (3.1%) | 11 (5.2%) |
| Total | 224 (100.0%) | 211 (100.0%) |
Housing Occupancy in Rolla
Occupancy by Ownership in Rolla
Of the total 389 dwellings in Rolla, owner-occupied units account for 213 (54.8%), while renter-occupied units make up 176 (45.2%).
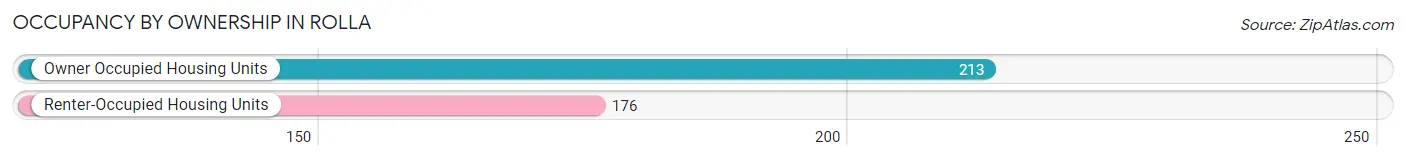
| Occupancy | # Housing Units | % Housing Units |
| Owner Occupied Housing Units | 213 | 54.8% |
| Renter-Occupied Housing Units | 176 | 45.2% |
| Total Occupied Housing Units | 389 | 100.0% |
Occupancy by Household Size in Rolla
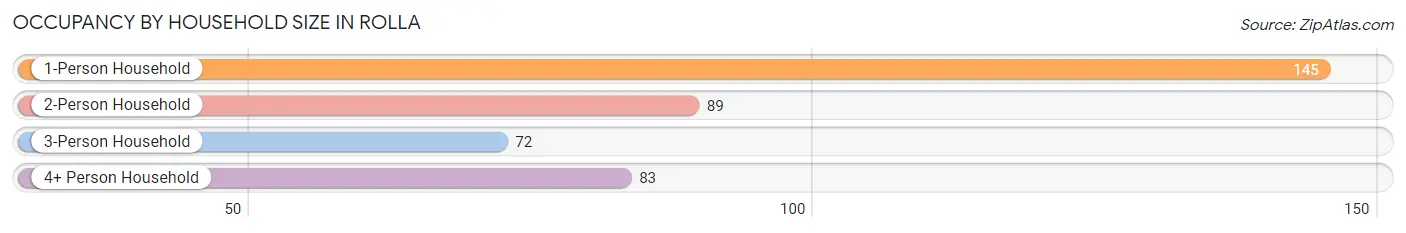
| Household Size | # Housing Units | % Housing Units |
| 1-Person Household | 145 | 37.3% |
| 2-Person Household | 89 | 22.9% |
| 3-Person Household | 72 | 18.5% |
| 4+ Person Household | 83 | 21.3% |
| Total Housing Units | 389 | 100.0% |
Occupancy by Ownership by Household Size in Rolla
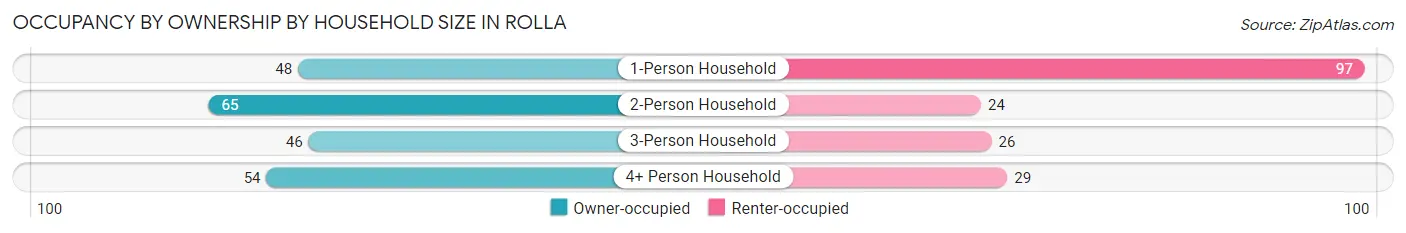
| Household Size | Owner-occupied | Renter-occupied |
| 1-Person Household | 48 (33.1%) | 97 (66.9%) |
| 2-Person Household | 65 (73.0%) | 24 (27.0%) |
| 3-Person Household | 46 (63.9%) | 26 (36.1%) |
| 4+ Person Household | 54 (65.1%) | 29 (34.9%) |
| Total Housing Units | 213 (54.8%) | 176 (45.2%) |
Occupancy by Educational Attainment in Rolla
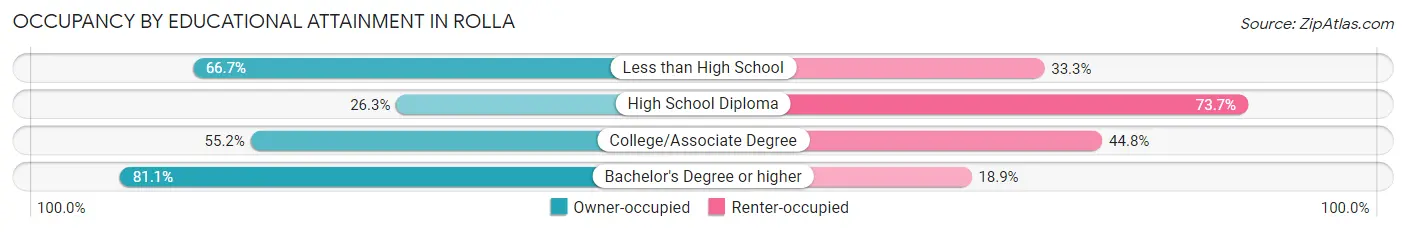
| Household Size | Owner-occupied | Renter-occupied |
| Less than High School | 14 (66.7%) | 7 (33.3%) |
| High School Diploma | 25 (26.3%) | 70 (73.7%) |
| College/Associate Degree | 101 (55.2%) | 82 (44.8%) |
| Bachelor's Degree or higher | 73 (81.1%) | 17 (18.9%) |
Occupancy by Age of Householder in Rolla
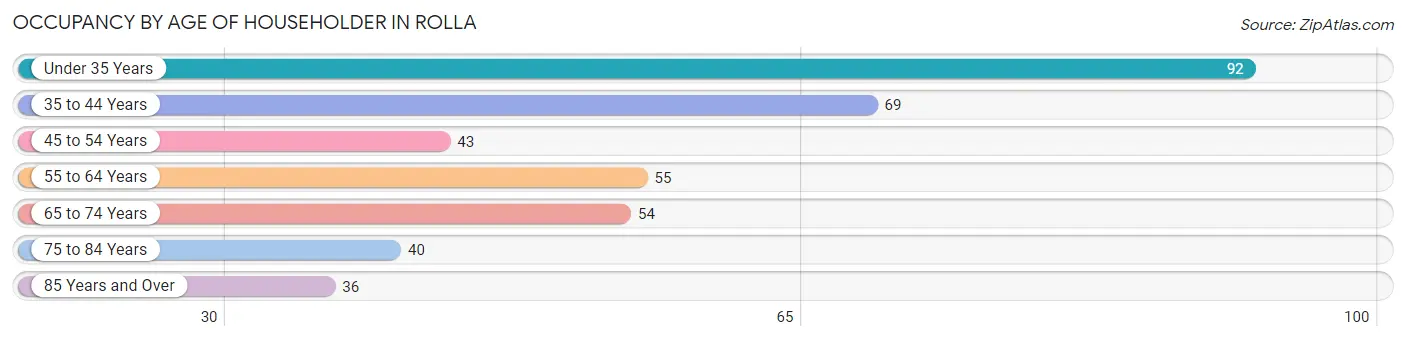
| Age Bracket | # Households | % Households |
| Under 35 Years | 92 | 23.6% |
| 35 to 44 Years | 69 | 17.7% |
| 45 to 54 Years | 43 | 11.1% |
| 55 to 64 Years | 55 | 14.1% |
| 65 to 74 Years | 54 | 13.9% |
| 75 to 84 Years | 40 | 10.3% |
| 85 Years and Over | 36 | 9.2% |
| Total | 389 | 100.0% |
Housing Finances in Rolla
Median Income by Occupancy in Rolla
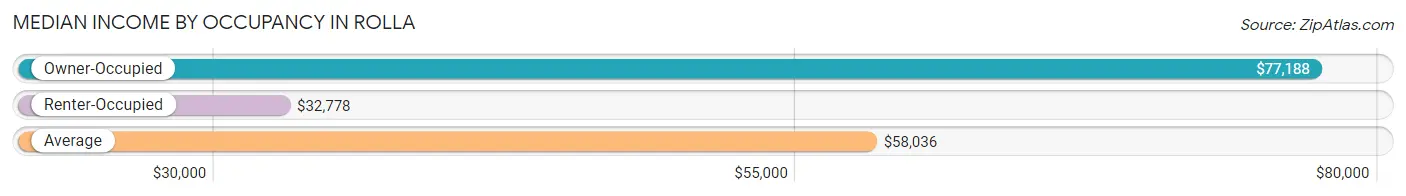
| Occupancy Type | # Households | Median Income |
| Owner-Occupied | 213 (54.8%) | $77,188 |
| Renter-Occupied | 176 (45.2%) | $32,778 |
| Average | 389 (100.0%) | $58,036 |
Occupancy by Householder Income Bracket in Rolla
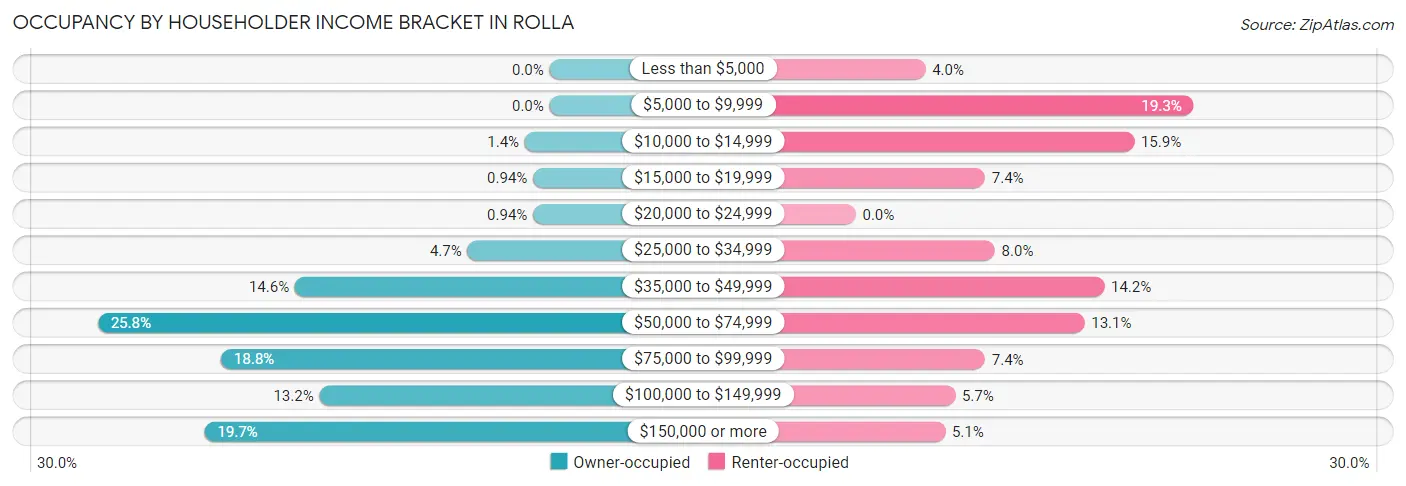
| Income Bracket | Owner-occupied | Renter-occupied |
| Less than $5,000 | 0 (0.0%) | 7 (4.0%) |
| $5,000 to $9,999 | 0 (0.0%) | 34 (19.3%) |
| $10,000 to $14,999 | 3 (1.4%) | 28 (15.9%) |
| $15,000 to $19,999 | 2 (0.9%) | 13 (7.4%) |
| $20,000 to $24,999 | 2 (0.9%) | 0 (0.0%) |
| $25,000 to $34,999 | 10 (4.7%) | 14 (8.0%) |
| $35,000 to $49,999 | 31 (14.5%) | 25 (14.2%) |
| $50,000 to $74,999 | 55 (25.8%) | 23 (13.1%) |
| $75,000 to $99,999 | 40 (18.8%) | 13 (7.4%) |
| $100,000 to $149,999 | 28 (13.2%) | 10 (5.7%) |
| $150,000 or more | 42 (19.7%) | 9 (5.1%) |
| Total | 213 (100.0%) | 176 (100.0%) |
Monthly Housing Cost Tiers in Rolla
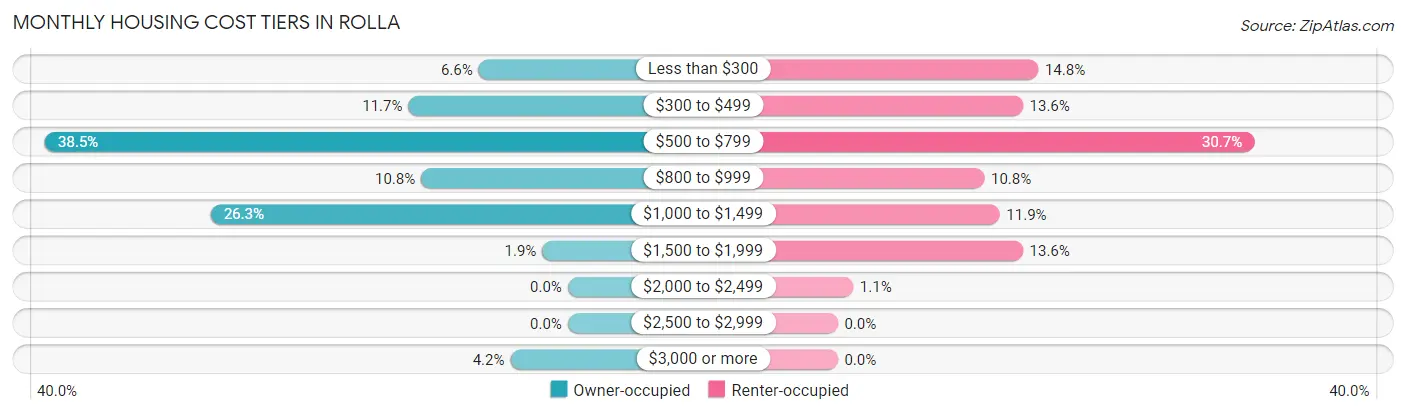
| Monthly Cost | Owner-occupied | Renter-occupied |
| Less than $300 | 14 (6.6%) | 26 (14.8%) |
| $300 to $499 | 25 (11.7%) | 24 (13.6%) |
| $500 to $799 | 82 (38.5%) | 54 (30.7%) |
| $800 to $999 | 23 (10.8%) | 19 (10.8%) |
| $1,000 to $1,499 | 56 (26.3%) | 21 (11.9%) |
| $1,500 to $1,999 | 4 (1.9%) | 24 (13.6%) |
| $2,000 to $2,499 | 0 (0.0%) | 2 (1.1%) |
| $2,500 to $2,999 | 0 (0.0%) | 0 (0.0%) |
| $3,000 or more | 9 (4.2%) | 0 (0.0%) |
| Total | 213 (100.0%) | 176 (100.0%) |
Physical Housing Characteristics in Rolla
Housing Structures in Rolla
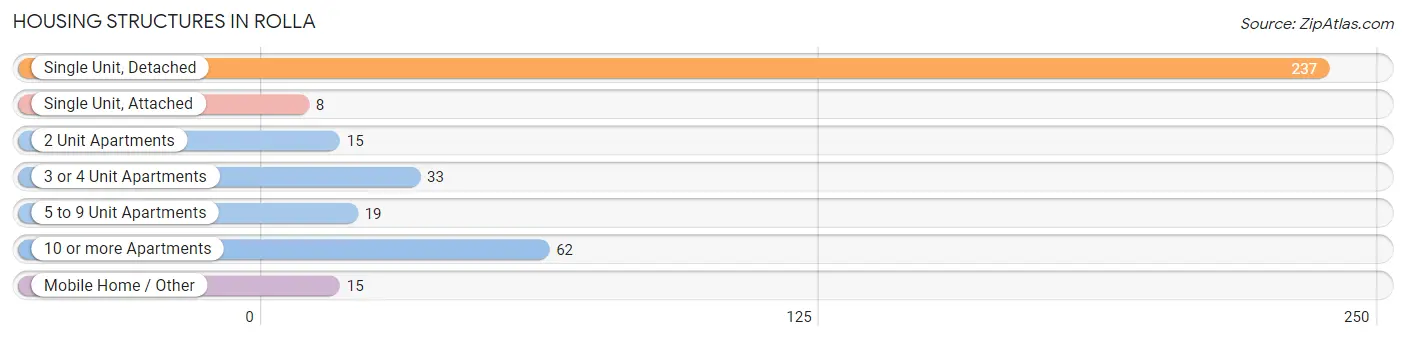
| Structure Type | # Housing Units | % Housing Units |
| Single Unit, Detached | 237 | 60.9% |
| Single Unit, Attached | 8 | 2.1% |
| 2 Unit Apartments | 15 | 3.9% |
| 3 or 4 Unit Apartments | 33 | 8.5% |
| 5 to 9 Unit Apartments | 19 | 4.9% |
| 10 or more Apartments | 62 | 15.9% |
| Mobile Home / Other | 15 | 3.9% |
| Total | 389 | 100.0% |
Housing Structures by Occupancy in Rolla
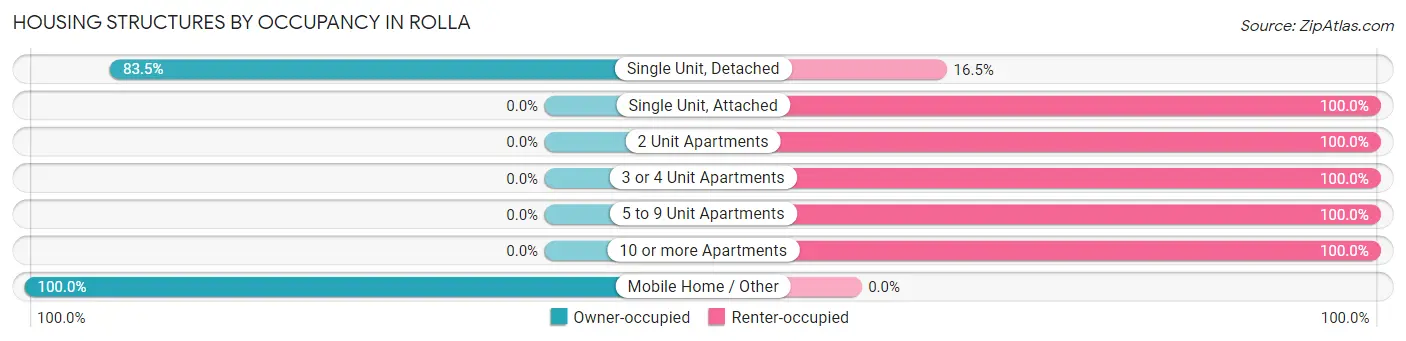
| Structure Type | Owner-occupied | Renter-occupied |
| Single Unit, Detached | 198 (83.5%) | 39 (16.5%) |
| Single Unit, Attached | 0 (0.0%) | 8 (100.0%) |
| 2 Unit Apartments | 0 (0.0%) | 15 (100.0%) |
| 3 or 4 Unit Apartments | 0 (0.0%) | 33 (100.0%) |
| 5 to 9 Unit Apartments | 0 (0.0%) | 19 (100.0%) |
| 10 or more Apartments | 0 (0.0%) | 62 (100.0%) |
| Mobile Home / Other | 15 (100.0%) | 0 (0.0%) |
| Total | 213 (54.8%) | 176 (45.2%) |
Housing Structures by Number of Rooms in Rolla
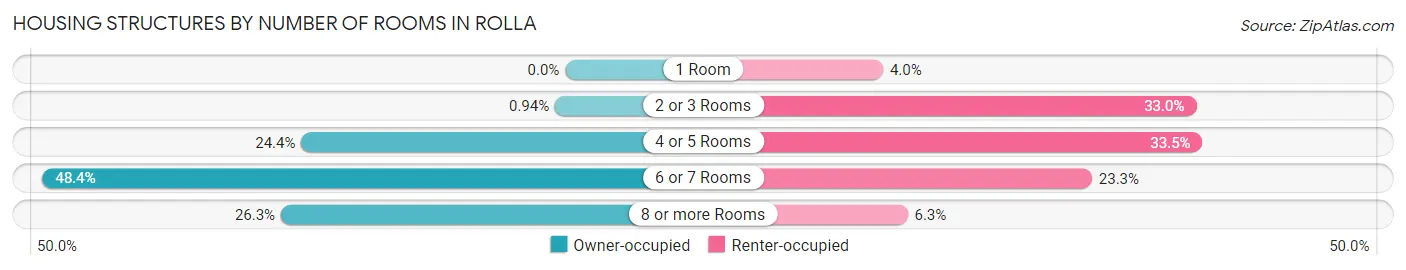
| Number of Rooms | Owner-occupied | Renter-occupied |
| 1 Room | 0 (0.0%) | 7 (4.0%) |
| 2 or 3 Rooms | 2 (0.9%) | 58 (33.0%) |
| 4 or 5 Rooms | 52 (24.4%) | 59 (33.5%) |
| 6 or 7 Rooms | 103 (48.4%) | 41 (23.3%) |
| 8 or more Rooms | 56 (26.3%) | 11 (6.2%) |
| Total | 213 (100.0%) | 176 (100.0%) |
Housing Structure by Heating Type in Rolla
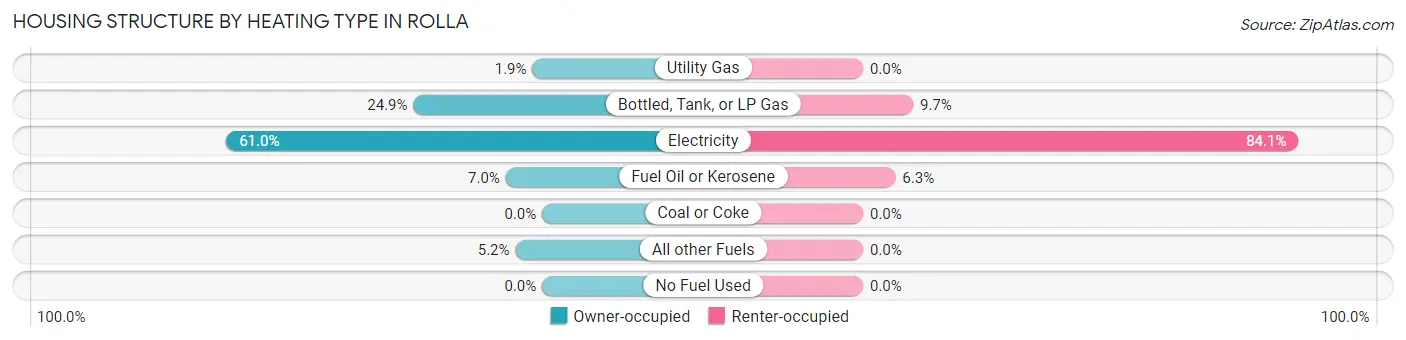
| Heating Type | Owner-occupied | Renter-occupied |
| Utility Gas | 4 (1.9%) | 0 (0.0%) |
| Bottled, Tank, or LP Gas | 53 (24.9%) | 17 (9.7%) |
| Electricity | 130 (61.0%) | 148 (84.1%) |
| Fuel Oil or Kerosene | 15 (7.0%) | 11 (6.2%) |
| Coal or Coke | 0 (0.0%) | 0 (0.0%) |
| All other Fuels | 11 (5.2%) | 0 (0.0%) |
| No Fuel Used | 0 (0.0%) | 0 (0.0%) |
| Total | 213 (100.0%) | 176 (100.0%) |
Household Vehicle Usage in Rolla
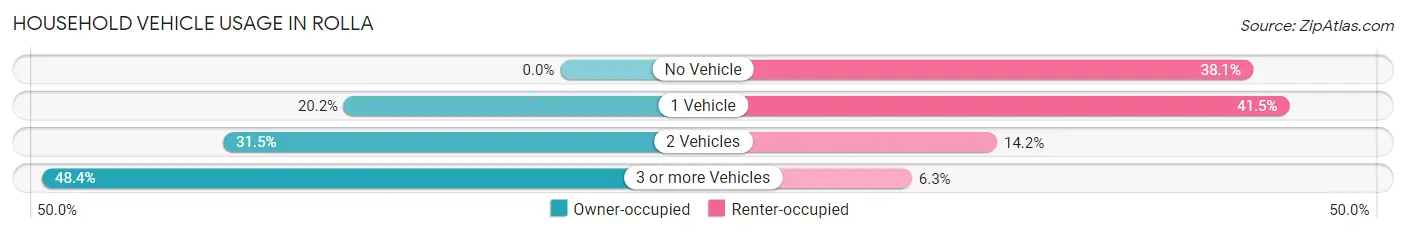
| Vehicles per Household | Owner-occupied | Renter-occupied |
| No Vehicle | 0 (0.0%) | 67 (38.1%) |
| 1 Vehicle | 43 (20.2%) | 73 (41.5%) |
| 2 Vehicles | 67 (31.5%) | 25 (14.2%) |
| 3 or more Vehicles | 103 (48.4%) | 11 (6.2%) |
| Total | 213 (100.0%) | 176 (100.0%) |
Real Estate & Mortgages in Rolla
Real Estate and Mortgage Overview in Rolla
| Characteristic | Without Mortgage | With Mortgage |
| Housing Units | 137 | 76 |
| Median Property Value | $129,200 | $85,300 |
| Median Household Income | $67,639 | $20 |
| Monthly Housing Costs | $557 | $9 |
| Real Estate Taxes | $1,628 | $0 |
Property Value by Mortgage Status in Rolla
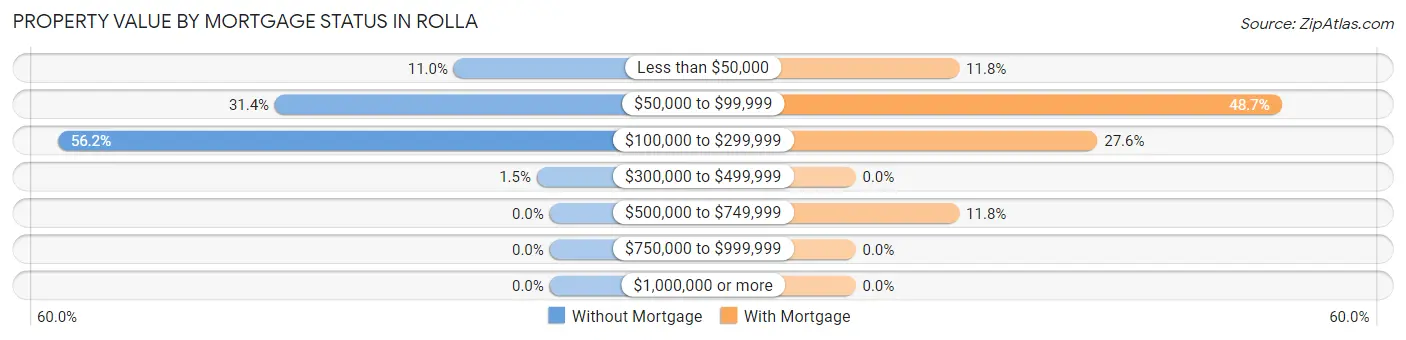
| Property Value | Without Mortgage | With Mortgage |
| Less than $50,000 | 15 (11.0%) | 9 (11.8%) |
| $50,000 to $99,999 | 43 (31.4%) | 37 (48.7%) |
| $100,000 to $299,999 | 77 (56.2%) | 21 (27.6%) |
| $300,000 to $499,999 | 2 (1.5%) | 0 (0.0%) |
| $500,000 to $749,999 | 0 (0.0%) | 9 (11.8%) |
| $750,000 to $999,999 | 0 (0.0%) | 0 (0.0%) |
| $1,000,000 or more | 0 (0.0%) | 0 (0.0%) |
| Total | 137 (100.0%) | 76 (100.0%) |
Household Income by Mortgage Status in Rolla
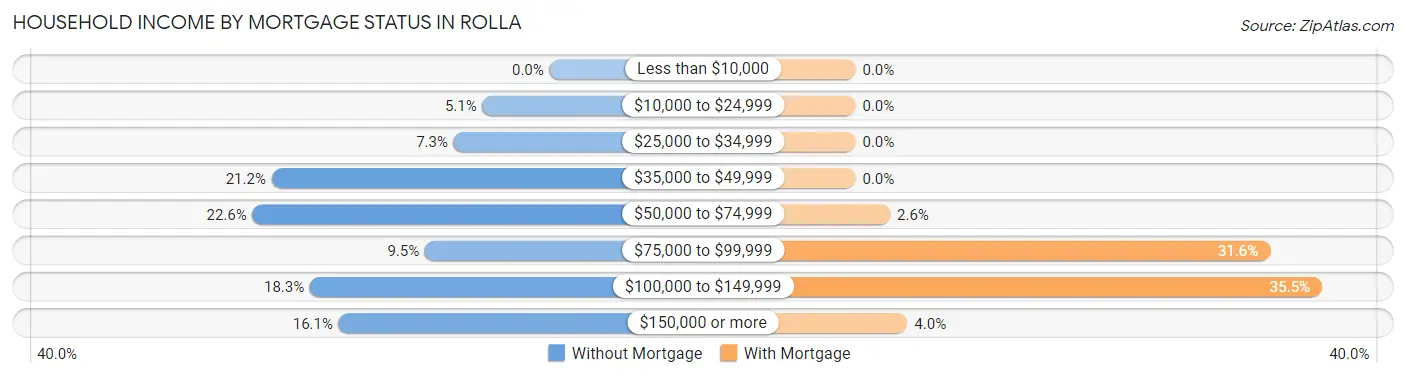
| Household Income | Without Mortgage | With Mortgage |
| Less than $10,000 | 0 (0.0%) | 0 (0.0%) |
| $10,000 to $24,999 | 7 (5.1%) | 0 (0.0%) |
| $25,000 to $34,999 | 10 (7.3%) | 0 (0.0%) |
| $35,000 to $49,999 | 29 (21.2%) | 0 (0.0%) |
| $50,000 to $74,999 | 31 (22.6%) | 2 (2.6%) |
| $75,000 to $99,999 | 13 (9.5%) | 24 (31.6%) |
| $100,000 to $149,999 | 25 (18.2%) | 27 (35.5%) |
| $150,000 or more | 22 (16.1%) | 3 (4.0%) |
| Total | 137 (100.0%) | 76 (100.0%) |
Property Value to Household Income Ratio in Rolla
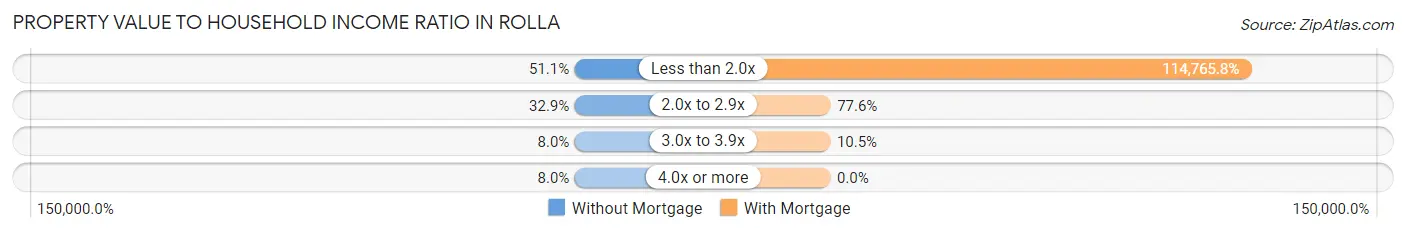
| Value-to-Income Ratio | Without Mortgage | With Mortgage |
| Less than 2.0x | 70 (51.1%) | 87,222 (114,765.8%) |
| 2.0x to 2.9x | 45 (32.9%) | 59 (77.6%) |
| 3.0x to 3.9x | 11 (8.0%) | 8 (10.5%) |
| 4.0x or more | 11 (8.0%) | 0 (0.0%) |
| Total | 137 (100.0%) | 76 (100.0%) |
Real Estate Taxes by Mortgage Status in Rolla
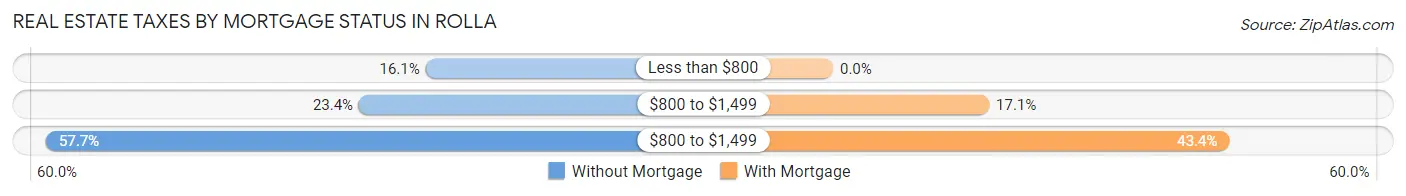
| Property Taxes | Without Mortgage | With Mortgage |
| Less than $800 | 22 (16.1%) | 0 (0.0%) |
| $800 to $1,499 | 32 (23.4%) | 13 (17.1%) |
| $800 to $1,499 | 79 (57.7%) | 33 (43.4%) |
| Total | 137 (100.0%) | 76 (100.0%) |
Health & Disability in Rolla
Health Insurance Coverage by Age in Rolla
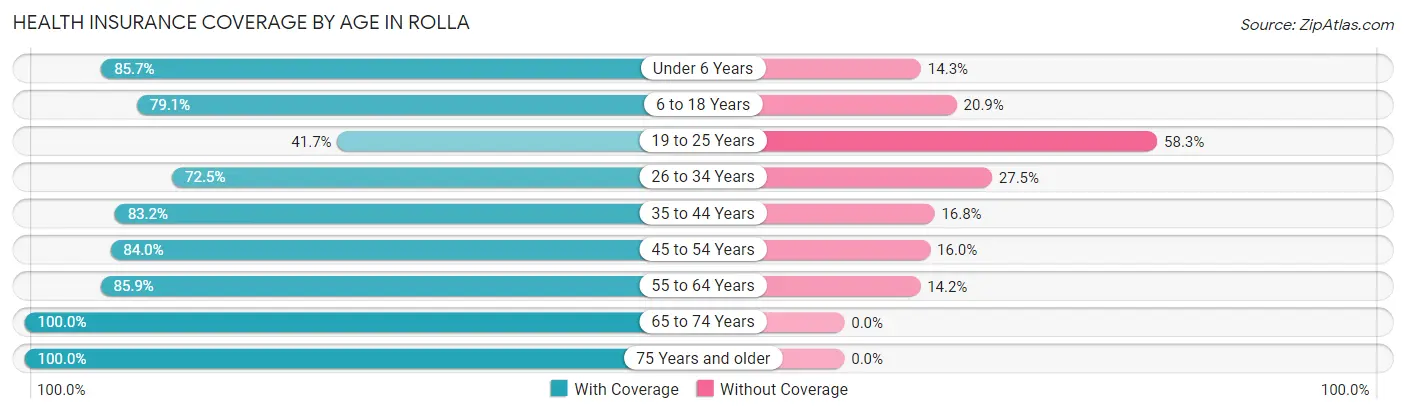
| Age Bracket | With Coverage | Without Coverage |
| Under 6 Years | 114 (85.7%) | 19 (14.3%) |
| 6 to 18 Years | 253 (79.1%) | 67 (20.9%) |
| 19 to 25 Years | 20 (41.7%) | 28 (58.3%) |
| 26 to 34 Years | 79 (72.5%) | 30 (27.5%) |
| 35 to 44 Years | 99 (83.2%) | 20 (16.8%) |
| 45 to 54 Years | 84 (84.0%) | 16 (16.0%) |
| 55 to 64 Years | 91 (85.9%) | 15 (14.1%) |
| 65 to 74 Years | 113 (100.0%) | 0 (0.0%) |
| 75 Years and older | 105 (100.0%) | 0 (0.0%) |
| Total | 958 (83.1%) | 195 (16.9%) |
Health Insurance Coverage by Citizenship Status in Rolla
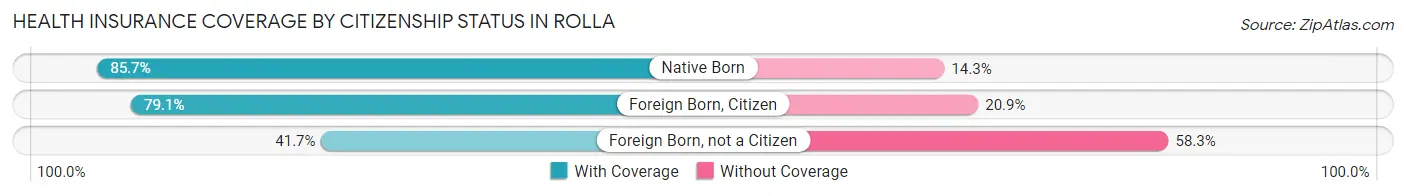
| Citizenship Status | With Coverage | Without Coverage |
| Native Born | 114 (85.7%) | 19 (14.3%) |
| Foreign Born, Citizen | 253 (79.1%) | 67 (20.9%) |
| Foreign Born, not a Citizen | 20 (41.7%) | 28 (58.3%) |
Health Insurance Coverage by Household Income in Rolla
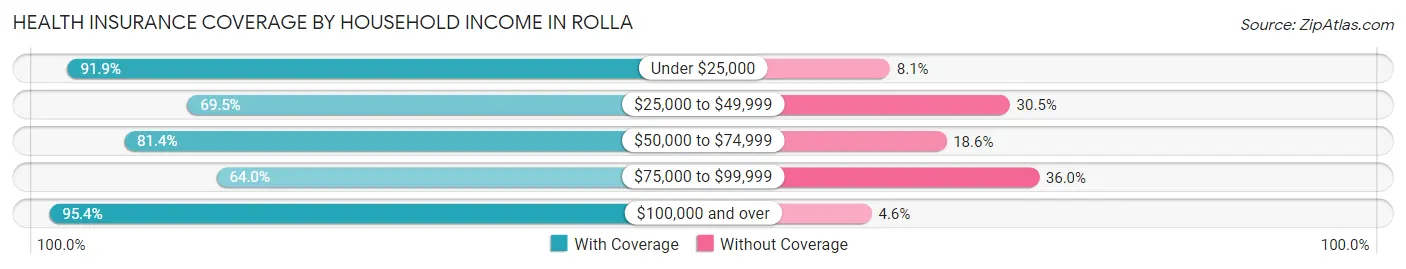
| Household Income | With Coverage | Without Coverage |
| Under $25,000 | 194 (91.9%) | 17 (8.1%) |
| $25,000 to $49,999 | 123 (69.5%) | 54 (30.5%) |
| $50,000 to $74,999 | 166 (81.4%) | 38 (18.6%) |
| $75,000 to $99,999 | 121 (64.0%) | 68 (36.0%) |
| $100,000 and over | 350 (95.4%) | 17 (4.6%) |
Public vs Private Health Insurance Coverage by Age in Rolla
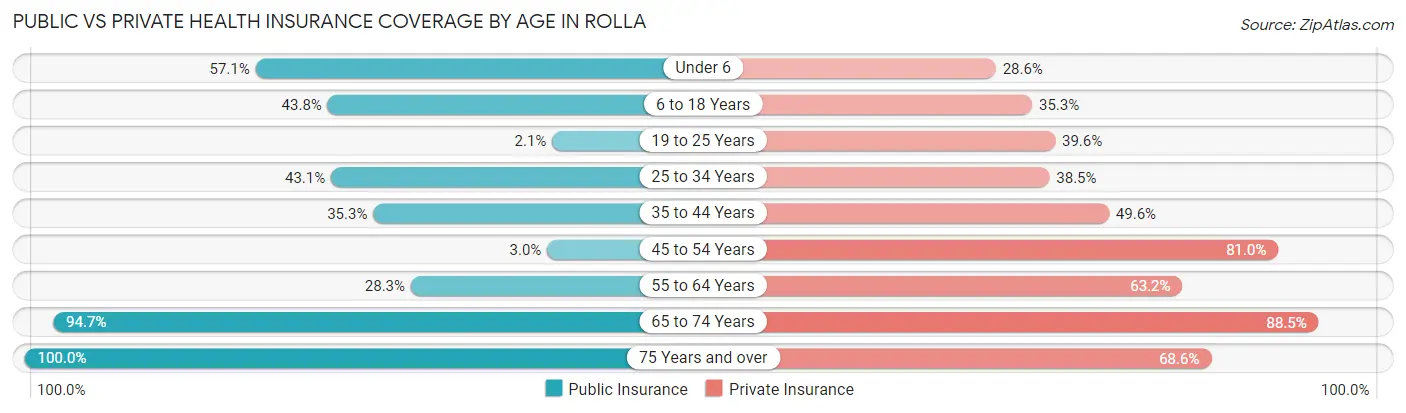
| Age Bracket | Public Insurance | Private Insurance |
| Under 6 | 76 (57.1%) | 38 (28.6%) |
| 6 to 18 Years | 140 (43.8%) | 113 (35.3%) |
| 19 to 25 Years | 1 (2.1%) | 19 (39.6%) |
| 25 to 34 Years | 47 (43.1%) | 42 (38.5%) |
| 35 to 44 Years | 42 (35.3%) | 59 (49.6%) |
| 45 to 54 Years | 3 (3.0%) | 81 (81.0%) |
| 55 to 64 Years | 30 (28.3%) | 67 (63.2%) |
| 65 to 74 Years | 107 (94.7%) | 100 (88.5%) |
| 75 Years and over | 105 (100.0%) | 72 (68.6%) |
| Total | 551 (47.8%) | 591 (51.3%) |
Disability Status by Sex by Age in Rolla
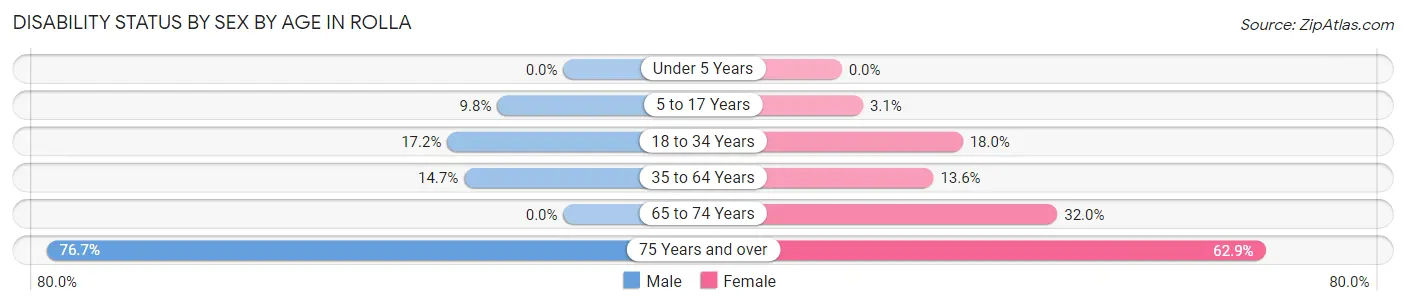
| Age Bracket | Male | Female |
| Under 5 Years | 0 (0.0%) | 0 (0.0%) |
| 5 to 17 Years | 16 (9.8%) | 5 (3.1%) |
| 18 to 34 Years | 15 (17.2%) | 14 (17.9%) |
| 35 to 64 Years | 23 (14.7%) | 23 (13.6%) |
| 65 to 74 Years | 0 (0.0%) | 16 (32.0%) |
| 75 Years and over | 33 (76.7%) | 39 (62.9%) |
Disability Class by Sex by Age in Rolla
Disability Class: Hearing Difficulty
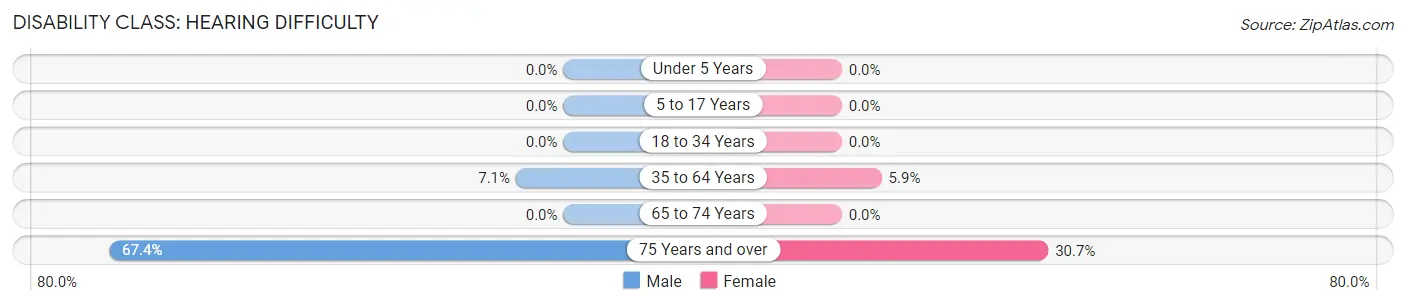
| Age Bracket | Male | Female |
| Under 5 Years | 0 (0.0%) | 0 (0.0%) |
| 5 to 17 Years | 0 (0.0%) | 0 (0.0%) |
| 18 to 34 Years | 0 (0.0%) | 0 (0.0%) |
| 35 to 64 Years | 11 (7.0%) | 10 (5.9%) |
| 65 to 74 Years | 0 (0.0%) | 0 (0.0%) |
| 75 Years and over | 29 (67.4%) | 19 (30.6%) |
Disability Class: Vision Difficulty
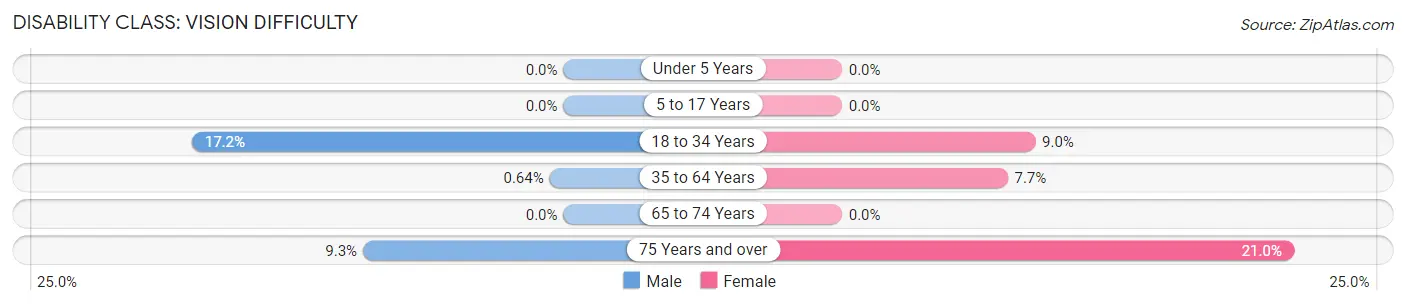
| Age Bracket | Male | Female |
| Under 5 Years | 0 (0.0%) | 0 (0.0%) |
| 5 to 17 Years | 0 (0.0%) | 0 (0.0%) |
| 18 to 34 Years | 15 (17.2%) | 7 (9.0%) |
| 35 to 64 Years | 1 (0.6%) | 13 (7.7%) |
| 65 to 74 Years | 0 (0.0%) | 0 (0.0%) |
| 75 Years and over | 4 (9.3%) | 13 (21.0%) |
Disability Class: Cognitive Difficulty
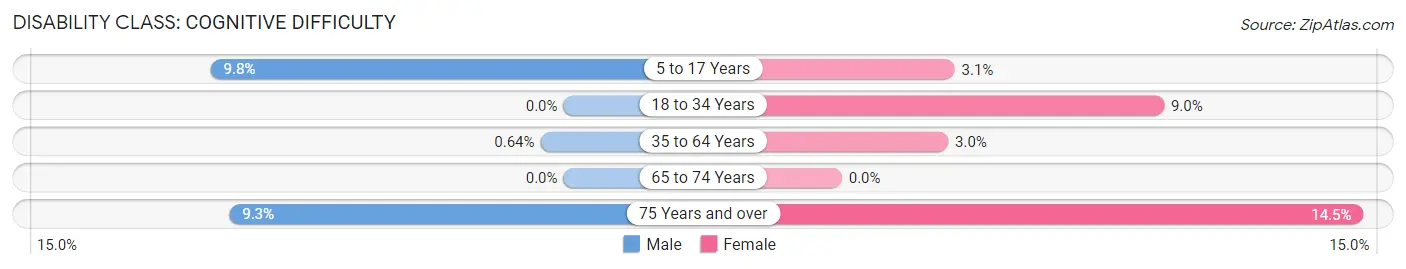
| Age Bracket | Male | Female |
| 5 to 17 Years | 16 (9.8%) | 5 (3.1%) |
| 18 to 34 Years | 0 (0.0%) | 7 (9.0%) |
| 35 to 64 Years | 1 (0.6%) | 5 (3.0%) |
| 65 to 74 Years | 0 (0.0%) | 0 (0.0%) |
| 75 Years and over | 4 (9.3%) | 9 (14.5%) |
Disability Class: Ambulatory Difficulty
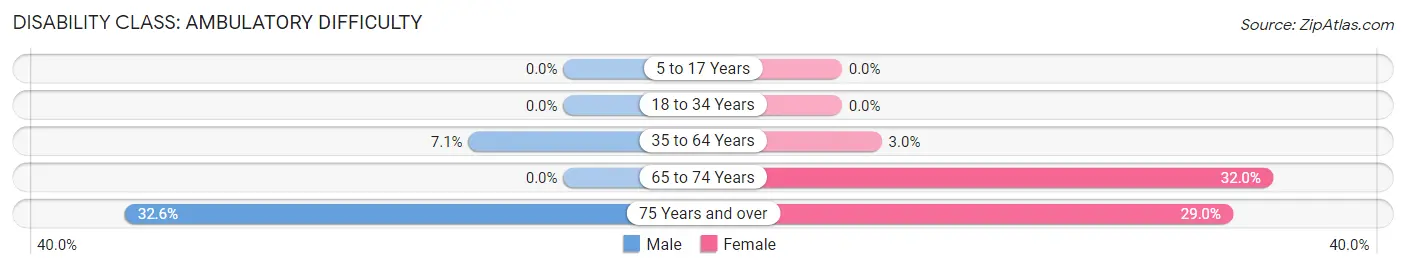
| Age Bracket | Male | Female |
| 5 to 17 Years | 0 (0.0%) | 0 (0.0%) |
| 18 to 34 Years | 0 (0.0%) | 0 (0.0%) |
| 35 to 64 Years | 11 (7.0%) | 5 (3.0%) |
| 65 to 74 Years | 0 (0.0%) | 16 (32.0%) |
| 75 Years and over | 14 (32.6%) | 18 (29.0%) |
Disability Class: Self-Care Difficulty
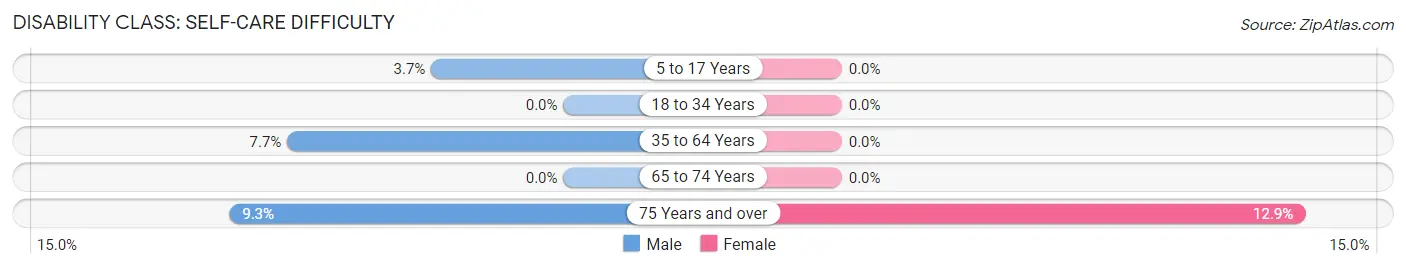
| Age Bracket | Male | Female |
| 5 to 17 Years | 6 (3.7%) | 0 (0.0%) |
| 18 to 34 Years | 0 (0.0%) | 0 (0.0%) |
| 35 to 64 Years | 12 (7.7%) | 0 (0.0%) |
| 65 to 74 Years | 0 (0.0%) | 0 (0.0%) |
| 75 Years and over | 4 (9.3%) | 8 (12.9%) |
Technology Access in Rolla
Computing Device Access in Rolla
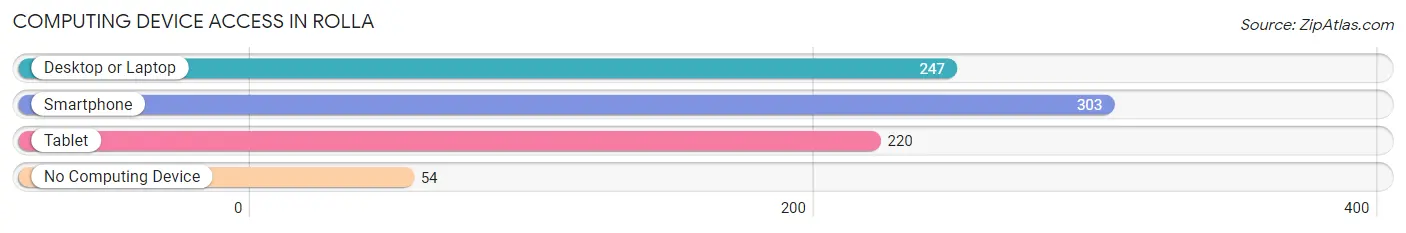
| Device Type | # Households | % Households |
| Desktop or Laptop | 247 | 63.5% |
| Smartphone | 303 | 77.9% |
| Tablet | 220 | 56.6% |
| No Computing Device | 54 | 13.9% |
| Total | 389 | 100.0% |
Internet Access in Rolla
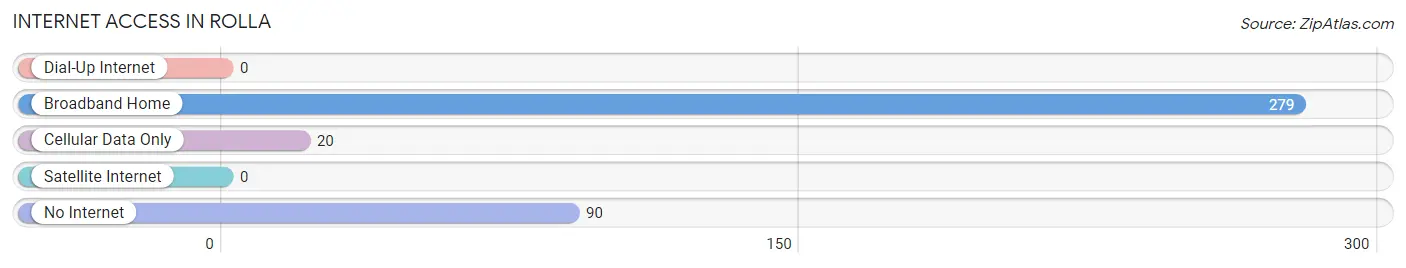
| Internet Type | # Households | % Households |
| Dial-Up Internet | 0 | 0.0% |
| Broadband Home | 279 | 71.7% |
| Cellular Data Only | 20 | 5.1% |
| Satellite Internet | 0 | 0.0% |
| No Internet | 90 | 23.1% |
| Total | 389 | 100.0% |
Rolla Summary
Rolla, North Dakota is a small city located in Rolette County in the northeastern part of the state. It is situated on the banks of the Mouse River, which flows through the city and is a major source of water for the area. The city has a population of 1,717 people as of the 2020 census, making it the second-largest city in Rolette County.
Rolla was founded in 1882 by the Northern Pacific Railroad, which was looking to expand its rail line into the area. The city was named after Rolla, Missouri, which was the hometown of the railroad's president. The city quickly grew and by the early 1900s, it had become a major hub for the railroad. The city also became a center for agriculture, with many farmers settling in the area to take advantage of the fertile soil and abundant water supply.
Geographically, Rolla is located in the Red River Valley, which is a flat, fertile plain that stretches from the Canadian border to the Dakotas. The city is surrounded by rolling hills and prairies, and is located near the Turtle Mountains, which are part of the Missouri Plateau. The climate in Rolla is continental, with cold winters and hot summers.
The economy of Rolla is largely based on agriculture, with the city being home to several large farms and ranches. The city is also home to a number of manufacturing and service businesses, including a lumber mill, a grain elevator, and a number of small businesses. The city is also home to a number of retail stores, restaurants, and other businesses.
Demographically, Rolla is a predominantly white city, with the majority of the population being of German, Norwegian, and Swedish descent. The city also has a small Native American population, with the Turtle Mountain Band of Chippewa Indians having a reservation nearby. The city also has a small Hispanic population, with most of the population being of Mexican descent.
Rolla is a small city with a rich history and a vibrant economy. It is a great place to live, work, and raise a family, and is a great place to visit for those looking to explore the beauty of the Red River Valley.
Common Questions
What is Per Capita Income in Rolla?
Per Capita income in Rolla is $30,377.
What is the Median Family Income in Rolla?
Median Family Income in Rolla is $63,938.
What is the Median Household income in Rolla?
Median Household Income in Rolla is $58,036.
What is Income or Wage Gap in Rolla?
Income or Wage Gap in Rolla is 13.7%.
Women in Rolla earn 86.3 cents for every dollar earned by a man.
What is Inequality or Gini Index in Rolla?
Inequality or Gini Index in Rolla is 0.43.
What is the Total Population of Rolla?
Total Population of Rolla is 1,190.
What is the Total Male Population of Rolla?
Total Male Population of Rolla is 583.
What is the Total Female Population of Rolla?
Total Female Population of Rolla is 607.
What is the Ratio of Males per 100 Females in Rolla?
There are 96.05 Males per 100 Females in Rolla.
What is the Ratio of Females per 100 Males in Rolla?
There are 104.12 Females per 100 Males in Rolla.
What is the Median Population Age in Rolla?
Median Population Age in Rolla is 33.8 Years.
What is the Average Family Size in Rolla
Average Family Size in Rolla is 4.2 People.
What is the Average Household Size in Rolla
Average Household Size in Rolla is 3.0 People.
How Large is the Labor Force in Rolla?
There are 493 People in the Labor Forcein in Rolla.
What is the Percentage of People in the Labor Force in Rolla?
64.3% of People are in the Labor Force in Rolla.
What is the Unemployment Rate in Rolla?
Unemployment Rate in Rolla is 9.3%.