Mountain, ND Map & Demographics
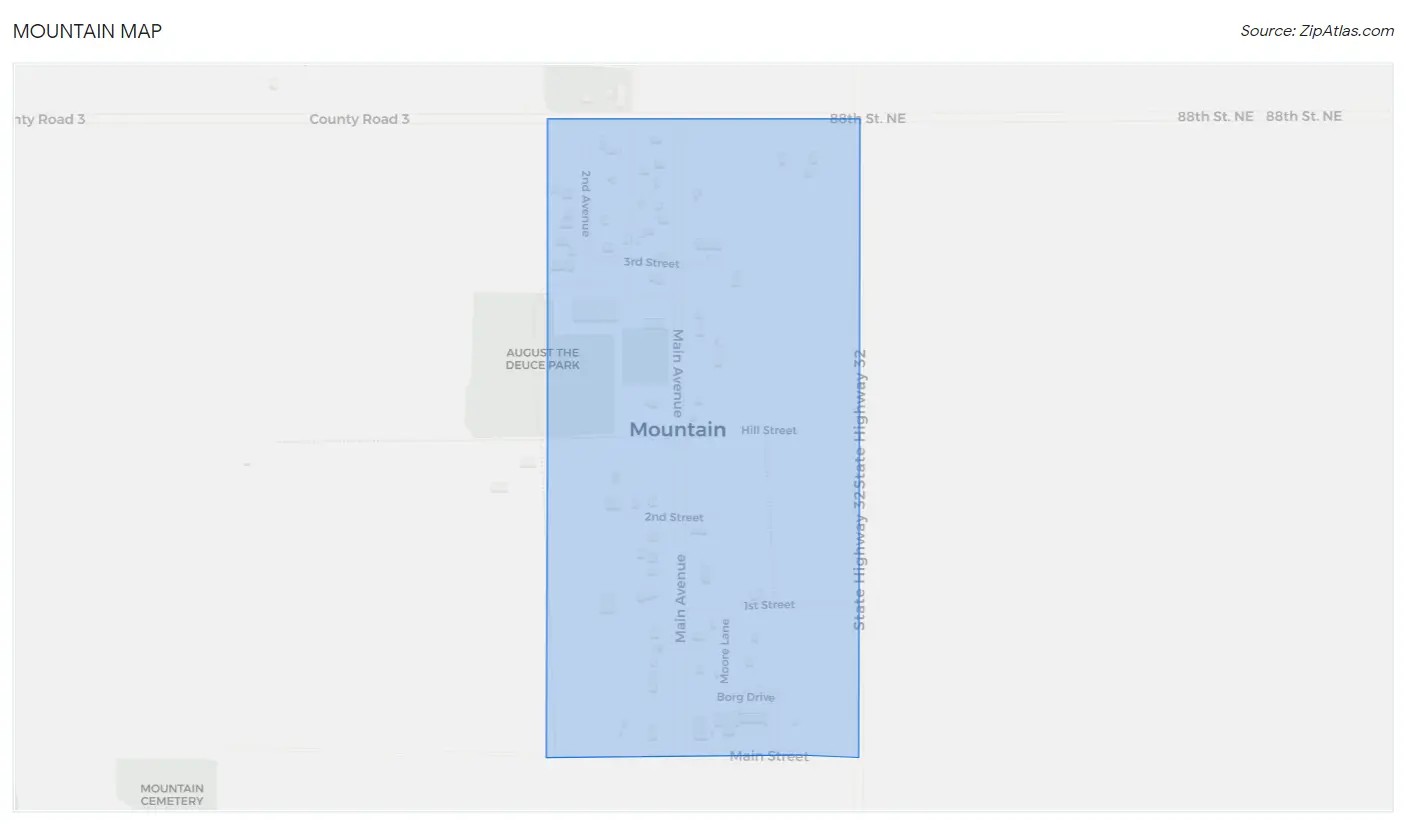
Mountain Map
Mountain Overview
$25,320
PER CAPITA INCOME
$26,250
AVG HOUSEHOLD INCOME
0.67
INEQUALITY / GINI INDEX
97
TOTAL POPULATION
70
MALE POPULATION
27
FEMALE POPULATION
259.26
MALES / 100 FEMALES
38.57
FEMALES / 100 MALES
69.8
MEDIAN AGE
3.1
AVG FAMILY SIZE
2.3
AVG HOUSEHOLD SIZE
10
LABOR FORCE [ PEOPLE ]
10.9%
PERCENT IN LABOR FORCE
20.0%
UNEMPLOYMENT RATE
Mountain Zip Codes
Mountain Area Codes
Income in Mountain
Income Overview in Mountain
| Characteristic | Number | Measure |
| Per Capita Income | 97 | $25,320 |
| Median Family Income | 11 | $0 |
| Mean Family Income | 11 | $151,573 |
| Median Household Income | 18 | $26,250 |
| Mean Household Income | 18 | $98,967 |
| Income Deficit | 11 | $0 |
| Wage / Income Gap (%) | 97 | 0.00% |
| Wage / Income Gap ($) | 97 | 100.00¢ per $1 |
| Gini / Inequality Index | 97 | 0.67 |
Earnings by Sex in Mountain
| Sex | Number | Average Earnings |
| Male | 5 (31.2%) | $0 |
| Female | 11 (68.8%) | $0 |
| Total | 16 (100.0%) | $0 |
Earnings by Sex by Income Bracket in Mountain
The most common earnings brackets in Mountain are $100,000+ for men (3 | 60.0%) and $2,500 to $4,999 for women (6 | 54.5%).
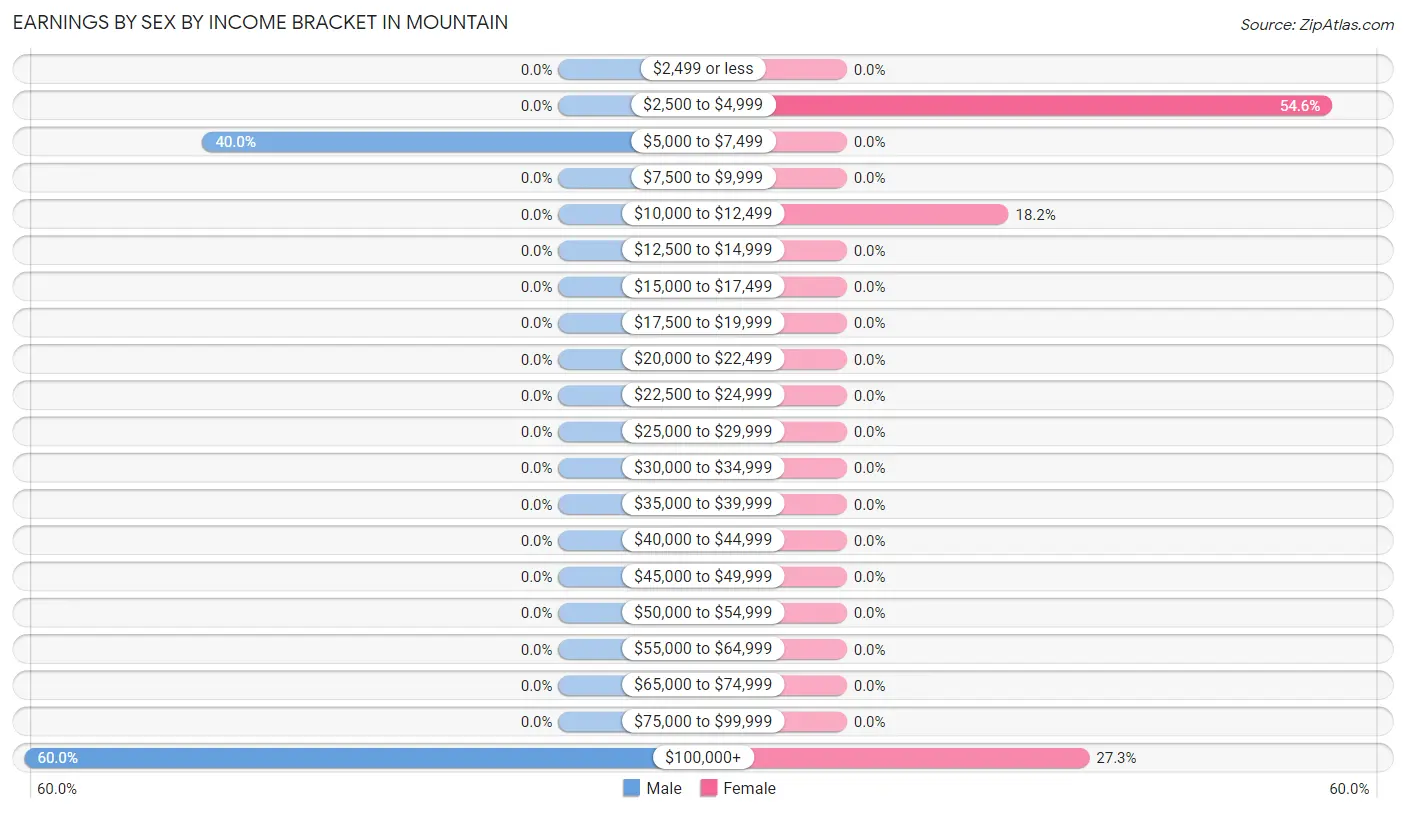
| Income | Male | Female |
| $2,499 or less | 0 (0.0%) | 0 (0.0%) |
| $2,500 to $4,999 | 0 (0.0%) | 6 (54.5%) |
| $5,000 to $7,499 | 2 (40.0%) | 0 (0.0%) |
| $7,500 to $9,999 | 0 (0.0%) | 0 (0.0%) |
| $10,000 to $12,499 | 0 (0.0%) | 2 (18.2%) |
| $12,500 to $14,999 | 0 (0.0%) | 0 (0.0%) |
| $15,000 to $17,499 | 0 (0.0%) | 0 (0.0%) |
| $17,500 to $19,999 | 0 (0.0%) | 0 (0.0%) |
| $20,000 to $22,499 | 0 (0.0%) | 0 (0.0%) |
| $22,500 to $24,999 | 0 (0.0%) | 0 (0.0%) |
| $25,000 to $29,999 | 0 (0.0%) | 0 (0.0%) |
| $30,000 to $34,999 | 0 (0.0%) | 0 (0.0%) |
| $35,000 to $39,999 | 0 (0.0%) | 0 (0.0%) |
| $40,000 to $44,999 | 0 (0.0%) | 0 (0.0%) |
| $45,000 to $49,999 | 0 (0.0%) | 0 (0.0%) |
| $50,000 to $54,999 | 0 (0.0%) | 0 (0.0%) |
| $55,000 to $64,999 | 0 (0.0%) | 0 (0.0%) |
| $65,000 to $74,999 | 0 (0.0%) | 0 (0.0%) |
| $75,000 to $99,999 | 0 (0.0%) | 0 (0.0%) |
| $100,000+ | 3 (60.0%) | 3 (27.3%) |
| Total | 5 (100.0%) | 11 (100.0%) |
Earnings by Sex by Educational Attainment in Mountain
| Educational Attainment | Male Income | Female Income |
| Less than High School | - | - |
| High School Diploma | - | - |
| College or Associate's Degree | - | - |
| Bachelor's Degree | - | - |
| Graduate Degree | - | - |
| Total | - | - |
Family Income in Mountain
Family Income Brackets in Mountain
According to the Mountain family income data, there are 6 families falling into the $25,000 to $34,999 income range, which is the most common income bracket and makes up 54.5% of all families.
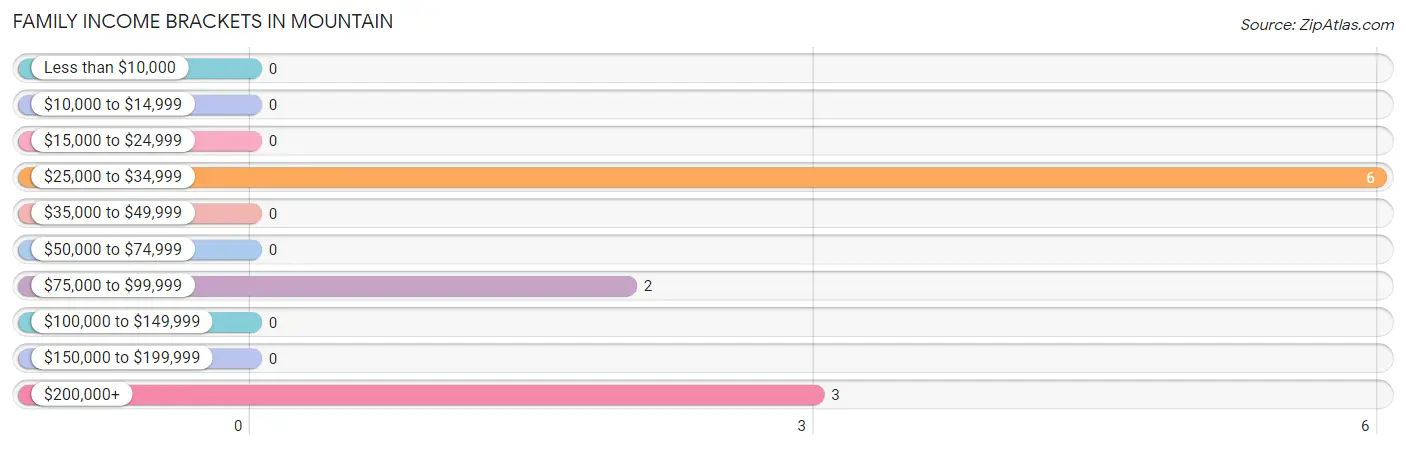
| Income Bracket | # Families | % Families |
| Less than $10,000 | 0 | 0.0% |
| $10,000 to $14,999 | 0 | 0.0% |
| $15,000 to $24,999 | 0 | 0.0% |
| $25,000 to $34,999 | 6 | 54.5% |
| $35,000 to $49,999 | 0 | 0.0% |
| $50,000 to $74,999 | 0 | 0.0% |
| $75,000 to $99,999 | 2 | 18.2% |
| $100,000 to $149,999 | 0 | 0.0% |
| $150,000 to $199,999 | 0 | 0.0% |
| $200,000+ | 3 | 27.3% |
Family Income by Famaliy Size in Mountain
| Income Bracket | # Families | Median Income |
| 2-Person Families | 8 (72.7%) | $0 |
| 3-Person Families | 0 (0.0%) | $0 |
| 4-Person Families | 3 (27.3%) | $0 |
| 5-Person Families | 0 (0.0%) | $0 |
| 6-Person Families | 0 (0.0%) | $0 |
| 7+ Person Families | 0 (0.0%) | $0 |
| Total | 11 (100.0%) | $0 |
Family Income by Number of Earners in Mountain
| Number of Earners | # Families | Median Income |
| No Earners | 0 (0.0%) | $0 |
| 1 Earner | 8 (72.7%) | $0 |
| 2 Earners | 3 (27.3%) | $0 |
| 3+ Earners | 0 (0.0%) | $0 |
| Total | 11 (100.0%) | $0 |
Household Income in Mountain
Household Income Brackets in Mountain
With 6 households falling in the category, the $25,000 to $34,999 income range is the most frequent in Mountain, accounting for 33.3% of all households.
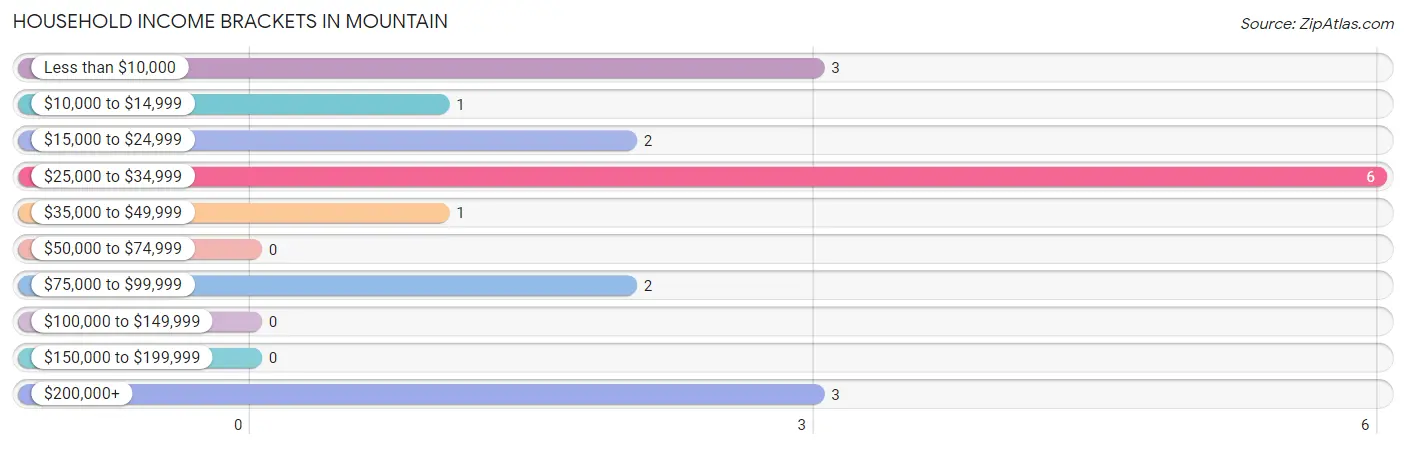
| Income Bracket | # Households | % Households |
| Less than $10,000 | 3 | 16.7% |
| $10,000 to $14,999 | 1 | 5.6% |
| $15,000 to $24,999 | 2 | 11.1% |
| $25,000 to $34,999 | 6 | 33.3% |
| $35,000 to $49,999 | 1 | 5.6% |
| $50,000 to $74,999 | 0 | 0.0% |
| $75,000 to $99,999 | 2 | 11.1% |
| $100,000 to $149,999 | 0 | 0.0% |
| $150,000 to $199,999 | 0 | 0.0% |
| $200,000+ | 3 | 16.7% |
Household Income by Householder Age in Mountain
The median household income in Mountain is $26,250, with the highest median household income of $26,042 found in the 65+ years age bracket for the primary householder. A total of 9 households (50.0%) fall into this category. Meanwhile, the 15 to 24 years age bracket for the primary householder has the lowest median household income of $0, with 2 households (11.1%) in this group.
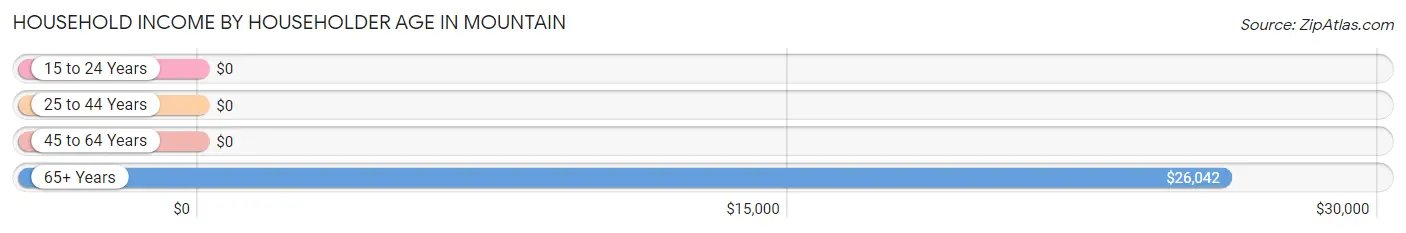
| Income Bracket | # Households | Median Income |
| 15 to 24 Years | 2 (11.1%) | $0 |
| 25 to 44 Years | 3 (16.7%) | $0 |
| 45 to 64 Years | 4 (22.2%) | $0 |
| 65+ Years | 9 (50.0%) | $26,042 |
| Total | 18 (100.0%) | $26,250 |
Poverty in Mountain
Income Below Poverty by Sex and Age in Mountain
With 12.5% poverty level for males and 5.9% for females among the residents of Mountain, 18 to 24 year old males and 55 to 64 year old females are the most vulnerable to poverty, with 2 males (100.0%) and 1 females (33.3%) in their respective age groups living below the poverty level.
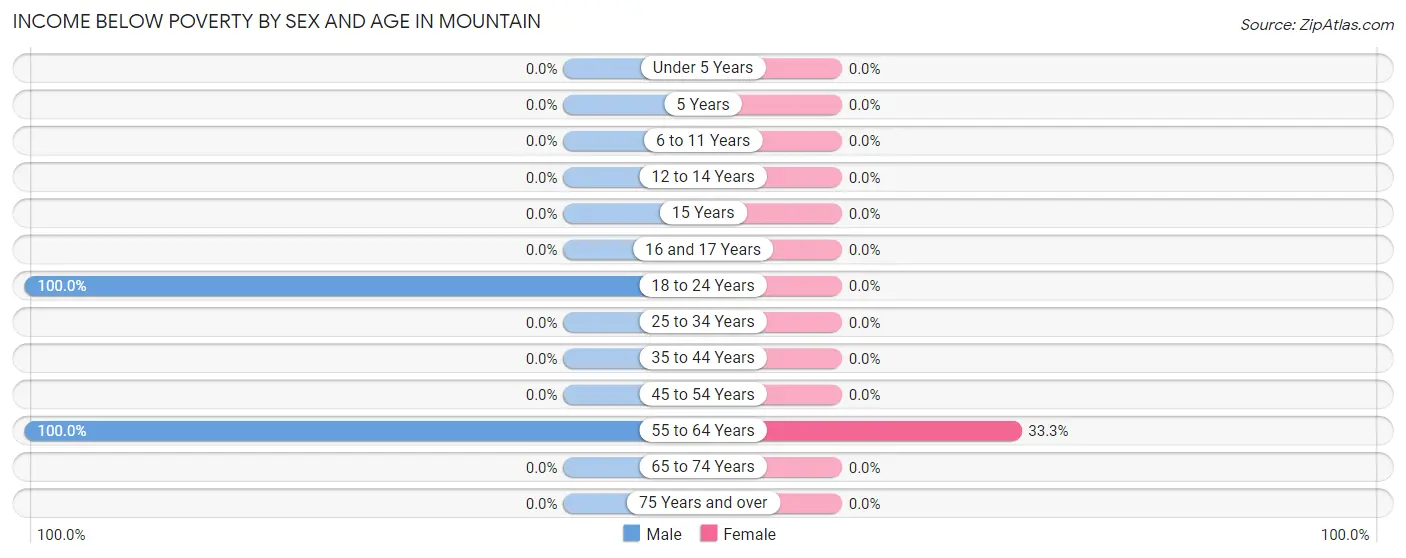
| Age Bracket | Male | Female |
| Under 5 Years | 0 (0.0%) | 0 (0.0%) |
| 5 Years | 0 (0.0%) | 0 (0.0%) |
| 6 to 11 Years | 0 (0.0%) | 0 (0.0%) |
| 12 to 14 Years | 0 (0.0%) | 0 (0.0%) |
| 15 Years | 0 (0.0%) | 0 (0.0%) |
| 16 and 17 Years | 0 (0.0%) | 0 (0.0%) |
| 18 to 24 Years | 2 (100.0%) | 0 (0.0%) |
| 25 to 34 Years | 0 (0.0%) | 0 (0.0%) |
| 35 to 44 Years | 0 (0.0%) | 0 (0.0%) |
| 45 to 54 Years | 0 (0.0%) | 0 (0.0%) |
| 55 to 64 Years | 1 (100.0%) | 1 (33.3%) |
| 65 to 74 Years | 0 (0.0%) | 0 (0.0%) |
| 75 Years and over | 0 (0.0%) | 0 (0.0%) |
| Total | 3 (12.5%) | 1 (5.9%) |
Income Above Poverty by Sex and Age in Mountain
According to the poverty statistics in Mountain, males aged 6 to 11 years and females aged 12 to 14 years are the age groups that are most secure financially, with 100.0% of males and 100.0% of females in these age groups living above the poverty line.
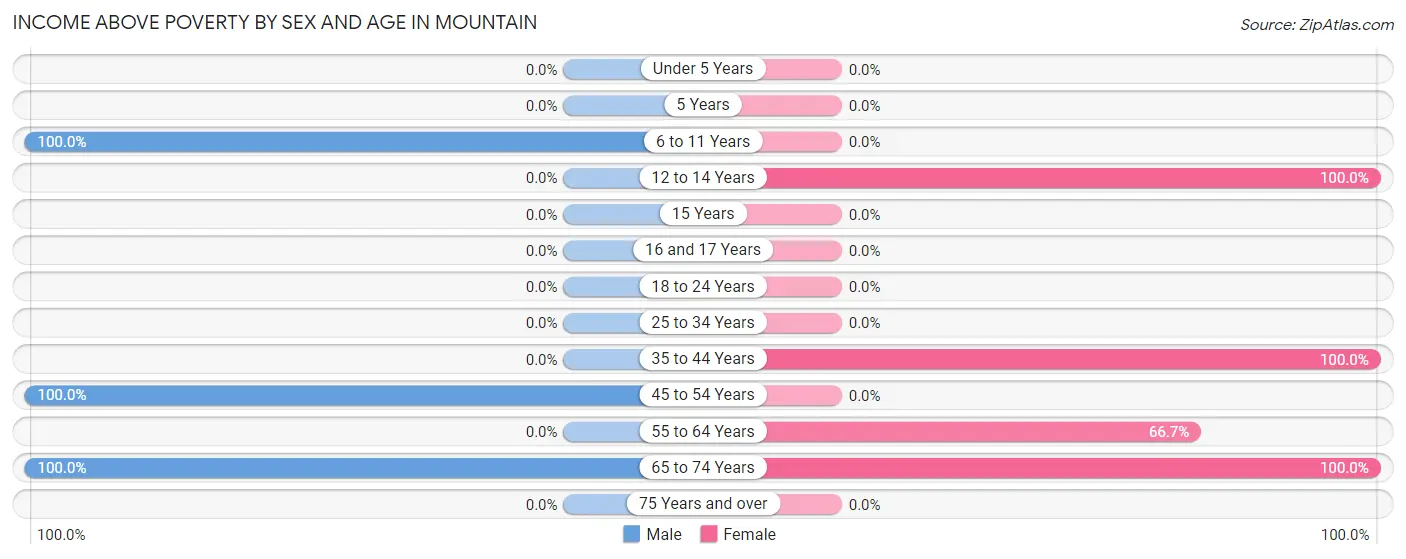
| Age Bracket | Male | Female |
| Under 5 Years | 0 (0.0%) | 0 (0.0%) |
| 5 Years | 0 (0.0%) | 0 (0.0%) |
| 6 to 11 Years | 2 (100.0%) | 0 (0.0%) |
| 12 to 14 Years | 0 (0.0%) | 3 (100.0%) |
| 15 Years | 0 (0.0%) | 0 (0.0%) |
| 16 and 17 Years | 0 (0.0%) | 0 (0.0%) |
| 18 to 24 Years | 0 (0.0%) | 0 (0.0%) |
| 25 to 34 Years | 0 (0.0%) | 0 (0.0%) |
| 35 to 44 Years | 0 (0.0%) | 3 (100.0%) |
| 45 to 54 Years | 3 (100.0%) | 0 (0.0%) |
| 55 to 64 Years | 0 (0.0%) | 2 (66.7%) |
| 65 to 74 Years | 16 (100.0%) | 8 (100.0%) |
| 75 Years and over | 0 (0.0%) | 0 (0.0%) |
| Total | 21 (87.5%) | 16 (94.1%) |
Income Below Poverty Among Married-Couple Families in Mountain
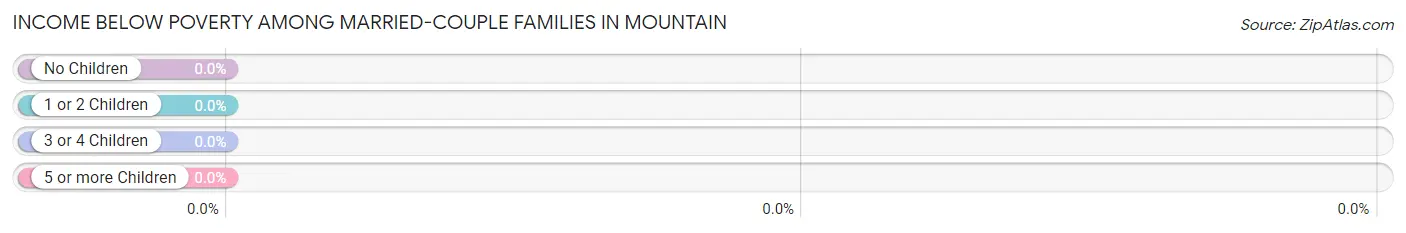
| Children | Above Poverty | Below Poverty |
| No Children | 8 (100.0%) | 0 (0.0%) |
| 1 or 2 Children | 3 (100.0%) | 0 (0.0%) |
| 3 or 4 Children | 0 (0.0%) | 0 (0.0%) |
| 5 or more Children | 0 (0.0%) | 0 (0.0%) |
| Total | 11 (100.0%) | 0 (0.0%) |
Income Below Poverty Among Single-Parent Households in Mountain
| Children | Single Father | Single Mother |
| No Children | 0 (0.0%) | 0 (0.0%) |
| 1 or 2 Children | 0 (0.0%) | 0 (0.0%) |
| 3 or 4 Children | 0 (0.0%) | 0 (0.0%) |
| 5 or more Children | 0 (0.0%) | 0 (0.0%) |
| Total | 0 (0.0%) | 0 (0.0%) |
Income Below Poverty Among Married-Couple vs Single-Parent Households in Mountain
| Children | Married-Couple Families | Single-Parent Households |
| No Children | 0 (0.0%) | 0 (0.0%) |
| 1 or 2 Children | 0 (0.0%) | 0 (0.0%) |
| 3 or 4 Children | 0 (0.0%) | 0 (0.0%) |
| 5 or more Children | 0 (0.0%) | 0 (0.0%) |
| Total | 0 (0.0%) | 0 (0.0%) |
Race in Mountain
The most populous races in Mountain are White / Caucasian (80 | 82.5%), Hispanic or Latino (12 | 12.4%), and Two or more Races (12 | 12.4%).
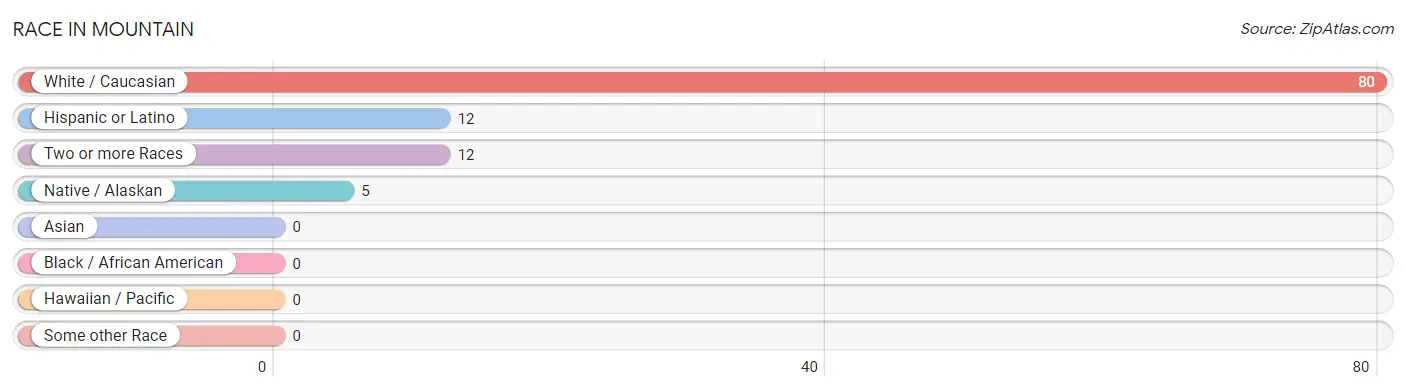
| Race | # Population | % Population |
| Asian | 0 | 0.0% |
| Black / African American | 0 | 0.0% |
| Hawaiian / Pacific | 0 | 0.0% |
| Hispanic or Latino | 12 | 12.4% |
| Native / Alaskan | 5 | 5.1% |
| White / Caucasian | 80 | 82.5% |
| Two or more Races | 12 | 12.4% |
| Some other Race | 0 | 0.0% |
| Total | 97 | 100.0% |
Ancestry in Mountain
The most populous ancestries reported in Mountain are Mexican (12 | 12.4%), Irish (6 | 6.2%), Scandinavian (6 | 6.2%), Icelander (4 | 4.1%), and Chippewa (3 | 3.1%), together accounting for 32.0% of all Mountain residents.
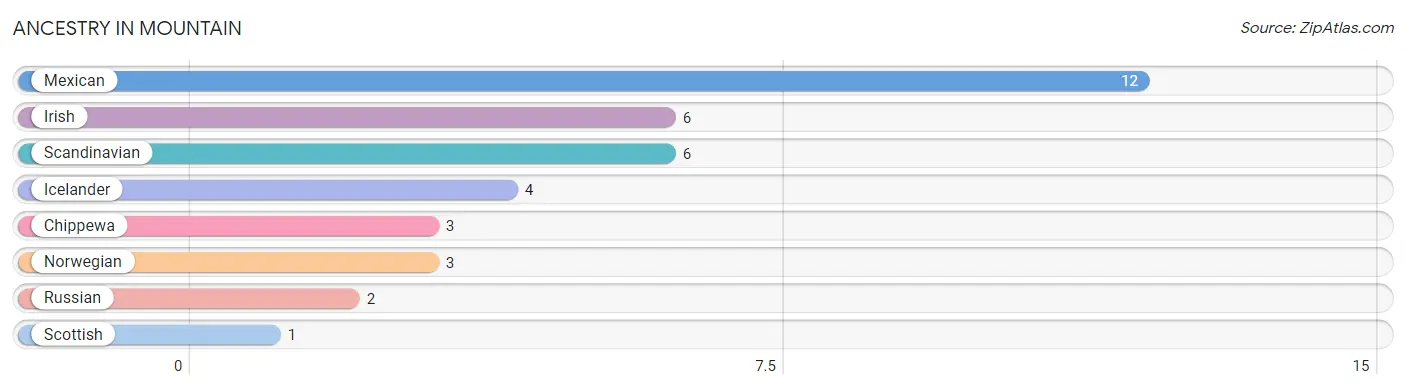
| Ancestry | # Population | % Population |
| Chippewa | 3 | 3.1% |
| Icelander | 4 | 4.1% |
| Irish | 6 | 6.2% |
| Mexican | 12 | 12.4% |
| Norwegian | 3 | 3.1% |
| Russian | 2 | 2.1% |
| Scandinavian | 6 | 6.2% |
| Scottish | 1 | 1.0% | View All 8 Rows |
Immigrants in Mountain
The most numerous immigrant groups reported in Mountain came from Canada (2 | 2.1%), Eastern Europe (2 | 2.1%), Europe (2 | 2.1%), and Russia (2 | 2.1%), together accounting for 8.2% of all Mountain residents.
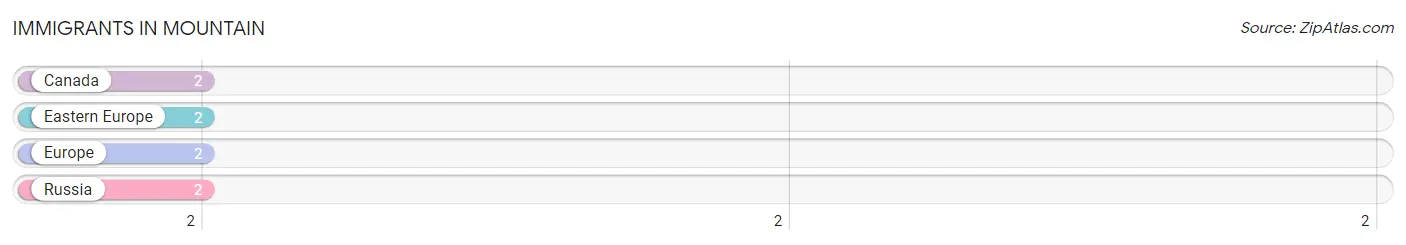
| Immigration Origin | # Population | % Population |
| Canada | 2 | 2.1% |
| Eastern Europe | 2 | 2.1% |
| Europe | 2 | 2.1% |
| Russia | 2 | 2.1% | View All 4 Rows |
Sex and Age in Mountain
Sex and Age in Mountain
The most populous age groups in Mountain are 70 to 74 Years (34 | 48.6%) for men and 65 to 69 Years (10 | 37.0%) for women.
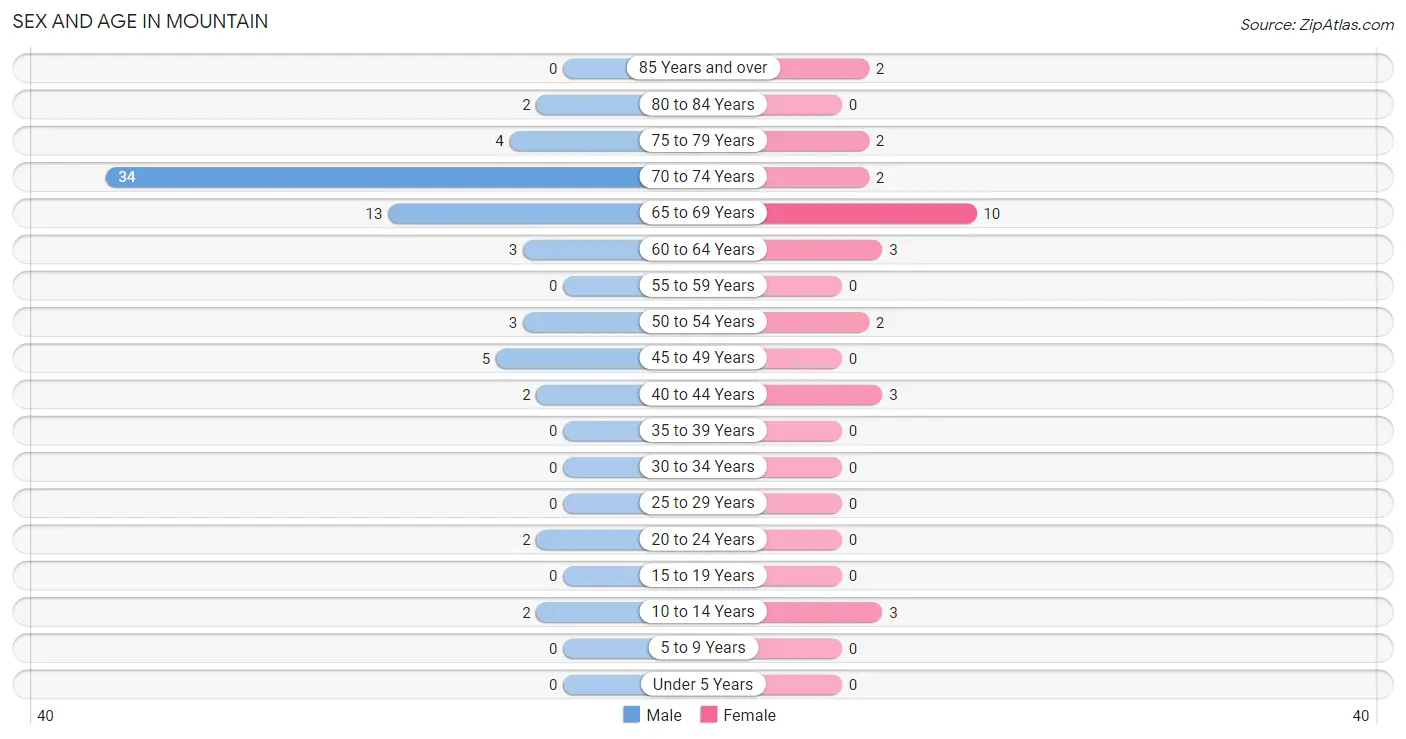
| Age Bracket | Male | Female |
| Under 5 Years | 0 (0.0%) | 0 (0.0%) |
| 5 to 9 Years | 0 (0.0%) | 0 (0.0%) |
| 10 to 14 Years | 2 (2.9%) | 3 (11.1%) |
| 15 to 19 Years | 0 (0.0%) | 0 (0.0%) |
| 20 to 24 Years | 2 (2.9%) | 0 (0.0%) |
| 25 to 29 Years | 0 (0.0%) | 0 (0.0%) |
| 30 to 34 Years | 0 (0.0%) | 0 (0.0%) |
| 35 to 39 Years | 0 (0.0%) | 0 (0.0%) |
| 40 to 44 Years | 2 (2.9%) | 3 (11.1%) |
| 45 to 49 Years | 5 (7.1%) | 0 (0.0%) |
| 50 to 54 Years | 3 (4.3%) | 2 (7.4%) |
| 55 to 59 Years | 0 (0.0%) | 0 (0.0%) |
| 60 to 64 Years | 3 (4.3%) | 3 (11.1%) |
| 65 to 69 Years | 13 (18.6%) | 10 (37.0%) |
| 70 to 74 Years | 34 (48.6%) | 2 (7.4%) |
| 75 to 79 Years | 4 (5.7%) | 2 (7.4%) |
| 80 to 84 Years | 2 (2.9%) | 0 (0.0%) |
| 85 Years and over | 0 (0.0%) | 2 (7.4%) |
| Total | 70 (100.0%) | 27 (100.0%) |
Families and Households in Mountain
Median Family Size in Mountain
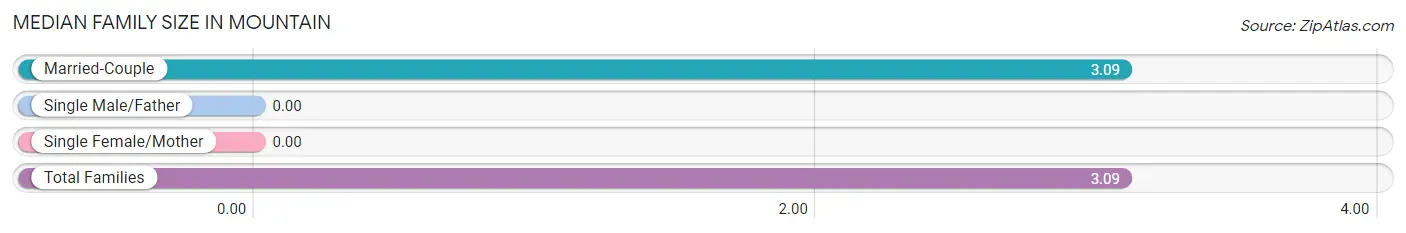
| Family Type | # Families | Family Size |
| Married-Couple | 11 (100.0%) | 3.09 |
| Single Male/Father | 0 (0.0%) | - |
| Single Female/Mother | 0 (0.0%) | - |
| Total Families | 11 (100.0%) | 3.09 |
Median Household Size in Mountain
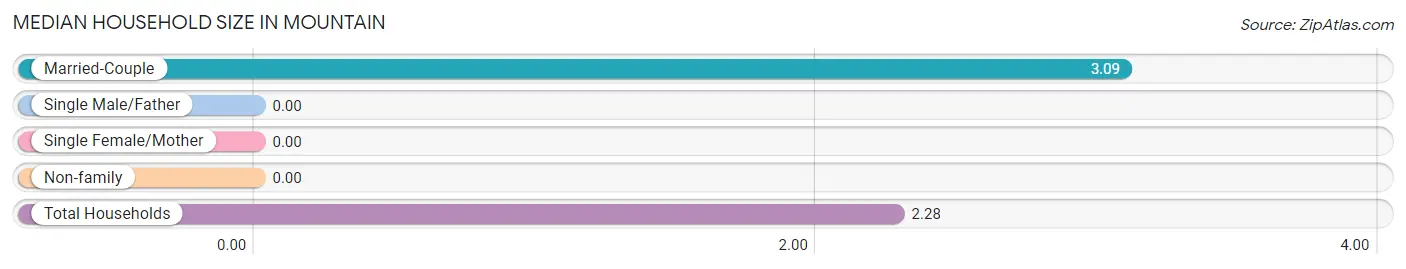
| Household Type | # Households | Household Size |
| Married-Couple | 11 (61.1%) | 3.09 |
| Single Male/Father | 0 (0.0%) | - |
| Single Female/Mother | 0 (0.0%) | - |
| Non-family | 7 (38.9%) | - |
| Total Households | 18 (100.0%) | 2.28 |
Household Size by Marriage Status in Mountain
Out of a total of 18 households in Mountain, 11 (61.1%) are family households, while 7 (38.9%) are nonfamily households. The most numerous type of family households are 2-person households, comprising 8, and the most common type of nonfamily households are 1-person households, comprising 7.
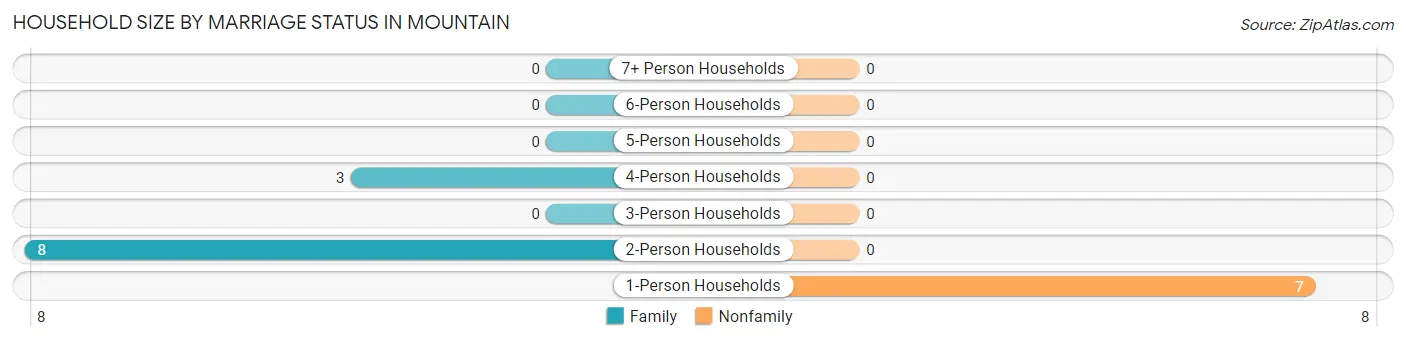
| Household Size | Family Households | Nonfamily Households |
| 1-Person Households | - | 7 (38.9%) |
| 2-Person Households | 8 (44.4%) | 0 (0.0%) |
| 3-Person Households | 0 (0.0%) | 0 (0.0%) |
| 4-Person Households | 3 (16.7%) | 0 (0.0%) |
| 5-Person Households | 0 (0.0%) | 0 (0.0%) |
| 6-Person Households | 0 (0.0%) | 0 (0.0%) |
| 7+ Person Households | 0 (0.0%) | 0 (0.0%) |
| Total | 11 (61.1%) | 7 (38.9%) |
Female Fertility in Mountain
Fertility by Age in Mountain
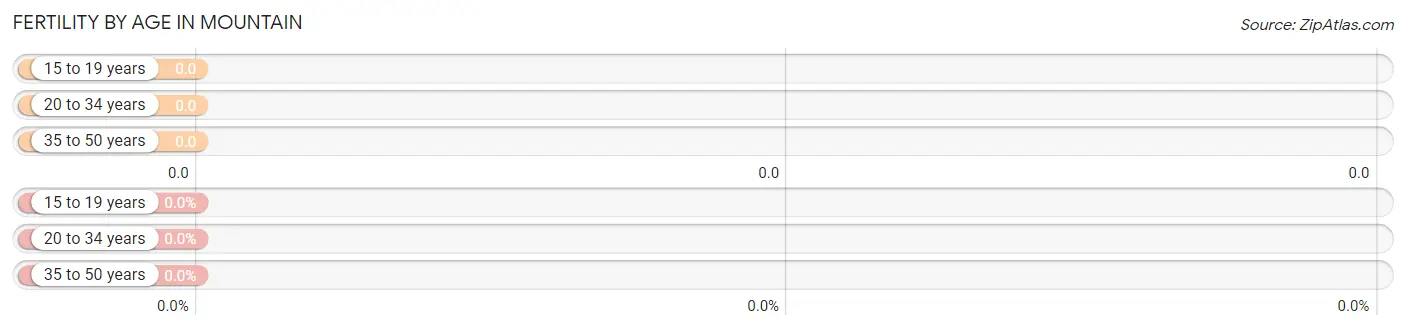
| Age Bracket | Women with Births | Births / 1,000 Women |
| 15 to 19 years | 0 (0.0%) | 0.0 |
| 20 to 34 years | 0 (0.0%) | 0.0 |
| 35 to 50 years | 0 (0.0%) | 0.0 |
| Total | 0 (0.0%) | 0.0 |
Fertility by Age by Marriage Status in Mountain
| Age Bracket | Married | Unmarried |
| 15 to 19 years | 0 (0.0%) | 0 (0.0%) |
| 20 to 34 years | 0 (0.0%) | 0 (0.0%) |
| 35 to 50 years | 0 (0.0%) | 0 (0.0%) |
| Total | 0 (0.0%) | 0 (0.0%) |
Fertility by Education in Mountain
| Educational Attainment | Women with Births | Births / 1,000 Women |
| Less than High School | 0 (0.0%) | 0.0 |
| High School Diploma | 0 (0.0%) | 0.0 |
| College or Associate's Degree | 0 (0.0%) | 0.0 |
| Bachelor's Degree | 0 (0.0%) | 0.0 |
| Graduate Degree | 0 (0.0%) | 0.0 |
| Total | 0 (0.0%) | 0.0 |
Fertility by Education by Marriage Status in Mountain
| Educational Attainment | Married | Unmarried |
| Less than High School | 0 (0.0%) | 0 (0.0%) |
| High School Diploma | 0 (0.0%) | 0 (0.0%) |
| College or Associate's Degree | 0 (0.0%) | 0 (0.0%) |
| Bachelor's Degree | 0 (0.0%) | 0 (0.0%) |
| Graduate Degree | 0 (0.0%) | 0 (0.0%) |
| Total | 0 (0.0%) | 0 (0.0%) |
Employment Characteristics in Mountain
Employment by Class of Employer in Mountain
Among the 8 employed individuals in Mountain, self-employed (incorporated) (3 | 37.5%), federal government employees (3 | 37.5%), and not-for-profit organizations (2 | 25.0%) make up the most common classes of employment.
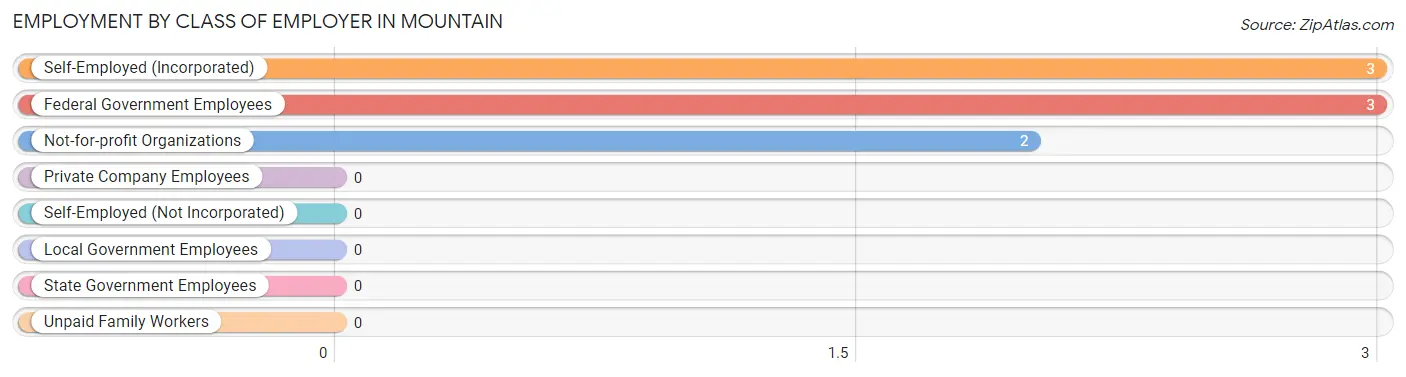
| Employer Class | # Employees | % Employees |
| Private Company Employees | 0 | 0.0% |
| Self-Employed (Incorporated) | 3 | 37.5% |
| Self-Employed (Not Incorporated) | 0 | 0.0% |
| Not-for-profit Organizations | 2 | 25.0% |
| Local Government Employees | 0 | 0.0% |
| State Government Employees | 0 | 0.0% |
| Federal Government Employees | 3 | 37.5% |
| Unpaid Family Workers | 0 | 0.0% |
| Total | 8 | 100.0% |
Employment Status by Age in Mountain
According to the labor force statistics for Mountain, out of the total population over 16 years of age (92), 10.9% or 10 individuals are in the labor force, with 20.0% or 2 of them unemployed. The age group with the highest labor force participation rate is 20 to 24 years, with 100.0% or 2 individuals in the labor force. Within the labor force, the 60 to 64 years age range has the highest percentage of unemployed individuals, with 100.0% or 2 of them being unemployed.
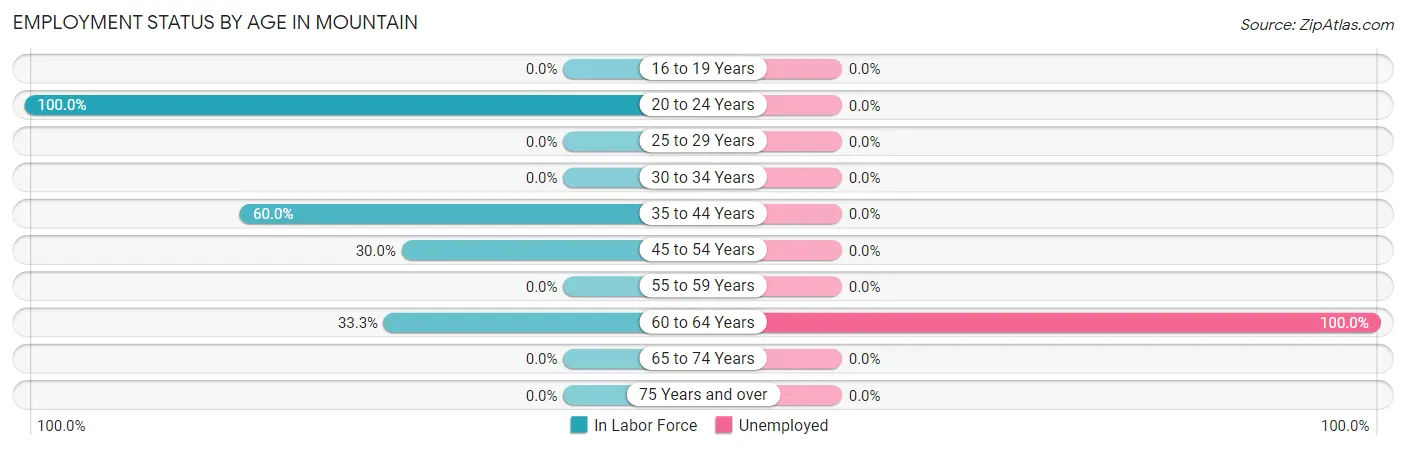
| Age Bracket | In Labor Force | Unemployed |
| 16 to 19 Years | 0 (0.0%) | 0 (0.0%) |
| 20 to 24 Years | 2 (100.0%) | 0 (0.0%) |
| 25 to 29 Years | 0 (0.0%) | 0 (0.0%) |
| 30 to 34 Years | 0 (0.0%) | 0 (0.0%) |
| 35 to 44 Years | 3 (60.0%) | 0 (0.0%) |
| 45 to 54 Years | 3 (30.0%) | 0 (0.0%) |
| 55 to 59 Years | 0 (0.0%) | 0 (0.0%) |
| 60 to 64 Years | 2 (33.3%) | 2 (100.0%) |
| 65 to 74 Years | 0 (0.0%) | 0 (0.0%) |
| 75 Years and over | 0 (0.0%) | 0 (0.0%) |
| Total | 10 (10.9%) | 2 (20.0%) |
Employment Status by Educational Attainment in Mountain
According to labor force statistics for Mountain, 38.1% of individuals (8) out of the total population between 25 and 64 years of age (21) are in the labor force, with 25.0% or 2 of them being unemployed. The group with the highest labor force participation rate are those with the educational attainment of college / associate degree, with 62.5% or 5 individuals in the labor force. Within the labor force, individuals with college / associate degree education have the highest percentage of unemployment, with 40.0% or 2 of them being unemployed.
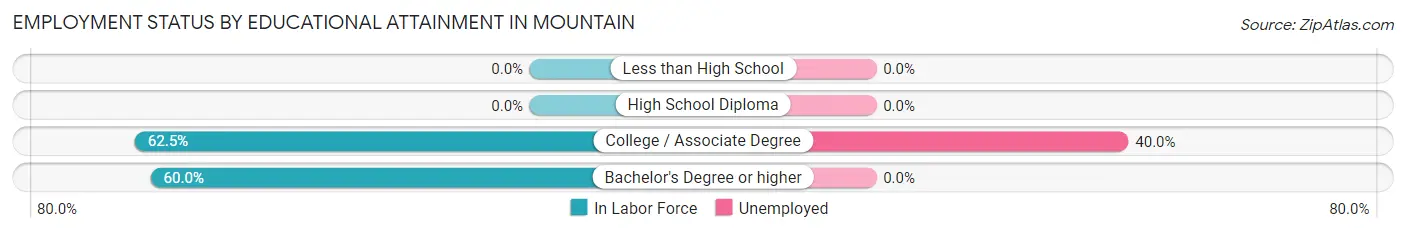
| Educational Attainment | In Labor Force | Unemployed |
| Less than High School | 0 (0.0%) | 0 (0.0%) |
| High School Diploma | 0 (0.0%) | 0 (0.0%) |
| College / Associate Degree | 5 (62.5%) | 3 (40.0%) |
| Bachelor's Degree or higher | 3 (60.0%) | 0 (0.0%) |
| Total | 8 (38.1%) | 5 (25.0%) |
Employment Occupations by Sex in Mountain
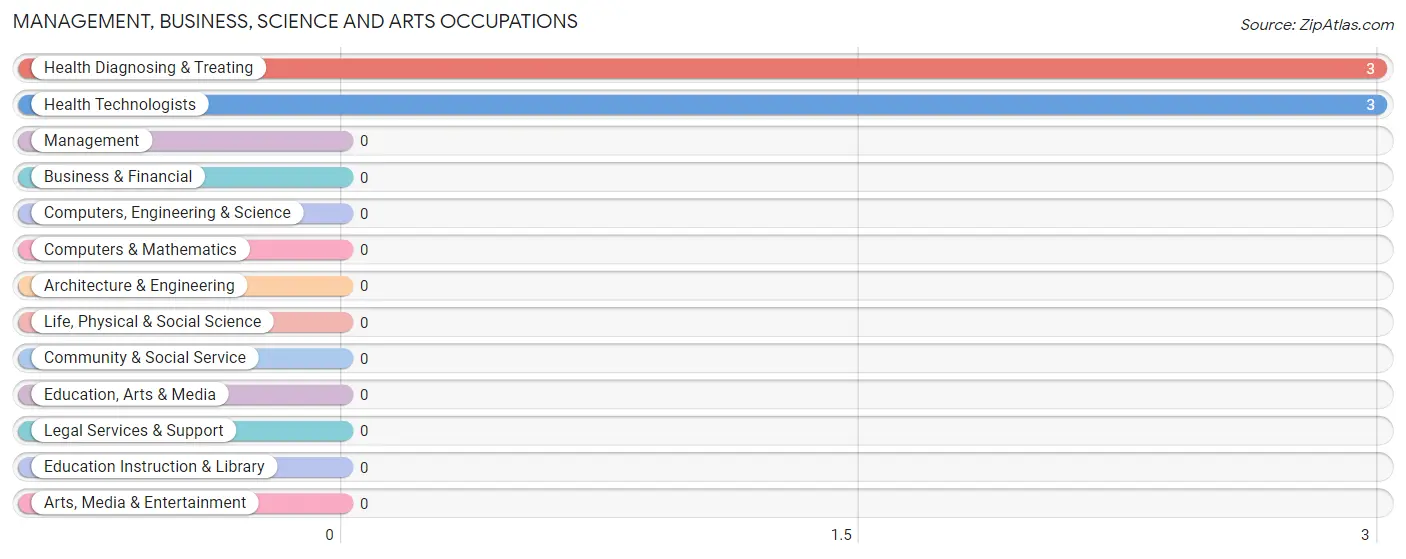
Management, Business, Science and Arts Occupations
The most common Management, Business, Science and Arts occupations in Mountain are Health Diagnosing & Treating (3 | 37.5%), and Health Technologists (3 | 37.5%).
Management, Business, Science and Arts Occupations by Sex
| Occupation | Male | Female |
| Management | 0 (0.0%) | 0 (0.0%) |
| Business & Financial | 0 (0.0%) | 0 (0.0%) |
| Computers, Engineering & Science | 0 (0.0%) | 0 (0.0%) |
| Computers & Mathematics | 0 (0.0%) | 0 (0.0%) |
| Architecture & Engineering | 0 (0.0%) | 0 (0.0%) |
| Life, Physical & Social Science | 0 (0.0%) | 0 (0.0%) |
| Community & Social Service | 0 (0.0%) | 0 (0.0%) |
| Education, Arts & Media | 0 (0.0%) | 0 (0.0%) |
| Legal Services & Support | 0 (0.0%) | 0 (0.0%) |
| Education Instruction & Library | 0 (0.0%) | 0 (0.0%) |
| Arts, Media & Entertainment | 0 (0.0%) | 0 (0.0%) |
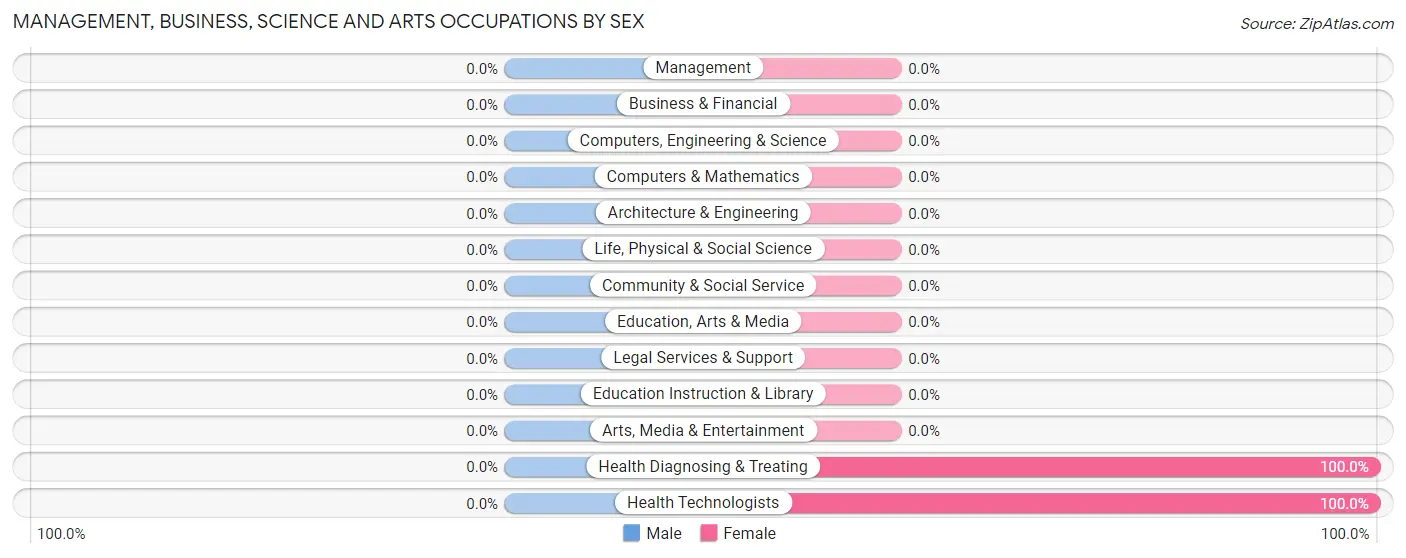
| Health Diagnosing & Treating | 0 (0.0%) | 3 (100.0%) |
| Health Technologists | 0 (0.0%) | 3 (100.0%) |
| Total (Category) | 0 (0.0%) | 3 (100.0%) |
| Total (Overall) | 5 (62.5%) | 3 (37.5%) |
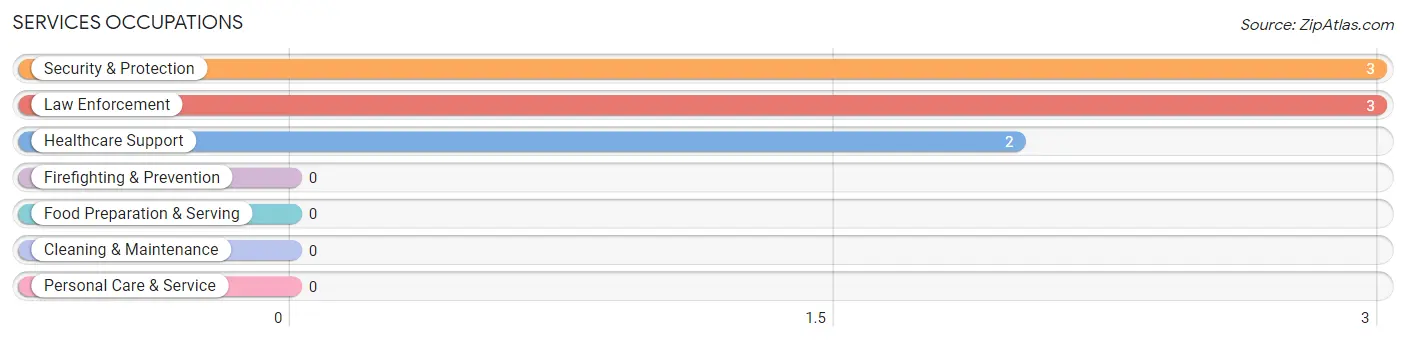
Services Occupations
The most common Services occupations in Mountain are Security & Protection (3 | 37.5%), Law Enforcement (3 | 37.5%), and Healthcare Support (2 | 25.0%).
Services Occupations by Sex
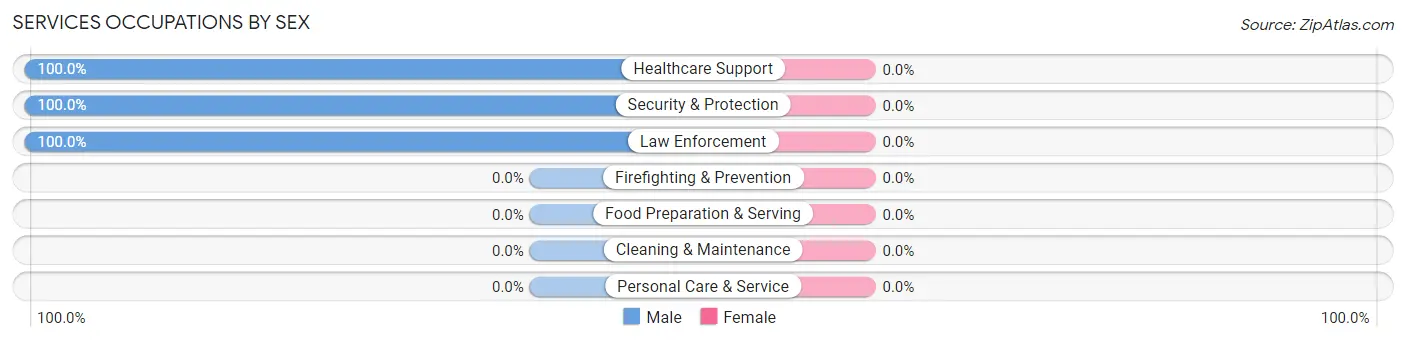
| Occupation | Male | Female |
| Healthcare Support | 2 (100.0%) | 0 (0.0%) |
| Security & Protection | 3 (100.0%) | 0 (0.0%) |
| Firefighting & Prevention | 0 (0.0%) | 0 (0.0%) |
| Law Enforcement | 3 (100.0%) | 0 (0.0%) |
| Food Preparation & Serving | 0 (0.0%) | 0 (0.0%) |
| Cleaning & Maintenance | 0 (0.0%) | 0 (0.0%) |
| Personal Care & Service | 0 (0.0%) | 0 (0.0%) |
| Total (Category) | 5 (100.0%) | 0 (0.0%) |
| Total (Overall) | 5 (62.5%) | 3 (37.5%) |
Sales and Office Occupations
Sales and Office Occupations by Sex
| Occupation | Male | Female |
| Sales & Related | 0 (0.0%) | 0 (0.0%) |
| Office & Administration | 0 (0.0%) | 0 (0.0%) |
| Total (Category) | 0 (0.0%) | 0 (0.0%) |
| Total (Overall) | 5 (62.5%) | 3 (37.5%) |
Natural Resources, Construction and Maintenance Occupations
Natural Resources, Construction and Maintenance Occupations by Sex
| Occupation | Male | Female |
| Farming, Fishing & Forestry | 0 (0.0%) | 0 (0.0%) |
| Construction & Extraction | 0 (0.0%) | 0 (0.0%) |
| Installation, Maintenance & Repair | 0 (0.0%) | 0 (0.0%) |
| Total (Category) | 0 (0.0%) | 0 (0.0%) |
| Total (Overall) | 5 (62.5%) | 3 (37.5%) |
Production, Transportation and Moving Occupations
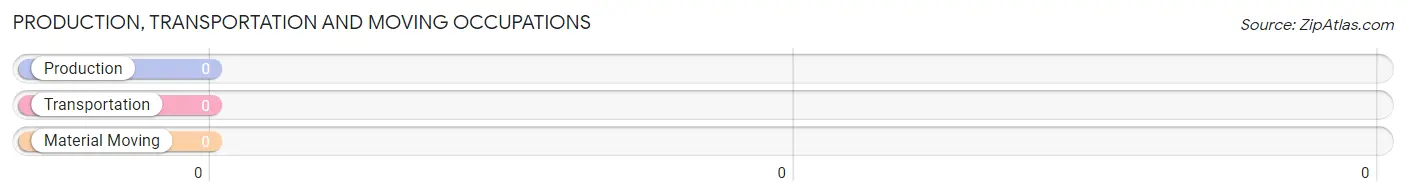
Production, Transportation and Moving Occupations by Sex
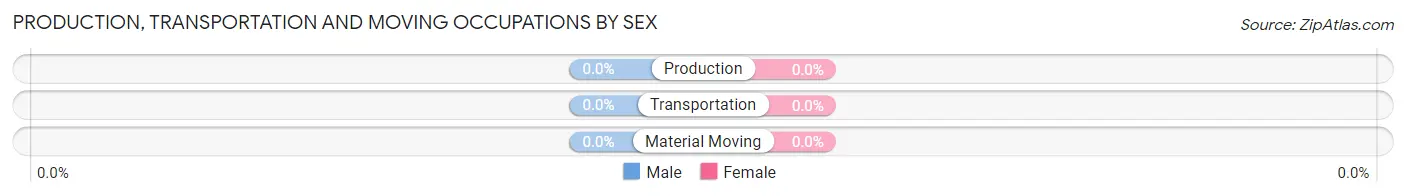
| Occupation | Male | Female |
| Production | 0 (0.0%) | 0 (0.0%) |
| Transportation | 0 (0.0%) | 0 (0.0%) |
| Material Moving | 0 (0.0%) | 0 (0.0%) |
| Total (Category) | 0 (0.0%) | 0 (0.0%) |
| Total (Overall) | 5 (62.5%) | 3 (37.5%) |
Employment Industries by Sex in Mountain
Employment Industries in Mountain
The major employment industries in Mountain include Health Care & Social Assistance (5 | 62.5%), and Public Administration (3 | 37.5%).
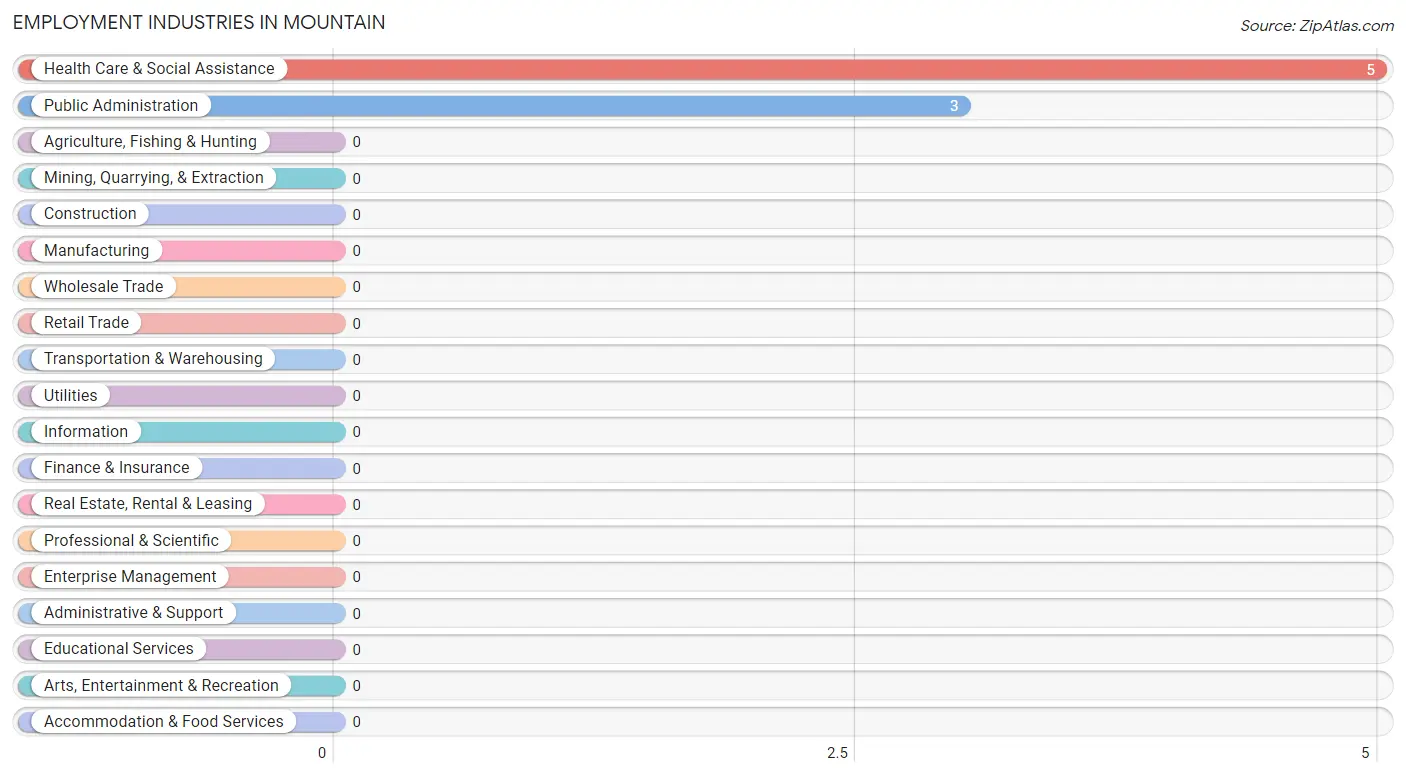
Employment Industries by Sex in Mountain
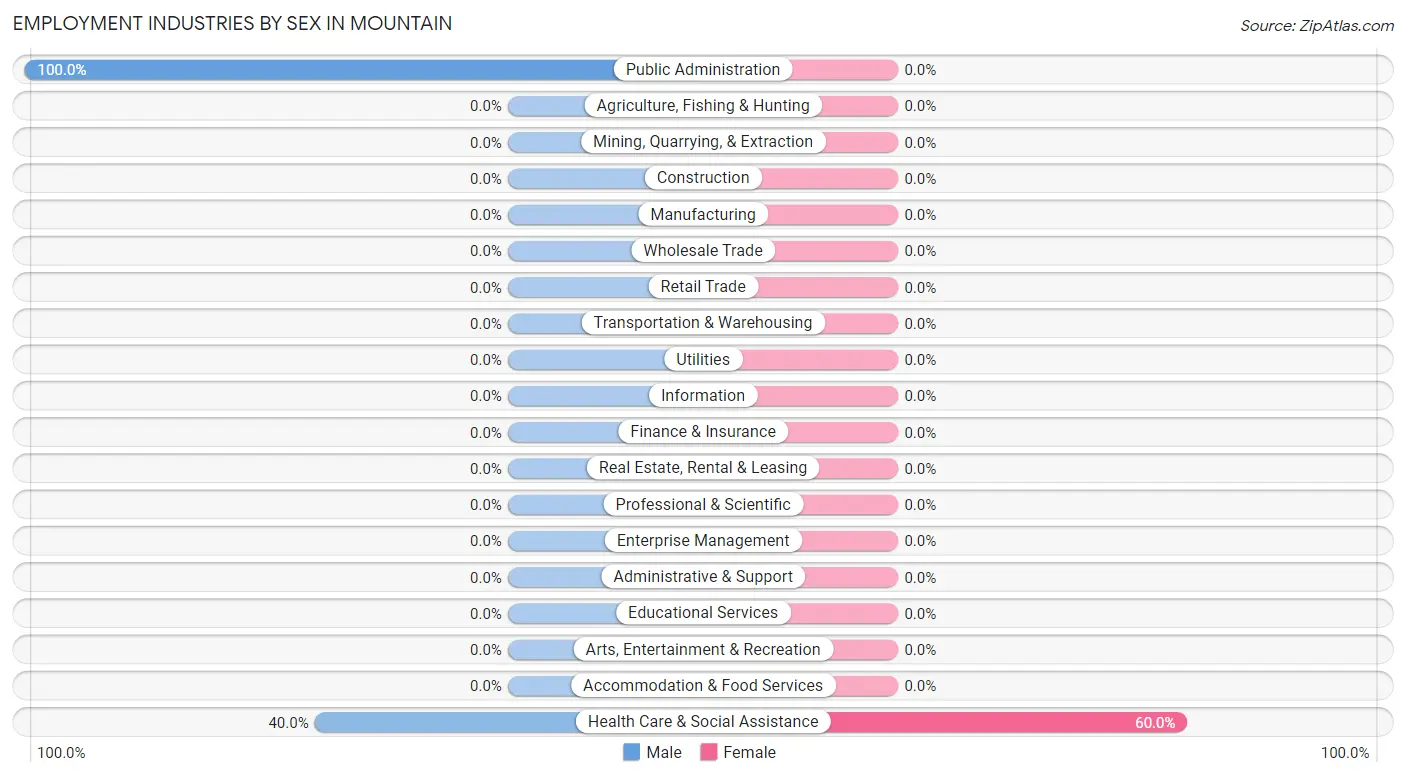
| Industry | Male | Female |
| Agriculture, Fishing & Hunting | 0 (0.0%) | 0 (0.0%) |
| Mining, Quarrying, & Extraction | 0 (0.0%) | 0 (0.0%) |
| Construction | 0 (0.0%) | 0 (0.0%) |
| Manufacturing | 0 (0.0%) | 0 (0.0%) |
| Wholesale Trade | 0 (0.0%) | 0 (0.0%) |
| Retail Trade | 0 (0.0%) | 0 (0.0%) |
| Transportation & Warehousing | 0 (0.0%) | 0 (0.0%) |
| Utilities | 0 (0.0%) | 0 (0.0%) |
| Information | 0 (0.0%) | 0 (0.0%) |
| Finance & Insurance | 0 (0.0%) | 0 (0.0%) |
| Real Estate, Rental & Leasing | 0 (0.0%) | 0 (0.0%) |
| Professional & Scientific | 0 (0.0%) | 0 (0.0%) |
| Enterprise Management | 0 (0.0%) | 0 (0.0%) |
| Administrative & Support | 0 (0.0%) | 0 (0.0%) |
| Educational Services | 0 (0.0%) | 0 (0.0%) |
| Health Care & Social Assistance | 2 (40.0%) | 3 (60.0%) |
| Arts, Entertainment & Recreation | 0 (0.0%) | 0 (0.0%) |
| Accommodation & Food Services | 0 (0.0%) | 0 (0.0%) |
| Public Administration | 3 (100.0%) | 0 (0.0%) |
| Total | 5 (62.5%) | 3 (37.5%) |
Education in Mountain
School Enrollment in Mountain
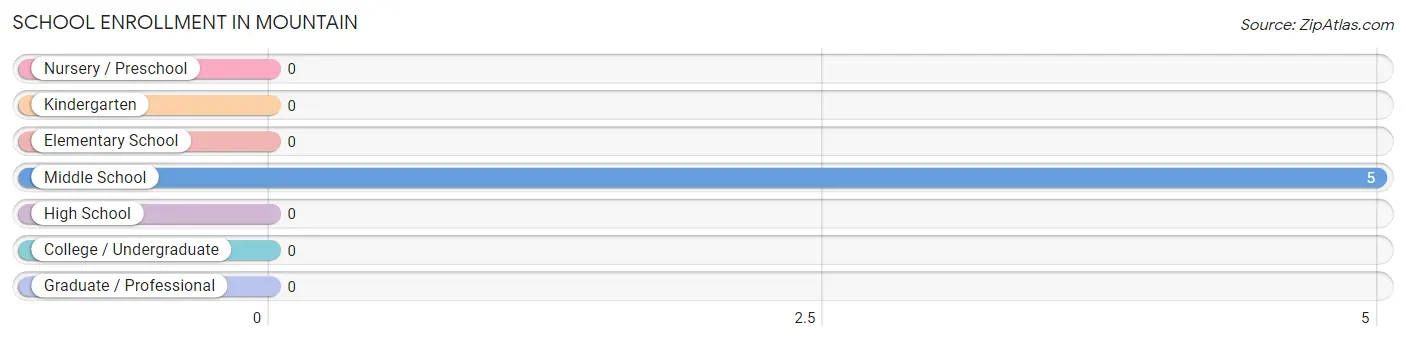
| School Level | # Students | % Students |
| Nursery / Preschool | 0 | 0.0% |
| Kindergarten | 0 | 0.0% |
| Elementary School | 0 | 0.0% |
| Middle School | 5 | 100.0% |
| High School | 0 | 0.0% |
| College / Undergraduate | 0 | 0.0% |
| Graduate / Professional | 0 | 0.0% |
| Total | 5 | 100.0% |
School Enrollment by Age by Funding Source in Mountain
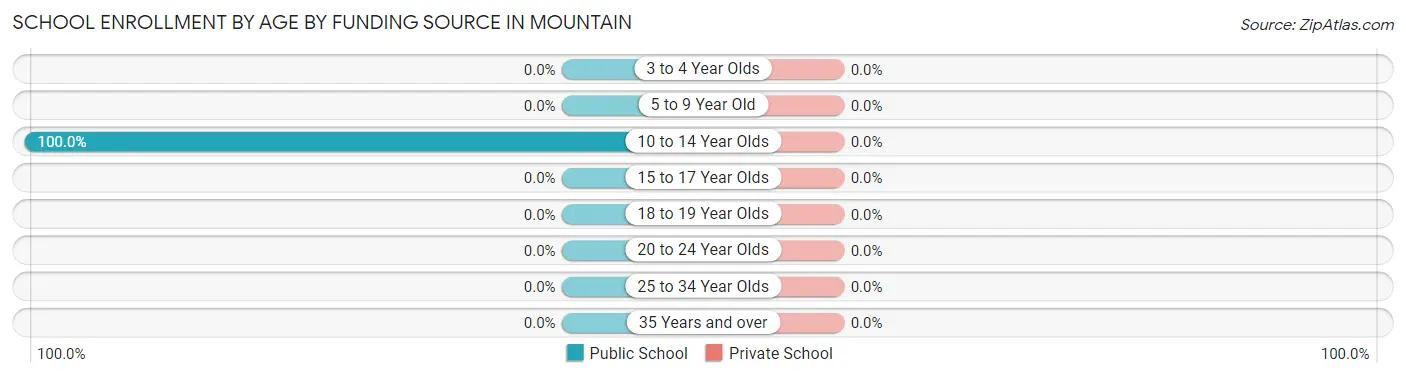
| Age Bracket | Public School | Private School |
| 3 to 4 Year Olds | 0 (0.0%) | 0 (0.0%) |
| 5 to 9 Year Old | 0 (0.0%) | 0 (0.0%) |
| 10 to 14 Year Olds | 5 (100.0%) | 0 (0.0%) |
| 15 to 17 Year Olds | 0 (0.0%) | 0 (0.0%) |
| 18 to 19 Year Olds | 0 (0.0%) | 0 (0.0%) |
| 20 to 24 Year Olds | 0 (0.0%) | 0 (0.0%) |
| 25 to 34 Year Olds | 0 (0.0%) | 0 (0.0%) |
| 35 Years and over | 0 (0.0%) | 0 (0.0%) |
| Total | 5 (100.0%) | 0 (0.0%) |
Educational Attainment by Field of Study in Mountain
Business (6 | 40.0%), psychology (3 | 20.0%), education (2 | 13.3%), literature & languages (2 | 13.3%), and communications (2 | 13.3%) are the most common fields of study among 15 individuals in Mountain who have obtained a bachelor's degree or higher.
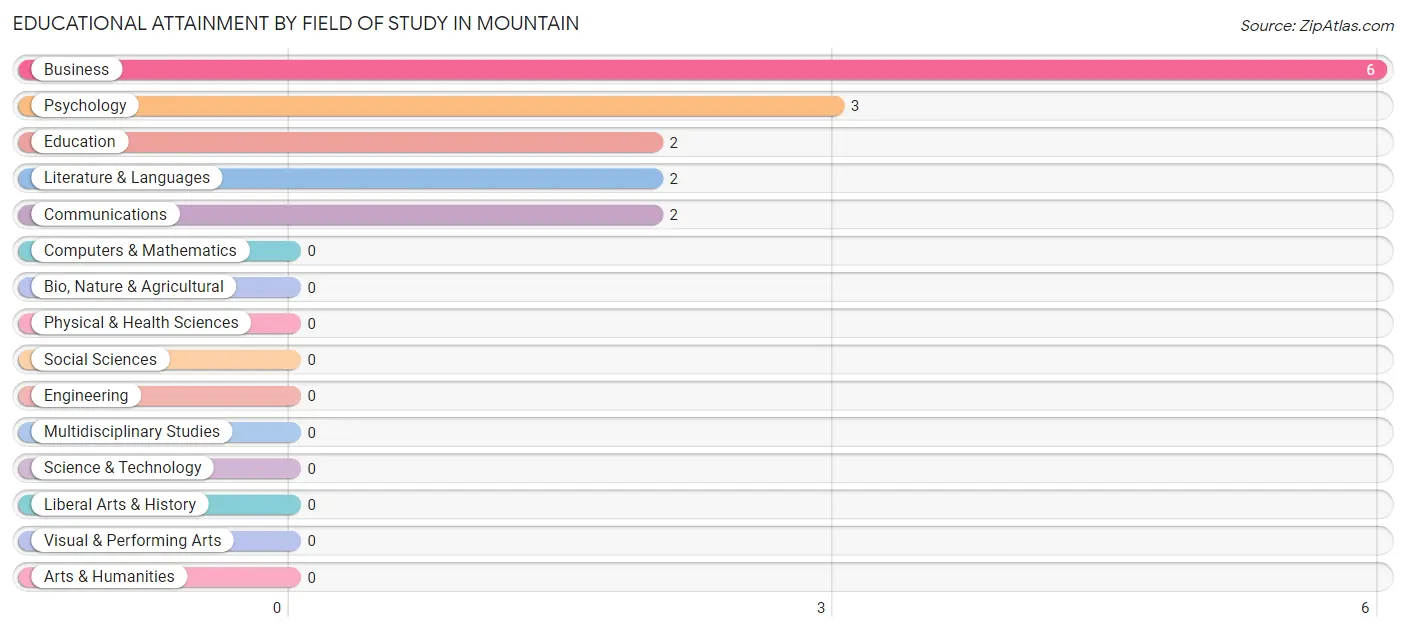
| Field of Study | # Graduates | % Graduates |
| Computers & Mathematics | 0 | 0.0% |
| Bio, Nature & Agricultural | 0 | 0.0% |
| Physical & Health Sciences | 0 | 0.0% |
| Psychology | 3 | 20.0% |
| Social Sciences | 0 | 0.0% |
| Engineering | 0 | 0.0% |
| Multidisciplinary Studies | 0 | 0.0% |
| Science & Technology | 0 | 0.0% |
| Business | 6 | 40.0% |
| Education | 2 | 13.3% |
| Literature & Languages | 2 | 13.3% |
| Liberal Arts & History | 0 | 0.0% |
| Visual & Performing Arts | 0 | 0.0% |
| Communications | 2 | 13.3% |
| Arts & Humanities | 0 | 0.0% |
| Total | 15 | 100.0% |
Transportation & Commute in Mountain
Vehicle Availability by Sex in Mountain
The most prevalent vehicle ownership categories in Mountain are males with 5 or more vehicles (3, accounting for 60.0%) and females with 5 or more vehicles (3, making up 100.0%).
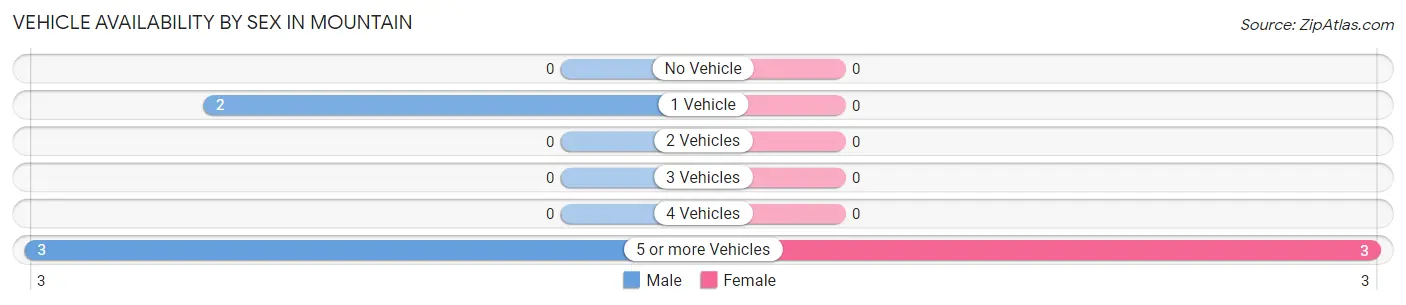
| Vehicles Available | Male | Female |
| No Vehicle | 0 (0.0%) | 0 (0.0%) |
| 1 Vehicle | 2 (40.0%) | 0 (0.0%) |
| 2 Vehicles | 0 (0.0%) | 0 (0.0%) |
| 3 Vehicles | 0 (0.0%) | 0 (0.0%) |
| 4 Vehicles | 0 (0.0%) | 0 (0.0%) |
| 5 or more Vehicles | 3 (60.0%) | 3 (100.0%) |
| Total | 5 (100.0%) | 3 (100.0%) |
Commute Time in Mountain
The most frequently occuring commute durations in Mountain are 20 to 24 minutes (3 commuters, 37.5%), 25 to 29 minutes (3 commuters, 37.5%), and 5 to 9 minutes (2 commuters, 25.0%).
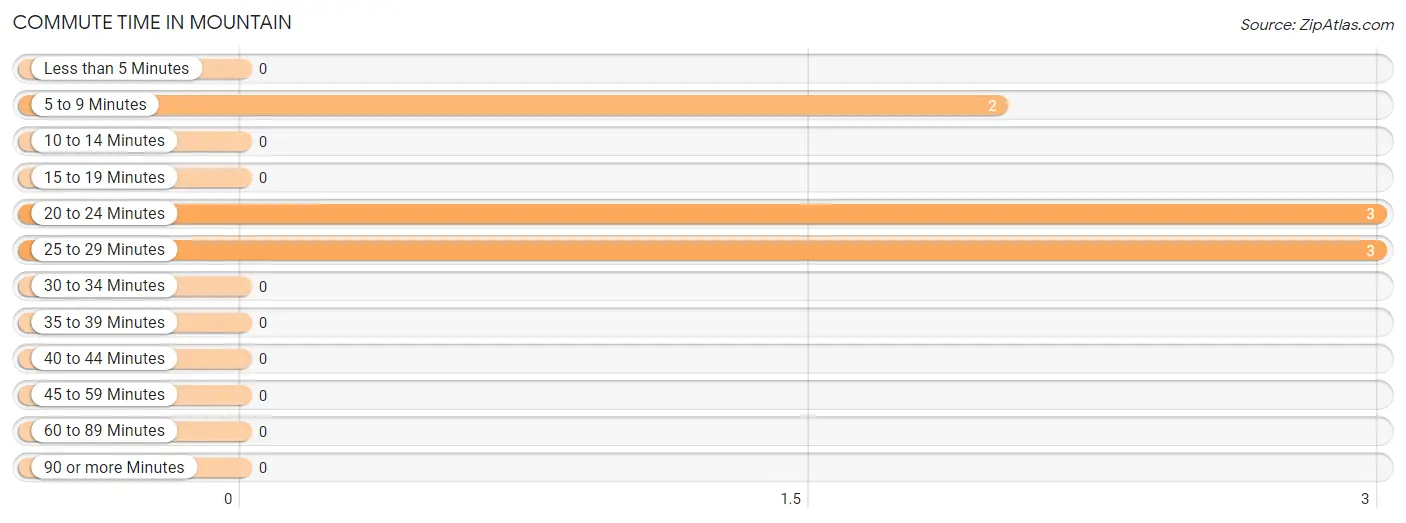
| Commute Time | # Commuters | % Commuters |
| Less than 5 Minutes | 0 | 0.0% |
| 5 to 9 Minutes | 2 | 25.0% |
| 10 to 14 Minutes | 0 | 0.0% |
| 15 to 19 Minutes | 0 | 0.0% |
| 20 to 24 Minutes | 3 | 37.5% |
| 25 to 29 Minutes | 3 | 37.5% |
| 30 to 34 Minutes | 0 | 0.0% |
| 35 to 39 Minutes | 0 | 0.0% |
| 40 to 44 Minutes | 0 | 0.0% |
| 45 to 59 Minutes | 0 | 0.0% |
| 60 to 89 Minutes | 0 | 0.0% |
| 90 or more Minutes | 0 | 0.0% |
Commute Time by Sex in Mountain
The most common commute times in Mountain are 20 to 24 minutes (3 commuters, 60.0%) for males and 25 to 29 minutes (3 commuters, 100.0%) for females.
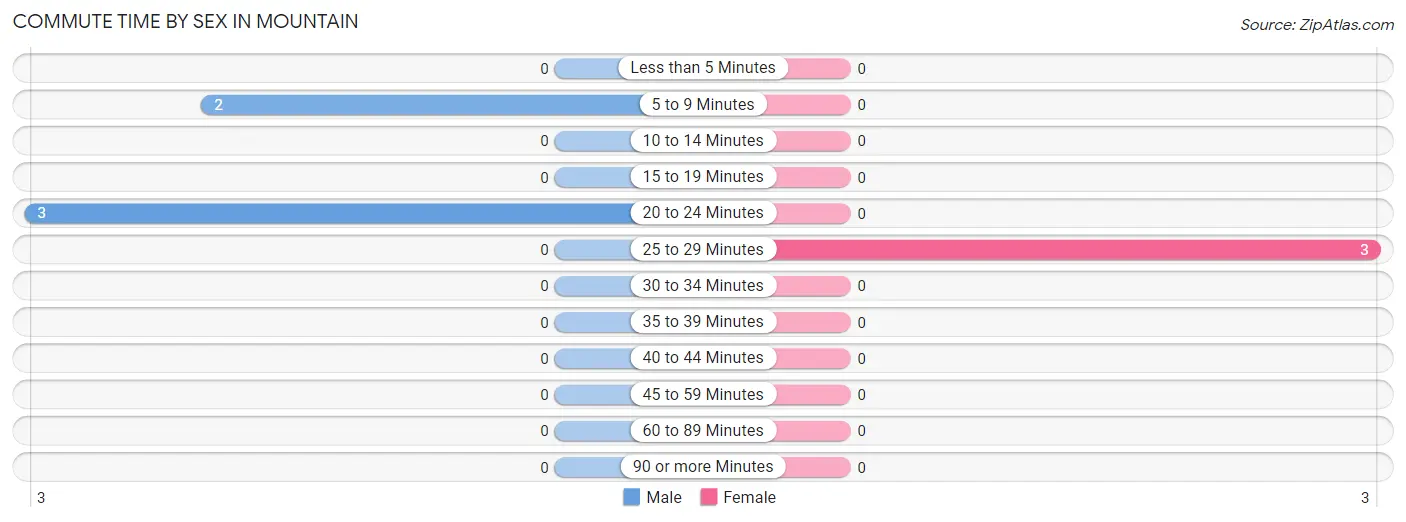
| Commute Time | Male | Female |
| Less than 5 Minutes | 0 (0.0%) | 0 (0.0%) |
| 5 to 9 Minutes | 2 (40.0%) | 0 (0.0%) |
| 10 to 14 Minutes | 0 (0.0%) | 0 (0.0%) |
| 15 to 19 Minutes | 0 (0.0%) | 0 (0.0%) |
| 20 to 24 Minutes | 3 (60.0%) | 0 (0.0%) |
| 25 to 29 Minutes | 0 (0.0%) | 3 (100.0%) |
| 30 to 34 Minutes | 0 (0.0%) | 0 (0.0%) |
| 35 to 39 Minutes | 0 (0.0%) | 0 (0.0%) |
| 40 to 44 Minutes | 0 (0.0%) | 0 (0.0%) |
| 45 to 59 Minutes | 0 (0.0%) | 0 (0.0%) |
| 60 to 89 Minutes | 0 (0.0%) | 0 (0.0%) |
| 90 or more Minutes | 0 (0.0%) | 0 (0.0%) |
Time of Departure to Work by Sex in Mountain
The most frequent times of departure to work in Mountain are 6:30 AM to 6:59 AM (3, 60.0%) for males and 11:00 AM to 11:59 AM (3, 100.0%) for females.
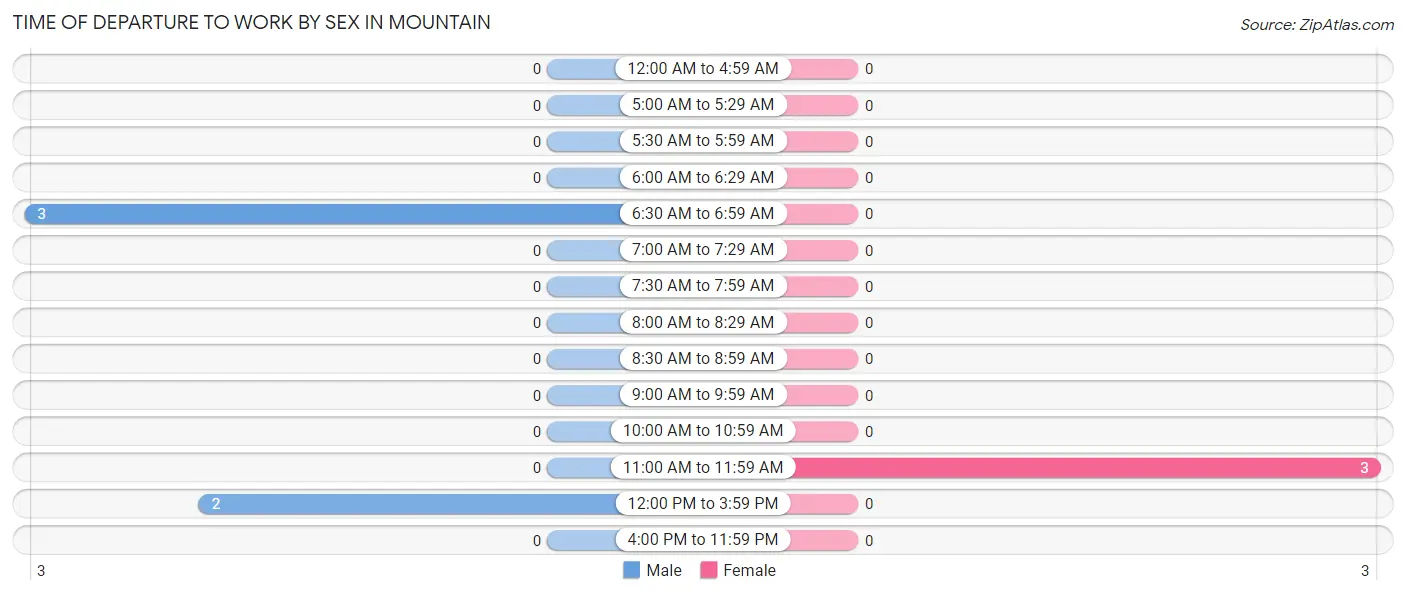
| Time of Departure | Male | Female |
| 12:00 AM to 4:59 AM | 0 (0.0%) | 0 (0.0%) |
| 5:00 AM to 5:29 AM | 0 (0.0%) | 0 (0.0%) |
| 5:30 AM to 5:59 AM | 0 (0.0%) | 0 (0.0%) |
| 6:00 AM to 6:29 AM | 0 (0.0%) | 0 (0.0%) |
| 6:30 AM to 6:59 AM | 3 (60.0%) | 0 (0.0%) |
| 7:00 AM to 7:29 AM | 0 (0.0%) | 0 (0.0%) |
| 7:30 AM to 7:59 AM | 0 (0.0%) | 0 (0.0%) |
| 8:00 AM to 8:29 AM | 0 (0.0%) | 0 (0.0%) |
| 8:30 AM to 8:59 AM | 0 (0.0%) | 0 (0.0%) |
| 9:00 AM to 9:59 AM | 0 (0.0%) | 0 (0.0%) |
| 10:00 AM to 10:59 AM | 0 (0.0%) | 0 (0.0%) |
| 11:00 AM to 11:59 AM | 0 (0.0%) | 3 (100.0%) |
| 12:00 PM to 3:59 PM | 2 (40.0%) | 0 (0.0%) |
| 4:00 PM to 11:59 PM | 0 (0.0%) | 0 (0.0%) |
| Total | 5 (100.0%) | 3 (100.0%) |
Housing Occupancy in Mountain
Occupancy by Ownership in Mountain
Of the total 18 dwellings in Mountain, owner-occupied units account for 12 (66.7%), while renter-occupied units make up 6 (33.3%).
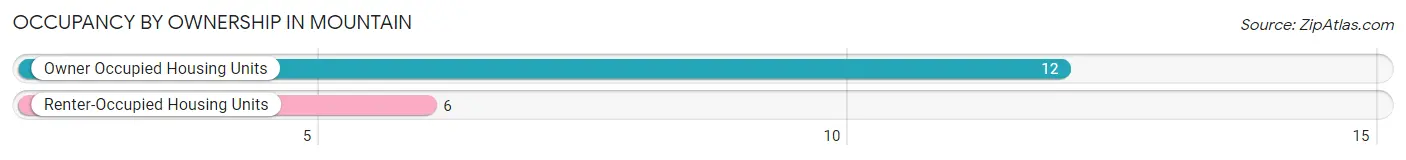
| Occupancy | # Housing Units | % Housing Units |
| Owner Occupied Housing Units | 12 | 66.7% |
| Renter-Occupied Housing Units | 6 | 33.3% |
| Total Occupied Housing Units | 18 | 100.0% |
Occupancy by Household Size in Mountain
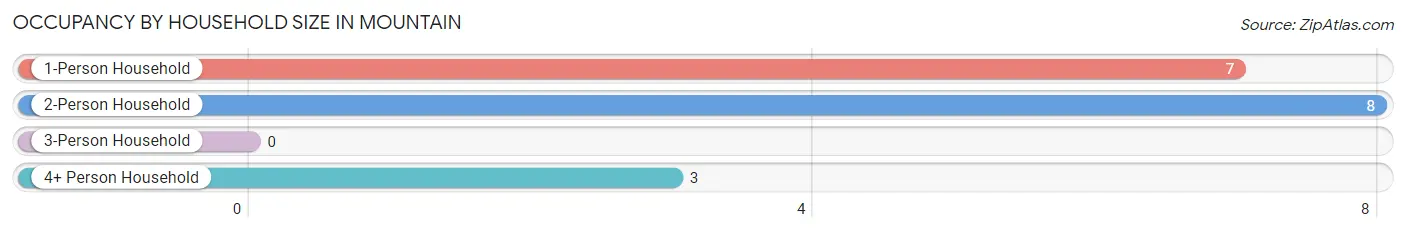
| Household Size | # Housing Units | % Housing Units |
| 1-Person Household | 7 | 38.9% |
| 2-Person Household | 8 | 44.4% |
| 3-Person Household | 0 | 0.0% |
| 4+ Person Household | 3 | 16.7% |
| Total Housing Units | 18 | 100.0% |
Occupancy by Ownership by Household Size in Mountain
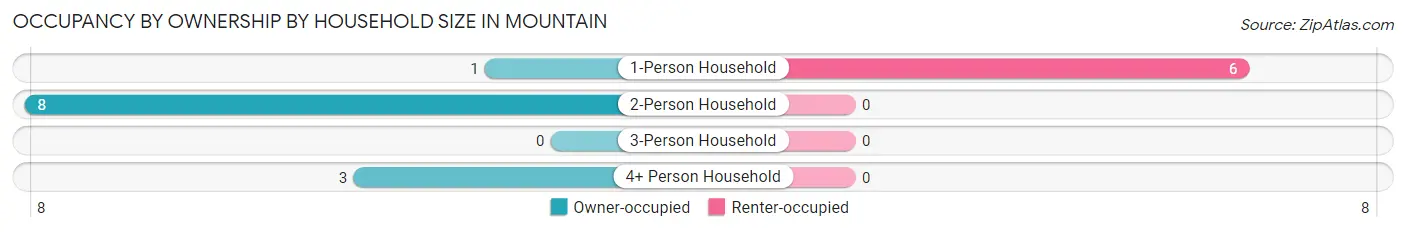
| Household Size | Owner-occupied | Renter-occupied |
| 1-Person Household | 1 (14.3%) | 6 (85.7%) |
| 2-Person Household | 8 (100.0%) | 0 (0.0%) |
| 3-Person Household | 0 (0.0%) | 0 (0.0%) |
| 4+ Person Household | 3 (100.0%) | 0 (0.0%) |
| Total Housing Units | 12 (66.7%) | 6 (33.3%) |
Occupancy by Educational Attainment in Mountain
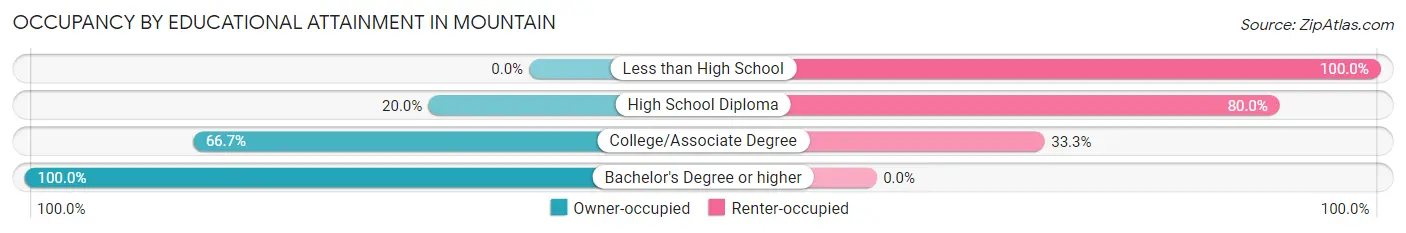
| Household Size | Owner-occupied | Renter-occupied |
| Less than High School | 0 (0.0%) | 1 (100.0%) |
| High School Diploma | 1 (20.0%) | 4 (80.0%) |
| College/Associate Degree | 2 (66.7%) | 1 (33.3%) |
| Bachelor's Degree or higher | 9 (100.0%) | 0 (0.0%) |
Occupancy by Age of Householder in Mountain
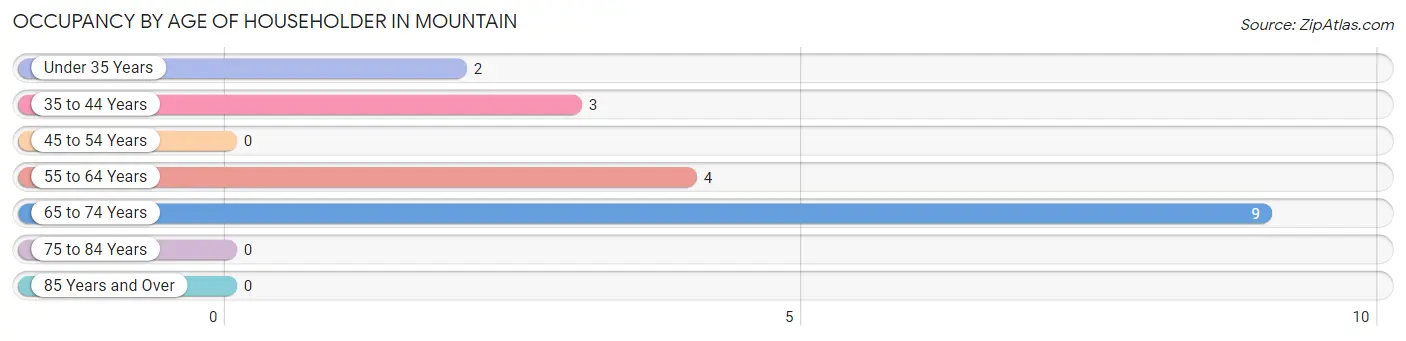
| Age Bracket | # Households | % Households |
| Under 35 Years | 2 | 11.1% |
| 35 to 44 Years | 3 | 16.7% |
| 45 to 54 Years | 0 | 0.0% |
| 55 to 64 Years | 4 | 22.2% |
| 65 to 74 Years | 9 | 50.0% |
| 75 to 84 Years | 0 | 0.0% |
| 85 Years and Over | 0 | 0.0% |
| Total | 18 | 100.0% |
Housing Finances in Mountain
Median Income by Occupancy in Mountain
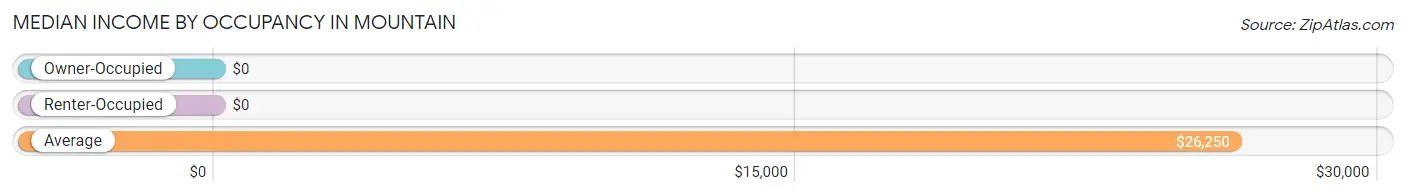
| Occupancy Type | # Households | Median Income |
| Owner-Occupied | 12 (66.7%) | $0 |
| Renter-Occupied | 6 (33.3%) | $0 |
| Average | 18 (100.0%) | $26,250 |
Occupancy by Householder Income Bracket in Mountain
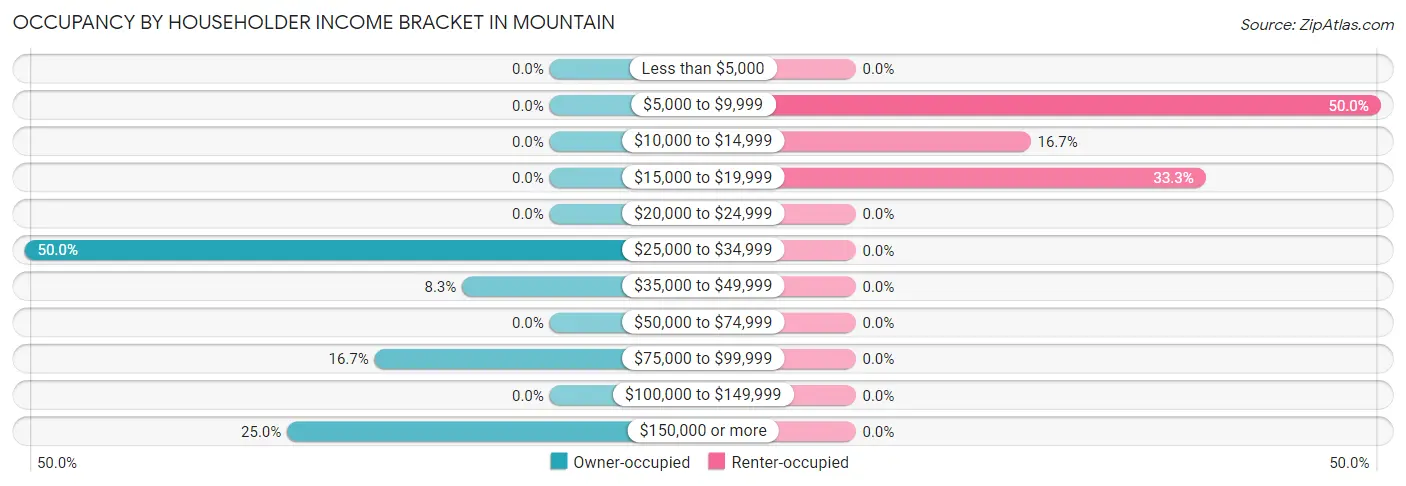
| Income Bracket | Owner-occupied | Renter-occupied |
| Less than $5,000 | 0 (0.0%) | 0 (0.0%) |
| $5,000 to $9,999 | 0 (0.0%) | 3 (50.0%) |
| $10,000 to $14,999 | 0 (0.0%) | 1 (16.7%) |
| $15,000 to $19,999 | 0 (0.0%) | 2 (33.3%) |
| $20,000 to $24,999 | 0 (0.0%) | 0 (0.0%) |
| $25,000 to $34,999 | 6 (50.0%) | 0 (0.0%) |
| $35,000 to $49,999 | 1 (8.3%) | 0 (0.0%) |
| $50,000 to $74,999 | 0 (0.0%) | 0 (0.0%) |
| $75,000 to $99,999 | 2 (16.7%) | 0 (0.0%) |
| $100,000 to $149,999 | 0 (0.0%) | 0 (0.0%) |
| $150,000 or more | 3 (25.0%) | 0 (0.0%) |
| Total | 12 (100.0%) | 6 (100.0%) |
Monthly Housing Cost Tiers in Mountain
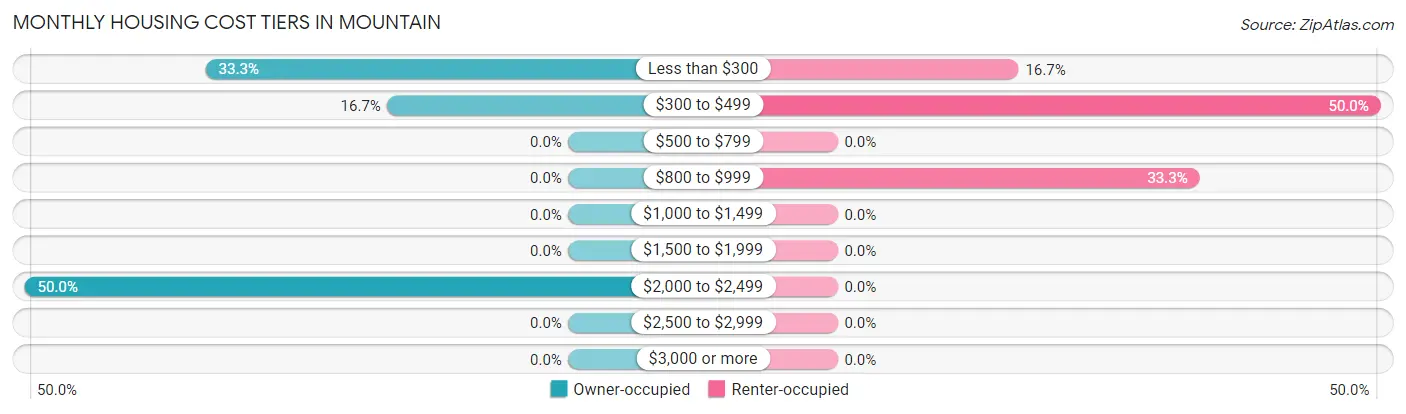
| Monthly Cost | Owner-occupied | Renter-occupied |
| Less than $300 | 4 (33.3%) | 1 (16.7%) |
| $300 to $499 | 2 (16.7%) | 3 (50.0%) |
| $500 to $799 | 0 (0.0%) | 0 (0.0%) |
| $800 to $999 | 0 (0.0%) | 2 (33.3%) |
| $1,000 to $1,499 | 0 (0.0%) | 0 (0.0%) |
| $1,500 to $1,999 | 0 (0.0%) | 0 (0.0%) |
| $2,000 to $2,499 | 6 (50.0%) | 0 (0.0%) |
| $2,500 to $2,999 | 0 (0.0%) | 0 (0.0%) |
| $3,000 or more | 0 (0.0%) | 0 (0.0%) |
| Total | 12 (100.0%) | 6 (100.0%) |
Physical Housing Characteristics in Mountain
Housing Structures in Mountain
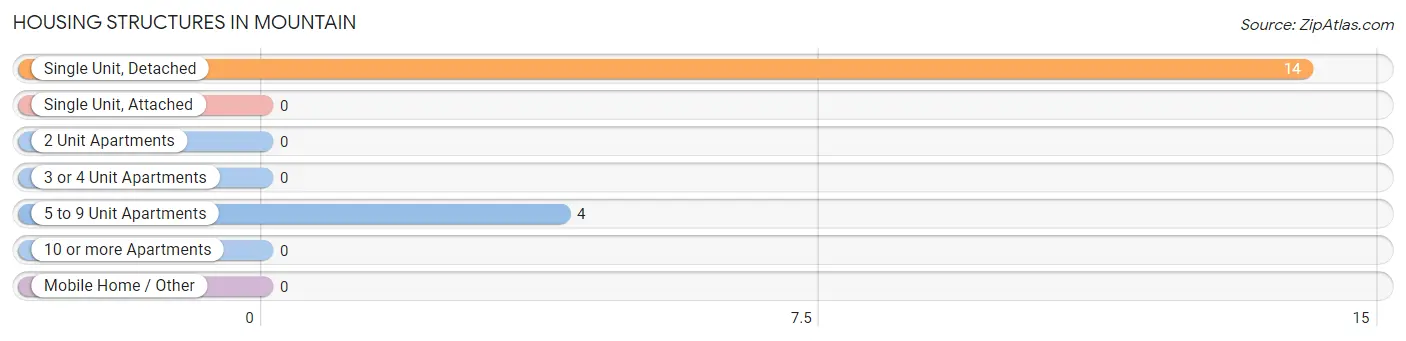
| Structure Type | # Housing Units | % Housing Units |
| Single Unit, Detached | 14 | 77.8% |
| Single Unit, Attached | 0 | 0.0% |
| 2 Unit Apartments | 0 | 0.0% |
| 3 or 4 Unit Apartments | 0 | 0.0% |
| 5 to 9 Unit Apartments | 4 | 22.2% |
| 10 or more Apartments | 0 | 0.0% |
| Mobile Home / Other | 0 | 0.0% |
| Total | 18 | 100.0% |
Housing Structures by Occupancy in Mountain
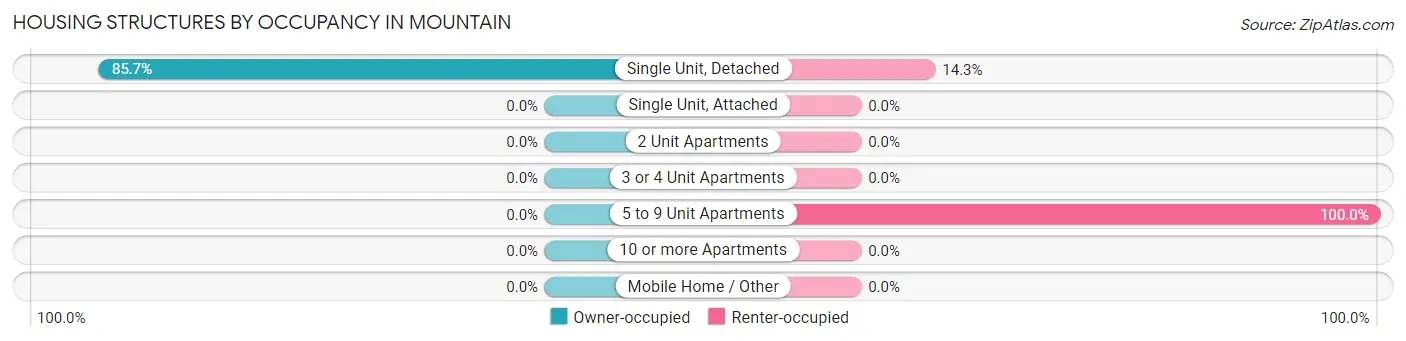
| Structure Type | Owner-occupied | Renter-occupied |
| Single Unit, Detached | 12 (85.7%) | 2 (14.3%) |
| Single Unit, Attached | 0 (0.0%) | 0 (0.0%) |
| 2 Unit Apartments | 0 (0.0%) | 0 (0.0%) |
| 3 or 4 Unit Apartments | 0 (0.0%) | 0 (0.0%) |
| 5 to 9 Unit Apartments | 0 (0.0%) | 4 (100.0%) |
| 10 or more Apartments | 0 (0.0%) | 0 (0.0%) |
| Mobile Home / Other | 0 (0.0%) | 0 (0.0%) |
| Total | 12 (66.7%) | 6 (33.3%) |
Housing Structures by Number of Rooms in Mountain
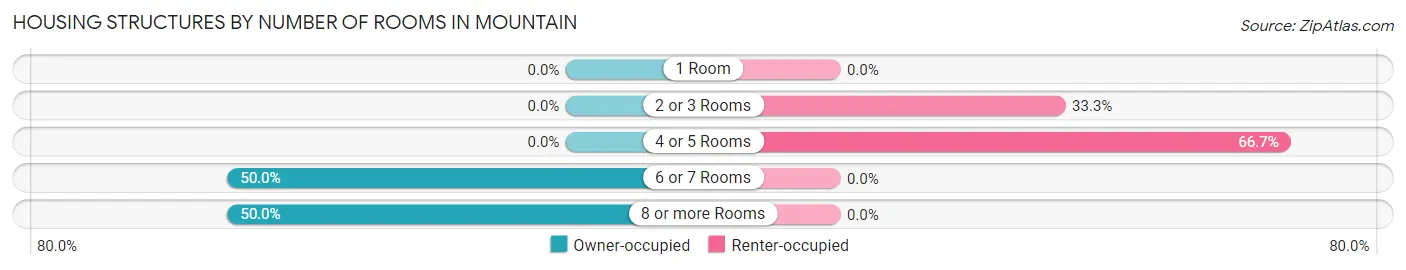
| Number of Rooms | Owner-occupied | Renter-occupied |
| 1 Room | 0 (0.0%) | 0 (0.0%) |
| 2 or 3 Rooms | 0 (0.0%) | 2 (33.3%) |
| 4 or 5 Rooms | 0 (0.0%) | 4 (66.7%) |
| 6 or 7 Rooms | 6 (50.0%) | 0 (0.0%) |
| 8 or more Rooms | 6 (50.0%) | 0 (0.0%) |
| Total | 12 (100.0%) | 6 (100.0%) |
Housing Structure by Heating Type in Mountain
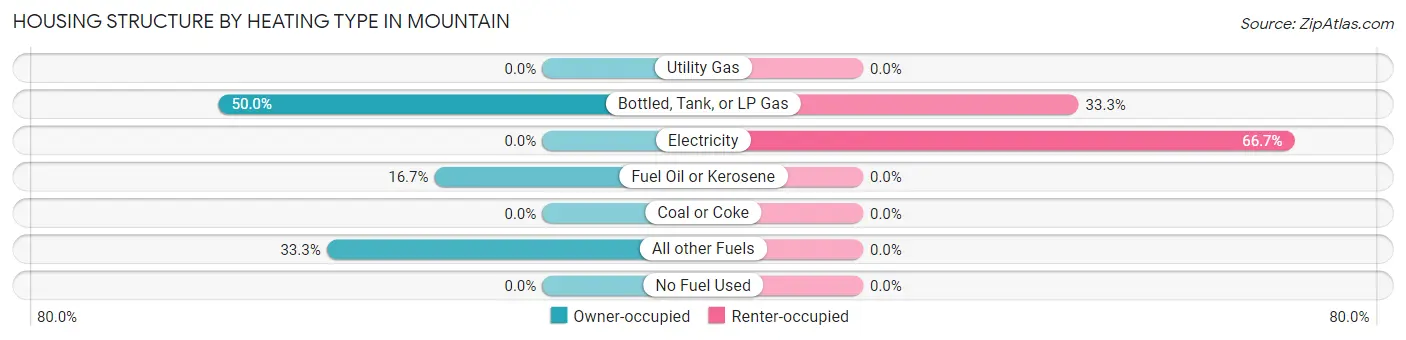
| Heating Type | Owner-occupied | Renter-occupied |
| Utility Gas | 0 (0.0%) | 0 (0.0%) |
| Bottled, Tank, or LP Gas | 6 (50.0%) | 2 (33.3%) |
| Electricity | 0 (0.0%) | 4 (66.7%) |
| Fuel Oil or Kerosene | 2 (16.7%) | 0 (0.0%) |
| Coal or Coke | 0 (0.0%) | 0 (0.0%) |
| All other Fuels | 4 (33.3%) | 0 (0.0%) |
| No Fuel Used | 0 (0.0%) | 0 (0.0%) |
| Total | 12 (100.0%) | 6 (100.0%) |
Household Vehicle Usage in Mountain
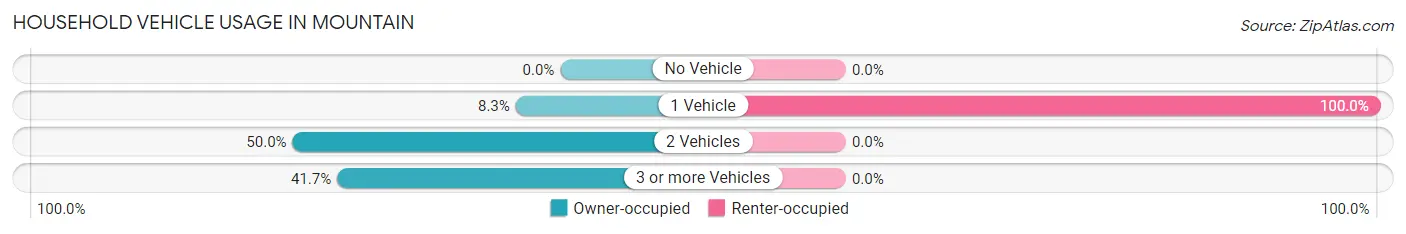
| Vehicles per Household | Owner-occupied | Renter-occupied |
| No Vehicle | 0 (0.0%) | 0 (0.0%) |
| 1 Vehicle | 1 (8.3%) | 6 (100.0%) |
| 2 Vehicles | 6 (50.0%) | 0 (0.0%) |
| 3 or more Vehicles | 5 (41.7%) | 0 (0.0%) |
| Total | 12 (100.0%) | 6 (100.0%) |
Real Estate & Mortgages in Mountain
Real Estate and Mortgage Overview in Mountain
| Characteristic | Without Mortgage | With Mortgage |
| Housing Units | 6 | 6 |
| Median Property Value | $107,500 | $0 |
| Median Household Income | - | - |
| Monthly Housing Costs | $283 | $0 |
| Real Estate Taxes | $400 | $0 |
Property Value by Mortgage Status in Mountain
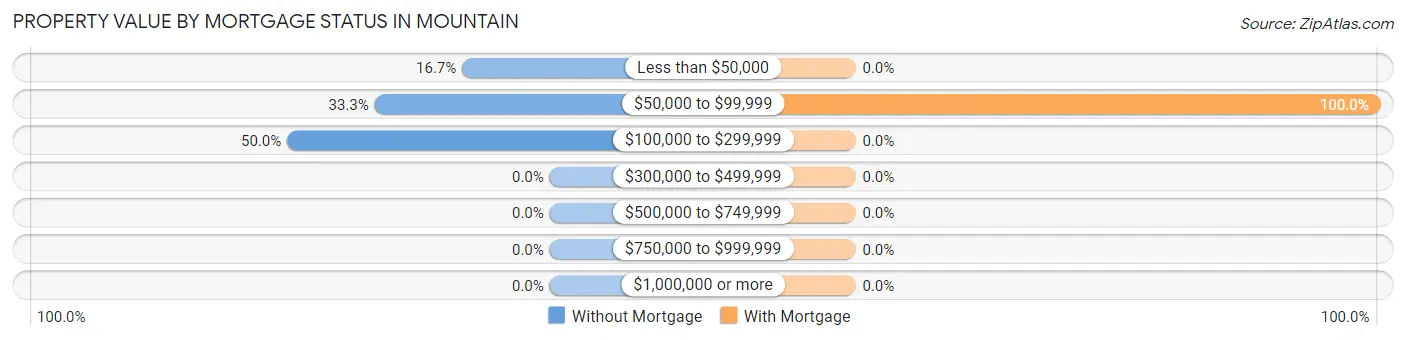
| Property Value | Without Mortgage | With Mortgage |
| Less than $50,000 | 1 (16.7%) | 0 (0.0%) |
| $50,000 to $99,999 | 2 (33.3%) | 6 (100.0%) |
| $100,000 to $299,999 | 3 (50.0%) | 0 (0.0%) |
| $300,000 to $499,999 | 0 (0.0%) | 0 (0.0%) |
| $500,000 to $749,999 | 0 (0.0%) | 0 (0.0%) |
| $750,000 to $999,999 | 0 (0.0%) | 0 (0.0%) |
| $1,000,000 or more | 0 (0.0%) | 0 (0.0%) |
| Total | 6 (100.0%) | 6 (100.0%) |
Household Income by Mortgage Status in Mountain
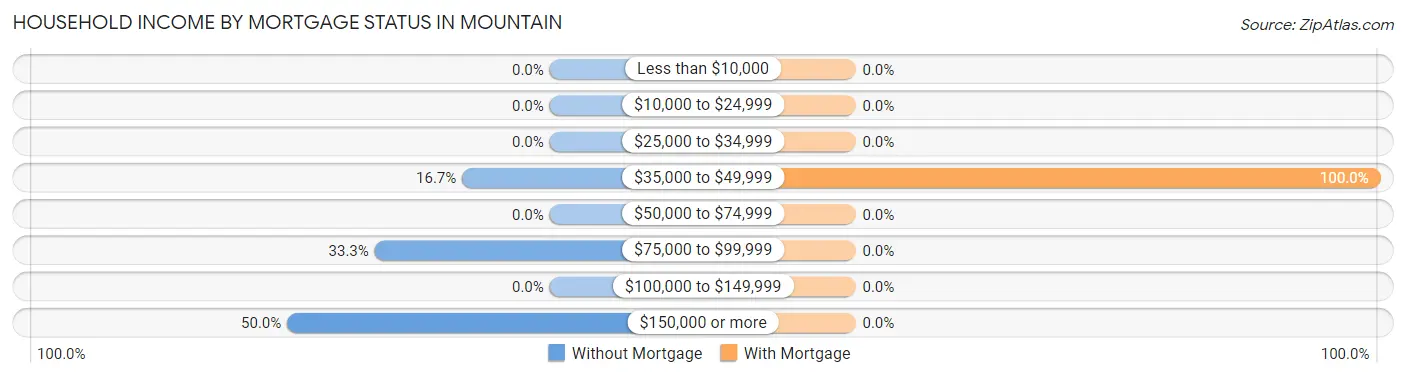
| Household Income | Without Mortgage | With Mortgage |
| Less than $10,000 | 0 (0.0%) | 0 (0.0%) |
| $10,000 to $24,999 | 0 (0.0%) | 0 (0.0%) |
| $25,000 to $34,999 | 0 (0.0%) | 0 (0.0%) |
| $35,000 to $49,999 | 1 (16.7%) | 6 (100.0%) |
| $50,000 to $74,999 | 0 (0.0%) | 0 (0.0%) |
| $75,000 to $99,999 | 2 (33.3%) | 0 (0.0%) |
| $100,000 to $149,999 | 0 (0.0%) | 0 (0.0%) |
| $150,000 or more | 3 (50.0%) | 0 (0.0%) |
| Total | 6 (100.0%) | 6 (100.0%) |
Property Value to Household Income Ratio in Mountain
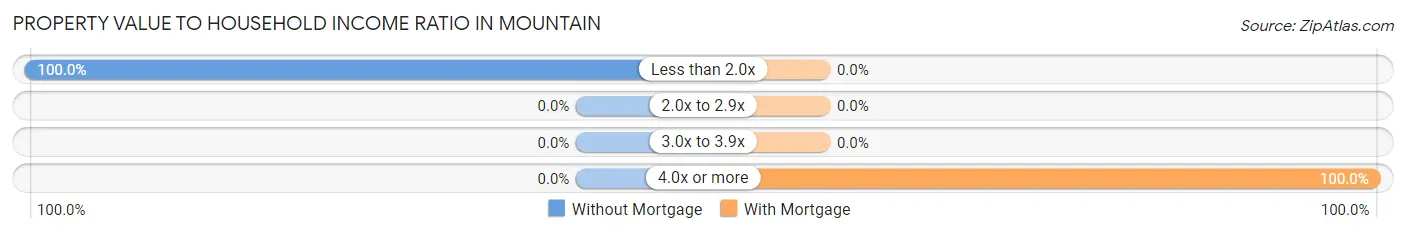
| Value-to-Income Ratio | Without Mortgage | With Mortgage |
| Less than 2.0x | 6 (100.0%) | 0 (0.0%) |
| 2.0x to 2.9x | 0 (0.0%) | 0 (0.0%) |
| 3.0x to 3.9x | 0 (0.0%) | 0 (0.0%) |
| 4.0x or more | 0 (0.0%) | 6 (100.0%) |
| Total | 6 (100.0%) | 6 (100.0%) |
Real Estate Taxes by Mortgage Status in Mountain
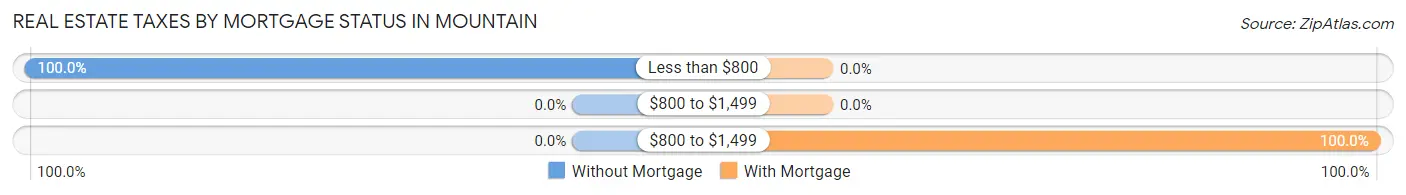
| Property Taxes | Without Mortgage | With Mortgage |
| Less than $800 | 6 (100.0%) | 0 (0.0%) |
| $800 to $1,499 | 0 (0.0%) | 0 (0.0%) |
| $800 to $1,499 | 0 (0.0%) | 6 (100.0%) |
| Total | 6 (100.0%) | 6 (100.0%) |
Health & Disability in Mountain
Health Insurance Coverage by Age in Mountain
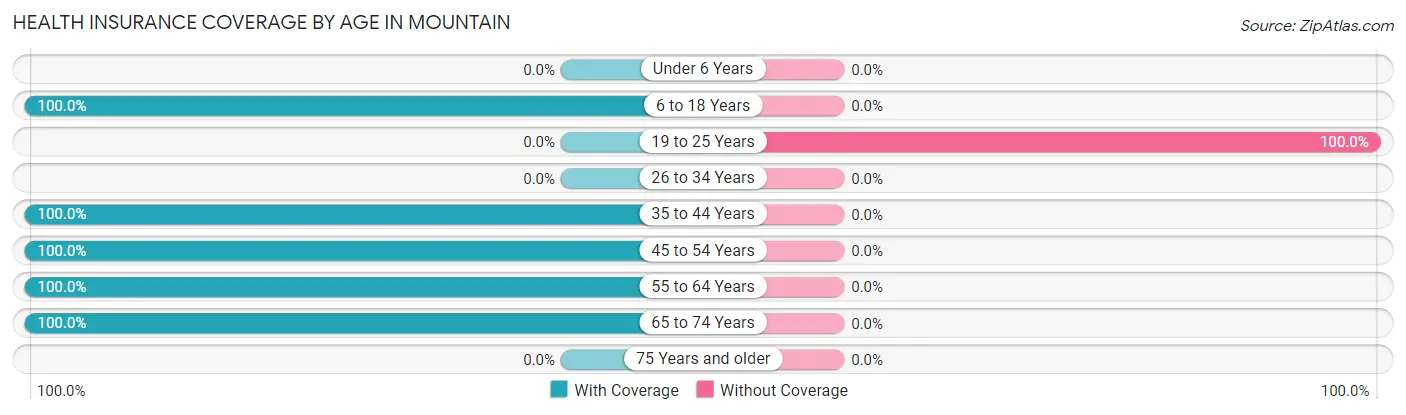
| Age Bracket | With Coverage | Without Coverage |
| Under 6 Years | 0 (0.0%) | 0 (0.0%) |
| 6 to 18 Years | 5 (100.0%) | 0 (0.0%) |
| 19 to 25 Years | 0 (0.0%) | 2 (100.0%) |
| 26 to 34 Years | 0 (0.0%) | 0 (0.0%) |
| 35 to 44 Years | 3 (100.0%) | 0 (0.0%) |
| 45 to 54 Years | 3 (100.0%) | 0 (0.0%) |
| 55 to 64 Years | 4 (100.0%) | 0 (0.0%) |
| 65 to 74 Years | 24 (100.0%) | 0 (0.0%) |
| 75 Years and older | 0 (0.0%) | 0 (0.0%) |
| Total | 39 (95.1%) | 2 (4.9%) |
Health Insurance Coverage by Citizenship Status in Mountain
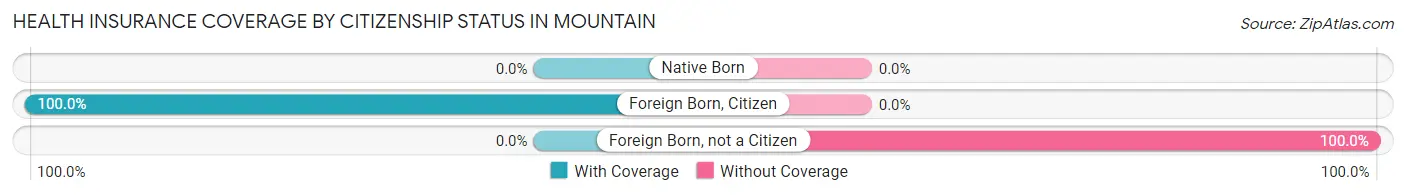
| Citizenship Status | With Coverage | Without Coverage |
| Native Born | 0 (0.0%) | 0 (0.0%) |
| Foreign Born, Citizen | 5 (100.0%) | 0 (0.0%) |
| Foreign Born, not a Citizen | 0 (0.0%) | 2 (100.0%) |
Health Insurance Coverage by Household Income in Mountain
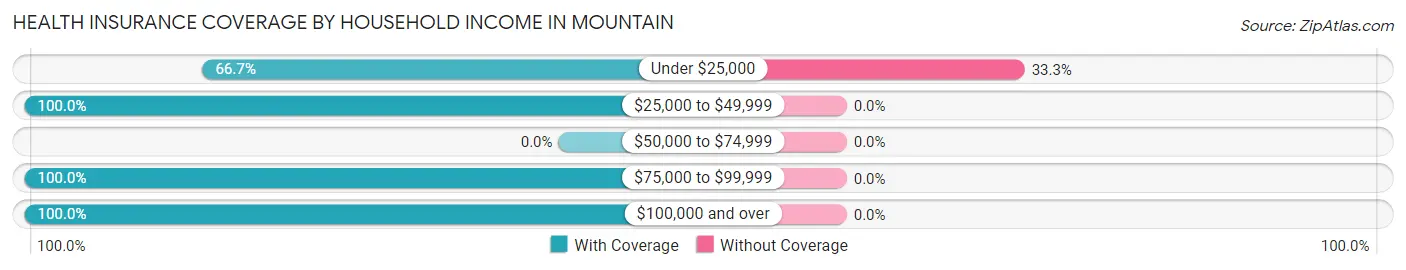
| Household Income | With Coverage | Without Coverage |
| Under $25,000 | 4 (66.7%) | 2 (33.3%) |
| $25,000 to $49,999 | 17 (100.0%) | 0 (0.0%) |
| $50,000 to $74,999 | 0 (0.0%) | 0 (0.0%) |
| $75,000 to $99,999 | 7 (100.0%) | 0 (0.0%) |
| $100,000 and over | 11 (100.0%) | 0 (0.0%) |
Public vs Private Health Insurance Coverage by Age in Mountain
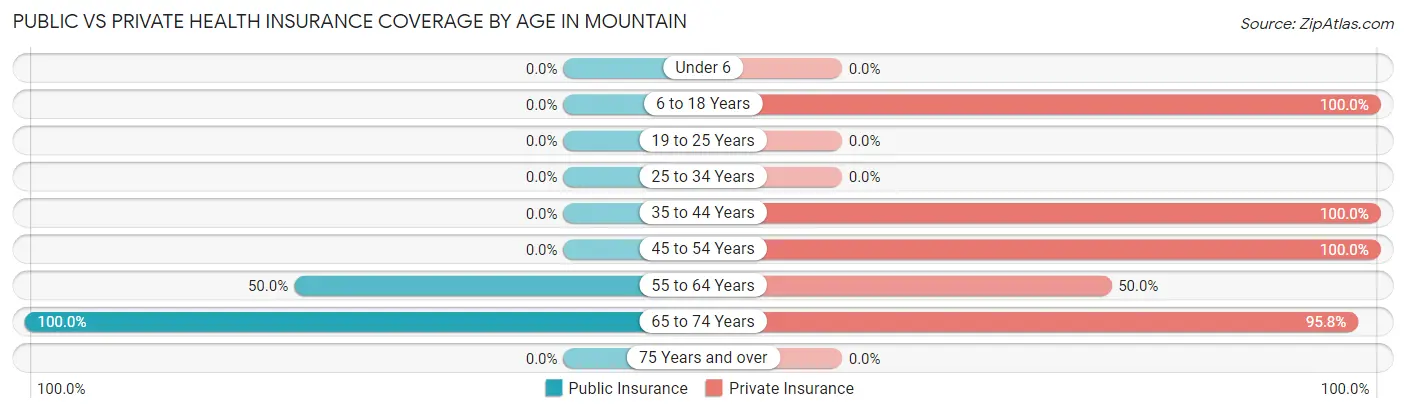
| Age Bracket | Public Insurance | Private Insurance |
| Under 6 | 0 (0.0%) | 0 (0.0%) |
| 6 to 18 Years | 0 (0.0%) | 5 (100.0%) |
| 19 to 25 Years | 0 (0.0%) | 0 (0.0%) |
| 25 to 34 Years | 0 (0.0%) | 0 (0.0%) |
| 35 to 44 Years | 0 (0.0%) | 3 (100.0%) |
| 45 to 54 Years | 0 (0.0%) | 3 (100.0%) |
| 55 to 64 Years | 2 (50.0%) | 2 (50.0%) |
| 65 to 74 Years | 24 (100.0%) | 23 (95.8%) |
| 75 Years and over | 0 (0.0%) | 0 (0.0%) |
| Total | 26 (63.4%) | 36 (87.8%) |
Disability Status by Sex by Age in Mountain
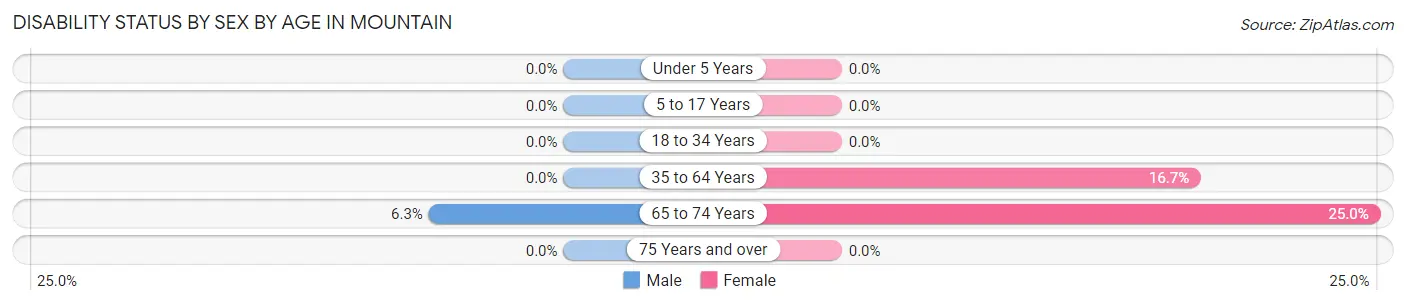
| Age Bracket | Male | Female |
| Under 5 Years | 0 (0.0%) | 0 (0.0%) |
| 5 to 17 Years | 0 (0.0%) | 0 (0.0%) |
| 18 to 34 Years | 0 (0.0%) | 0 (0.0%) |
| 35 to 64 Years | 0 (0.0%) | 1 (16.7%) |
| 65 to 74 Years | 1 (6.2%) | 2 (25.0%) |
| 75 Years and over | 0 (0.0%) | 0 (0.0%) |
Disability Class by Sex by Age in Mountain
Disability Class: Hearing Difficulty
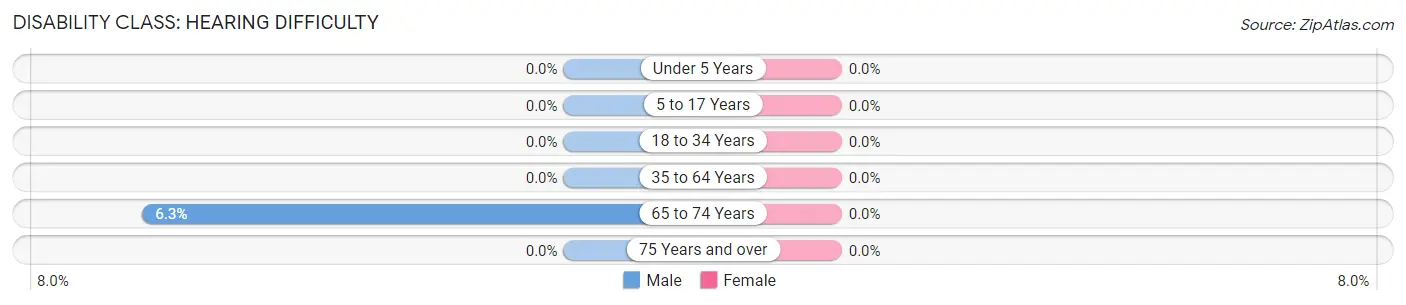
| Age Bracket | Male | Female |
| Under 5 Years | 0 (0.0%) | 0 (0.0%) |
| 5 to 17 Years | 0 (0.0%) | 0 (0.0%) |
| 18 to 34 Years | 0 (0.0%) | 0 (0.0%) |
| 35 to 64 Years | 0 (0.0%) | 0 (0.0%) |
| 65 to 74 Years | 1 (6.2%) | 0 (0.0%) |
| 75 Years and over | 0 (0.0%) | 0 (0.0%) |
Disability Class: Vision Difficulty
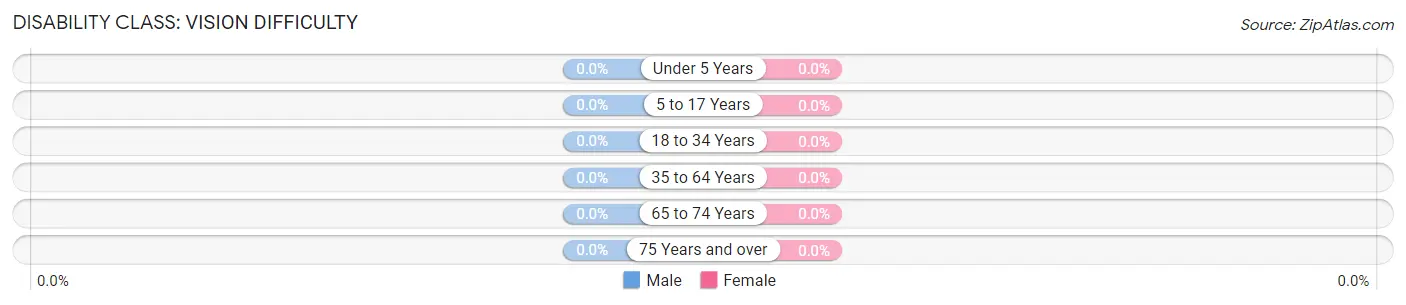
| Age Bracket | Male | Female |
| Under 5 Years | 0 (0.0%) | 0 (0.0%) |
| 5 to 17 Years | 0 (0.0%) | 0 (0.0%) |
| 18 to 34 Years | 0 (0.0%) | 0 (0.0%) |
| 35 to 64 Years | 0 (0.0%) | 0 (0.0%) |
| 65 to 74 Years | 0 (0.0%) | 0 (0.0%) |
| 75 Years and over | 0 (0.0%) | 0 (0.0%) |
Disability Class: Cognitive Difficulty
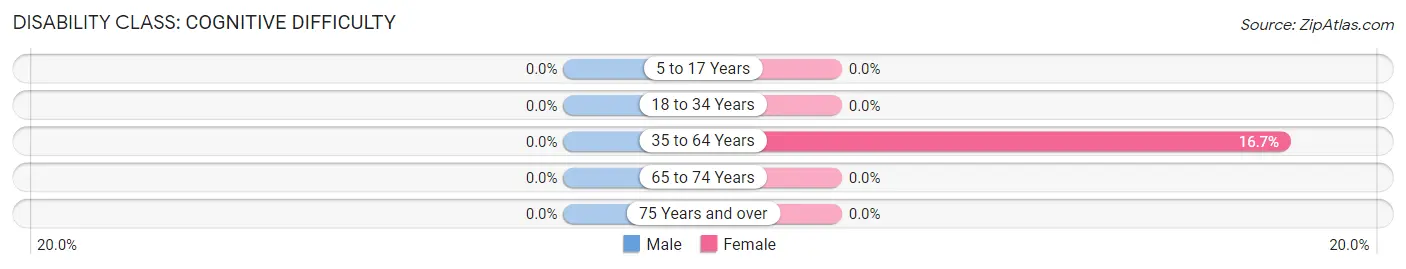
| Age Bracket | Male | Female |
| 5 to 17 Years | 0 (0.0%) | 0 (0.0%) |
| 18 to 34 Years | 0 (0.0%) | 0 (0.0%) |
| 35 to 64 Years | 0 (0.0%) | 1 (16.7%) |
| 65 to 74 Years | 0 (0.0%) | 0 (0.0%) |
| 75 Years and over | 0 (0.0%) | 0 (0.0%) |
Disability Class: Ambulatory Difficulty
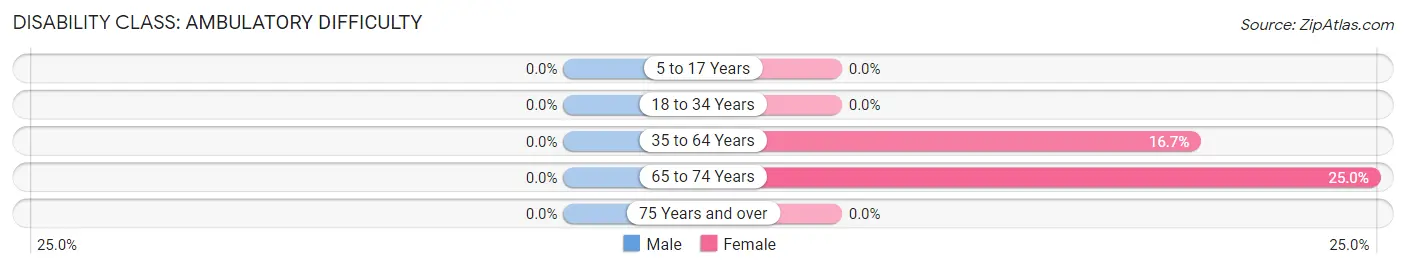
| Age Bracket | Male | Female |
| 5 to 17 Years | 0 (0.0%) | 0 (0.0%) |
| 18 to 34 Years | 0 (0.0%) | 0 (0.0%) |
| 35 to 64 Years | 0 (0.0%) | 1 (16.7%) |
| 65 to 74 Years | 0 (0.0%) | 2 (25.0%) |
| 75 Years and over | 0 (0.0%) | 0 (0.0%) |
Disability Class: Self-Care Difficulty
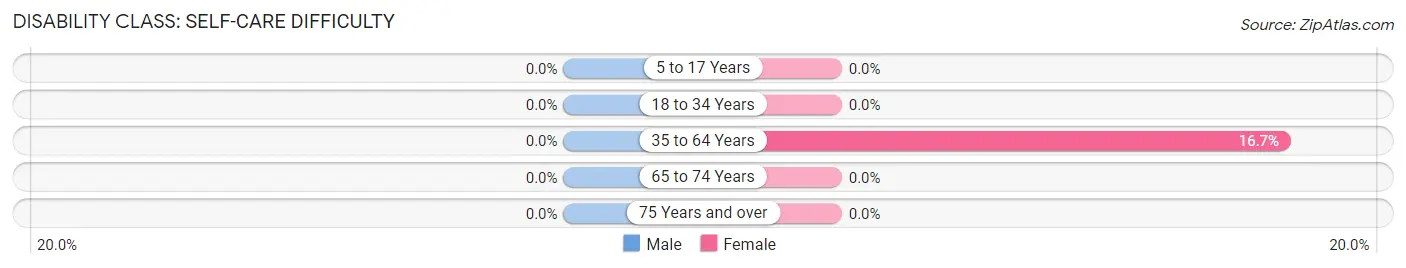
| Age Bracket | Male | Female |
| 5 to 17 Years | 0 (0.0%) | 0 (0.0%) |
| 18 to 34 Years | 0 (0.0%) | 0 (0.0%) |
| 35 to 64 Years | 0 (0.0%) | 1 (16.7%) |
| 65 to 74 Years | 0 (0.0%) | 0 (0.0%) |
| 75 Years and over | 0 (0.0%) | 0 (0.0%) |
Technology Access in Mountain
Computing Device Access in Mountain
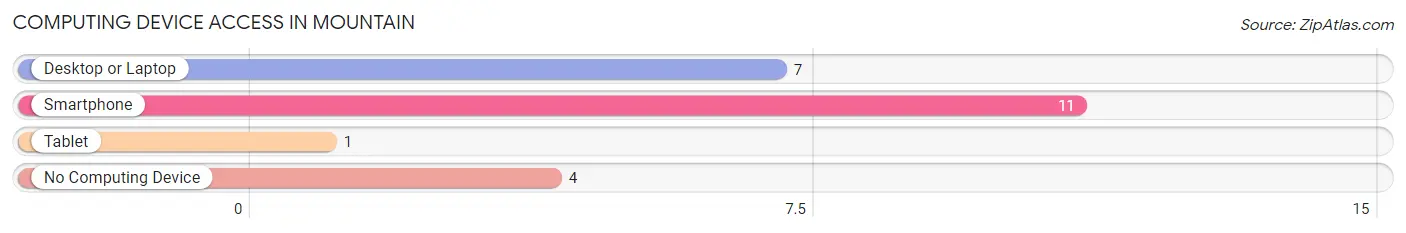
| Device Type | # Households | % Households |
| Desktop or Laptop | 7 | 38.9% |
| Smartphone | 11 | 61.1% |
| Tablet | 1 | 5.6% |
| No Computing Device | 4 | 22.2% |
| Total | 18 | 100.0% |
Internet Access in Mountain
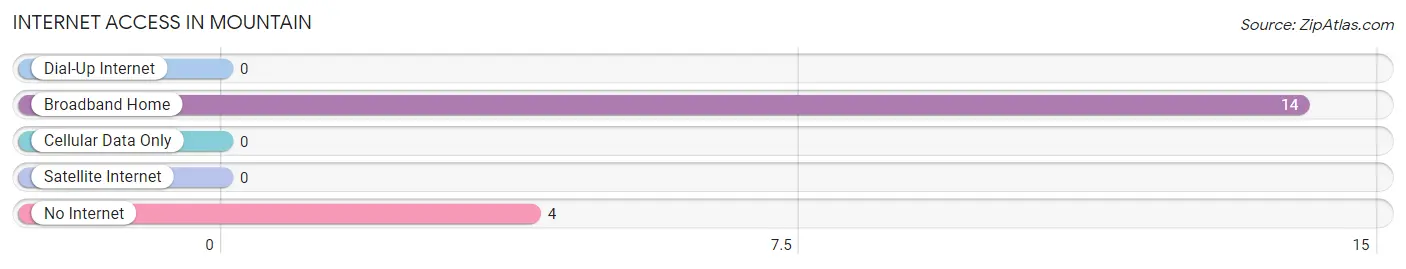
| Internet Type | # Households | % Households |
| Dial-Up Internet | 0 | 0.0% |
| Broadband Home | 14 | 77.8% |
| Cellular Data Only | 0 | 0.0% |
| Satellite Internet | 0 | 0.0% |
| No Internet | 4 | 22.2% |
| Total | 18 | 100.0% |
Mountain Summary
Mountain, North Dakota is a small town located in the southwestern corner of the state. It is situated in the foothills of the Little Missouri National Grassland, and is surrounded by rolling hills and prairies. The town has a population of just over 500 people, and is the county seat of Grant County.
History
Mountain was founded in 1883 by a group of settlers from Wisconsin. The town was named after the nearby mountain range, and was originally intended to be a trading post for the area. The first post office was established in 1884, and the town was officially incorporated in 1887.
The town grew slowly over the years, and by the turn of the century it had a population of just over 200 people. The town was primarily an agricultural community, and the main crops grown were wheat, oats, and barley.
In the early 1900s, the town began to experience a period of growth. The railroad arrived in 1906, and the town was connected to the rest of the state. This allowed for the development of new businesses, and the population of the town began to grow.
By the mid-1900s, the town had become a popular tourist destination. The nearby Little Missouri National Grassland was a popular spot for camping and fishing, and the town was also home to a number of historic sites.
Geography
Mountain is located in the southwestern corner of North Dakota, in the foothills of the Little Missouri National Grassland. The town is situated at an elevation of 2,400 feet, and is surrounded by rolling hills and prairies. The town is located approximately 30 miles from the Montana border, and is about an hour and a half drive from the state capital of Bismarck.
The town is located in a semi-arid climate, and experiences hot summers and cold winters. The average annual temperature is around 50 degrees Fahrenheit, and the average annual precipitation is around 16 inches.
Economy
Mountain’s economy is primarily based on agriculture and tourism. The town is home to a number of farms, and the main crops grown are wheat, oats, and barley. The town is also home to a number of small businesses, including restaurants, shops, and hotels.
The town is also a popular tourist destination, and the nearby Little Missouri National Grassland is a popular spot for camping and fishing. The town is also home to a number of historic sites, including the Grant County Courthouse and the Mountain Historical Museum.
Demographics
As of the 2010 census, the population of Mountain was 514 people. The town is predominantly white, with 92.3% of the population identifying as white. The town also has a small Hispanic population, with 4.3% of the population identifying as Hispanic or Latino. The median household income in the town is $41,250, and the median home value is $90,000.
Common Questions
What is Per Capita Income in Mountain?
Per Capita income in Mountain is $25,320.
What is the Median Household income in Mountain?
Median Household Income in Mountain is $26,250.
What is Inequality or Gini Index in Mountain?
Inequality or Gini Index in Mountain is 0.67.
What is the Total Population of Mountain?
Total Population of Mountain is 97.
What is the Total Male Population of Mountain?
Total Male Population of Mountain is 70.
What is the Total Female Population of Mountain?
Total Female Population of Mountain is 27.
What is the Ratio of Males per 100 Females in Mountain?
There are 259.26 Males per 100 Females in Mountain.
What is the Ratio of Females per 100 Males in Mountain?
There are 38.57 Females per 100 Males in Mountain.
What is the Median Population Age in Mountain?
Median Population Age in Mountain is 69.8 Years.
What is the Average Family Size in Mountain
Average Family Size in Mountain is 3.1 People.
What is the Average Household Size in Mountain
Average Household Size in Mountain is 2.3 People.
How Large is the Labor Force in Mountain?
There are 10 People in the Labor Forcein in Mountain.
What is the Percentage of People in the Labor Force in Mountain?
10.9% of People are in the Labor Force in Mountain.
What is the Unemployment Rate in Mountain?
Unemployment Rate in Mountain is 20.0%.