Walhalla, ND Map & Demographics
Walhalla Map
Walhalla Overview
$28,546
PER CAPITA INCOME
$69,167
AVG FAMILY INCOME
$28,542
AVG HOUSEHOLD INCOME
43.3%
WAGE / INCOME GAP [ % ]
56.7¢/ $1
WAGE / INCOME GAP [ $ ]
0.52
INEQUALITY / GINI INDEX
910
TOTAL POPULATION
531
MALE POPULATION
379
FEMALE POPULATION
140.11
MALES / 100 FEMALES
71.37
FEMALES / 100 MALES
49.4
MEDIAN AGE
2.9
AVG FAMILY SIZE
1.8
AVG HOUSEHOLD SIZE
369
LABOR FORCE [ PEOPLE ]
47.4%
PERCENT IN LABOR FORCE
4.3%
UNEMPLOYMENT RATE
Walhalla Zip Codes
Walhalla Area Codes
Income in Walhalla
Income Overview in Walhalla
Per Capita Income in Walhalla is $28,546, while median incomes of families and households are $69,167 and $28,542 respectively.
| Characteristic | Number | Measure |
| Per Capita Income | 910 | $28,546 |
| Median Family Income | 184 | $69,167 |
| Mean Family Income | 184 | $87,278 |
| Median Household Income | 498 | $28,542 |
| Mean Household Income | 498 | $50,987 |
| Income Deficit | 184 | $0 |
| Wage / Income Gap (%) | 910 | 43.27% |
| Wage / Income Gap ($) | 910 | 56.73¢ per $1 |
| Gini / Inequality Index | 910 | 0.52 |
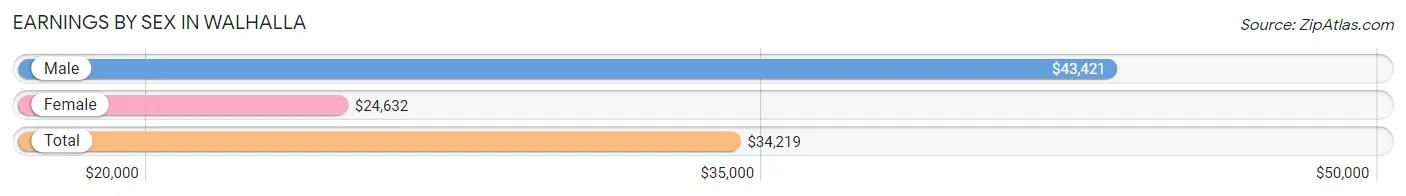
Earnings by Sex in Walhalla
Average Earnings in Walhalla are $34,219, $43,421 for men and $24,632 for women, a difference of 43.3%.
| Sex | Number | Average Earnings |
| Male | 258 (58.0%) | $43,421 |
| Female | 187 (42.0%) | $24,632 |
| Total | 445 (100.0%) | $34,219 |
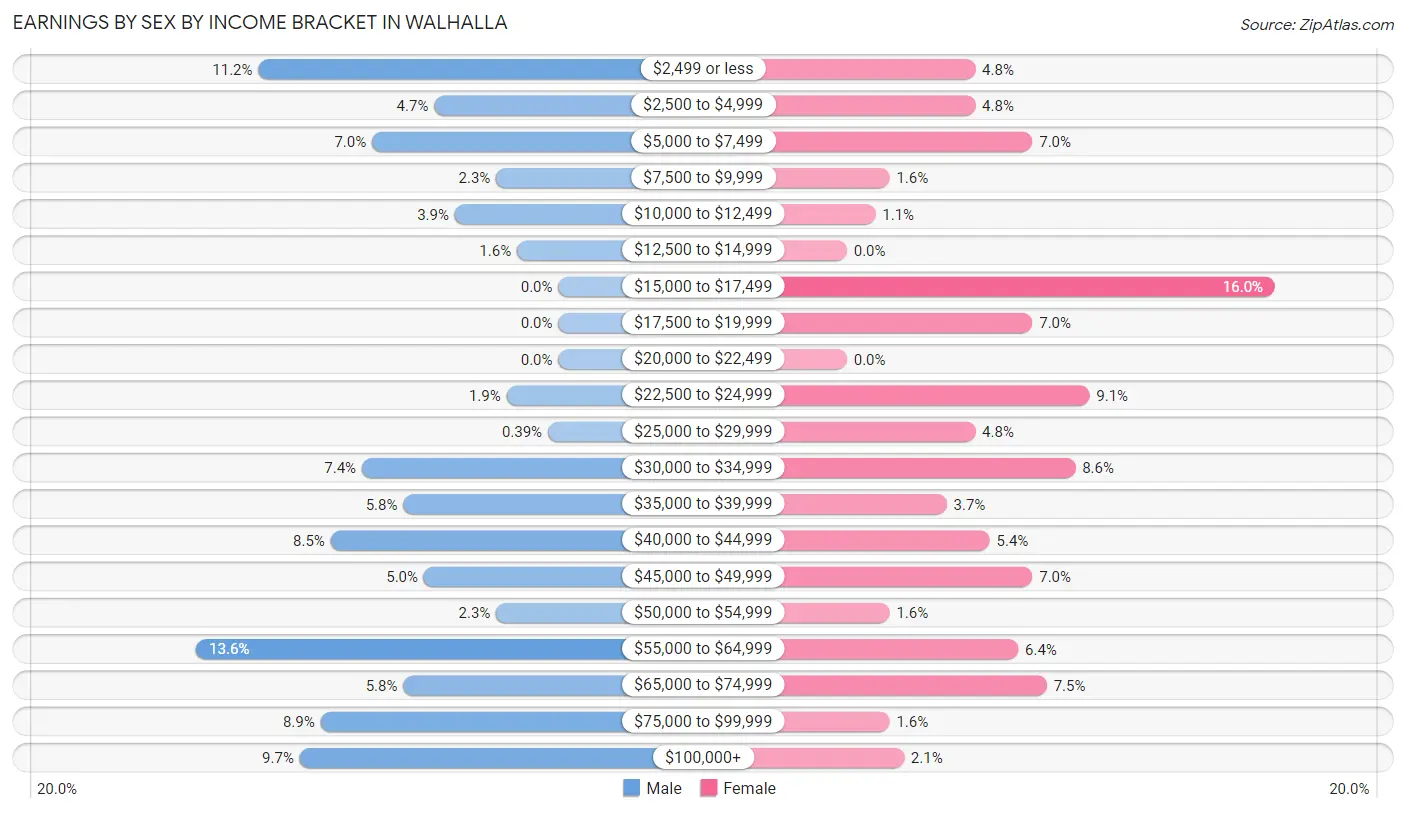
Earnings by Sex by Income Bracket in Walhalla
The most common earnings brackets in Walhalla are $55,000 to $64,999 for men (35 | 13.6%) and $15,000 to $17,499 for women (30 | 16.0%).
| Income | Male | Female |
| $2,499 or less | 29 (11.2%) | 9 (4.8%) |
| $2,500 to $4,999 | 12 (4.6%) | 9 (4.8%) |
| $5,000 to $7,499 | 18 (7.0%) | 13 (7.0%) |
| $7,500 to $9,999 | 6 (2.3%) | 3 (1.6%) |
| $10,000 to $12,499 | 10 (3.9%) | 2 (1.1%) |
| $12,500 to $14,999 | 4 (1.5%) | 0 (0.0%) |
| $15,000 to $17,499 | 0 (0.0%) | 30 (16.0%) |
| $17,500 to $19,999 | 0 (0.0%) | 13 (7.0%) |
| $20,000 to $22,499 | 0 (0.0%) | 0 (0.0%) |
| $22,500 to $24,999 | 5 (1.9%) | 17 (9.1%) |
| $25,000 to $29,999 | 1 (0.4%) | 9 (4.8%) |
| $30,000 to $34,999 | 19 (7.4%) | 16 (8.6%) |
| $35,000 to $39,999 | 15 (5.8%) | 7 (3.7%) |
| $40,000 to $44,999 | 22 (8.5%) | 10 (5.3%) |
| $45,000 to $49,999 | 13 (5.0%) | 13 (7.0%) |
| $50,000 to $54,999 | 6 (2.3%) | 3 (1.6%) |
| $55,000 to $64,999 | 35 (13.6%) | 12 (6.4%) |
| $65,000 to $74,999 | 15 (5.8%) | 14 (7.5%) |
| $75,000 to $99,999 | 23 (8.9%) | 3 (1.6%) |
| $100,000+ | 25 (9.7%) | 4 (2.1%) |
| Total | 258 (100.0%) | 187 (100.0%) |
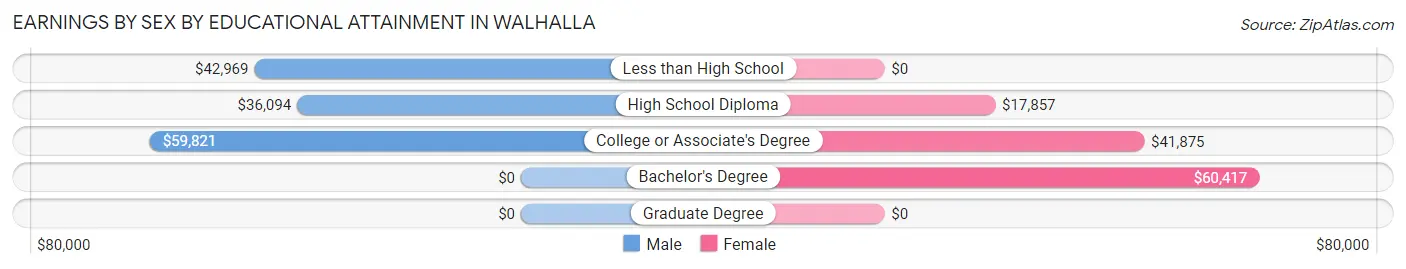
Earnings by Sex by Educational Attainment in Walhalla
Average earnings in Walhalla are $46,058 for men and $32,375 for women, a difference of 29.7%. Men with an educational attainment of college or associate's degree enjoy the highest average annual earnings of $59,821, while those with high school diploma education earn the least with $36,094. Women with an educational attainment of bachelor's degree earn the most with the average annual earnings of $60,417, while those with high school diploma education have the smallest earnings of $17,857.
| Educational Attainment | Male Income | Female Income |
| Less than High School | $42,969 | $0 |
| High School Diploma | $36,094 | $17,857 |
| College or Associate's Degree | $59,821 | $41,875 |
| Bachelor's Degree | - | - |
| Graduate Degree | - | - |
| Total | $46,058 | $32,375 |
Family Income in Walhalla
Family Income Brackets in Walhalla
According to the Walhalla family income data, there are 43 families falling into the $100,000 to $149,999 income range, which is the most common income bracket and makes up 23.4% of all families.
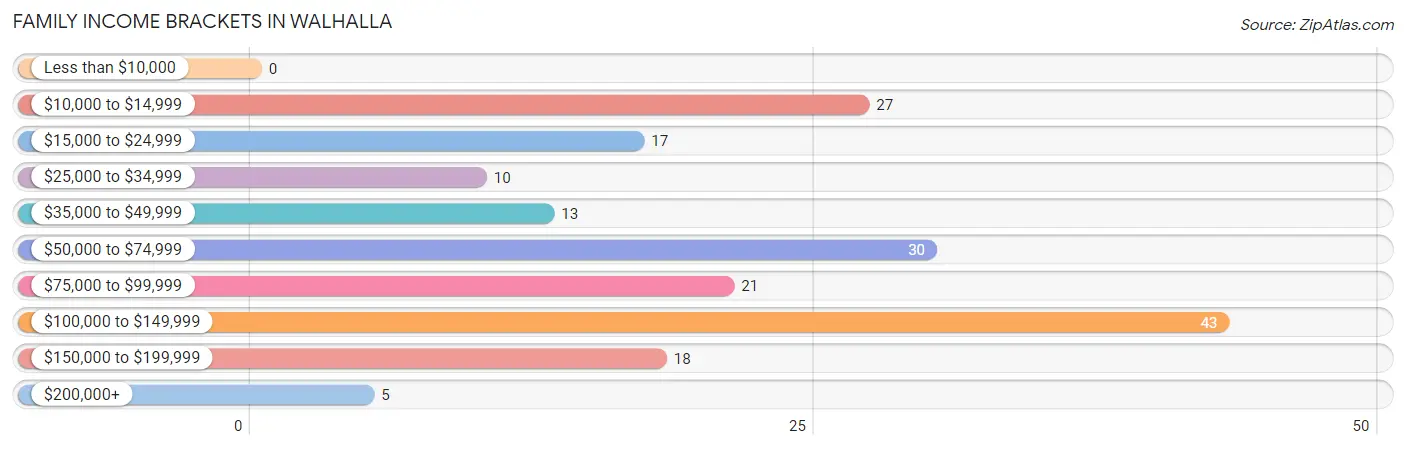
| Income Bracket | # Families | % Families |
| Less than $10,000 | 0 | 0.0% |
| $10,000 to $14,999 | 27 | 14.7% |
| $15,000 to $24,999 | 17 | 9.2% |
| $25,000 to $34,999 | 10 | 5.4% |
| $35,000 to $49,999 | 13 | 7.1% |
| $50,000 to $74,999 | 30 | 16.3% |
| $75,000 to $99,999 | 21 | 11.4% |
| $100,000 to $149,999 | 43 | 23.4% |
| $150,000 to $199,999 | 18 | 9.8% |
| $200,000+ | 5 | 2.7% |
Family Income by Famaliy Size in Walhalla
4-person families (31 | 16.9%) account for the highest median family income in Walhalla with $104,375 per family, while 3-person families (35 | 19.0%) have the highest median income of $33,542 per family member.
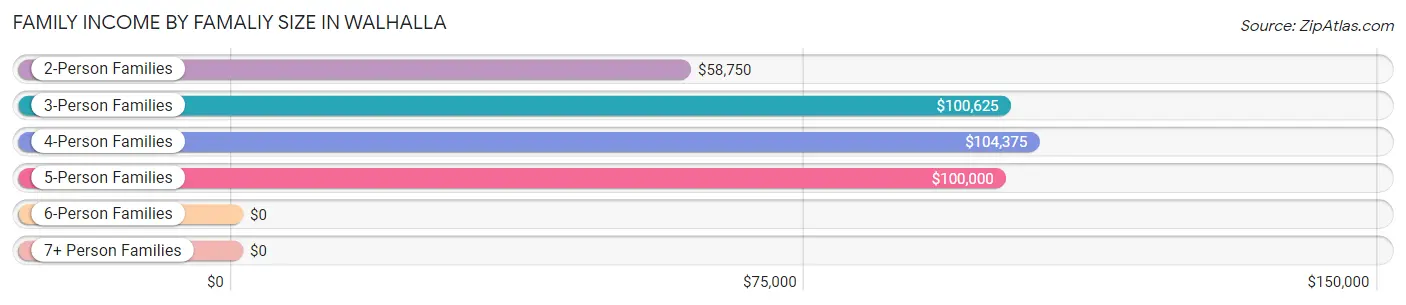
| Income Bracket | # Families | Median Income |
| 2-Person Families | 106 (57.6%) | $58,750 |
| 3-Person Families | 35 (19.0%) | $100,625 |
| 4-Person Families | 31 (16.9%) | $104,375 |
| 5-Person Families | 10 (5.4%) | $100,000 |
| 6-Person Families | 2 (1.1%) | $0 |
| 7+ Person Families | 0 (0.0%) | $0 |
| Total | 184 (100.0%) | $69,167 |
Family Income by Number of Earners in Walhalla
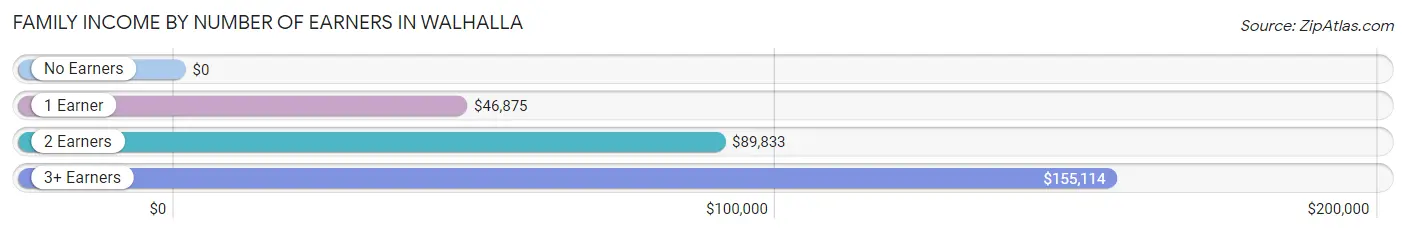
| Number of Earners | # Families | Median Income |
| No Earners | 49 (26.6%) | $0 |
| 1 Earner | 46 (25.0%) | $46,875 |
| 2 Earners | 68 (37.0%) | $89,833 |
| 3+ Earners | 21 (11.4%) | $155,114 |
| Total | 184 (100.0%) | $69,167 |
Household Income in Walhalla
Household Income Brackets in Walhalla
With 138 households falling in the category, the $15,000 to $24,999 income range is the most frequent in Walhalla, accounting for 27.7% of all households. In contrast, only 5 households (1.0%) fall into the $200,000+ income bracket, making it the least populous group.
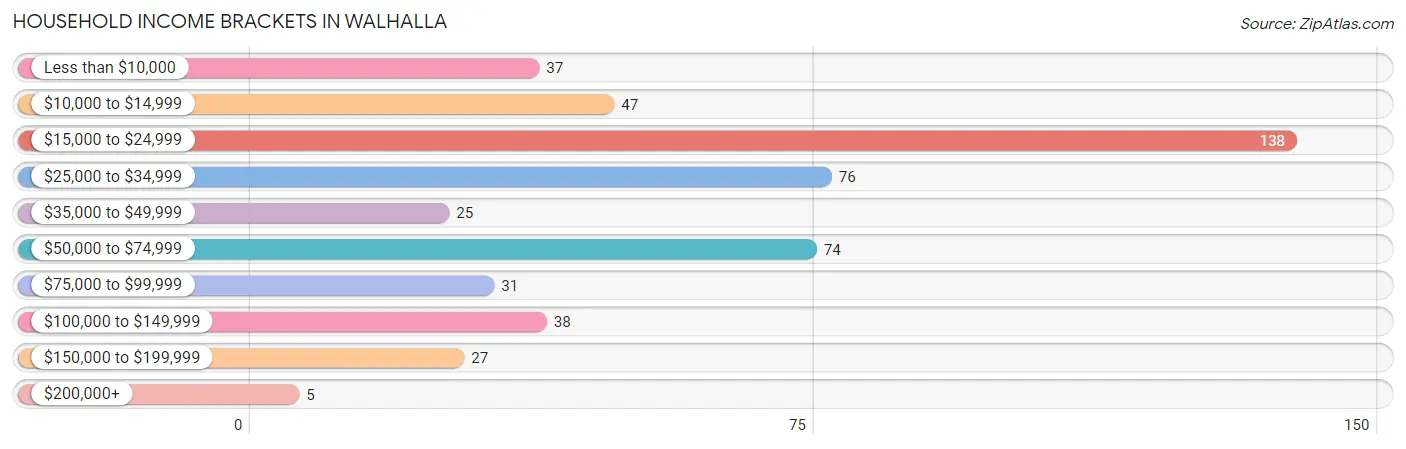
| Income Bracket | # Households | % Households |
| Less than $10,000 | 37 | 7.4% |
| $10,000 to $14,999 | 47 | 9.4% |
| $15,000 to $24,999 | 138 | 27.7% |
| $25,000 to $34,999 | 76 | 15.3% |
| $35,000 to $49,999 | 25 | 5.0% |
| $50,000 to $74,999 | 74 | 14.9% |
| $75,000 to $99,999 | 31 | 6.2% |
| $100,000 to $149,999 | 38 | 7.6% |
| $150,000 to $199,999 | 27 | 5.4% |
| $200,000+ | 5 | 1.0% |
Household Income by Householder Age in Walhalla
The median household income in Walhalla is $28,542, with the highest median household income of $58,750 found in the 45 to 64 years age bracket for the primary householder. A total of 133 households (26.7%) fall into this category. Meanwhile, the 65+ years age bracket for the primary householder has the lowest median household income of $20,764, with 205 households (41.2%) in this group.
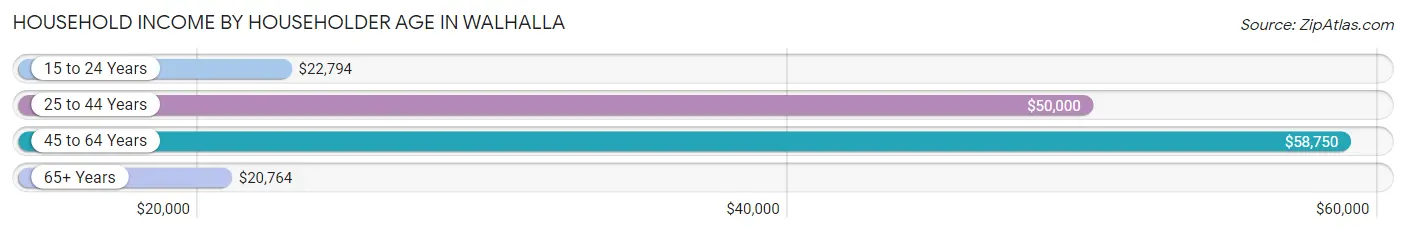
| Income Bracket | # Households | Median Income |
| 15 to 24 Years | 36 (7.2%) | $22,794 |
| 25 to 44 Years | 124 (24.9%) | $50,000 |
| 45 to 64 Years | 133 (26.7%) | $58,750 |
| 65+ Years | 205 (41.2%) | $20,764 |
| Total | 498 (100.0%) | $28,542 |
Poverty in Walhalla
Income Below Poverty by Sex and Age in Walhalla
With 23.3% poverty level for males and 16.3% for females among the residents of Walhalla, 15 year old males and 65 to 74 year old females are the most vulnerable to poverty, with 1 males (100.0%) and 21 females (28.0%) in their respective age groups living below the poverty level.
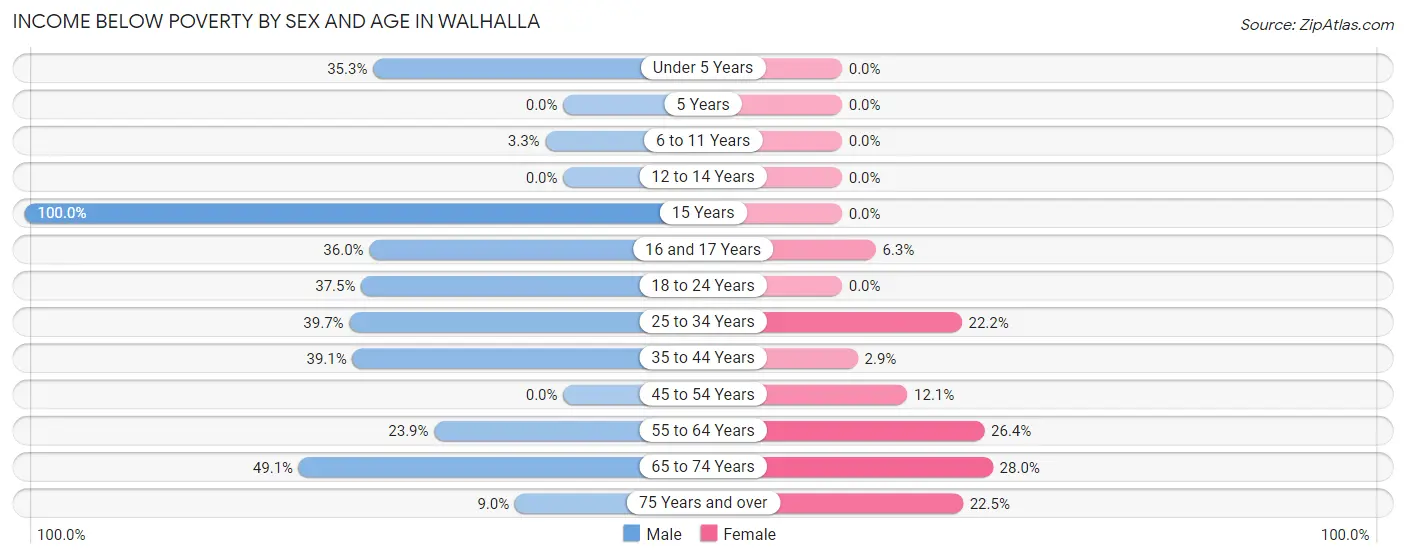
| Age Bracket | Male | Female |
| Under 5 Years | 12 (35.3%) | 0 (0.0%) |
| 5 Years | 0 (0.0%) | 0 (0.0%) |
| 6 to 11 Years | 1 (3.3%) | 0 (0.0%) |
| 12 to 14 Years | 0 (0.0%) | 0 (0.0%) |
| 15 Years | 1 (100.0%) | 0 (0.0%) |
| 16 and 17 Years | 9 (36.0%) | 1 (6.2%) |
| 18 to 24 Years | 9 (37.5%) | 0 (0.0%) |
| 25 to 34 Years | 27 (39.7%) | 6 (22.2%) |
| 35 to 44 Years | 9 (39.1%) | 1 (2.9%) |
| 45 to 54 Years | 0 (0.0%) | 4 (12.1%) |
| 55 to 64 Years | 17 (23.9%) | 14 (26.4%) |
| 65 to 74 Years | 27 (49.1%) | 21 (28.0%) |
| 75 Years and over | 7 (9.0%) | 11 (22.5%) |
| Total | 119 (23.3%) | 58 (16.3%) |
Income Above Poverty by Sex and Age in Walhalla
According to the poverty statistics in Walhalla, males aged 12 to 14 years and females aged under 5 years are the age groups that are most secure financially, with 100.0% of males and 100.0% of females in these age groups living above the poverty line.
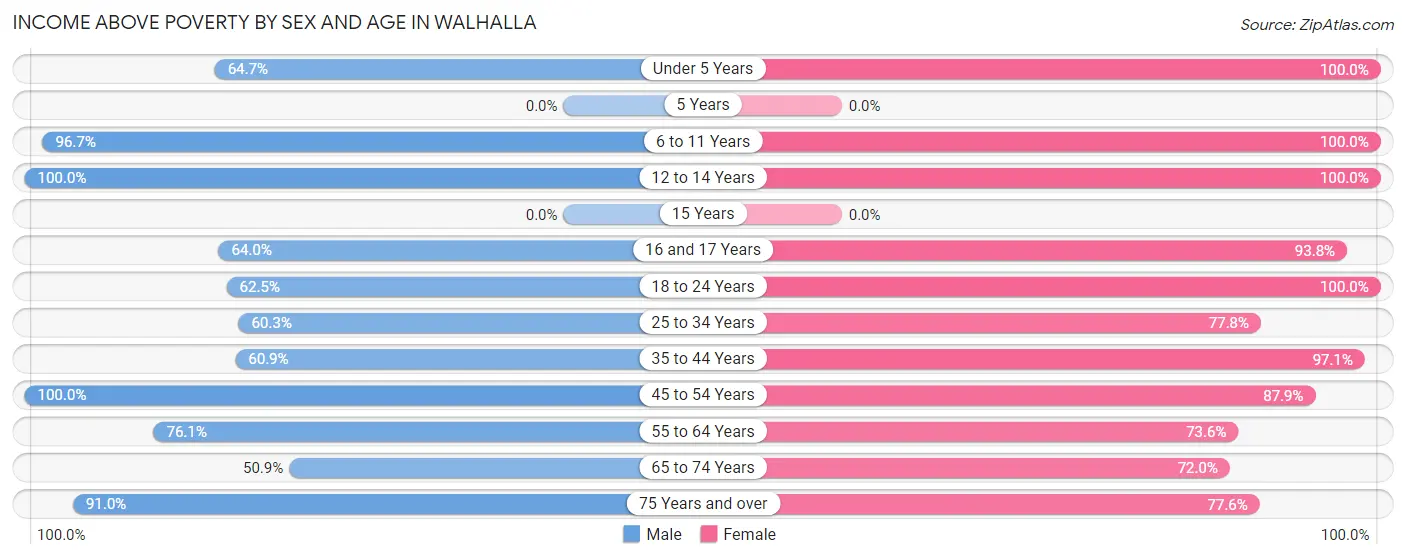
| Age Bracket | Male | Female |
| Under 5 Years | 22 (64.7%) | 11 (100.0%) |
| 5 Years | 0 (0.0%) | 0 (0.0%) |
| 6 to 11 Years | 29 (96.7%) | 9 (100.0%) |
| 12 to 14 Years | 37 (100.0%) | 4 (100.0%) |
| 15 Years | 0 (0.0%) | 0 (0.0%) |
| 16 and 17 Years | 16 (64.0%) | 15 (93.8%) |
| 18 to 24 Years | 15 (62.5%) | 44 (100.0%) |
| 25 to 34 Years | 41 (60.3%) | 21 (77.8%) |
| 35 to 44 Years | 14 (60.9%) | 33 (97.1%) |
| 45 to 54 Years | 64 (100.0%) | 29 (87.9%) |
| 55 to 64 Years | 54 (76.1%) | 39 (73.6%) |
| 65 to 74 Years | 28 (50.9%) | 54 (72.0%) |
| 75 Years and over | 71 (91.0%) | 38 (77.5%) |
| Total | 391 (76.7%) | 297 (83.7%) |
Income Below Poverty Among Married-Couple Families in Walhalla
The poverty statistics for married-couple families in Walhalla show that 21.9% or 34 of the total 155 families live below the poverty line. Families with no children have the highest poverty rate of 25.7%, comprising of 27 families. On the other hand, families with 1 or 2 children have the lowest poverty rate of 13.2%, which includes 5 families.
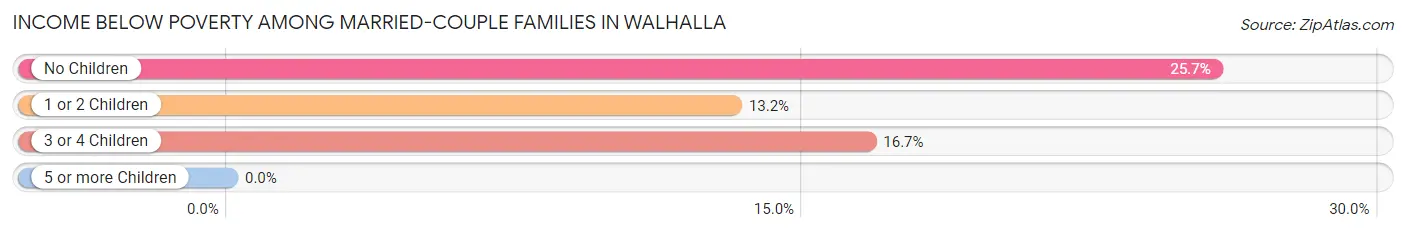
| Children | Above Poverty | Below Poverty |
| No Children | 78 (74.3%) | 27 (25.7%) |
| 1 or 2 Children | 33 (86.8%) | 5 (13.2%) |
| 3 or 4 Children | 10 (83.3%) | 2 (16.7%) |
| 5 or more Children | 0 (0.0%) | 0 (0.0%) |
| Total | 121 (78.1%) | 34 (21.9%) |
Income Below Poverty Among Single-Parent Households in Walhalla
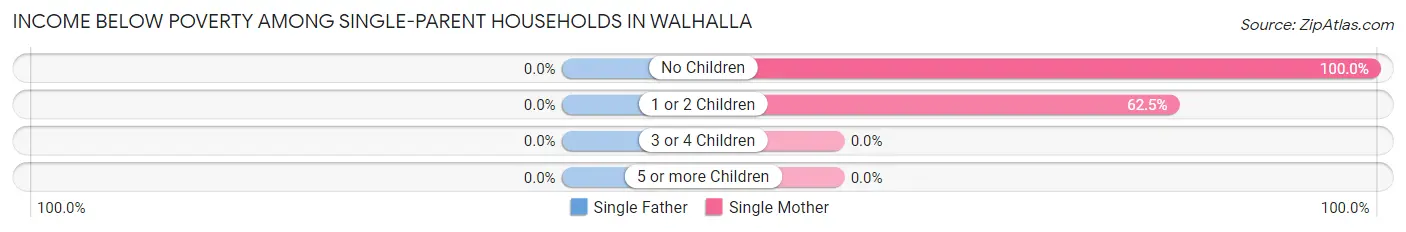
| Children | Single Father | Single Mother |
| No Children | 0 (0.0%) | 7 (100.0%) |
| 1 or 2 Children | 0 (0.0%) | 5 (62.5%) |
| 3 or 4 Children | 0 (0.0%) | 0 (0.0%) |
| 5 or more Children | 0 (0.0%) | 0 (0.0%) |
| Total | 0 (0.0%) | 12 (80.0%) |
Income Below Poverty Among Married-Couple vs Single-Parent Households in Walhalla
The poverty data for Walhalla shows that 34 of the married-couple family households (21.9%) and 12 of the single-parent households (41.4%) are living below the poverty level. Within the married-couple family households, those with no children have the highest poverty rate, with 27 households (25.7%) falling below the poverty line. Among the single-parent households, those with no children have the highest poverty rate, with 7 household (63.6%) living below poverty.
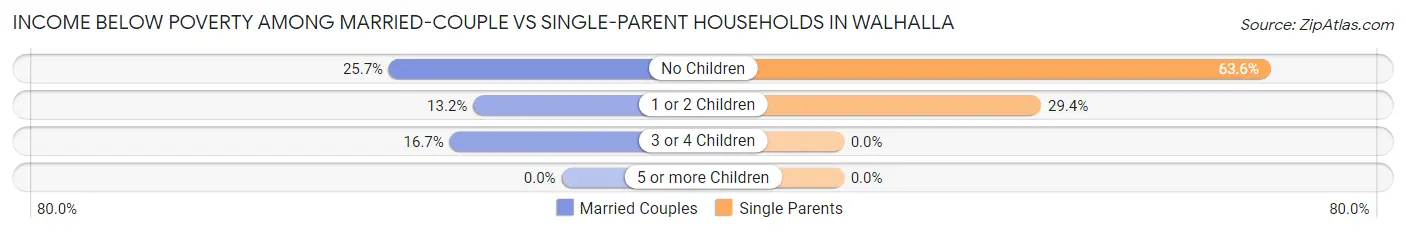
| Children | Married-Couple Families | Single-Parent Households |
| No Children | 27 (25.7%) | 7 (63.6%) |
| 1 or 2 Children | 5 (13.2%) | 5 (29.4%) |
| 3 or 4 Children | 2 (16.7%) | 0 (0.0%) |
| 5 or more Children | 0 (0.0%) | 0 (0.0%) |
| Total | 34 (21.9%) | 12 (41.4%) |
Race in Walhalla
The most populous races in Walhalla are White / Caucasian (716 | 78.7%), Two or more Races (95 | 10.4%), and Native / Alaskan (84 | 9.2%).
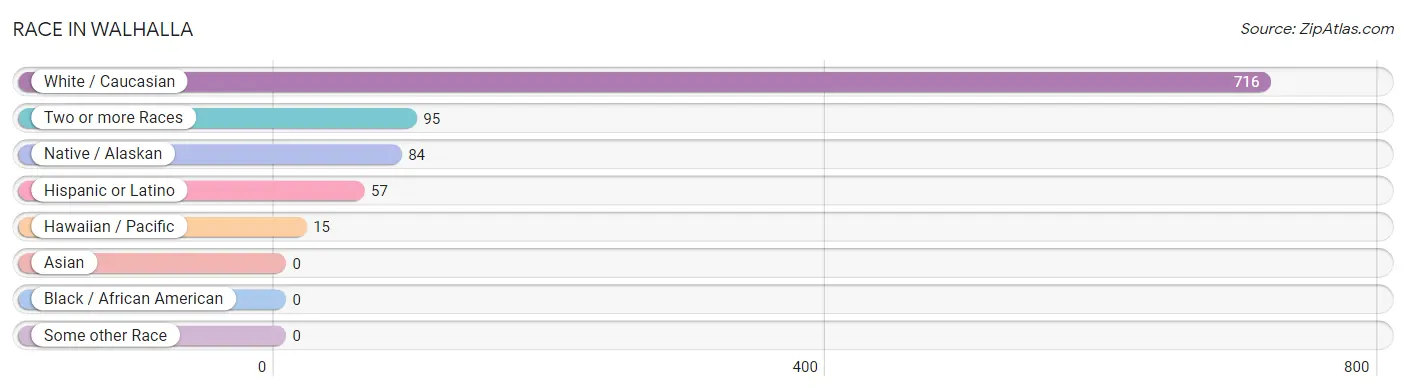
| Race | # Population | % Population |
| Asian | 0 | 0.0% |
| Black / African American | 0 | 0.0% |
| Hawaiian / Pacific | 15 | 1.7% |
| Hispanic or Latino | 57 | 6.3% |
| Native / Alaskan | 84 | 9.2% |
| White / Caucasian | 716 | 78.7% |
| Two or more Races | 95 | 10.4% |
| Some other Race | 0 | 0.0% |
| Total | 910 | 100.0% |
Ancestry in Walhalla
The most populous ancestries reported in Walhalla are German (178 | 19.6%), French (155 | 17.0%), Norwegian (115 | 12.6%), Chippewa (85 | 9.3%), and Irish (62 | 6.8%), together accounting for 65.4% of all Walhalla residents.
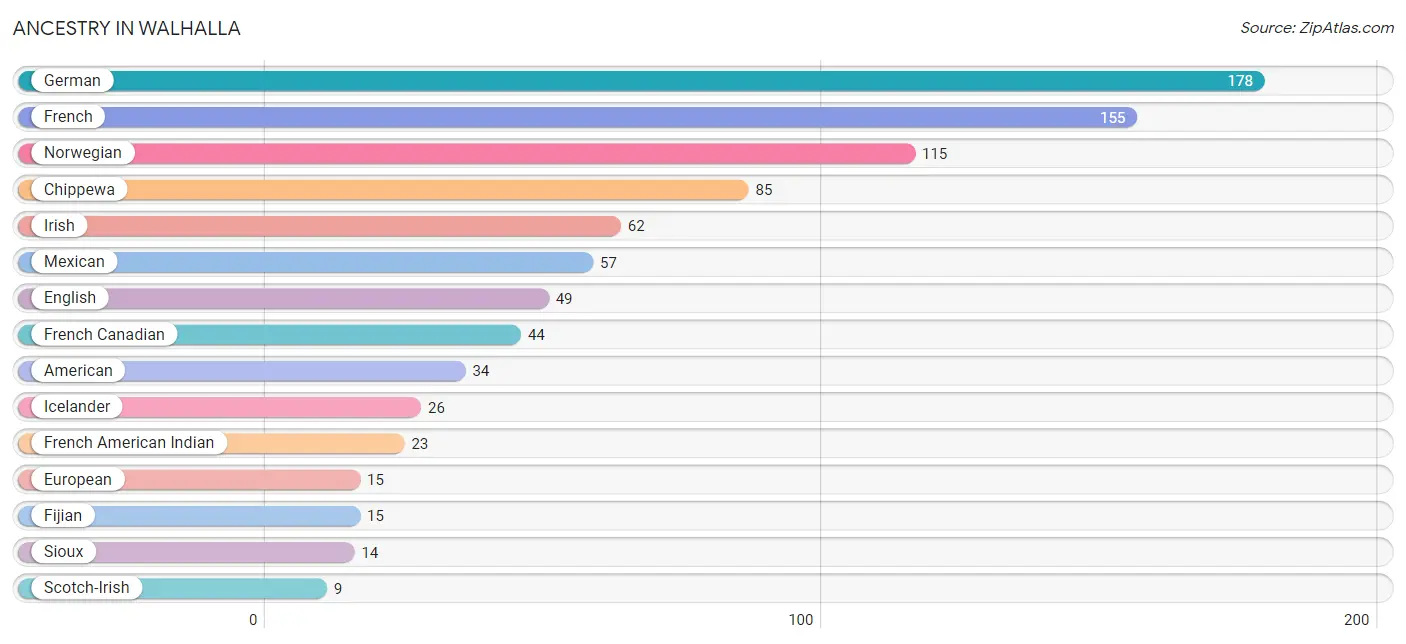
| Ancestry | # Population | % Population |
| American | 34 | 3.7% |
| Chippewa | 85 | 9.3% |
| Czechoslovakian | 7 | 0.8% |
| English | 49 | 5.4% |
| European | 15 | 1.7% |
| Fijian | 15 | 1.7% |
| French | 155 | 17.0% |
| French American Indian | 23 | 2.5% |
| French Canadian | 44 | 4.8% |
| German | 178 | 19.6% |
| Icelander | 26 | 2.9% |
| Irish | 62 | 6.8% |
| Italian | 3 | 0.3% |
| Mexican | 57 | 6.3% |
| Norwegian | 115 | 12.6% |
| Polish | 7 | 0.8% |
| Russian | 2 | 0.2% |
| Scotch-Irish | 9 | 1.0% |
| Scottish | 2 | 0.2% |
| Sioux | 14 | 1.5% |
| Swedish | 5 | 0.5% |
| Ukrainian | 2 | 0.2% | View All 22 Rows |
Immigrants in Walhalla
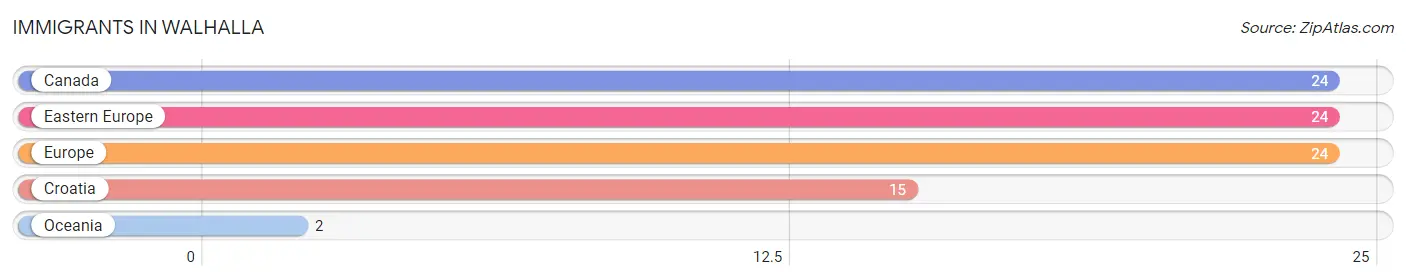
The most numerous immigrant groups reported in Walhalla came from Canada (24 | 2.6%), Eastern Europe (24 | 2.6%), Europe (24 | 2.6%), Croatia (15 | 1.7%), and Oceania (2 | 0.2%), together accounting for 9.8% of all Walhalla residents.
| Immigration Origin | # Population | % Population |
| Canada | 24 | 2.6% |
| Croatia | 15 | 1.7% |
| Eastern Europe | 24 | 2.6% |
| Europe | 24 | 2.6% |
| Oceania | 2 | 0.2% | View All 5 Rows |
Sex and Age in Walhalla
Sex and Age in Walhalla
The most populous age groups in Walhalla are 75 to 79 Years (59 | 11.1%) for men and 65 to 69 Years (45 | 11.9%) for women.

| Age Bracket | Male | Female |
| Under 5 Years | 34 (6.4%) | 11 (2.9%) |
| 5 to 9 Years | 23 (4.3%) | 2 (0.5%) |
| 10 to 14 Years | 50 (9.4%) | 11 (2.9%) |
| 15 to 19 Years | 32 (6.0%) | 16 (4.2%) |
| 20 to 24 Years | 18 (3.4%) | 44 (11.6%) |
| 25 to 29 Years | 22 (4.1%) | 17 (4.5%) |
| 30 to 34 Years | 46 (8.7%) | 10 (2.6%) |
| 35 to 39 Years | 15 (2.8%) | 0 (0.0%) |
| 40 to 44 Years | 8 (1.5%) | 34 (9.0%) |
| 45 to 49 Years | 44 (8.3%) | 27 (7.1%) |
| 50 to 54 Years | 20 (3.8%) | 14 (3.7%) |
| 55 to 59 Years | 37 (7.0%) | 24 (6.3%) |
| 60 to 64 Years | 34 (6.4%) | 29 (7.6%) |
| 65 to 69 Years | 17 (3.2%) | 45 (11.9%) |
| 70 to 74 Years | 38 (7.2%) | 30 (7.9%) |
| 75 to 79 Years | 59 (11.1%) | 17 (4.5%) |
| 80 to 84 Years | 15 (2.8%) | 34 (9.0%) |
| 85 Years and over | 19 (3.6%) | 14 (3.7%) |
| Total | 531 (100.0%) | 379 (100.0%) |
Families and Households in Walhalla
Median Family Size in Walhalla
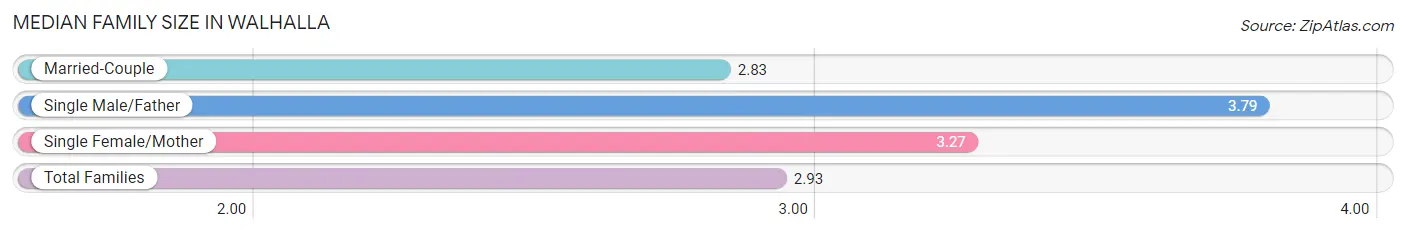
The median family size in Walhalla is 2.93 persons per family, with single male/father families (14 | 7.6%) accounting for the largest median family size of 3.79 persons per family. On the other hand, married-couple families (155 | 84.2%) represent the smallest median family size with 2.83 persons per family.
| Family Type | # Families | Family Size |
| Married-Couple | 155 (84.2%) | 2.83 |
| Single Male/Father | 14 (7.6%) | 3.79 |
| Single Female/Mother | 15 (8.2%) | 3.27 |
| Total Families | 184 (100.0%) | 2.93 |
Median Household Size in Walhalla
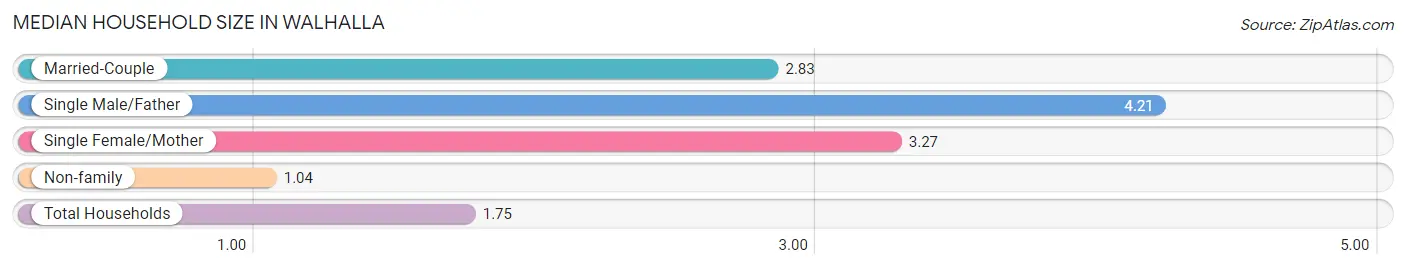
The median household size in Walhalla is 1.75 persons per household, with single male/father households (14 | 2.8%) accounting for the largest median household size of 4.21 persons per household. non-family households (314 | 63.0%) represent the smallest median household size with 1.04 persons per household.
| Household Type | # Households | Household Size |
| Married-Couple | 155 (31.1%) | 2.83 |
| Single Male/Father | 14 (2.8%) | 4.21 |
| Single Female/Mother | 15 (3.0%) | 3.27 |
| Non-family | 314 (63.0%) | 1.04 |
| Total Households | 498 (100.0%) | 1.75 |
Household Size by Marriage Status in Walhalla
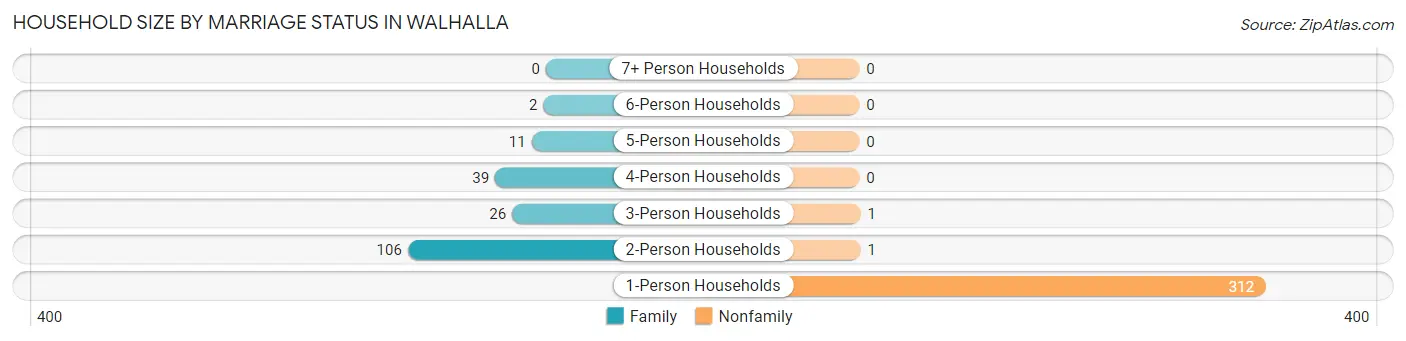
Out of a total of 498 households in Walhalla, 184 (36.9%) are family households, while 314 (63.0%) are nonfamily households. The most numerous type of family households are 2-person households, comprising 106, and the most common type of nonfamily households are 1-person households, comprising 312.
| Household Size | Family Households | Nonfamily Households |
| 1-Person Households | - | 312 (62.6%) |
| 2-Person Households | 106 (21.3%) | 1 (0.2%) |
| 3-Person Households | 26 (5.2%) | 1 (0.2%) |
| 4-Person Households | 39 (7.8%) | 0 (0.0%) |
| 5-Person Households | 11 (2.2%) | 0 (0.0%) |
| 6-Person Households | 2 (0.4%) | 0 (0.0%) |
| 7+ Person Households | 0 (0.0%) | 0 (0.0%) |
| Total | 184 (36.9%) | 314 (63.0%) |
Female Fertility in Walhalla
Fertility by Age in Walhalla
Average fertility rate in Walhalla is 47.0 births per 1,000 women. Women in the age bracket of 20 to 34 years have the highest fertility rate with 99.0 births per 1,000 women. Women in the age bracket of 20 to 34 years acount for 100.0% of all women with births.
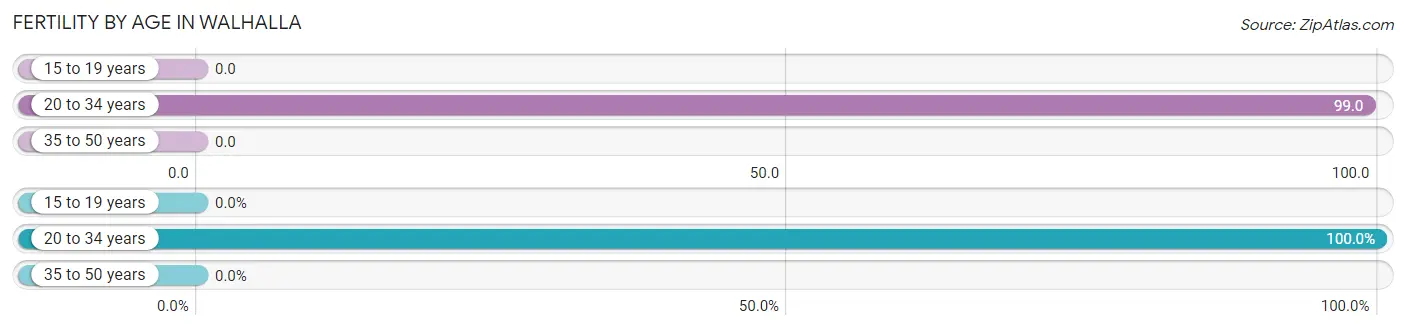
| Age Bracket | Women with Births | Births / 1,000 Women |
| 15 to 19 years | 0 (0.0%) | 0.0 |
| 20 to 34 years | 7 (100.0%) | 99.0 |
| 35 to 50 years | 0 (0.0%) | 0.0 |
| Total | 7 (100.0%) | 47.0 |
Fertility by Age by Marriage Status in Walhalla
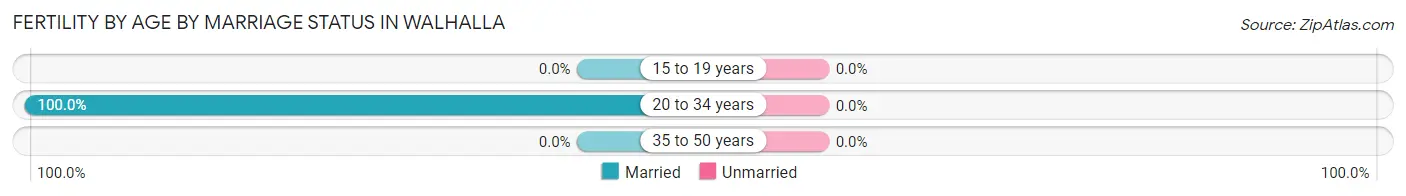
| Age Bracket | Married | Unmarried |
| 15 to 19 years | 0 (0.0%) | 0 (0.0%) |
| 20 to 34 years | 7 (100.0%) | 0 (0.0%) |
| 35 to 50 years | 0 (0.0%) | 0 (0.0%) |
| Total | 7 (100.0%) | 0 (0.0%) |
Fertility by Education in Walhalla
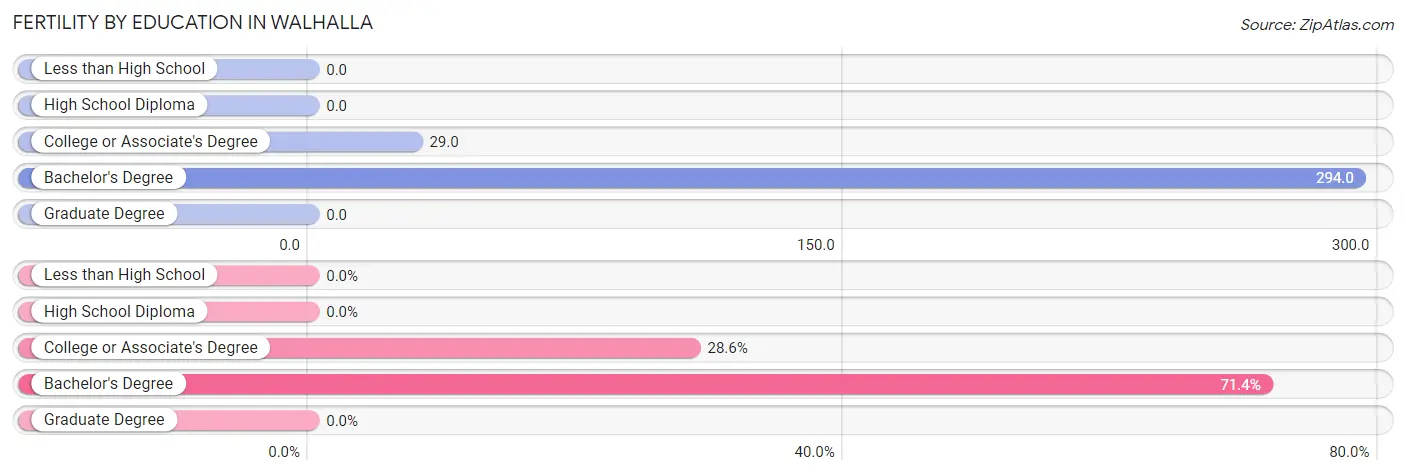
| Educational Attainment | Women with Births | Births / 1,000 Women |
| Less than High School | 0 (0.0%) | 0.0 |
| High School Diploma | 0 (0.0%) | 0.0 |
| College or Associate's Degree | 2 (28.6%) | 29.0 |
| Bachelor's Degree | 5 (71.4%) | 294.0 |
| Graduate Degree | 0 (0.0%) | 0.0 |
| Total | 7 (100.0%) | 47.0 |
Fertility by Education by Marriage Status in Walhalla
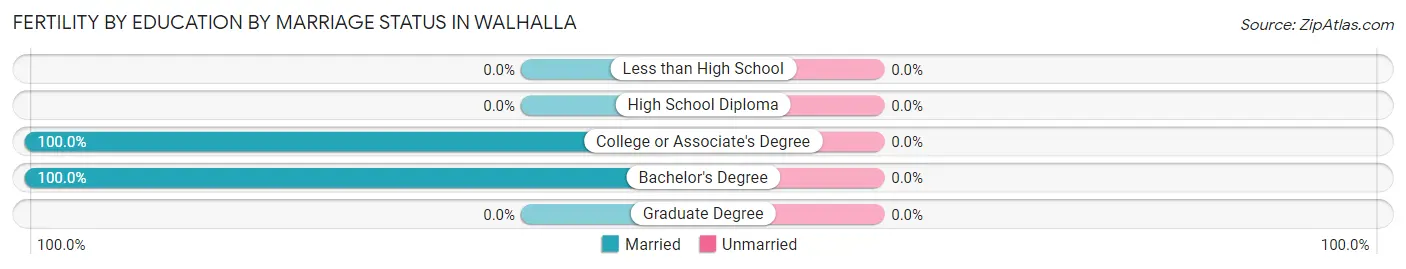
| Educational Attainment | Married | Unmarried |
| Less than High School | 0 (0.0%) | 0 (0.0%) |
| High School Diploma | 0 (0.0%) | 0 (0.0%) |
| College or Associate's Degree | 2 (100.0%) | 0 (0.0%) |
| Bachelor's Degree | 5 (100.0%) | 0 (0.0%) |
| Graduate Degree | 0 (0.0%) | 0 (0.0%) |
| Total | 7 (100.0%) | 0 (0.0%) |
Employment Characteristics in Walhalla
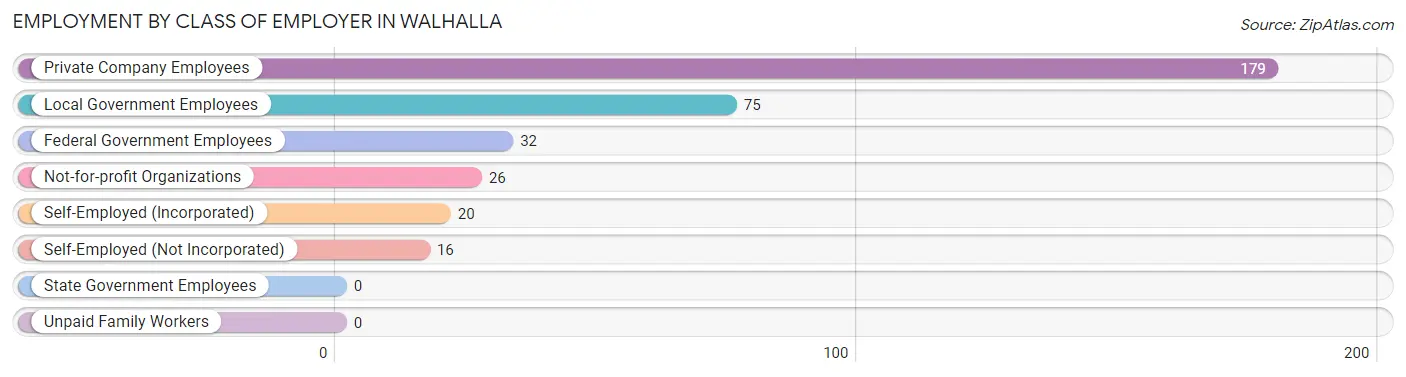
Employment by Class of Employer in Walhalla
Among the 348 employed individuals in Walhalla, private company employees (179 | 51.4%), local government employees (75 | 21.5%), and federal government employees (32 | 9.2%) make up the most common classes of employment.
| Employer Class | # Employees | % Employees |
| Private Company Employees | 179 | 51.4% |
| Self-Employed (Incorporated) | 20 | 5.8% |
| Self-Employed (Not Incorporated) | 16 | 4.6% |
| Not-for-profit Organizations | 26 | 7.5% |
| Local Government Employees | 75 | 21.5% |
| State Government Employees | 0 | 0.0% |
| Federal Government Employees | 32 | 9.2% |
| Unpaid Family Workers | 0 | 0.0% |
| Total | 348 | 100.0% |
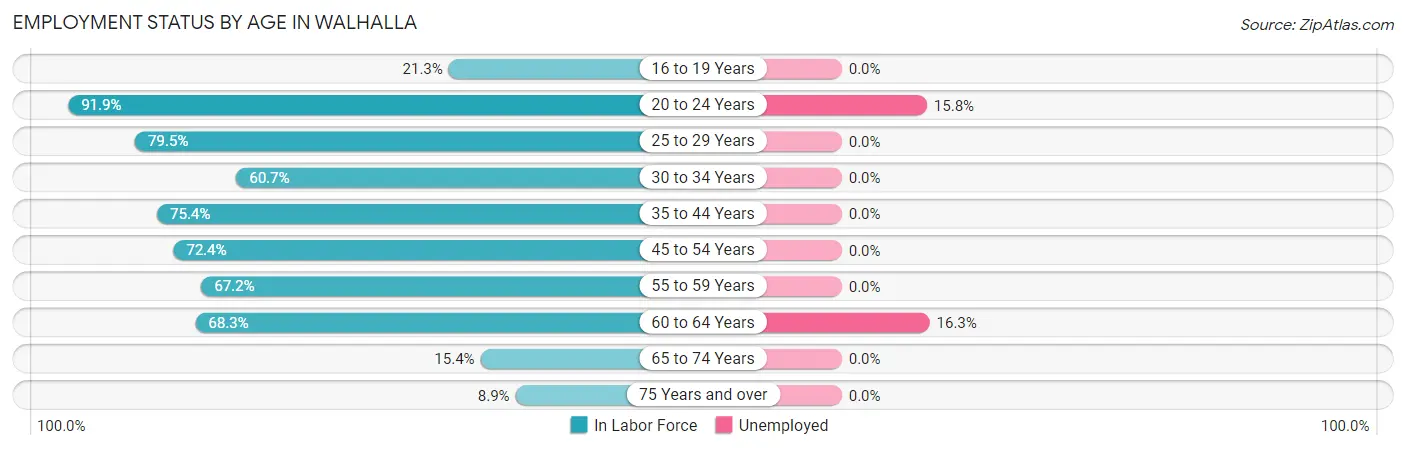
Employment Status by Age in Walhalla
According to the labor force statistics for Walhalla, out of the total population over 16 years of age (778), 47.4% or 369 individuals are in the labor force, with 4.3% or 16 of them unemployed. The age group with the highest labor force participation rate is 20 to 24 years, with 91.9% or 57 individuals in the labor force. Within the labor force, the 60 to 64 years age range has the highest percentage of unemployed individuals, with 16.3% or 7 of them being unemployed.
| Age Bracket | In Labor Force | Unemployed |
| 16 to 19 Years | 10 (21.3%) | 0 (0.0%) |
| 20 to 24 Years | 57 (91.9%) | 9 (15.8%) |
| 25 to 29 Years | 31 (79.5%) | 0 (0.0%) |
| 30 to 34 Years | 34 (60.7%) | 0 (0.0%) |
| 35 to 44 Years | 43 (75.4%) | 0 (0.0%) |
| 45 to 54 Years | 76 (72.4%) | 0 (0.0%) |
| 55 to 59 Years | 41 (67.2%) | 0 (0.0%) |
| 60 to 64 Years | 43 (68.3%) | 7 (16.3%) |
| 65 to 74 Years | 20 (15.4%) | 0 (0.0%) |
| 75 Years and over | 14 (8.9%) | 0 (0.0%) |
| Total | 369 (47.4%) | 16 (4.3%) |
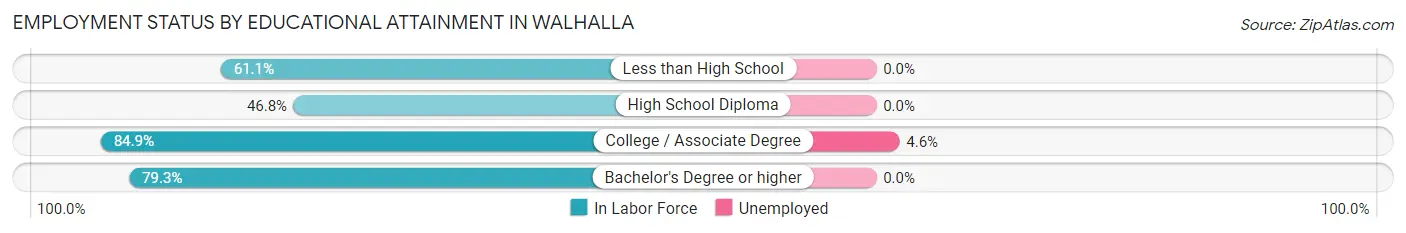
Employment Status by Educational Attainment in Walhalla
According to labor force statistics for Walhalla, 70.3% of individuals (268) out of the total population between 25 and 64 years of age (381) are in the labor force, with 2.6% or 7 of them being unemployed. The group with the highest labor force participation rate are those with the educational attainment of college / associate degree, with 84.9% or 152 individuals in the labor force. Within the labor force, individuals with college / associate degree education have the highest percentage of unemployment, with 4.6% or 7 of them being unemployed.
| Educational Attainment | In Labor Force | Unemployed |
| Less than High School | 11 (61.1%) | 0 (0.0%) |
| High School Diploma | 59 (46.8%) | 0 (0.0%) |
| College / Associate Degree | 152 (84.9%) | 8 (4.6%) |
| Bachelor's Degree or higher | 46 (79.3%) | 0 (0.0%) |
| Total | 268 (70.3%) | 10 (2.6%) |
Employment Occupations by Sex in Walhalla
Management, Business, Science and Arts Occupations
The most common Management, Business, Science and Arts occupations in Walhalla are Community & Social Service (43 | 12.2%), Education Instruction & Library (41 | 11.6%), Management (37 | 10.5%), Business & Financial (16 | 4.5%), and Computers, Engineering & Science (10 | 2.8%).
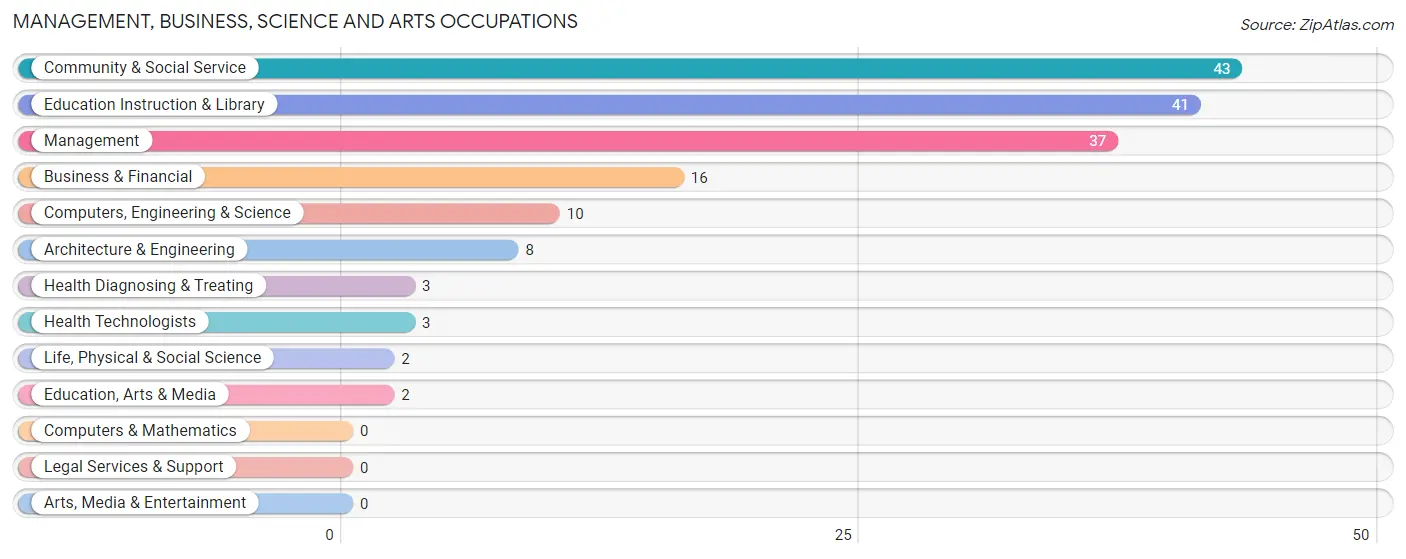
Management, Business, Science and Arts Occupations by Sex
Within the Management, Business, Science and Arts occupations in Walhalla, the most male-oriented occupations are Computers, Engineering & Science (100.0%), Architecture & Engineering (100.0%), and Life, Physical & Social Science (100.0%), while the most female-oriented occupations are Education, Arts & Media (100.0%), Health Diagnosing & Treating (100.0%), and Health Technologists (100.0%).
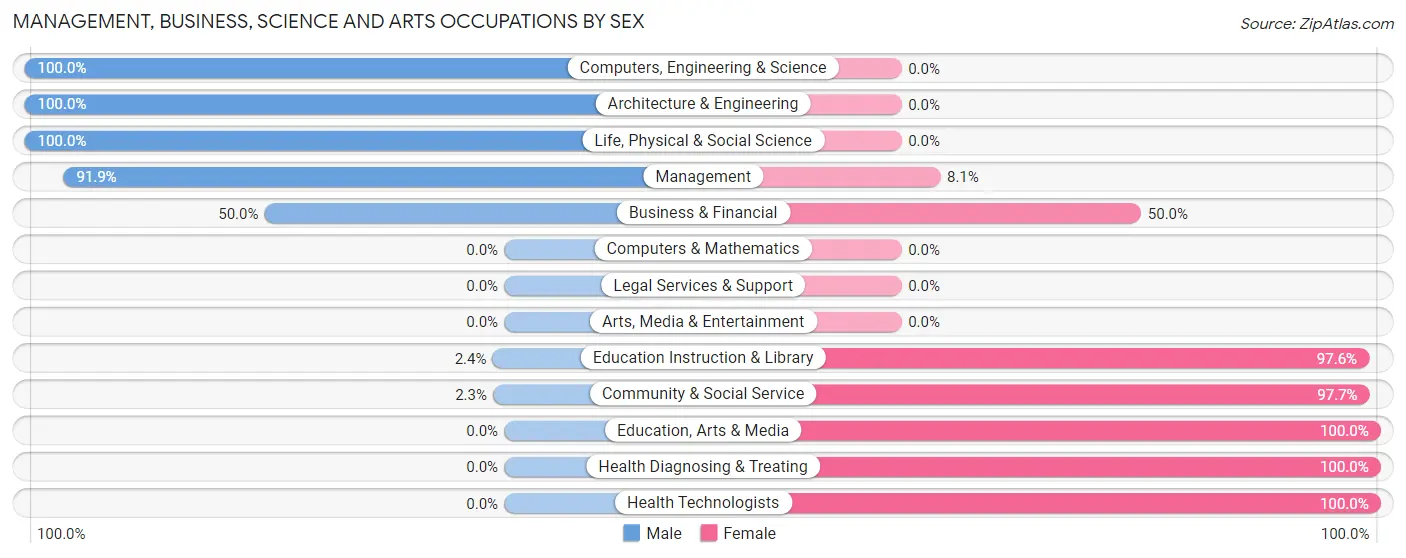
| Occupation | Male | Female |
| Management | 34 (91.9%) | 3 (8.1%) |
| Business & Financial | 8 (50.0%) | 8 (50.0%) |
| Computers, Engineering & Science | 10 (100.0%) | 0 (0.0%) |
| Computers & Mathematics | 0 (0.0%) | 0 (0.0%) |
| Architecture & Engineering | 8 (100.0%) | 0 (0.0%) |
| Life, Physical & Social Science | 2 (100.0%) | 0 (0.0%) |
| Community & Social Service | 1 (2.3%) | 42 (97.7%) |
| Education, Arts & Media | 0 (0.0%) | 2 (100.0%) |
| Legal Services & Support | 0 (0.0%) | 0 (0.0%) |
| Education Instruction & Library | 1 (2.4%) | 40 (97.6%) |
| Arts, Media & Entertainment | 0 (0.0%) | 0 (0.0%) |
| Health Diagnosing & Treating | 0 (0.0%) | 3 (100.0%) |
| Health Technologists | 0 (0.0%) | 3 (100.0%) |
| Total (Category) | 53 (48.6%) | 56 (51.4%) |
| Total (Overall) | 201 (56.9%) | 152 (43.1%) |
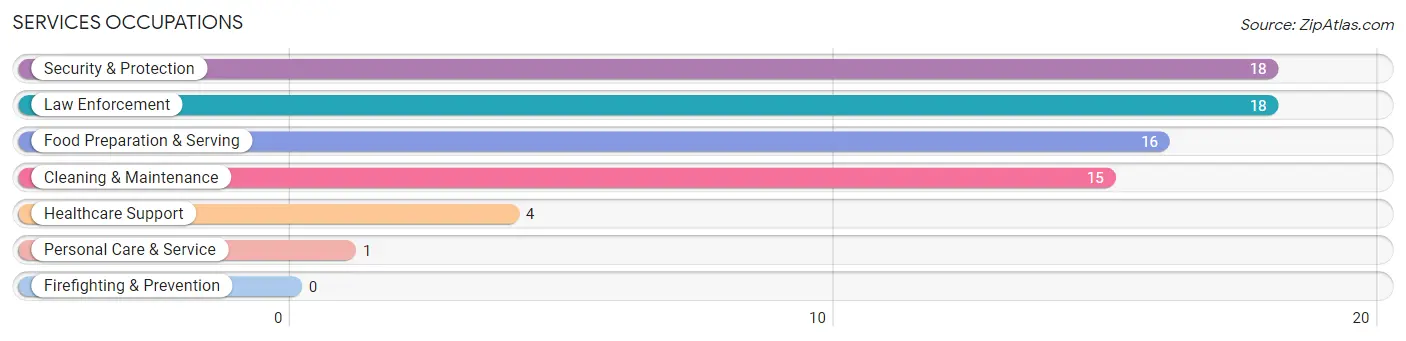
Services Occupations
The most common Services occupations in Walhalla are Security & Protection (18 | 5.1%), Law Enforcement (18 | 5.1%), Food Preparation & Serving (16 | 4.5%), Cleaning & Maintenance (15 | 4.3%), and Healthcare Support (4 | 1.1%).
Services Occupations by Sex
Within the Services occupations in Walhalla, the most male-oriented occupations are Security & Protection (94.4%), Law Enforcement (94.4%), and Cleaning & Maintenance (33.3%), while the most female-oriented occupations are Healthcare Support (100.0%), Food Preparation & Serving (100.0%), and Personal Care & Service (100.0%).
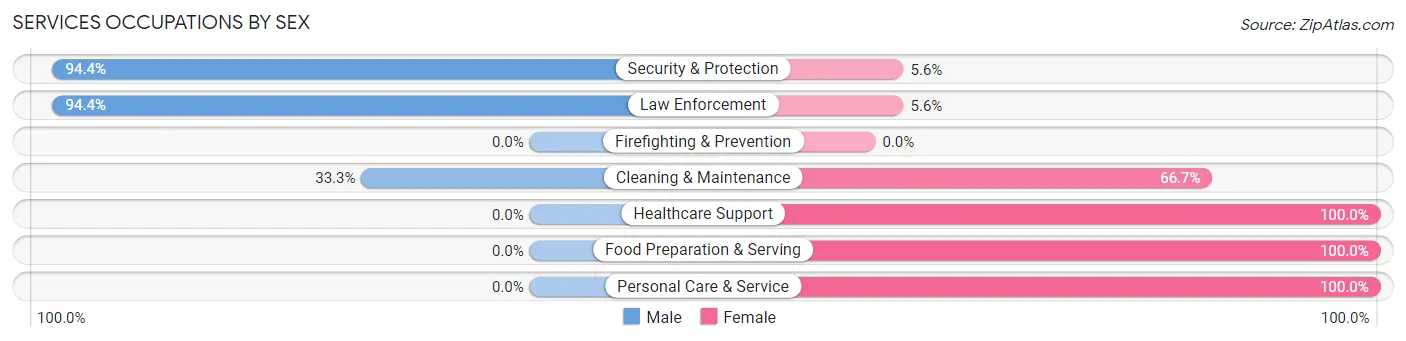
| Occupation | Male | Female |
| Healthcare Support | 0 (0.0%) | 4 (100.0%) |
| Security & Protection | 17 (94.4%) | 1 (5.6%) |
| Firefighting & Prevention | 0 (0.0%) | 0 (0.0%) |
| Law Enforcement | 17 (94.4%) | 1 (5.6%) |
| Food Preparation & Serving | 0 (0.0%) | 16 (100.0%) |
| Cleaning & Maintenance | 5 (33.3%) | 10 (66.7%) |
| Personal Care & Service | 0 (0.0%) | 1 (100.0%) |
| Total (Category) | 22 (40.7%) | 32 (59.3%) |
| Total (Overall) | 201 (56.9%) | 152 (43.1%) |
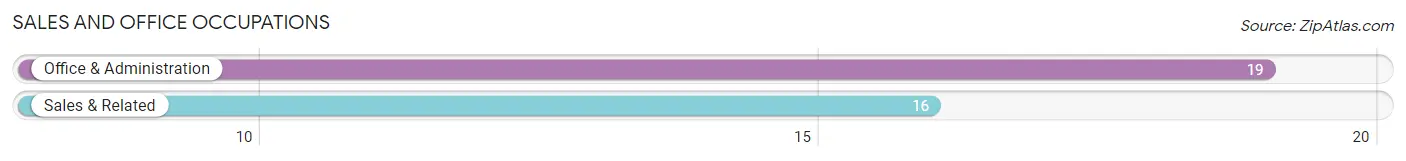
Sales and Office Occupations
The most common Sales and Office occupations in Walhalla are Office & Administration (19 | 5.4%), and Sales & Related (16 | 4.5%).
Sales and Office Occupations by Sex
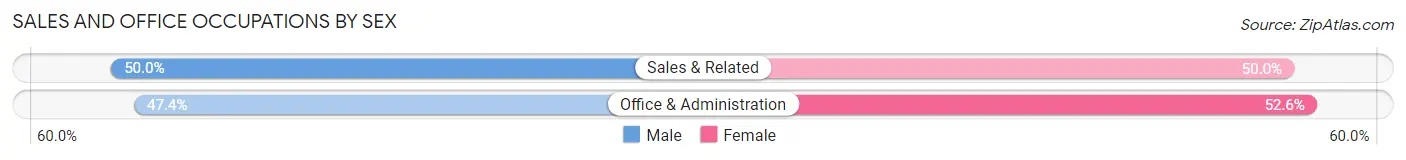
| Occupation | Male | Female |
| Sales & Related | 8 (50.0%) | 8 (50.0%) |
| Office & Administration | 9 (47.4%) | 10 (52.6%) |
| Total (Category) | 17 (48.6%) | 18 (51.4%) |
| Total (Overall) | 201 (56.9%) | 152 (43.1%) |
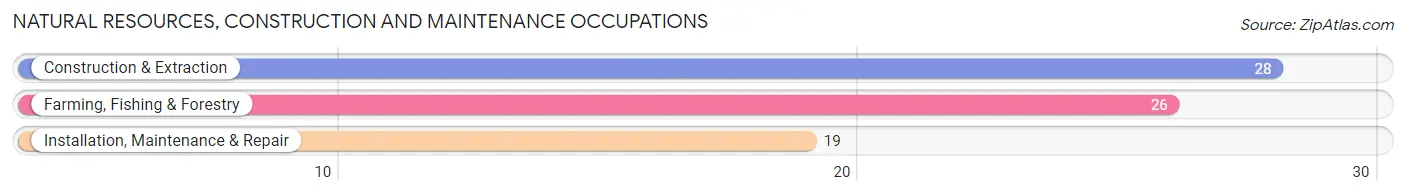
Natural Resources, Construction and Maintenance Occupations
The most common Natural Resources, Construction and Maintenance occupations in Walhalla are Construction & Extraction (28 | 7.9%), Farming, Fishing & Forestry (26 | 7.4%), and Installation, Maintenance & Repair (19 | 5.4%).
Natural Resources, Construction and Maintenance Occupations by Sex
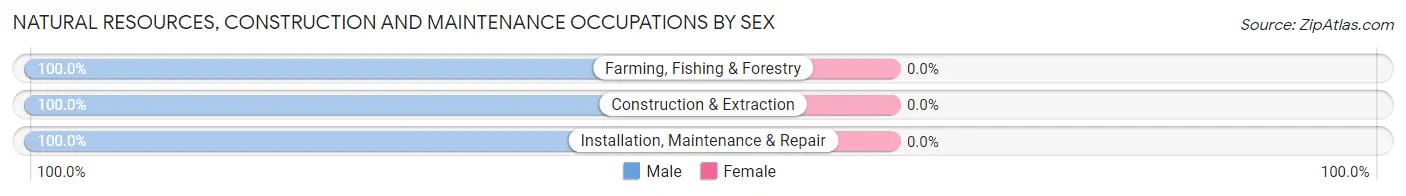
| Occupation | Male | Female |
| Farming, Fishing & Forestry | 26 (100.0%) | 0 (0.0%) |
| Construction & Extraction | 28 (100.0%) | 0 (0.0%) |
| Installation, Maintenance & Repair | 19 (100.0%) | 0 (0.0%) |
| Total (Category) | 73 (100.0%) | 0 (0.0%) |
| Total (Overall) | 201 (56.9%) | 152 (43.1%) |
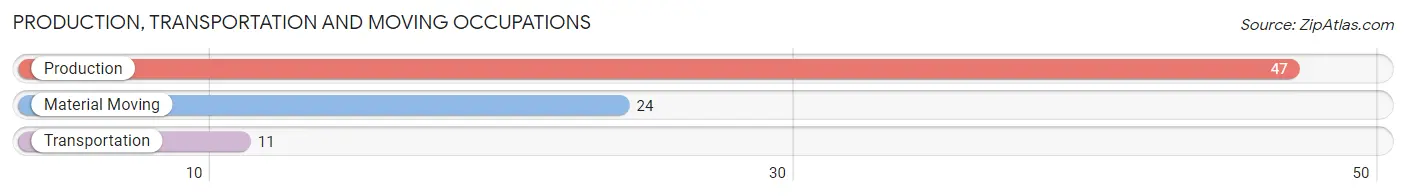
Production, Transportation and Moving Occupations
The most common Production, Transportation and Moving occupations in Walhalla are Production (47 | 13.3%), Material Moving (24 | 6.8%), and Transportation (11 | 3.1%).
Production, Transportation and Moving Occupations by Sex
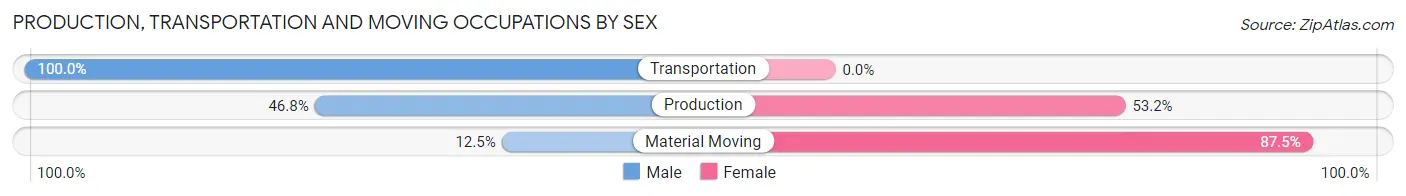
| Occupation | Male | Female |
| Production | 22 (46.8%) | 25 (53.2%) |
| Transportation | 11 (100.0%) | 0 (0.0%) |
| Material Moving | 3 (12.5%) | 21 (87.5%) |
| Total (Category) | 36 (43.9%) | 46 (56.1%) |
| Total (Overall) | 201 (56.9%) | 152 (43.1%) |
Employment Industries by Sex in Walhalla
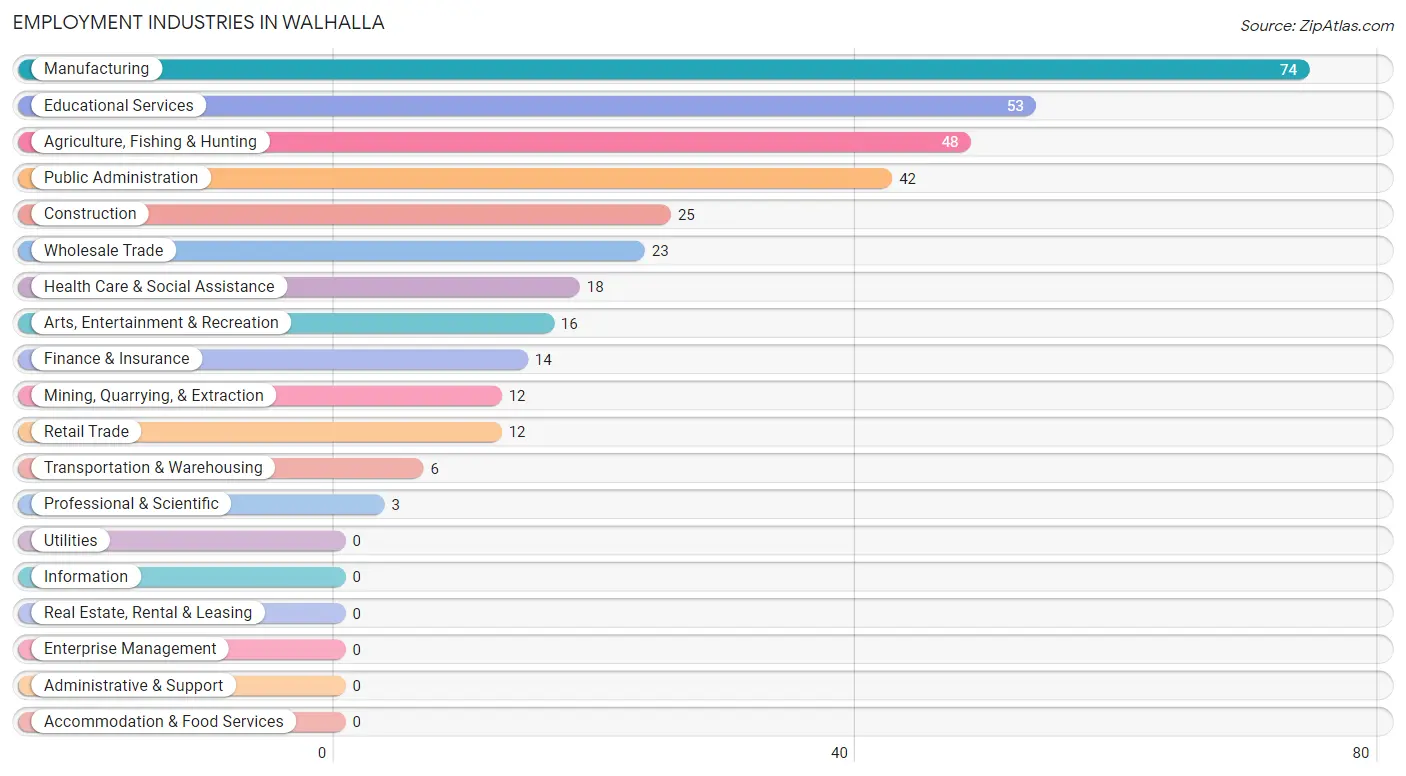
Employment Industries in Walhalla
The major employment industries in Walhalla include Manufacturing (74 | 21.0%), Educational Services (53 | 15.0%), Agriculture, Fishing & Hunting (48 | 13.6%), Public Administration (42 | 11.9%), and Construction (25 | 7.1%).
Employment Industries by Sex in Walhalla
The Walhalla industries that see more men than women are Agriculture, Fishing & Hunting (100.0%), Construction (100.0%), and Professional & Scientific (100.0%), whereas the industries that tend to have a higher number of women are Health Care & Social Assistance (100.0%), Educational Services (92.4%), and Arts, Entertainment & Recreation (75.0%).
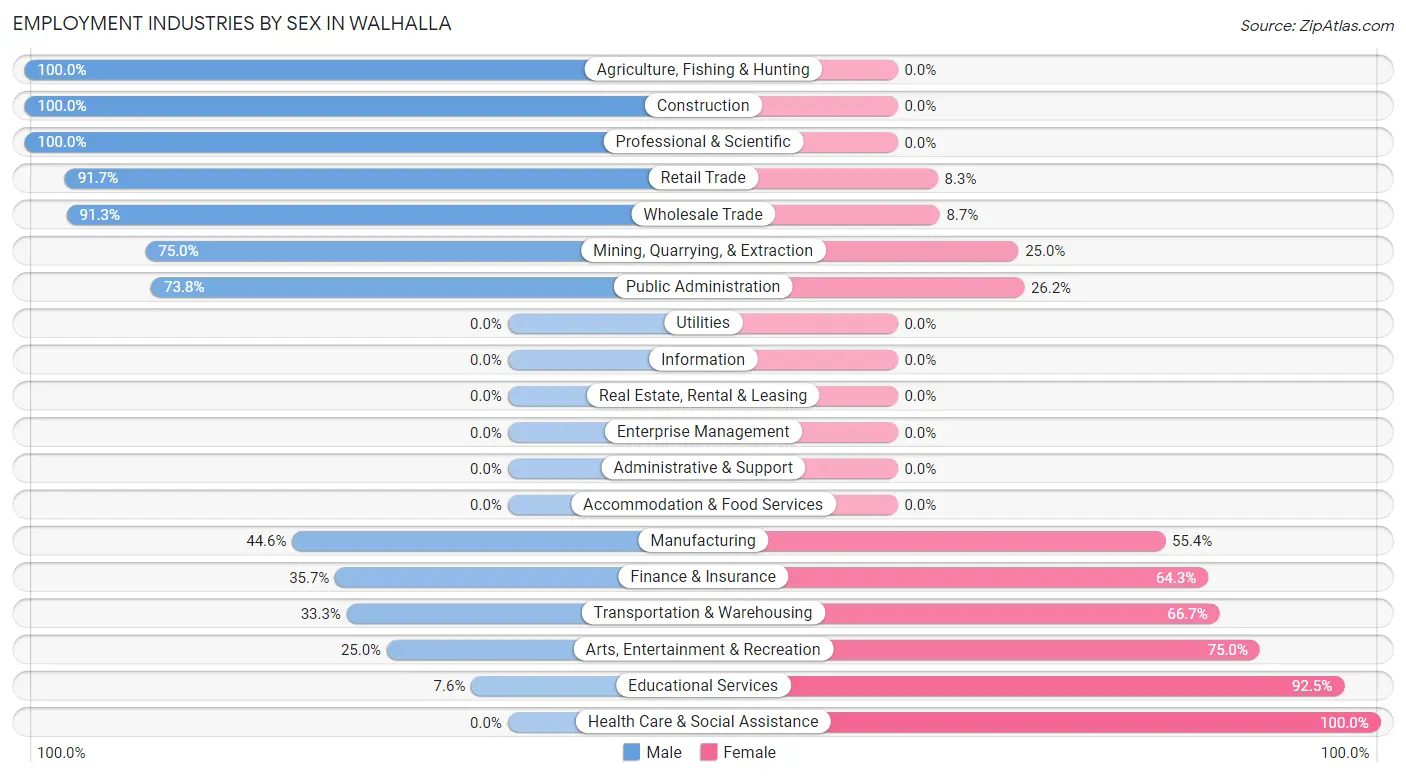
| Industry | Male | Female |
| Agriculture, Fishing & Hunting | 48 (100.0%) | 0 (0.0%) |
| Mining, Quarrying, & Extraction | 9 (75.0%) | 3 (25.0%) |
| Construction | 25 (100.0%) | 0 (0.0%) |
| Manufacturing | 33 (44.6%) | 41 (55.4%) |
| Wholesale Trade | 21 (91.3%) | 2 (8.7%) |
| Retail Trade | 11 (91.7%) | 1 (8.3%) |
| Transportation & Warehousing | 2 (33.3%) | 4 (66.7%) |
| Utilities | 0 (0.0%) | 0 (0.0%) |
| Information | 0 (0.0%) | 0 (0.0%) |
| Finance & Insurance | 5 (35.7%) | 9 (64.3%) |
| Real Estate, Rental & Leasing | 0 (0.0%) | 0 (0.0%) |
| Professional & Scientific | 3 (100.0%) | 0 (0.0%) |
| Enterprise Management | 0 (0.0%) | 0 (0.0%) |
| Administrative & Support | 0 (0.0%) | 0 (0.0%) |
| Educational Services | 4 (7.5%) | 49 (92.4%) |
| Health Care & Social Assistance | 0 (0.0%) | 18 (100.0%) |
| Arts, Entertainment & Recreation | 4 (25.0%) | 12 (75.0%) |
| Accommodation & Food Services | 0 (0.0%) | 0 (0.0%) |
| Public Administration | 31 (73.8%) | 11 (26.2%) |
| Total | 201 (56.9%) | 152 (43.1%) |
Education in Walhalla
School Enrollment in Walhalla
The most common levels of schooling among the 142 students in Walhalla are middle school (57 | 40.1%), high school (48 | 33.8%), and elementary school (19 | 13.4%).
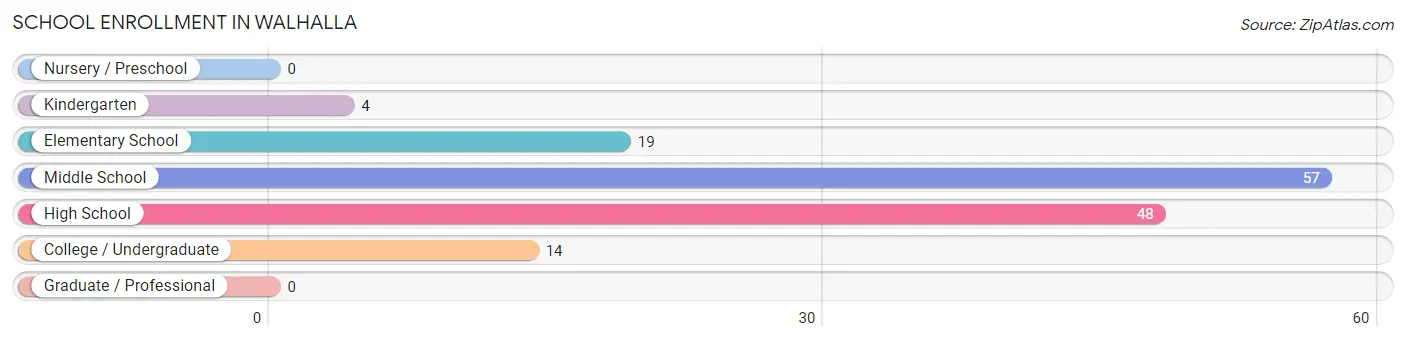
| School Level | # Students | % Students |
| Nursery / Preschool | 0 | 0.0% |
| Kindergarten | 4 | 2.8% |
| Elementary School | 19 | 13.4% |
| Middle School | 57 | 40.1% |
| High School | 48 | 33.8% |
| College / Undergraduate | 14 | 9.9% |
| Graduate / Professional | 0 | 0.0% |
| Total | 142 | 100.0% |
School Enrollment by Age by Funding Source in Walhalla
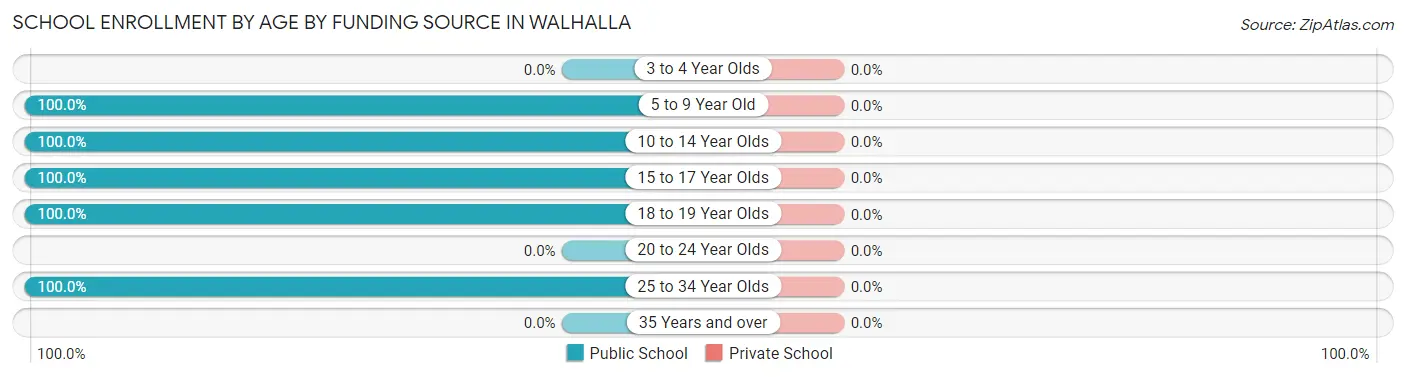
| Age Bracket | Public School | Private School |
| 3 to 4 Year Olds | 0 (0.0%) | 0 (0.0%) |
| 5 to 9 Year Old | 19 (100.0%) | 0 (0.0%) |
| 10 to 14 Year Olds | 61 (100.0%) | 0 (0.0%) |
| 15 to 17 Year Olds | 42 (100.0%) | 0 (0.0%) |
| 18 to 19 Year Olds | 6 (100.0%) | 0 (0.0%) |
| 20 to 24 Year Olds | 0 (0.0%) | 0 (0.0%) |
| 25 to 34 Year Olds | 14 (100.0%) | 0 (0.0%) |
| 35 Years and over | 0 (0.0%) | 0 (0.0%) |
| Total | 142 (100.0%) | 0 (0.0%) |
Educational Attainment by Field of Study in Walhalla
Computers & mathematics (21 | 20.0%), education (18 | 17.1%), psychology (17 | 16.2%), liberal arts & history (14 | 13.3%), and bio, nature & agricultural (12 | 11.4%) are the most common fields of study among 105 individuals in Walhalla who have obtained a bachelor's degree or higher.
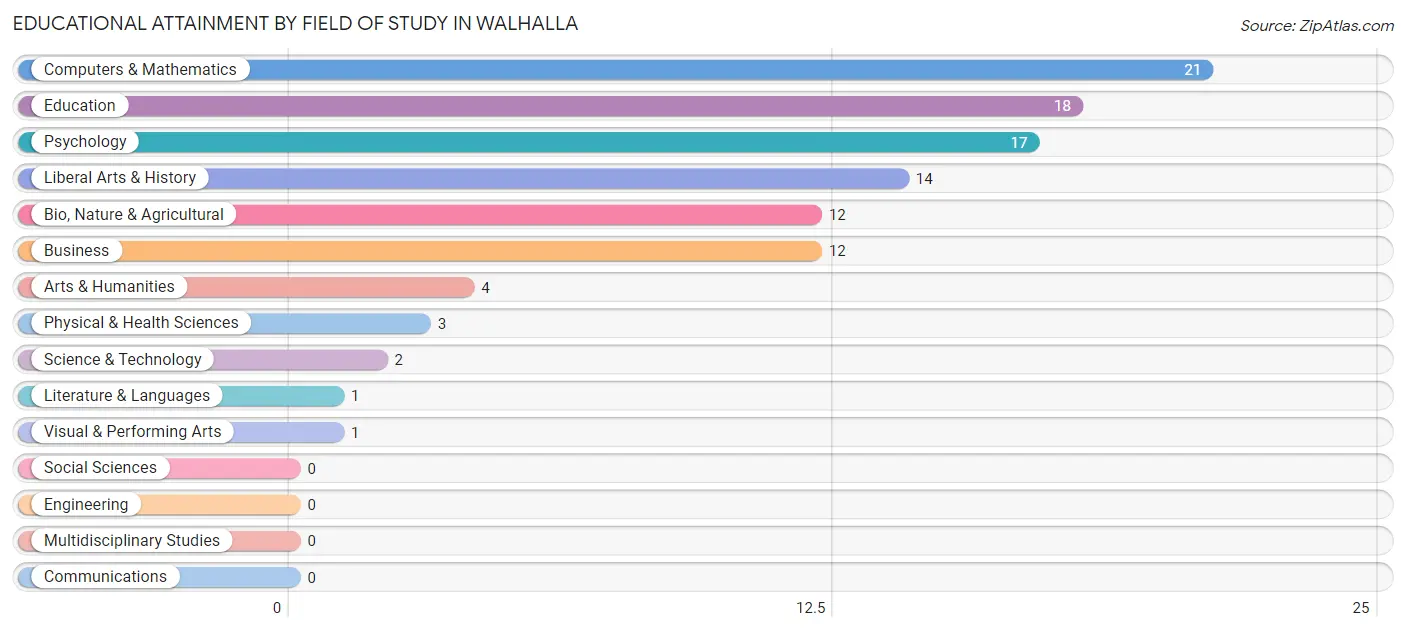
| Field of Study | # Graduates | % Graduates |
| Computers & Mathematics | 21 | 20.0% |
| Bio, Nature & Agricultural | 12 | 11.4% |
| Physical & Health Sciences | 3 | 2.9% |
| Psychology | 17 | 16.2% |
| Social Sciences | 0 | 0.0% |
| Engineering | 0 | 0.0% |
| Multidisciplinary Studies | 0 | 0.0% |
| Science & Technology | 2 | 1.9% |
| Business | 12 | 11.4% |
| Education | 18 | 17.1% |
| Literature & Languages | 1 | 0.9% |
| Liberal Arts & History | 14 | 13.3% |
| Visual & Performing Arts | 1 | 0.9% |
| Communications | 0 | 0.0% |
| Arts & Humanities | 4 | 3.8% |
| Total | 105 | 100.0% |
Transportation & Commute in Walhalla
Vehicle Availability by Sex in Walhalla
The most prevalent vehicle ownership categories in Walhalla are males with 2 vehicles (72, accounting for 35.8%) and females with 2 vehicles (62, making up 49.0%).
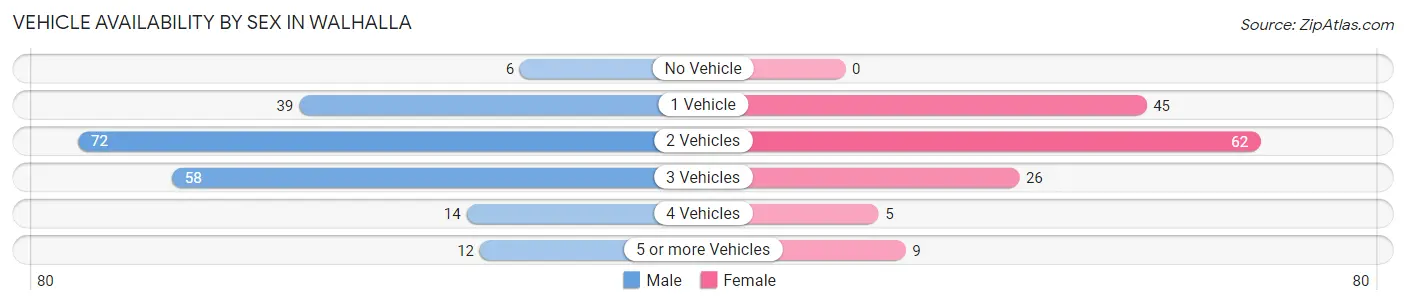
| Vehicles Available | Male | Female |
| No Vehicle | 6 (3.0%) | 0 (0.0%) |
| 1 Vehicle | 39 (19.4%) | 45 (30.6%) |
| 2 Vehicles | 72 (35.8%) | 62 (42.2%) |
| 3 Vehicles | 58 (28.9%) | 26 (17.7%) |
| 4 Vehicles | 14 (7.0%) | 5 (3.4%) |
| 5 or more Vehicles | 12 (6.0%) | 9 (6.1%) |
| Total | 201 (100.0%) | 147 (100.0%) |
Commute Time in Walhalla
The most frequently occuring commute durations in Walhalla are 30 to 34 minutes (63 commuters, 18.2%), 5 to 9 minutes (56 commuters, 16.2%), and 15 to 19 minutes (47 commuters, 13.6%).
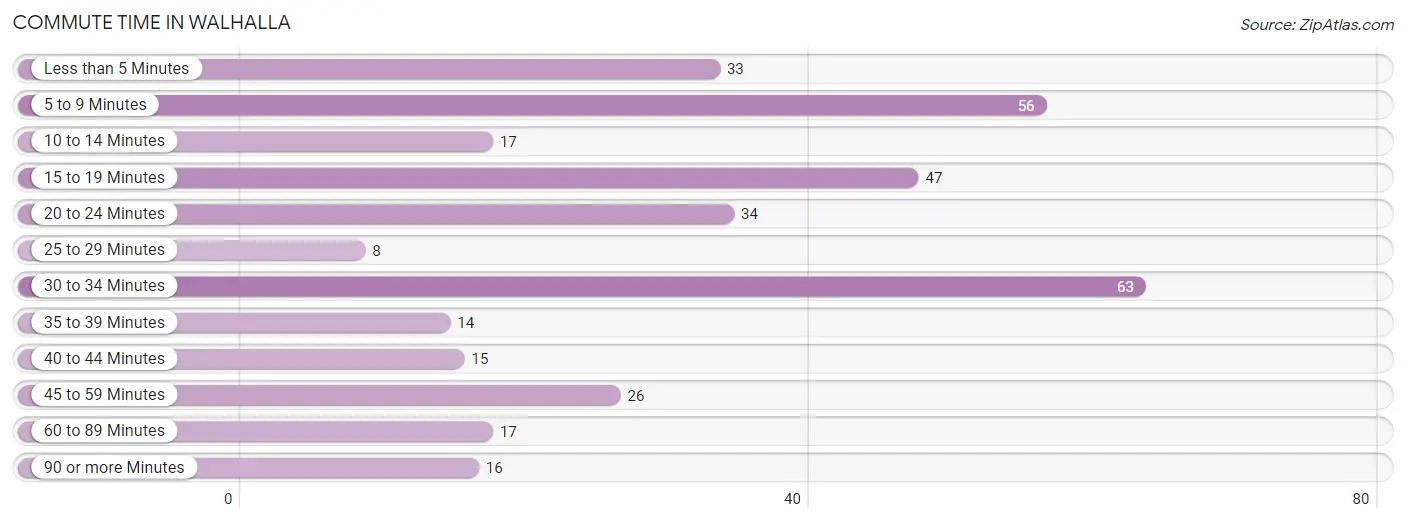
| Commute Time | # Commuters | % Commuters |
| Less than 5 Minutes | 33 | 9.5% |
| 5 to 9 Minutes | 56 | 16.2% |
| 10 to 14 Minutes | 17 | 4.9% |
| 15 to 19 Minutes | 47 | 13.6% |
| 20 to 24 Minutes | 34 | 9.8% |
| 25 to 29 Minutes | 8 | 2.3% |
| 30 to 34 Minutes | 63 | 18.2% |
| 35 to 39 Minutes | 14 | 4.1% |
| 40 to 44 Minutes | 15 | 4.3% |
| 45 to 59 Minutes | 26 | 7.5% |
| 60 to 89 Minutes | 17 | 4.9% |
| 90 or more Minutes | 16 | 4.6% |
Commute Time by Sex in Walhalla
The most common commute times in Walhalla are 30 to 34 minutes (41 commuters, 20.4%) for males and 20 to 24 minutes (24 commuters, 16.6%) for females.
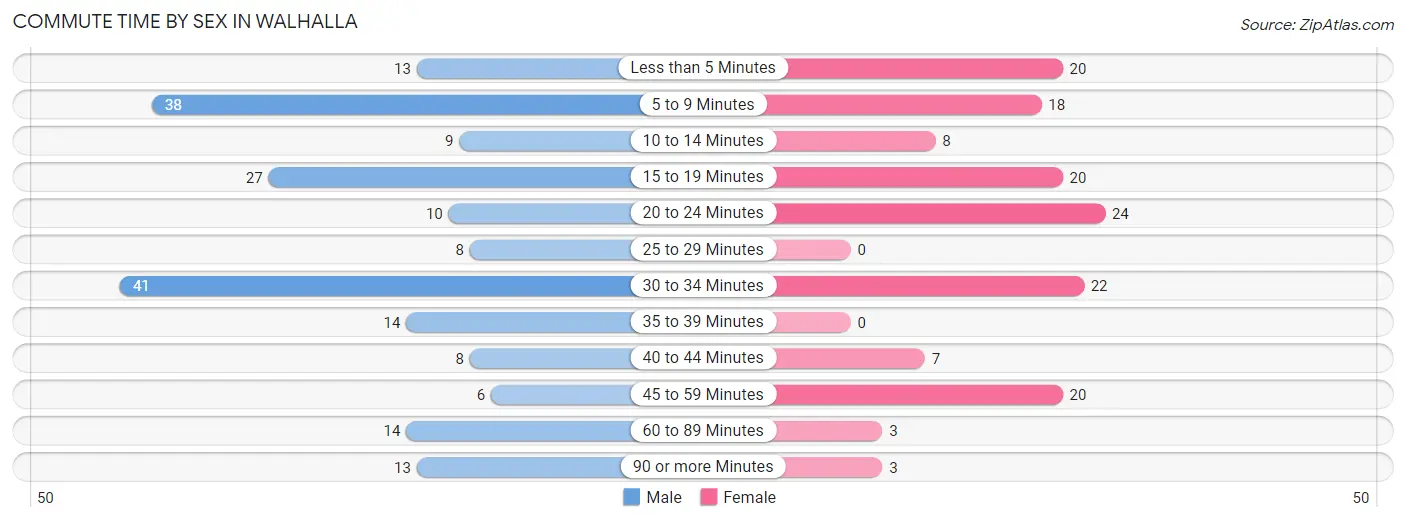
| Commute Time | Male | Female |
| Less than 5 Minutes | 13 (6.5%) | 20 (13.8%) |
| 5 to 9 Minutes | 38 (18.9%) | 18 (12.4%) |
| 10 to 14 Minutes | 9 (4.5%) | 8 (5.5%) |
| 15 to 19 Minutes | 27 (13.4%) | 20 (13.8%) |
| 20 to 24 Minutes | 10 (5.0%) | 24 (16.6%) |
| 25 to 29 Minutes | 8 (4.0%) | 0 (0.0%) |
| 30 to 34 Minutes | 41 (20.4%) | 22 (15.2%) |
| 35 to 39 Minutes | 14 (7.0%) | 0 (0.0%) |
| 40 to 44 Minutes | 8 (4.0%) | 7 (4.8%) |
| 45 to 59 Minutes | 6 (3.0%) | 20 (13.8%) |
| 60 to 89 Minutes | 14 (7.0%) | 3 (2.1%) |
| 90 or more Minutes | 13 (6.5%) | 3 (2.1%) |
Time of Departure to Work by Sex in Walhalla
The most frequent times of departure to work in Walhalla are 7:30 AM to 7:59 AM (44, 21.9%) for males and 7:30 AM to 7:59 AM (29, 20.0%) for females.
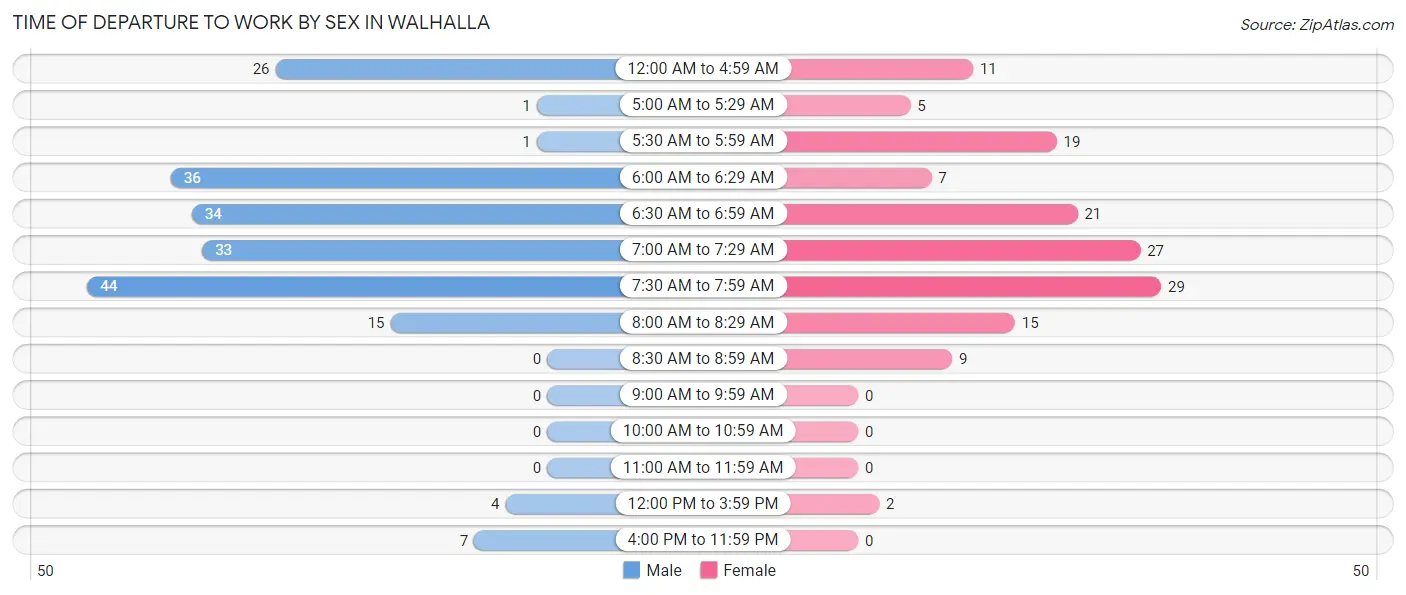
| Time of Departure | Male | Female |
| 12:00 AM to 4:59 AM | 26 (12.9%) | 11 (7.6%) |
| 5:00 AM to 5:29 AM | 1 (0.5%) | 5 (3.5%) |
| 5:30 AM to 5:59 AM | 1 (0.5%) | 19 (13.1%) |
| 6:00 AM to 6:29 AM | 36 (17.9%) | 7 (4.8%) |
| 6:30 AM to 6:59 AM | 34 (16.9%) | 21 (14.5%) |
| 7:00 AM to 7:29 AM | 33 (16.4%) | 27 (18.6%) |
| 7:30 AM to 7:59 AM | 44 (21.9%) | 29 (20.0%) |
| 8:00 AM to 8:29 AM | 15 (7.5%) | 15 (10.3%) |
| 8:30 AM to 8:59 AM | 0 (0.0%) | 9 (6.2%) |
| 9:00 AM to 9:59 AM | 0 (0.0%) | 0 (0.0%) |
| 10:00 AM to 10:59 AM | 0 (0.0%) | 0 (0.0%) |
| 11:00 AM to 11:59 AM | 0 (0.0%) | 0 (0.0%) |
| 12:00 PM to 3:59 PM | 4 (2.0%) | 2 (1.4%) |
| 4:00 PM to 11:59 PM | 7 (3.5%) | 0 (0.0%) |
| Total | 201 (100.0%) | 145 (100.0%) |
Housing Occupancy in Walhalla
Occupancy by Ownership in Walhalla
Of the total 498 dwellings in Walhalla, owner-occupied units account for 316 (63.4%), while renter-occupied units make up 182 (36.5%).
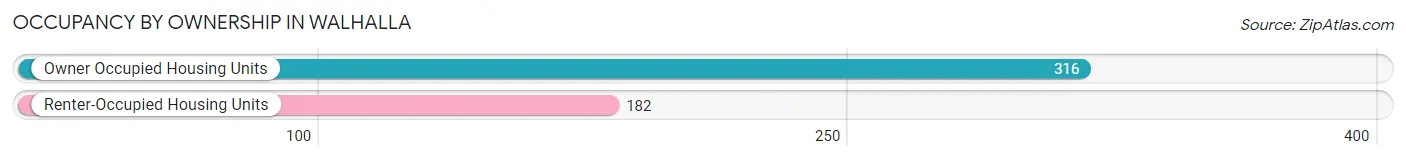
| Occupancy | # Housing Units | % Housing Units |
| Owner Occupied Housing Units | 316 | 63.4% |
| Renter-Occupied Housing Units | 182 | 36.5% |
| Total Occupied Housing Units | 498 | 100.0% |
Occupancy by Household Size in Walhalla
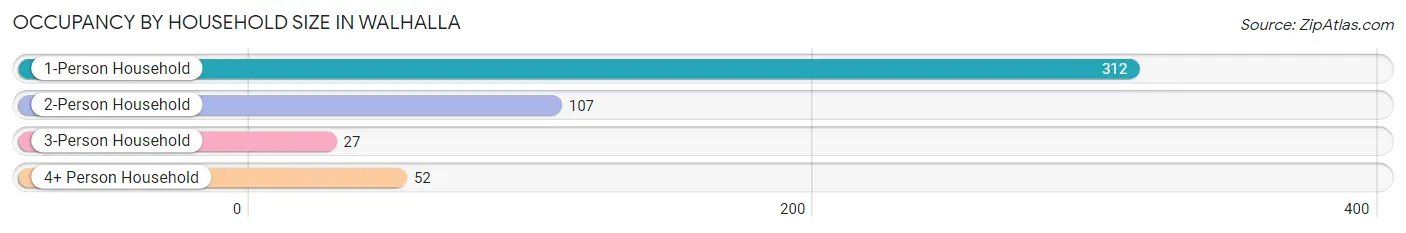
| Household Size | # Housing Units | % Housing Units |
| 1-Person Household | 312 | 62.6% |
| 2-Person Household | 107 | 21.5% |
| 3-Person Household | 27 | 5.4% |
| 4+ Person Household | 52 | 10.4% |
| Total Housing Units | 498 | 100.0% |
Occupancy by Ownership by Household Size in Walhalla
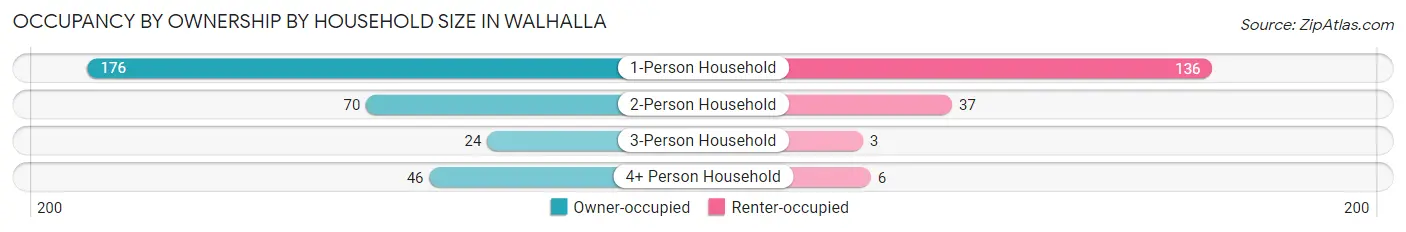
| Household Size | Owner-occupied | Renter-occupied |
| 1-Person Household | 176 (56.4%) | 136 (43.6%) |
| 2-Person Household | 70 (65.4%) | 37 (34.6%) |
| 3-Person Household | 24 (88.9%) | 3 (11.1%) |
| 4+ Person Household | 46 (88.5%) | 6 (11.5%) |
| Total Housing Units | 316 (63.4%) | 182 (36.5%) |
Occupancy by Educational Attainment in Walhalla
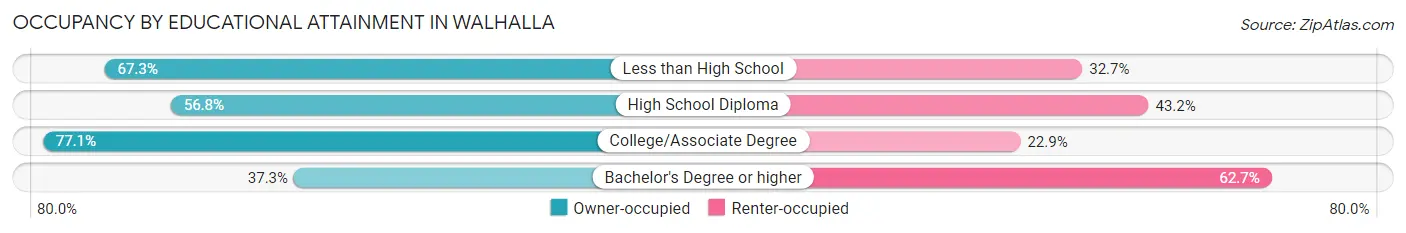
| Household Size | Owner-occupied | Renter-occupied |
| Less than High School | 70 (67.3%) | 34 (32.7%) |
| High School Diploma | 96 (56.8%) | 73 (43.2%) |
| College/Associate Degree | 128 (77.1%) | 38 (22.9%) |
| Bachelor's Degree or higher | 22 (37.3%) | 37 (62.7%) |
Occupancy by Age of Householder in Walhalla
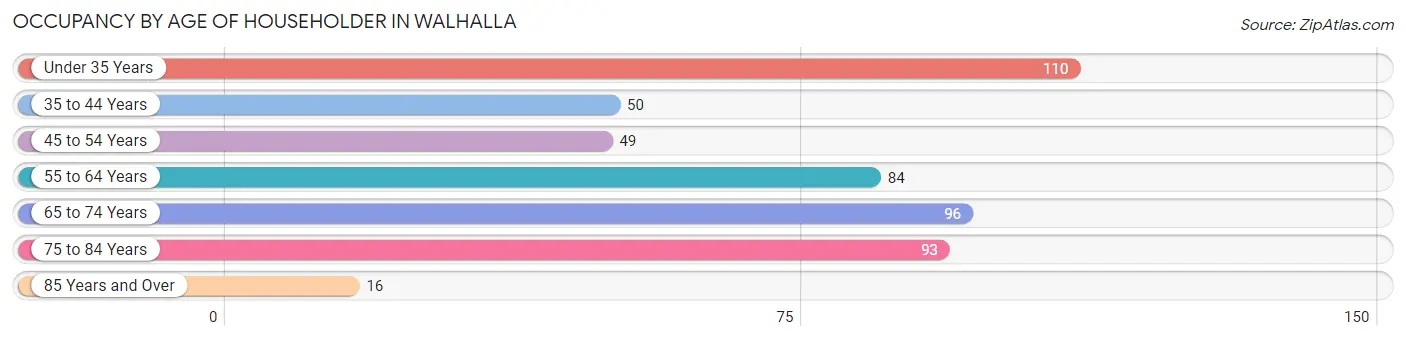
| Age Bracket | # Households | % Households |
| Under 35 Years | 110 | 22.1% |
| 35 to 44 Years | 50 | 10.0% |
| 45 to 54 Years | 49 | 9.8% |
| 55 to 64 Years | 84 | 16.9% |
| 65 to 74 Years | 96 | 19.3% |
| 75 to 84 Years | 93 | 18.7% |
| 85 Years and Over | 16 | 3.2% |
| Total | 498 | 100.0% |
Housing Finances in Walhalla
Median Income by Occupancy in Walhalla
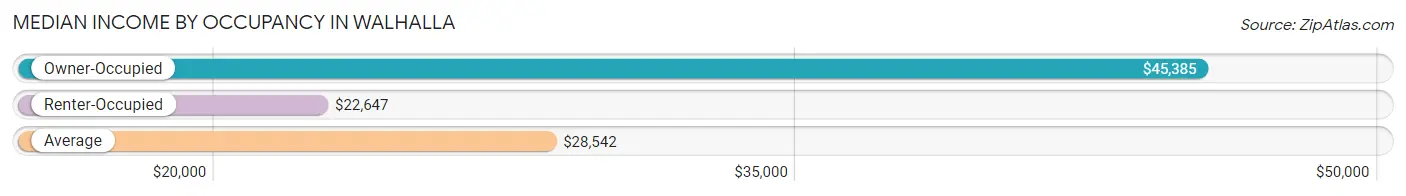
| Occupancy Type | # Households | Median Income |
| Owner-Occupied | 316 (63.4%) | $45,385 |
| Renter-Occupied | 182 (36.5%) | $22,647 |
| Average | 498 (100.0%) | $28,542 |
Occupancy by Householder Income Bracket in Walhalla
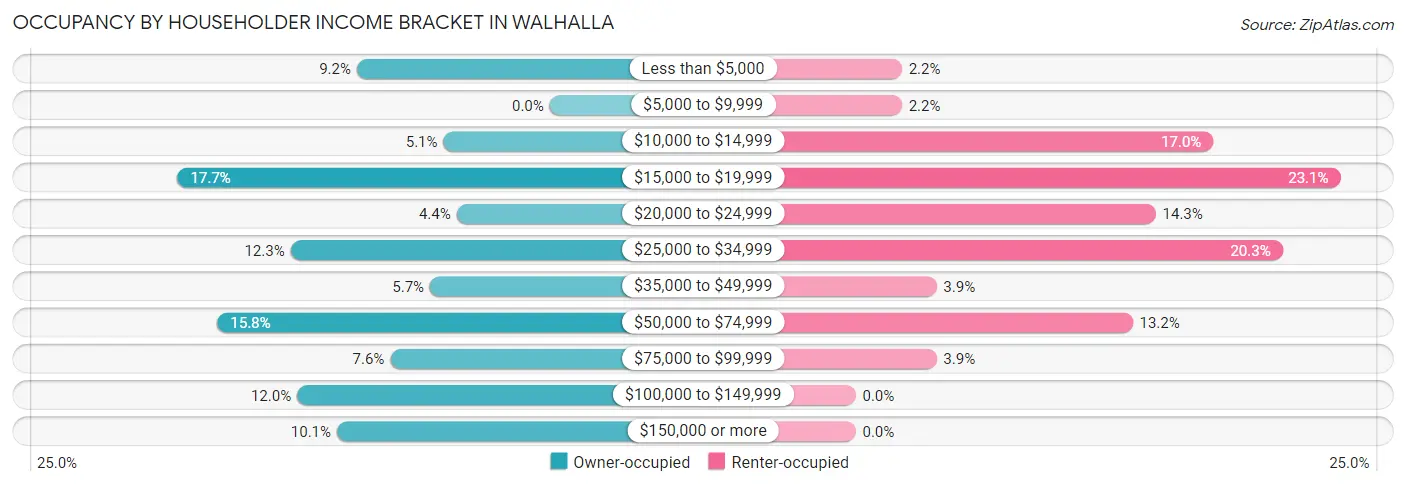
| Income Bracket | Owner-occupied | Renter-occupied |
| Less than $5,000 | 29 (9.2%) | 4 (2.2%) |
| $5,000 to $9,999 | 0 (0.0%) | 4 (2.2%) |
| $10,000 to $14,999 | 16 (5.1%) | 31 (17.0%) |
| $15,000 to $19,999 | 56 (17.7%) | 42 (23.1%) |
| $20,000 to $24,999 | 14 (4.4%) | 26 (14.3%) |
| $25,000 to $34,999 | 39 (12.3%) | 37 (20.3%) |
| $35,000 to $49,999 | 18 (5.7%) | 7 (3.8%) |
| $50,000 to $74,999 | 50 (15.8%) | 24 (13.2%) |
| $75,000 to $99,999 | 24 (7.6%) | 7 (3.8%) |
| $100,000 to $149,999 | 38 (12.0%) | 0 (0.0%) |
| $150,000 or more | 32 (10.1%) | 0 (0.0%) |
| Total | 316 (100.0%) | 182 (100.0%) |
Monthly Housing Cost Tiers in Walhalla
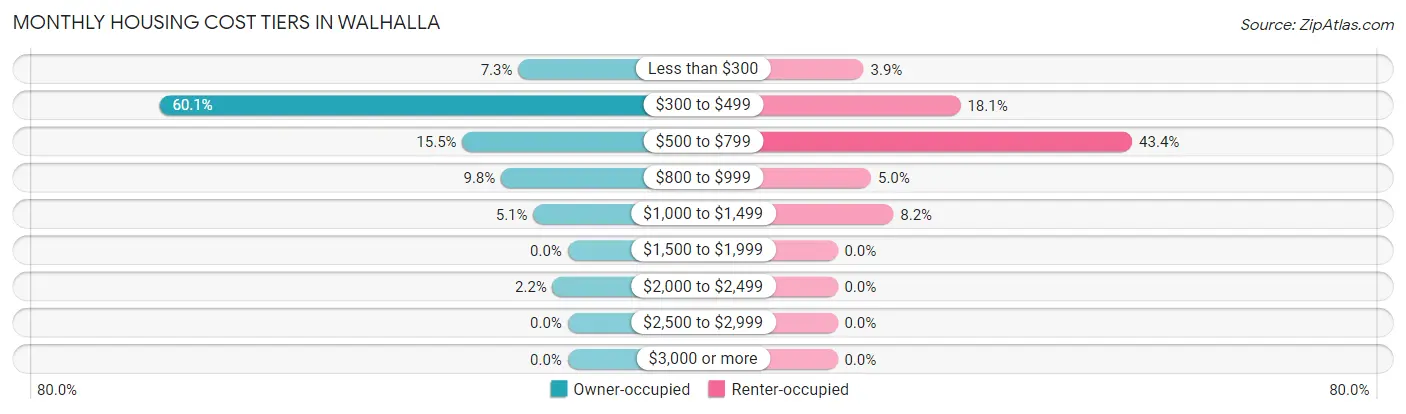
| Monthly Cost | Owner-occupied | Renter-occupied |
| Less than $300 | 23 (7.3%) | 7 (3.8%) |
| $300 to $499 | 190 (60.1%) | 33 (18.1%) |
| $500 to $799 | 49 (15.5%) | 79 (43.4%) |
| $800 to $999 | 31 (9.8%) | 9 (5.0%) |
| $1,000 to $1,499 | 16 (5.1%) | 15 (8.2%) |
| $1,500 to $1,999 | 0 (0.0%) | 0 (0.0%) |
| $2,000 to $2,499 | 7 (2.2%) | 0 (0.0%) |
| $2,500 to $2,999 | 0 (0.0%) | 0 (0.0%) |
| $3,000 or more | 0 (0.0%) | 0 (0.0%) |
| Total | 316 (100.0%) | 182 (100.0%) |
Physical Housing Characteristics in Walhalla
Housing Structures in Walhalla
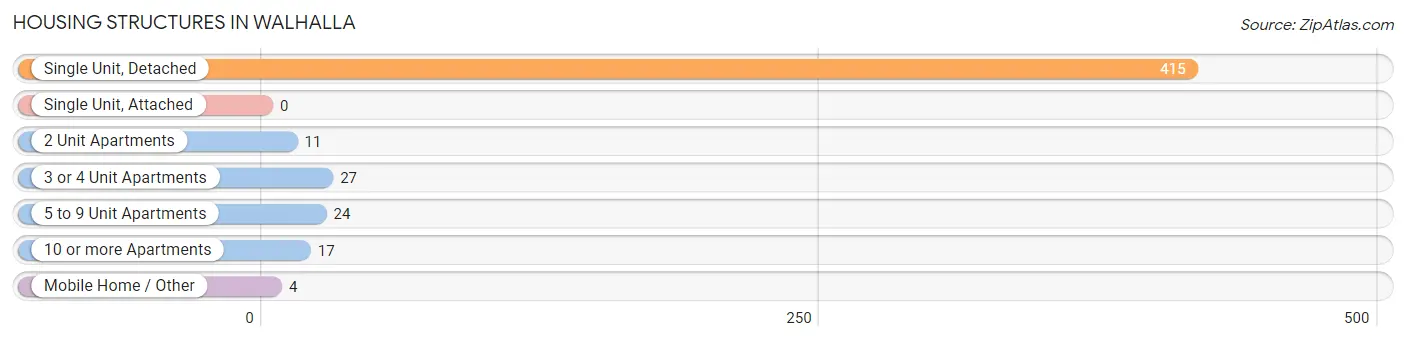
| Structure Type | # Housing Units | % Housing Units |
| Single Unit, Detached | 415 | 83.3% |
| Single Unit, Attached | 0 | 0.0% |
| 2 Unit Apartments | 11 | 2.2% |
| 3 or 4 Unit Apartments | 27 | 5.4% |
| 5 to 9 Unit Apartments | 24 | 4.8% |
| 10 or more Apartments | 17 | 3.4% |
| Mobile Home / Other | 4 | 0.8% |
| Total | 498 | 100.0% |
Housing Structures by Occupancy in Walhalla
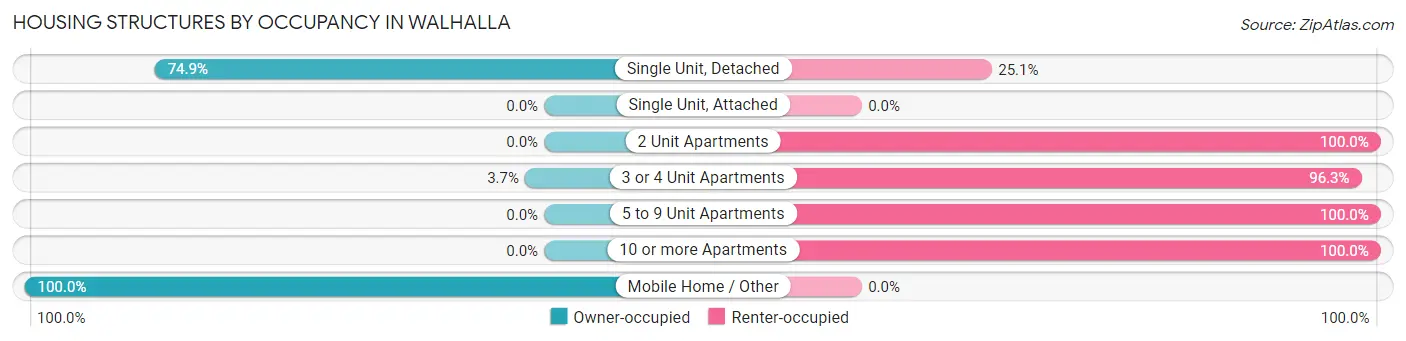
| Structure Type | Owner-occupied | Renter-occupied |
| Single Unit, Detached | 311 (74.9%) | 104 (25.1%) |
| Single Unit, Attached | 0 (0.0%) | 0 (0.0%) |
| 2 Unit Apartments | 0 (0.0%) | 11 (100.0%) |
| 3 or 4 Unit Apartments | 1 (3.7%) | 26 (96.3%) |
| 5 to 9 Unit Apartments | 0 (0.0%) | 24 (100.0%) |
| 10 or more Apartments | 0 (0.0%) | 17 (100.0%) |
| Mobile Home / Other | 4 (100.0%) | 0 (0.0%) |
| Total | 316 (63.4%) | 182 (36.5%) |
Housing Structures by Number of Rooms in Walhalla
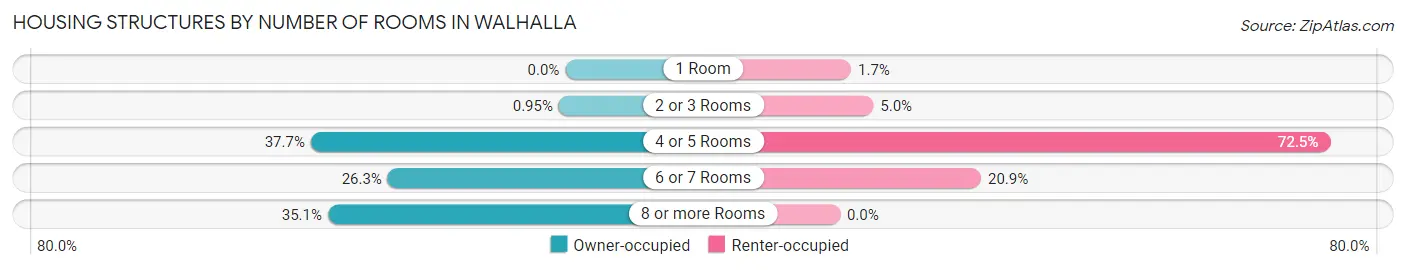
| Number of Rooms | Owner-occupied | Renter-occupied |
| 1 Room | 0 (0.0%) | 3 (1.7%) |
| 2 or 3 Rooms | 3 (0.9%) | 9 (5.0%) |
| 4 or 5 Rooms | 119 (37.7%) | 132 (72.5%) |
| 6 or 7 Rooms | 83 (26.3%) | 38 (20.9%) |
| 8 or more Rooms | 111 (35.1%) | 0 (0.0%) |
| Total | 316 (100.0%) | 182 (100.0%) |
Housing Structure by Heating Type in Walhalla
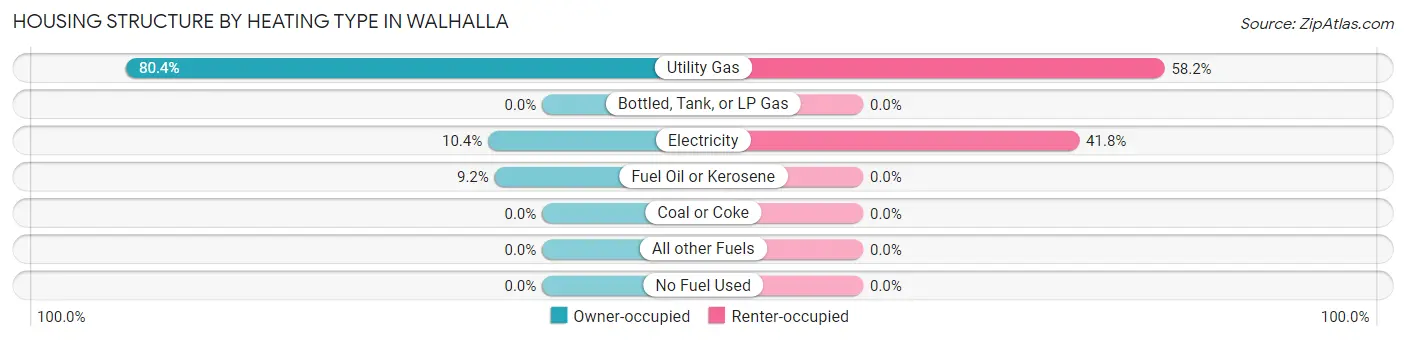
| Heating Type | Owner-occupied | Renter-occupied |
| Utility Gas | 254 (80.4%) | 106 (58.2%) |
| Bottled, Tank, or LP Gas | 0 (0.0%) | 0 (0.0%) |
| Electricity | 33 (10.4%) | 76 (41.8%) |
| Fuel Oil or Kerosene | 29 (9.2%) | 0 (0.0%) |
| Coal or Coke | 0 (0.0%) | 0 (0.0%) |
| All other Fuels | 0 (0.0%) | 0 (0.0%) |
| No Fuel Used | 0 (0.0%) | 0 (0.0%) |
| Total | 316 (100.0%) | 182 (100.0%) |
Household Vehicle Usage in Walhalla
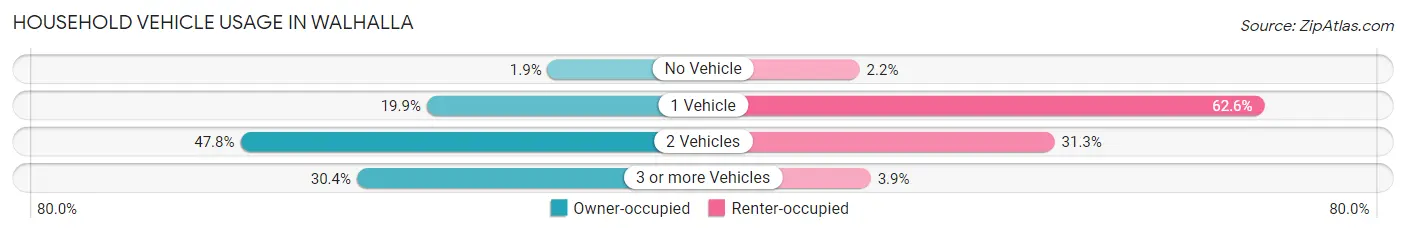
| Vehicles per Household | Owner-occupied | Renter-occupied |
| No Vehicle | 6 (1.9%) | 4 (2.2%) |
| 1 Vehicle | 63 (19.9%) | 114 (62.6%) |
| 2 Vehicles | 151 (47.8%) | 57 (31.3%) |
| 3 or more Vehicles | 96 (30.4%) | 7 (3.8%) |
| Total | 316 (100.0%) | 182 (100.0%) |
Real Estate & Mortgages in Walhalla
Real Estate and Mortgage Overview in Walhalla
| Characteristic | Without Mortgage | With Mortgage |
| Housing Units | 243 | 73 |
| Median Property Value | $107,400 | $85,000 |
| Median Household Income | $31,953 | $3 |
| Monthly Housing Costs | $433 | $0 |
| Real Estate Taxes | $1,075 | $1 |
Property Value by Mortgage Status in Walhalla
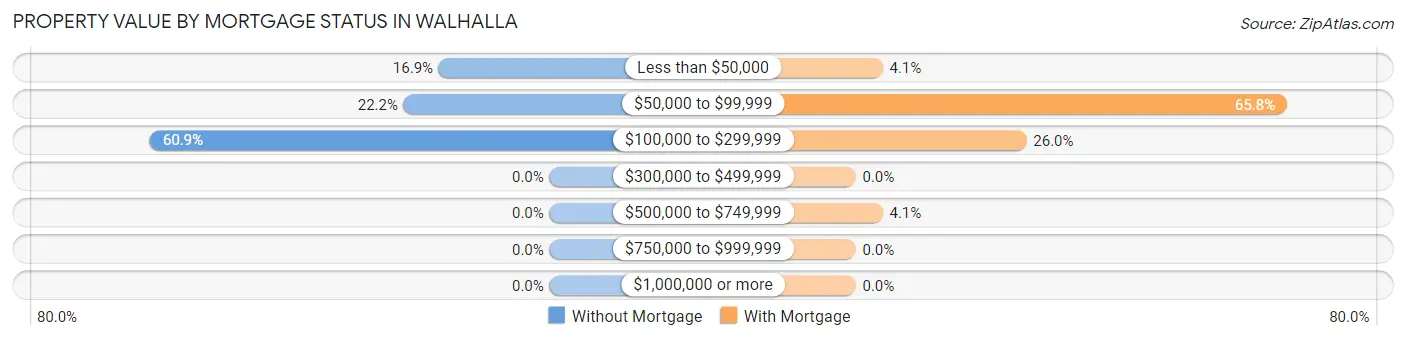
| Property Value | Without Mortgage | With Mortgage |
| Less than $50,000 | 41 (16.9%) | 3 (4.1%) |
| $50,000 to $99,999 | 54 (22.2%) | 48 (65.7%) |
| $100,000 to $299,999 | 148 (60.9%) | 19 (26.0%) |
| $300,000 to $499,999 | 0 (0.0%) | 0 (0.0%) |
| $500,000 to $749,999 | 0 (0.0%) | 3 (4.1%) |
| $750,000 to $999,999 | 0 (0.0%) | 0 (0.0%) |
| $1,000,000 or more | 0 (0.0%) | 0 (0.0%) |
| Total | 243 (100.0%) | 73 (100.0%) |
Household Income by Mortgage Status in Walhalla
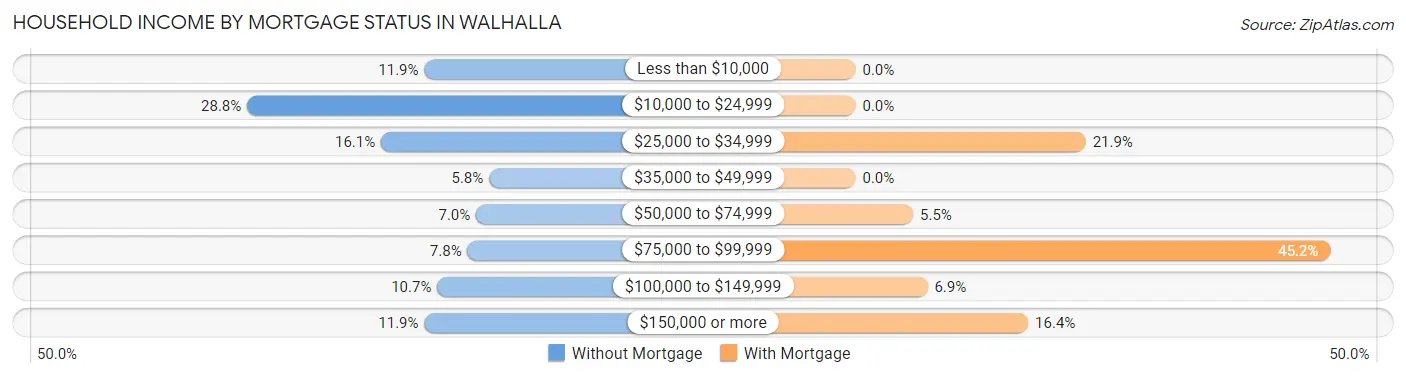
| Household Income | Without Mortgage | With Mortgage |
| Less than $10,000 | 29 (11.9%) | 0 (0.0%) |
| $10,000 to $24,999 | 70 (28.8%) | 0 (0.0%) |
| $25,000 to $34,999 | 39 (16.1%) | 16 (21.9%) |
| $35,000 to $49,999 | 14 (5.8%) | 0 (0.0%) |
| $50,000 to $74,999 | 17 (7.0%) | 4 (5.5%) |
| $75,000 to $99,999 | 19 (7.8%) | 33 (45.2%) |
| $100,000 to $149,999 | 26 (10.7%) | 5 (6.9%) |
| $150,000 or more | 29 (11.9%) | 12 (16.4%) |
| Total | 243 (100.0%) | 73 (100.0%) |
Property Value to Household Income Ratio in Walhalla
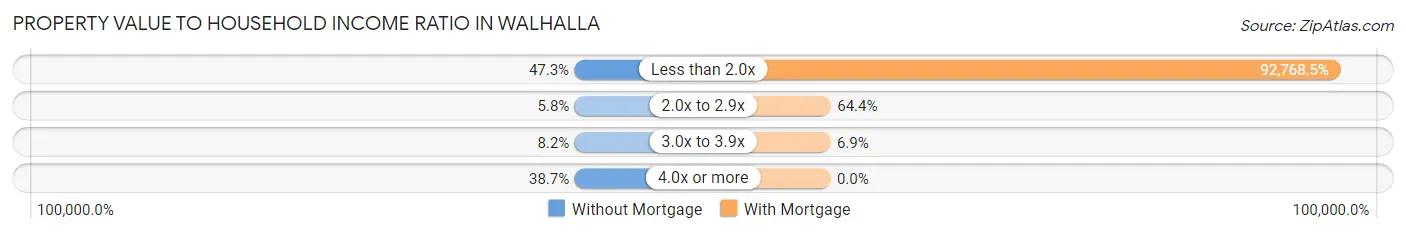
| Value-to-Income Ratio | Without Mortgage | With Mortgage |
| Less than 2.0x | 115 (47.3%) | 67,721 (92,768.5%) |
| 2.0x to 2.9x | 14 (5.8%) | 47 (64.4%) |
| 3.0x to 3.9x | 20 (8.2%) | 5 (6.9%) |
| 4.0x or more | 94 (38.7%) | 0 (0.0%) |
| Total | 243 (100.0%) | 73 (100.0%) |
Real Estate Taxes by Mortgage Status in Walhalla
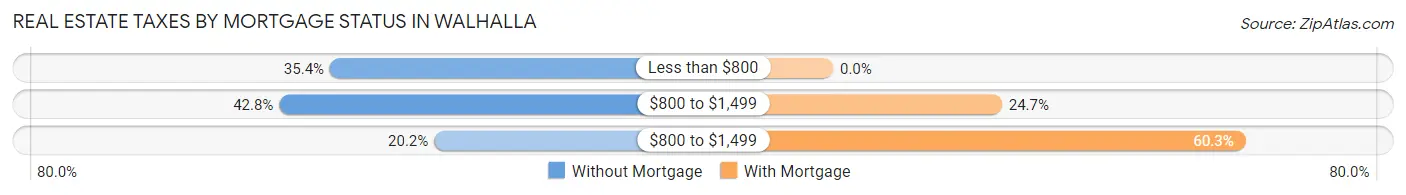
| Property Taxes | Without Mortgage | With Mortgage |
| Less than $800 | 86 (35.4%) | 0 (0.0%) |
| $800 to $1,499 | 104 (42.8%) | 18 (24.7%) |
| $800 to $1,499 | 49 (20.2%) | 44 (60.3%) |
| Total | 243 (100.0%) | 73 (100.0%) |
Health & Disability in Walhalla
Health Insurance Coverage by Age in Walhalla
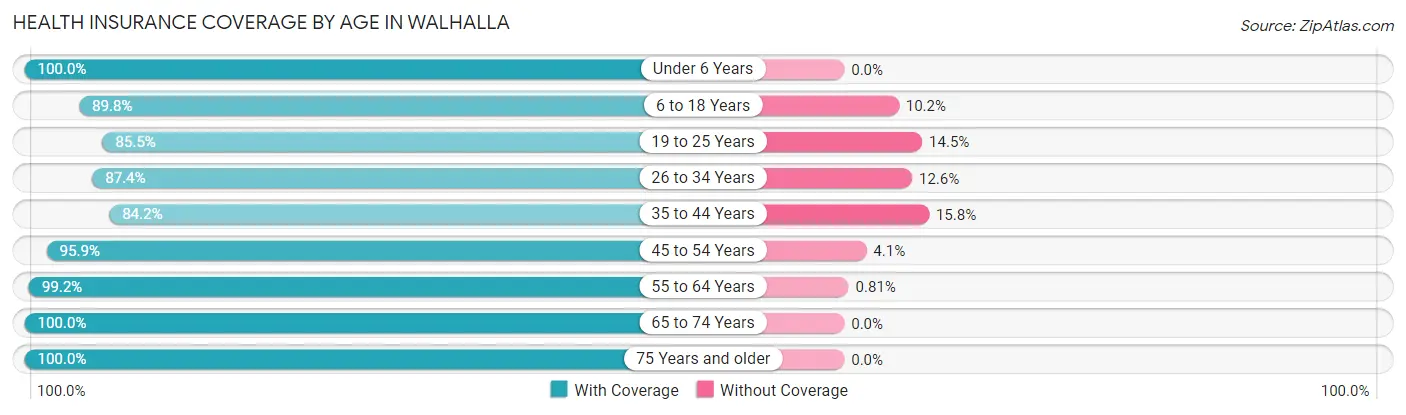
| Age Bracket | With Coverage | Without Coverage |
| Under 6 Years | 51 (100.0%) | 0 (0.0%) |
| 6 to 18 Years | 115 (89.8%) | 13 (10.2%) |
| 19 to 25 Years | 53 (85.5%) | 9 (14.5%) |
| 26 to 34 Years | 83 (87.4%) | 12 (12.6%) |
| 35 to 44 Years | 48 (84.2%) | 9 (15.8%) |
| 45 to 54 Years | 93 (95.9%) | 4 (4.1%) |
| 55 to 64 Years | 123 (99.2%) | 1 (0.8%) |
| 65 to 74 Years | 130 (100.0%) | 0 (0.0%) |
| 75 Years and older | 127 (100.0%) | 0 (0.0%) |
| Total | 823 (94.5%) | 48 (5.5%) |
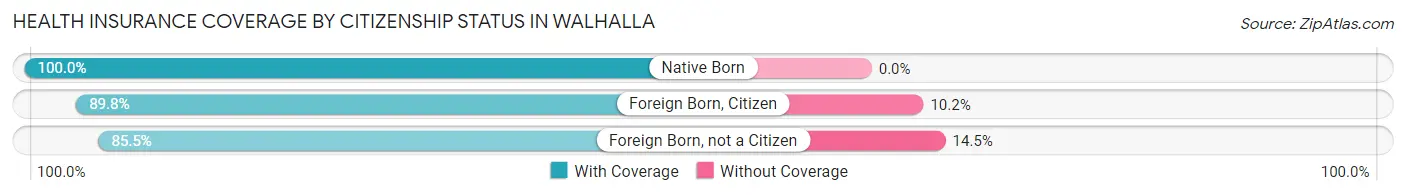
Health Insurance Coverage by Citizenship Status in Walhalla
| Citizenship Status | With Coverage | Without Coverage |
| Native Born | 51 (100.0%) | 0 (0.0%) |
| Foreign Born, Citizen | 115 (89.8%) | 13 (10.2%) |
| Foreign Born, not a Citizen | 53 (85.5%) | 9 (14.5%) |
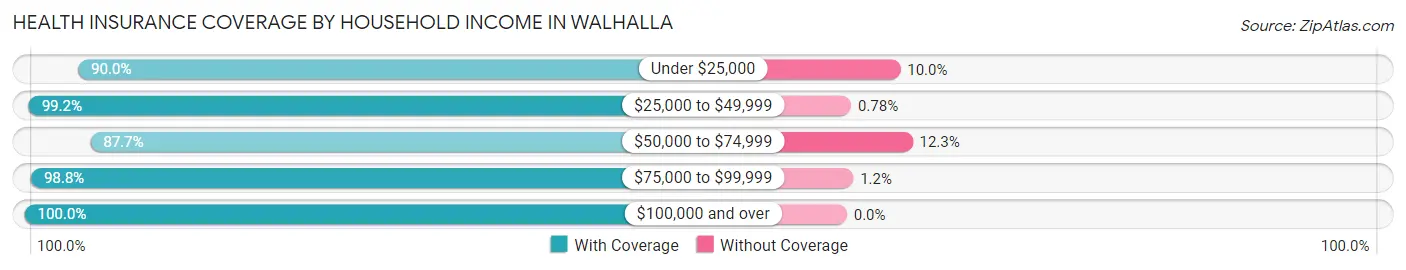
Health Insurance Coverage by Household Income in Walhalla
| Household Income | With Coverage | Without Coverage |
| Under $25,000 | 260 (90.0%) | 29 (10.0%) |
| $25,000 to $49,999 | 128 (99.2%) | 1 (0.8%) |
| $50,000 to $74,999 | 121 (87.7%) | 17 (12.3%) |
| $75,000 to $99,999 | 82 (98.8%) | 1 (1.2%) |
| $100,000 and over | 232 (100.0%) | 0 (0.0%) |
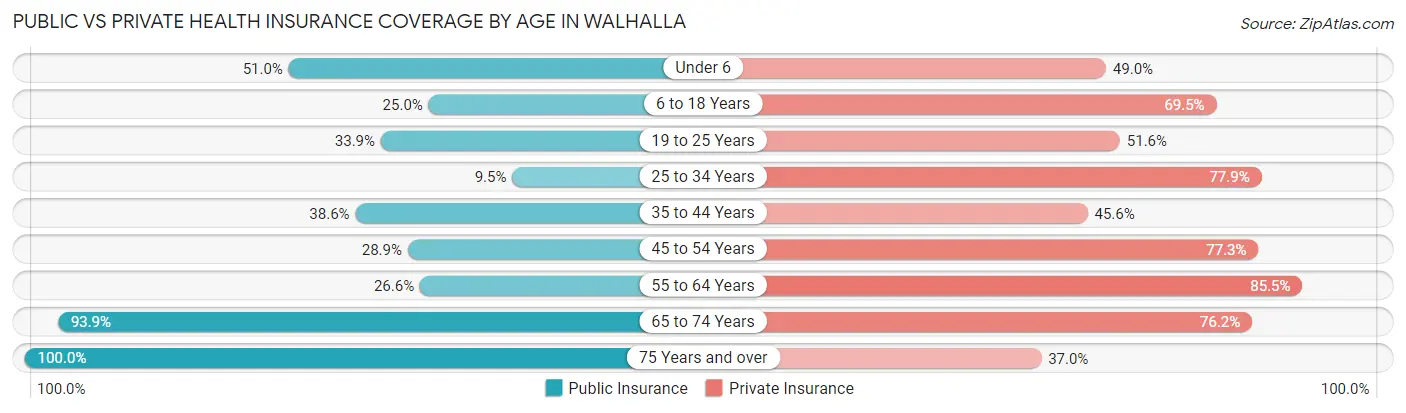
Public vs Private Health Insurance Coverage by Age in Walhalla
| Age Bracket | Public Insurance | Private Insurance |
| Under 6 | 26 (51.0%) | 25 (49.0%) |
| 6 to 18 Years | 32 (25.0%) | 89 (69.5%) |
| 19 to 25 Years | 21 (33.9%) | 32 (51.6%) |
| 25 to 34 Years | 9 (9.5%) | 74 (77.9%) |
| 35 to 44 Years | 22 (38.6%) | 26 (45.6%) |
| 45 to 54 Years | 28 (28.9%) | 75 (77.3%) |
| 55 to 64 Years | 33 (26.6%) | 106 (85.5%) |
| 65 to 74 Years | 122 (93.9%) | 99 (76.1%) |
| 75 Years and over | 127 (100.0%) | 47 (37.0%) |
| Total | 420 (48.2%) | 573 (65.8%) |
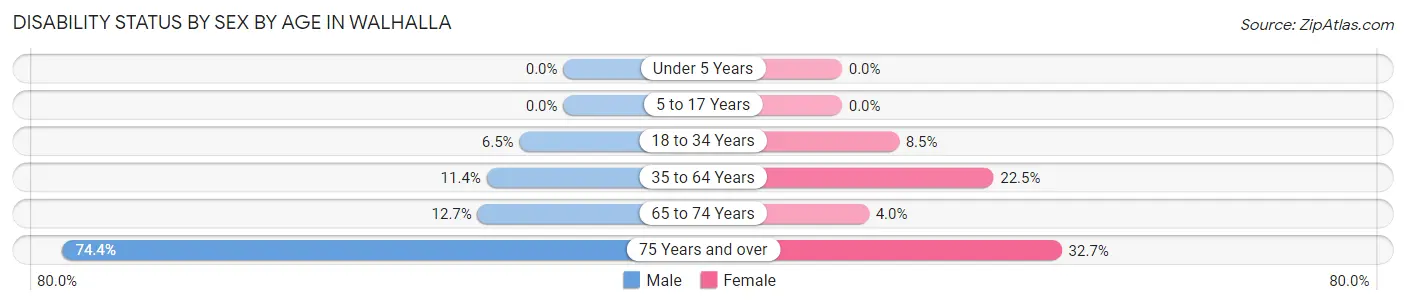
Disability Status by Sex by Age in Walhalla
| Age Bracket | Male | Female |
| Under 5 Years | 0 (0.0%) | 0 (0.0%) |
| 5 to 17 Years | 0 (0.0%) | 0 (0.0%) |
| 18 to 34 Years | 6 (6.5%) | 6 (8.5%) |
| 35 to 64 Years | 18 (11.4%) | 27 (22.5%) |
| 65 to 74 Years | 7 (12.7%) | 3 (4.0%) |
| 75 Years and over | 58 (74.4%) | 16 (32.7%) |
Disability Class by Sex by Age in Walhalla
Disability Class: Hearing Difficulty
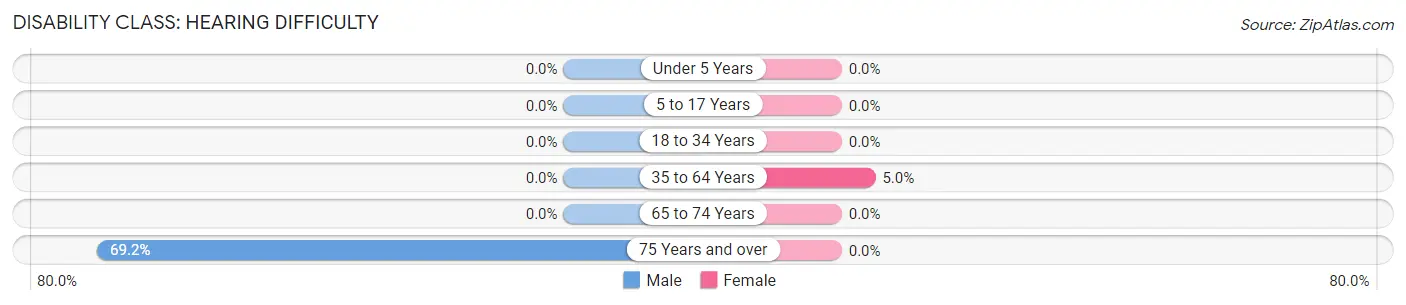
| Age Bracket | Male | Female |
| Under 5 Years | 0 (0.0%) | 0 (0.0%) |
| 5 to 17 Years | 0 (0.0%) | 0 (0.0%) |
| 18 to 34 Years | 0 (0.0%) | 0 (0.0%) |
| 35 to 64 Years | 0 (0.0%) | 6 (5.0%) |
| 65 to 74 Years | 0 (0.0%) | 0 (0.0%) |
| 75 Years and over | 54 (69.2%) | 0 (0.0%) |
Disability Class: Vision Difficulty
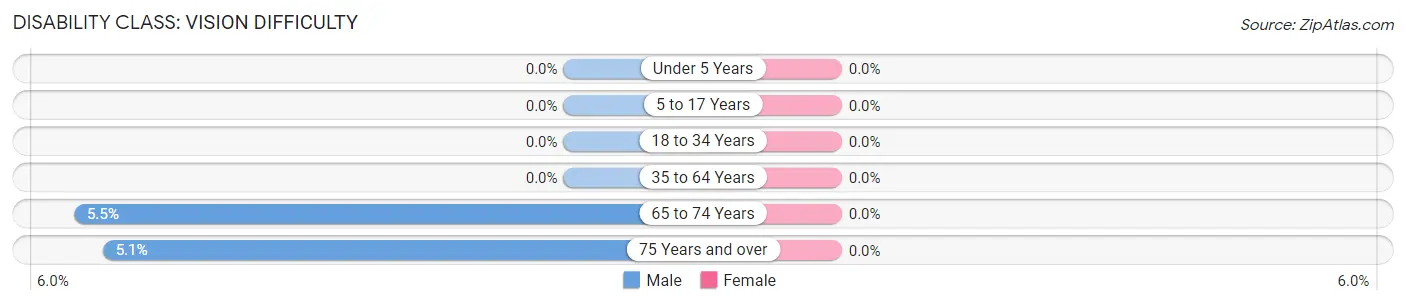
| Age Bracket | Male | Female |
| Under 5 Years | 0 (0.0%) | 0 (0.0%) |
| 5 to 17 Years | 0 (0.0%) | 0 (0.0%) |
| 18 to 34 Years | 0 (0.0%) | 0 (0.0%) |
| 35 to 64 Years | 0 (0.0%) | 0 (0.0%) |
| 65 to 74 Years | 3 (5.4%) | 0 (0.0%) |
| 75 Years and over | 4 (5.1%) | 0 (0.0%) |
Disability Class: Cognitive Difficulty
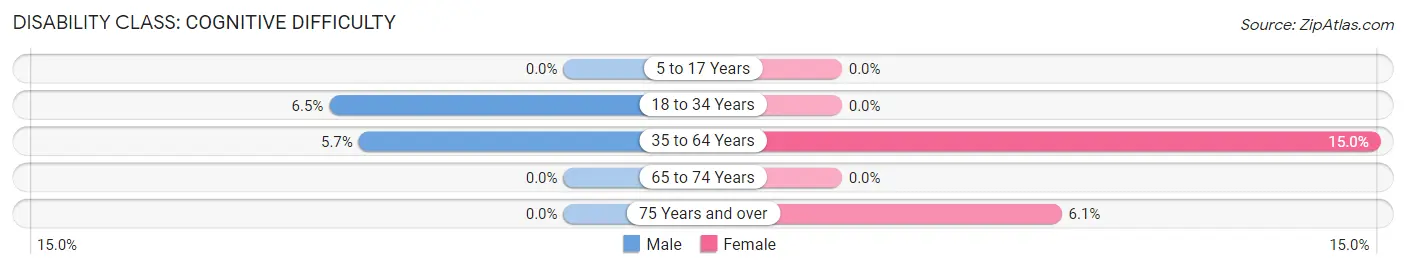
| Age Bracket | Male | Female |
| 5 to 17 Years | 0 (0.0%) | 0 (0.0%) |
| 18 to 34 Years | 6 (6.5%) | 0 (0.0%) |
| 35 to 64 Years | 9 (5.7%) | 18 (15.0%) |
| 65 to 74 Years | 0 (0.0%) | 0 (0.0%) |
| 75 Years and over | 0 (0.0%) | 3 (6.1%) |
Disability Class: Ambulatory Difficulty
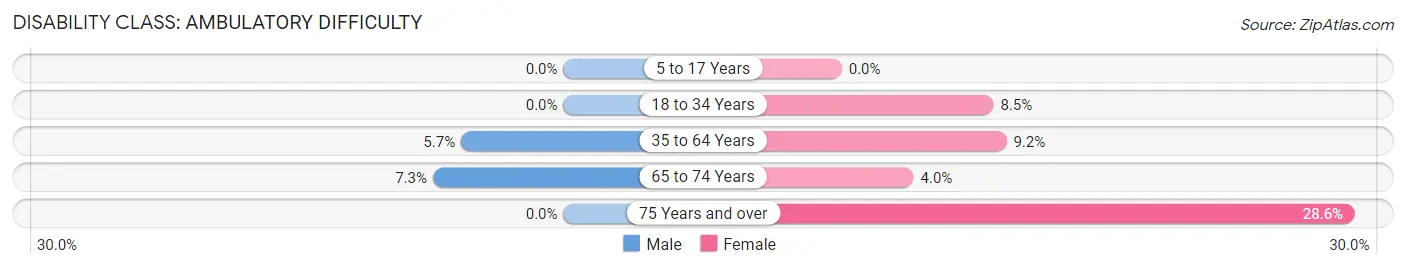
| Age Bracket | Male | Female |
| 5 to 17 Years | 0 (0.0%) | 0 (0.0%) |
| 18 to 34 Years | 0 (0.0%) | 6 (8.5%) |
| 35 to 64 Years | 9 (5.7%) | 11 (9.2%) |
| 65 to 74 Years | 4 (7.3%) | 3 (4.0%) |
| 75 Years and over | 0 (0.0%) | 14 (28.6%) |
Disability Class: Self-Care Difficulty
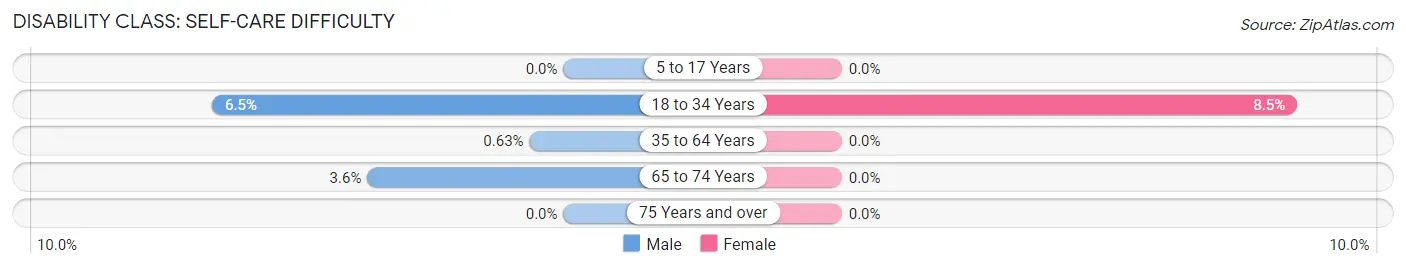
| Age Bracket | Male | Female |
| 5 to 17 Years | 0 (0.0%) | 0 (0.0%) |
| 18 to 34 Years | 6 (6.5%) | 6 (8.5%) |
| 35 to 64 Years | 1 (0.6%) | 0 (0.0%) |
| 65 to 74 Years | 2 (3.6%) | 0 (0.0%) |
| 75 Years and over | 0 (0.0%) | 0 (0.0%) |
Technology Access in Walhalla
Computing Device Access in Walhalla
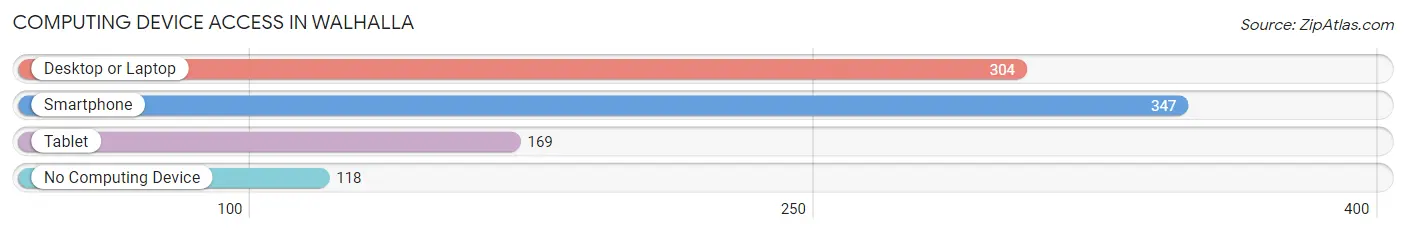
| Device Type | # Households | % Households |
| Desktop or Laptop | 304 | 61.0% |
| Smartphone | 347 | 69.7% |
| Tablet | 169 | 33.9% |
| No Computing Device | 118 | 23.7% |
| Total | 498 | 100.0% |
Internet Access in Walhalla
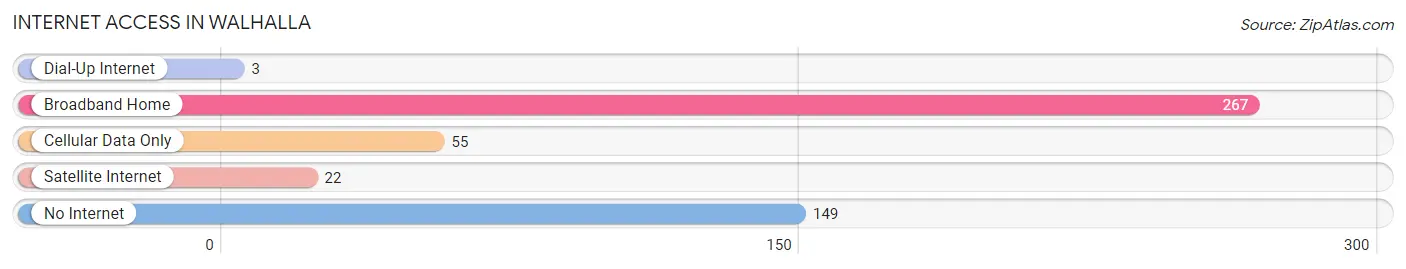
| Internet Type | # Households | % Households |
| Dial-Up Internet | 3 | 0.6% |
| Broadband Home | 267 | 53.6% |
| Cellular Data Only | 55 | 11.0% |
| Satellite Internet | 22 | 4.4% |
| No Internet | 149 | 29.9% |
| Total | 498 | 100.0% |
Walhalla Summary
Walhalla is a small city located in the northeastern corner of North Dakota, United States. It is the county seat of Pembina County and is situated on the banks of the Pembina River. The city has a population of 1,092 as of the 2010 census.
History
Walhalla was founded in 1871 by Norwegian settlers who had come to the area in search of religious freedom. The city was named after the Norse mythological hall of the dead, Valhalla. The settlers built a log church and a school, and the city was incorporated in 1881.
In the late 19th century, Walhalla was a thriving agricultural and commercial center. The city was home to several banks, a newspaper, a hotel, a flour mill, and a creamery. The city also had a railroad station, which connected it to the rest of the state.
Geography
Walhalla is located in the northeastern corner of North Dakota, at the intersection of U.S. Route 2 and North Dakota Highway 32. The city is situated on the banks of the Pembina River, which flows through the city. The city is surrounded by rolling hills and farmland.
The city has a total area of 1.2 square miles, all of which is land. The city has a humid continental climate, with cold winters and hot summers.
Economy
The economy of Walhalla is largely based on agriculture. The city is home to several farms, which produce a variety of crops, including wheat, corn, soybeans, and sunflowers. The city also has several businesses, including a grocery store, a hardware store, and a restaurant.
Demographics
As of the 2010 census, the population of Walhalla was 1,092. The racial makeup of the city was 97.2% White, 0.7% Native American, 0.2% Asian, 0.1% from other races, and 1.8% from two or more races. The median household income was $41,250, and the median family income was $50,000.
The city has a large Norwegian-American population, with many of the city's residents tracing their ancestry back to the original Norwegian settlers. The city also has a small Native American population, with many of the city's residents being of Ojibwe descent.
Conclusion
Walhalla is a small city located in the northeastern corner of North Dakota. It was founded in 1871 by Norwegian settlers and has since become a thriving agricultural and commercial center. The city has a population of 1,092 and a large Norwegian-American population. The economy of Walhalla is largely based on agriculture, and the city is home to several businesses.
Common Questions
What is Per Capita Income in Walhalla?
Per Capita income in Walhalla is $28,546.
What is the Median Family Income in Walhalla?
Median Family Income in Walhalla is $69,167.
What is the Median Household income in Walhalla?
Median Household Income in Walhalla is $28,542.
What is Income or Wage Gap in Walhalla?
Income or Wage Gap in Walhalla is 43.3%.
Women in Walhalla earn 56.7 cents for every dollar earned by a man.
What is Inequality or Gini Index in Walhalla?
Inequality or Gini Index in Walhalla is 0.52.
What is the Total Population of Walhalla?
Total Population of Walhalla is 910.
What is the Total Male Population of Walhalla?
Total Male Population of Walhalla is 531.
What is the Total Female Population of Walhalla?
Total Female Population of Walhalla is 379.
What is the Ratio of Males per 100 Females in Walhalla?
There are 140.11 Males per 100 Females in Walhalla.
What is the Ratio of Females per 100 Males in Walhalla?
There are 71.37 Females per 100 Males in Walhalla.
What is the Median Population Age in Walhalla?
Median Population Age in Walhalla is 49.4 Years.
What is the Average Family Size in Walhalla
Average Family Size in Walhalla is 2.9 People.
What is the Average Household Size in Walhalla
Average Household Size in Walhalla is 1.8 People.
How Large is the Labor Force in Walhalla?
There are 369 People in the Labor Forcein in Walhalla.
What is the Percentage of People in the Labor Force in Walhalla?
47.4% of People are in the Labor Force in Walhalla.
What is the Unemployment Rate in Walhalla?
Unemployment Rate in Walhalla is 4.3%.