Carpio, ND Map & Demographics
Carpio Map
Carpio Overview
$38,673
PER CAPITA INCOME
$63,750
AVG FAMILY INCOME
$61,500
AVG HOUSEHOLD INCOME
45.9%
WAGE / INCOME GAP [ % ]
54.1¢/ $1
WAGE / INCOME GAP [ $ ]
0.41
INEQUALITY / GINI INDEX
146
TOTAL POPULATION
80
MALE POPULATION
66
FEMALE POPULATION
121.21
MALES / 100 FEMALES
82.50
FEMALES / 100 MALES
44.0
MEDIAN AGE
2.9
AVG FAMILY SIZE
2.6
AVG HOUSEHOLD SIZE
75
LABOR FORCE [ PEOPLE ]
69.4%
PERCENT IN LABOR FORCE
Carpio Zip Codes
Carpio Area Codes
Income in Carpio
Income Overview in Carpio
Per Capita Income in Carpio is $38,673, while median incomes of families and households are $63,750 and $61,500 respectively.
| Characteristic | Number | Measure |
| Per Capita Income | 146 | $38,673 |
| Median Family Income | 46 | $63,750 |
| Mean Family Income | 46 | $108,170 |
| Median Household Income | 56 | $61,500 |
| Mean Household Income | 56 | $100,302 |
| Income Deficit | 46 | $0 |
| Wage / Income Gap (%) | 146 | 45.88% |
| Wage / Income Gap ($) | 146 | 54.12¢ per $1 |
| Gini / Inequality Index | 146 | 0.41 |
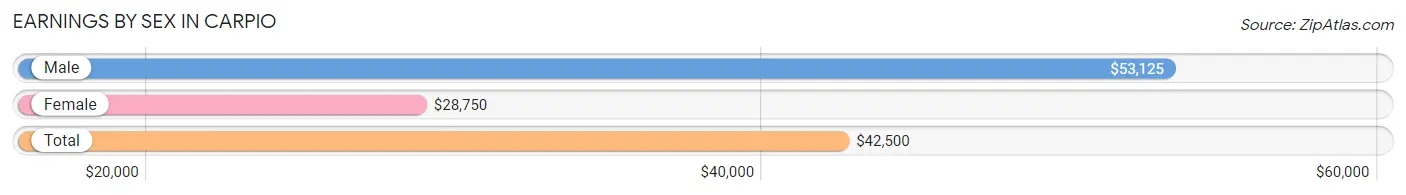
Earnings by Sex in Carpio
Average Earnings in Carpio are $42,500, $53,125 for men and $28,750 for women, a difference of 45.9%.
| Sex | Number | Average Earnings |
| Male | 51 (62.2%) | $53,125 |
| Female | 31 (37.8%) | $28,750 |
| Total | 82 (100.0%) | $42,500 |
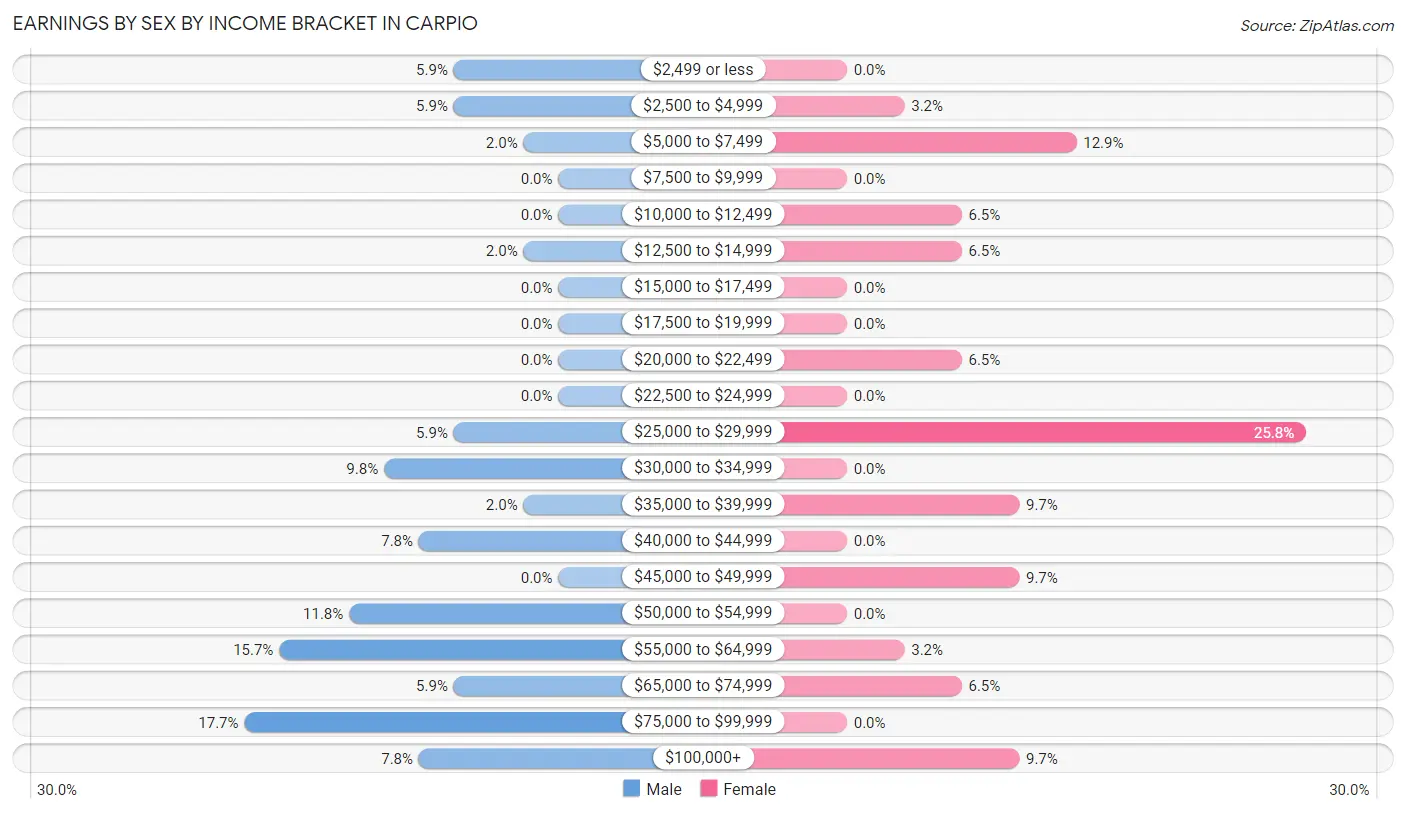
Earnings by Sex by Income Bracket in Carpio
The most common earnings brackets in Carpio are $75,000 to $99,999 for men (9 | 17.6%) and $25,000 to $29,999 for women (8 | 25.8%).
| Income | Male | Female |
| $2,499 or less | 3 (5.9%) | 0 (0.0%) |
| $2,500 to $4,999 | 3 (5.9%) | 1 (3.2%) |
| $5,000 to $7,499 | 1 (2.0%) | 4 (12.9%) |
| $7,500 to $9,999 | 0 (0.0%) | 0 (0.0%) |
| $10,000 to $12,499 | 0 (0.0%) | 2 (6.5%) |
| $12,500 to $14,999 | 1 (2.0%) | 2 (6.5%) |
| $15,000 to $17,499 | 0 (0.0%) | 0 (0.0%) |
| $17,500 to $19,999 | 0 (0.0%) | 0 (0.0%) |
| $20,000 to $22,499 | 0 (0.0%) | 2 (6.5%) |
| $22,500 to $24,999 | 0 (0.0%) | 0 (0.0%) |
| $25,000 to $29,999 | 3 (5.9%) | 8 (25.8%) |
| $30,000 to $34,999 | 5 (9.8%) | 0 (0.0%) |
| $35,000 to $39,999 | 1 (2.0%) | 3 (9.7%) |
| $40,000 to $44,999 | 4 (7.8%) | 0 (0.0%) |
| $45,000 to $49,999 | 0 (0.0%) | 3 (9.7%) |
| $50,000 to $54,999 | 6 (11.8%) | 0 (0.0%) |
| $55,000 to $64,999 | 8 (15.7%) | 1 (3.2%) |
| $65,000 to $74,999 | 3 (5.9%) | 2 (6.5%) |
| $75,000 to $99,999 | 9 (17.6%) | 0 (0.0%) |
| $100,000+ | 4 (7.8%) | 3 (9.7%) |
| Total | 51 (100.0%) | 31 (100.0%) |
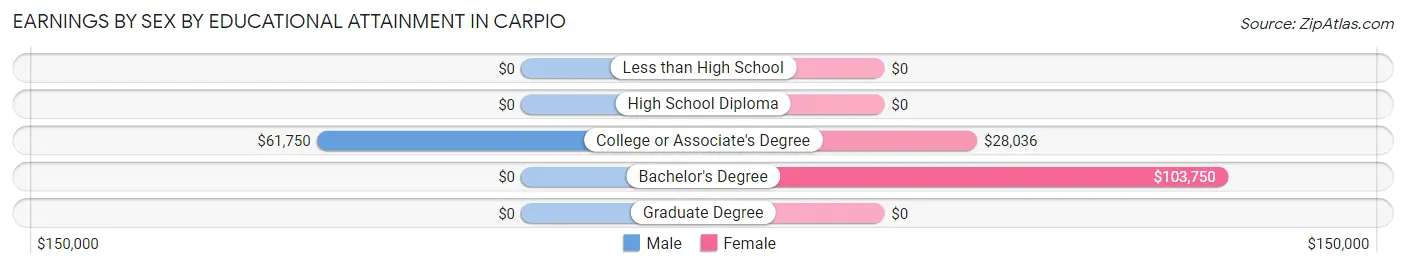
Earnings by Sex by Educational Attainment in Carpio
Average earnings in Carpio are $61,000 for men and $28,750 for women, a difference of 52.9%. Men with an educational attainment of college or associate's degree enjoy the highest average annual earnings of $61,750, while those with college or associate's degree education earn the least with $61,750. Women with an educational attainment of bachelor's degree earn the most with the average annual earnings of $103,750, while those with college or associate's degree education have the smallest earnings of $28,036.
| Educational Attainment | Male Income | Female Income |
| Less than High School | - | - |
| High School Diploma | - | - |
| College or Associate's Degree | $61,750 | $28,036 |
| Bachelor's Degree | - | - |
| Graduate Degree | - | - |
| Total | $61,000 | $28,750 |
Family Income in Carpio
Family Income Brackets in Carpio
According to the Carpio family income data, there are 20 families falling into the $50,000 to $74,999 income range, which is the most common income bracket and makes up 43.5% of all families.
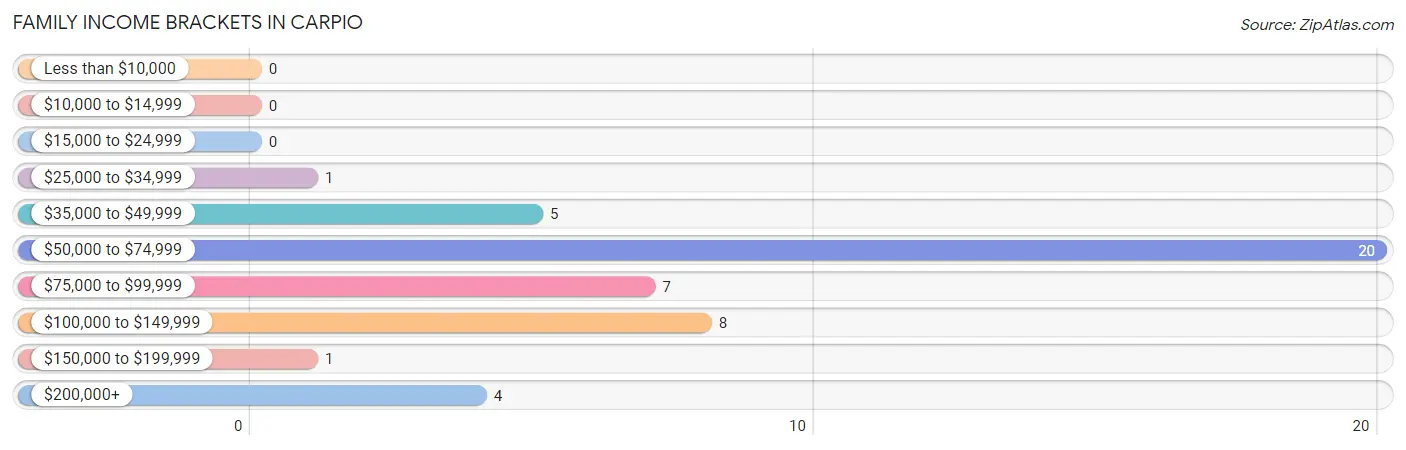
| Income Bracket | # Families | % Families |
| Less than $10,000 | 0 | 0.0% |
| $10,000 to $14,999 | 0 | 0.0% |
| $15,000 to $24,999 | 0 | 0.0% |
| $25,000 to $34,999 | 1 | 2.2% |
| $35,000 to $49,999 | 5 | 10.9% |
| $50,000 to $74,999 | 20 | 43.5% |
| $75,000 to $99,999 | 7 | 15.2% |
| $100,000 to $149,999 | 8 | 17.4% |
| $150,000 to $199,999 | 1 | 2.2% |
| $200,000+ | 4 | 8.7% |
Family Income by Famaliy Size in Carpio
3-person families (9 | 19.6%) account for the highest median family income in Carpio with $106,875 per family, while 3-person families (9 | 19.6%) have the highest median income of $35,625 per family member.
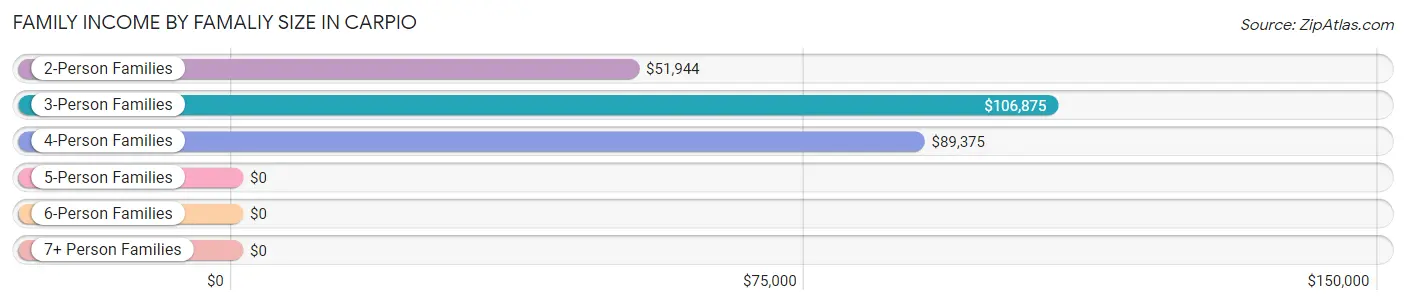
| Income Bracket | # Families | Median Income |
| 2-Person Families | 26 (56.5%) | $51,944 |
| 3-Person Families | 9 (19.6%) | $106,875 |
| 4-Person Families | 5 (10.9%) | $89,375 |
| 5-Person Families | 6 (13.0%) | $0 |
| 6-Person Families | 0 (0.0%) | $0 |
| 7+ Person Families | 0 (0.0%) | $0 |
| Total | 46 (100.0%) | $63,750 |
Family Income by Number of Earners in Carpio
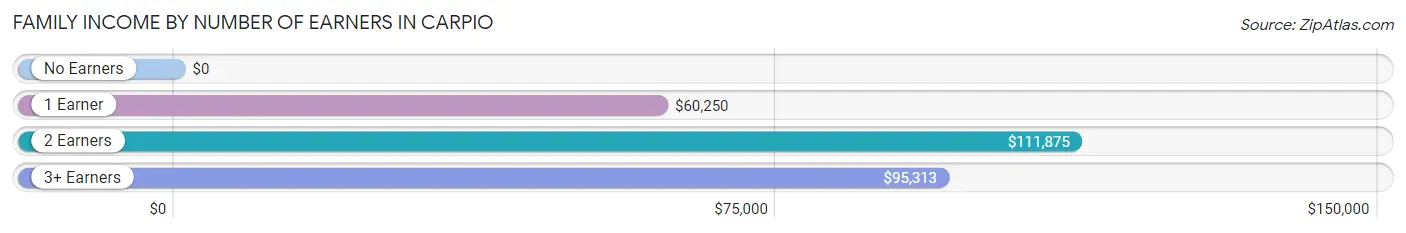
| Number of Earners | # Families | Median Income |
| No Earners | 5 (10.9%) | $0 |
| 1 Earner | 15 (32.6%) | $60,250 |
| 2 Earners | 19 (41.3%) | $111,875 |
| 3+ Earners | 7 (15.2%) | $95,313 |
| Total | 46 (100.0%) | $63,750 |
Household Income in Carpio
Household Income Brackets in Carpio
With 23 households falling in the category, the $50,000 to $74,999 income range is the most frequent in Carpio, accounting for 41.1% of all households.
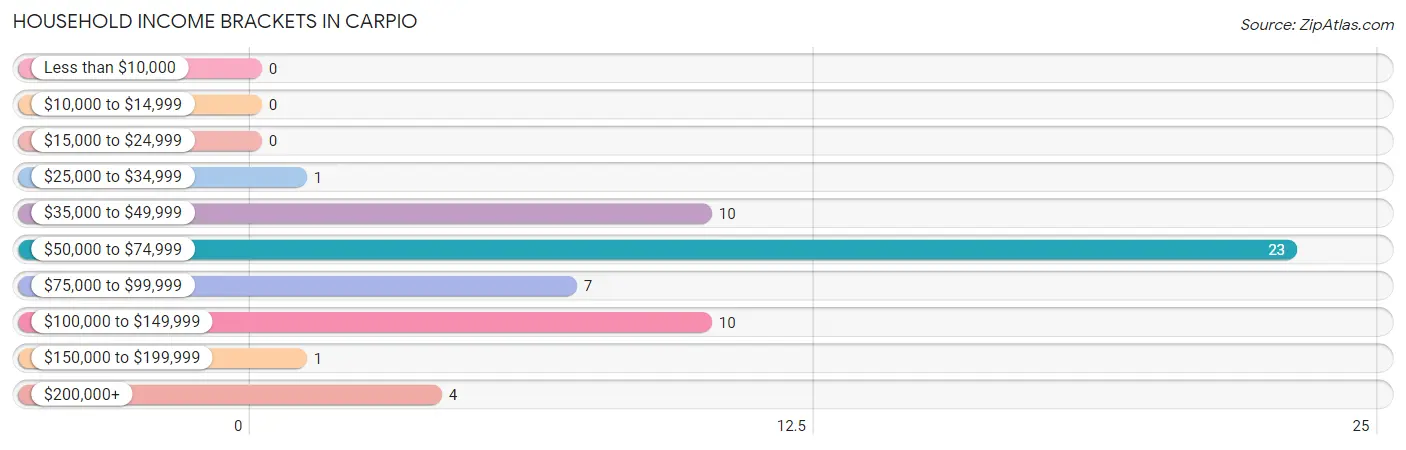
| Income Bracket | # Households | % Households |
| Less than $10,000 | 0 | 0.0% |
| $10,000 to $14,999 | 0 | 0.0% |
| $15,000 to $24,999 | 0 | 0.0% |
| $25,000 to $34,999 | 1 | 1.8% |
| $35,000 to $49,999 | 10 | 17.9% |
| $50,000 to $74,999 | 23 | 41.1% |
| $75,000 to $99,999 | 7 | 12.5% |
| $100,000 to $149,999 | 10 | 17.9% |
| $150,000 to $199,999 | 1 | 1.8% |
| $200,000+ | 4 | 7.1% |
Household Income by Householder Age in Carpio
The median household income in Carpio is $61,500, with the highest median household income of $88,750 found in the 25 to 44 years age bracket for the primary householder. A total of 6 households (10.7%) fall into this category. Meanwhile, the 15 to 24 years age bracket for the primary householder has the lowest median household income of $0, with 4 households (7.1%) in this group.
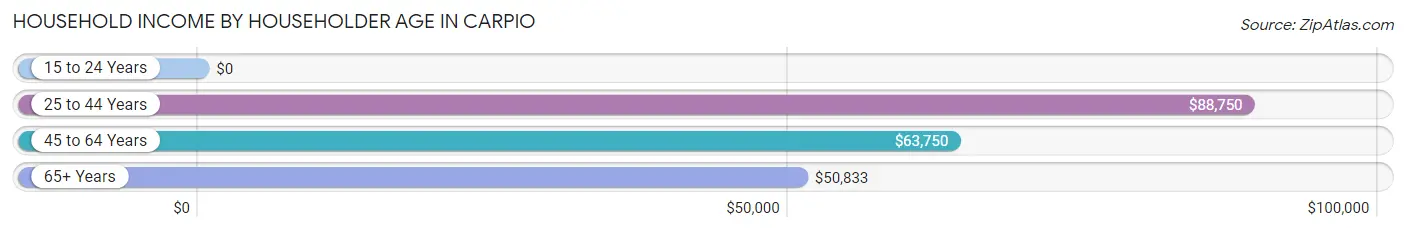
| Income Bracket | # Households | Median Income |
| 15 to 24 Years | 4 (7.1%) | $0 |
| 25 to 44 Years | 6 (10.7%) | $88,750 |
| 45 to 64 Years | 38 (67.9%) | $63,750 |
| 65+ Years | 8 (14.3%) | $50,833 |
| Total | 56 (100.0%) | $61,500 |
Poverty in Carpio
Income Below Poverty by Sex and Age in Carpio
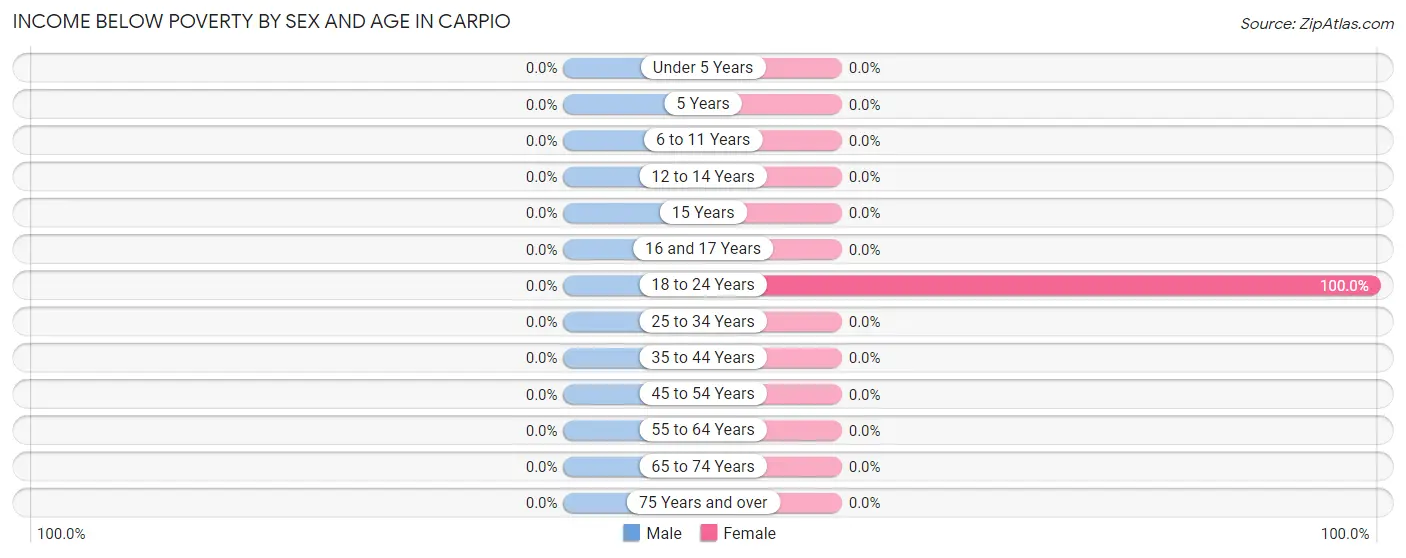
| Age Bracket | Male | Female |
| Under 5 Years | 0 (0.0%) | 0 (0.0%) |
| 5 Years | 0 (0.0%) | 0 (0.0%) |
| 6 to 11 Years | 0 (0.0%) | 0 (0.0%) |
| 12 to 14 Years | 0 (0.0%) | 0 (0.0%) |
| 15 Years | 0 (0.0%) | 0 (0.0%) |
| 16 and 17 Years | 0 (0.0%) | 0 (0.0%) |
| 18 to 24 Years | 0 (0.0%) | 2 (100.0%) |
| 25 to 34 Years | 0 (0.0%) | 0 (0.0%) |
| 35 to 44 Years | 0 (0.0%) | 0 (0.0%) |
| 45 to 54 Years | 0 (0.0%) | 0 (0.0%) |
| 55 to 64 Years | 0 (0.0%) | 0 (0.0%) |
| 65 to 74 Years | 0 (0.0%) | 0 (0.0%) |
| 75 Years and over | 0 (0.0%) | 0 (0.0%) |
| Total | 0 (0.0%) | 2 (3.0%) |
Income Above Poverty by Sex and Age in Carpio
According to the poverty statistics in Carpio, males aged 5 years and females aged under 5 years are the age groups that are most secure financially, with 100.0% of males and 100.0% of females in these age groups living above the poverty line.
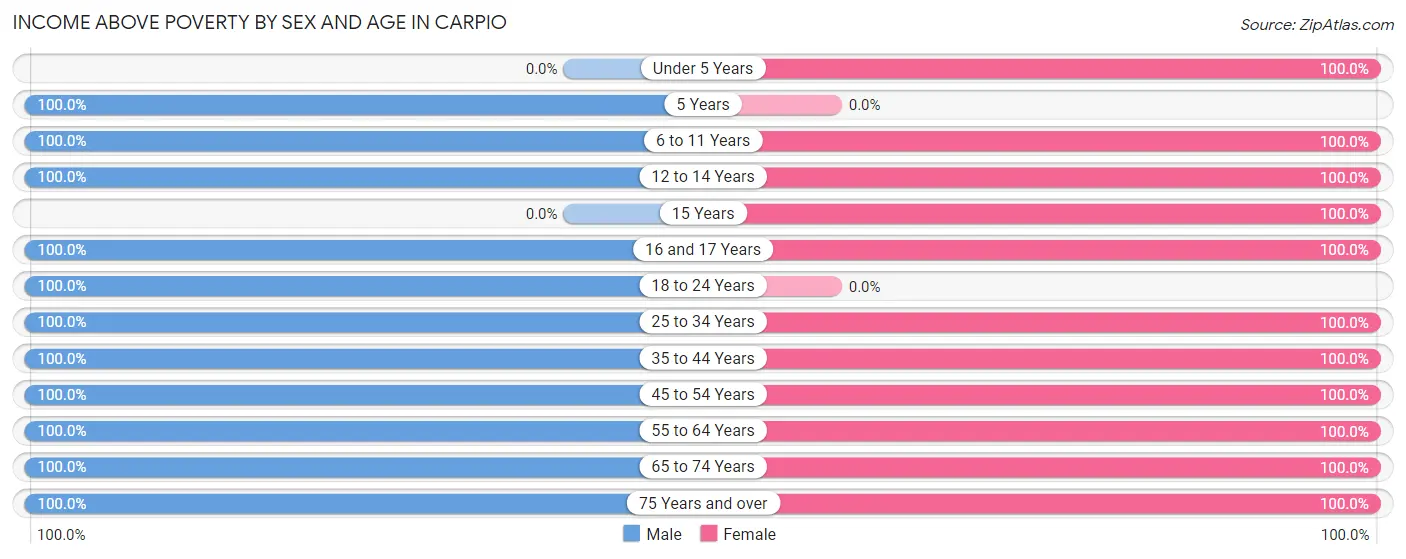
| Age Bracket | Male | Female |
| Under 5 Years | 0 (0.0%) | 2 (100.0%) |
| 5 Years | 2 (100.0%) | 0 (0.0%) |
| 6 to 11 Years | 7 (100.0%) | 7 (100.0%) |
| 12 to 14 Years | 14 (100.0%) | 3 (100.0%) |
| 15 Years | 0 (0.0%) | 3 (100.0%) |
| 16 and 17 Years | 3 (100.0%) | 3 (100.0%) |
| 18 to 24 Years | 10 (100.0%) | 0 (0.0%) |
| 25 to 34 Years | 2 (100.0%) | 3 (100.0%) |
| 35 to 44 Years | 4 (100.0%) | 8 (100.0%) |
| 45 to 54 Years | 22 (100.0%) | 19 (100.0%) |
| 55 to 64 Years | 10 (100.0%) | 5 (100.0%) |
| 65 to 74 Years | 5 (100.0%) | 8 (100.0%) |
| 75 Years and over | 1 (100.0%) | 3 (100.0%) |
| Total | 80 (100.0%) | 64 (97.0%) |
Income Below Poverty Among Married-Couple Families in Carpio
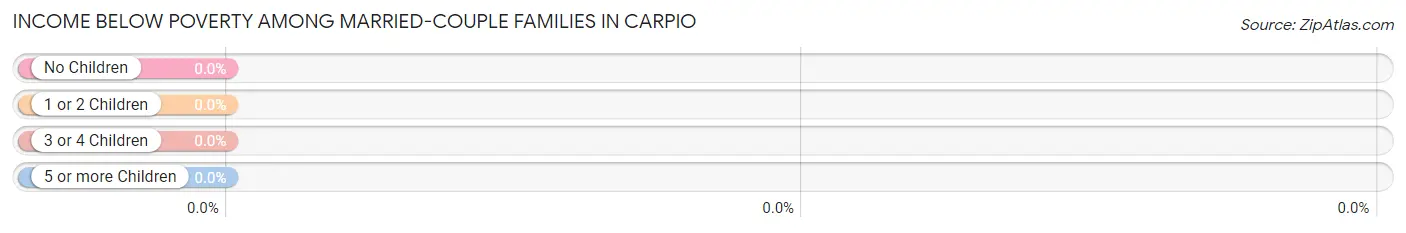
| Children | Above Poverty | Below Poverty |
| No Children | 20 (100.0%) | 0 (0.0%) |
| 1 or 2 Children | 7 (100.0%) | 0 (0.0%) |
| 3 or 4 Children | 6 (100.0%) | 0 (0.0%) |
| 5 or more Children | 0 (0.0%) | 0 (0.0%) |
| Total | 33 (100.0%) | 0 (0.0%) |
Income Below Poverty Among Single-Parent Households in Carpio
| Children | Single Father | Single Mother |
| No Children | 0 (0.0%) | 0 (0.0%) |
| 1 or 2 Children | 0 (0.0%) | 0 (0.0%) |
| 3 or 4 Children | 0 (0.0%) | 0 (0.0%) |
| 5 or more Children | 0 (0.0%) | 0 (0.0%) |
| Total | 0 (0.0%) | 0 (0.0%) |
Income Below Poverty Among Married-Couple vs Single-Parent Households in Carpio
| Children | Married-Couple Families | Single-Parent Households |
| No Children | 0 (0.0%) | 0 (0.0%) |
| 1 or 2 Children | 0 (0.0%) | 0 (0.0%) |
| 3 or 4 Children | 0 (0.0%) | 0 (0.0%) |
| 5 or more Children | 0 (0.0%) | 0 (0.0%) |
| Total | 0 (0.0%) | 0 (0.0%) |
Race in Carpio
The most populous races in Carpio are White / Caucasian (123 | 84.3%), Two or more Races (20 | 13.7%), and Asian (2 | 1.4%).
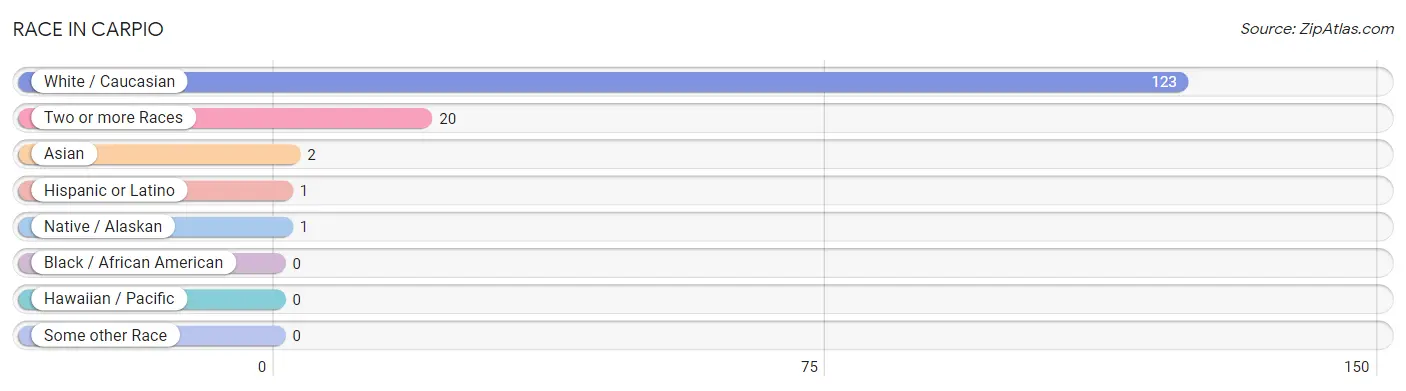
| Race | # Population | % Population |
| Asian | 2 | 1.4% |
| Black / African American | 0 | 0.0% |
| Hawaiian / Pacific | 0 | 0.0% |
| Hispanic or Latino | 1 | 0.7% |
| Native / Alaskan | 1 | 0.7% |
| White / Caucasian | 123 | 84.3% |
| Two or more Races | 20 | 13.7% |
| Some other Race | 0 | 0.0% |
| Total | 146 | 100.0% |
Ancestry in Carpio
The most populous ancestries reported in Carpio are Norwegian (102 | 69.9%), German (57 | 39.0%), Burmese (10 | 6.9%), Scottish (10 | 6.9%), and Ukrainian (9 | 6.2%), together accounting for 128.8% of all Carpio residents.
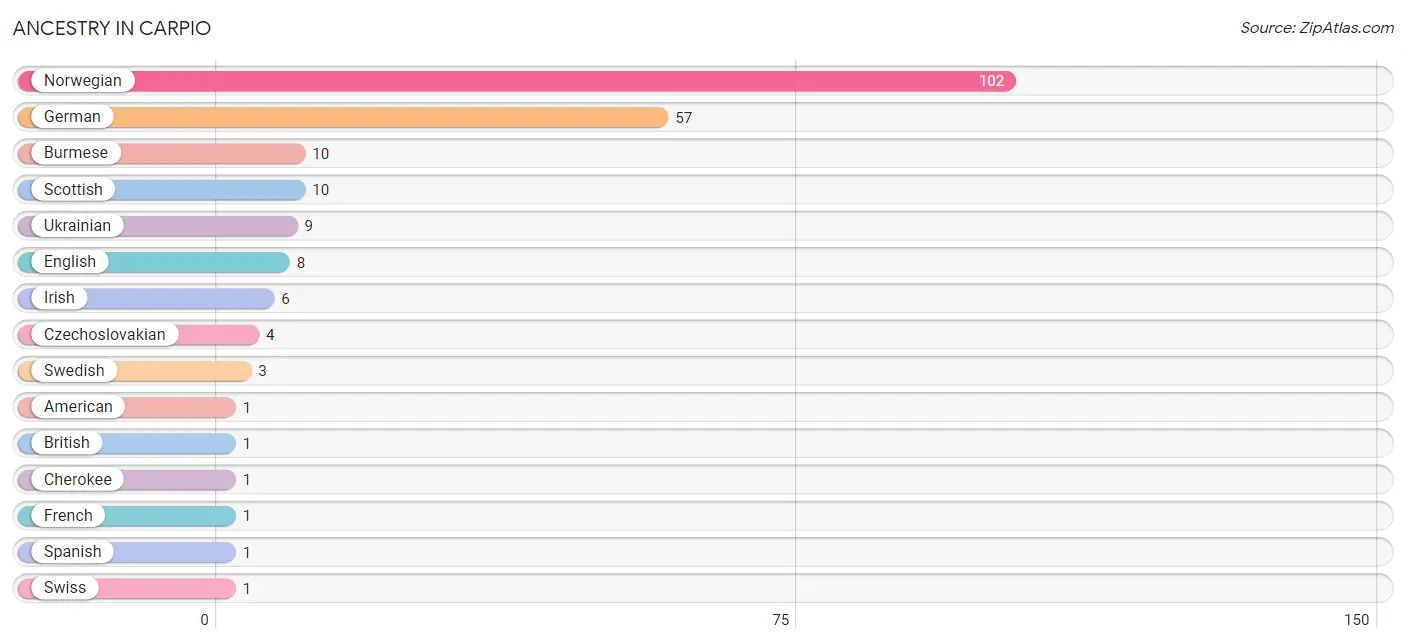
| Ancestry | # Population | % Population |
| American | 1 | 0.7% |
| British | 1 | 0.7% |
| Burmese | 10 | 6.9% |
| Cherokee | 1 | 0.7% |
| Czechoslovakian | 4 | 2.7% |
| English | 8 | 5.5% |
| French | 1 | 0.7% |
| German | 57 | 39.0% |
| Irish | 6 | 4.1% |
| Norwegian | 102 | 69.9% |
| Scottish | 10 | 6.9% |
| Spanish | 1 | 0.7% |
| Swedish | 3 | 2.1% |
| Swiss | 1 | 0.7% |
| Ukrainian | 9 | 6.2% | View All 15 Rows |
Immigrants in Carpio
The most numerous immigrant groups reported in Carpio came from Asia (2 | 1.4%), Eastern Asia (2 | 1.4%), and Korea (2 | 1.4%), together accounting for 4.1% of all Carpio residents.
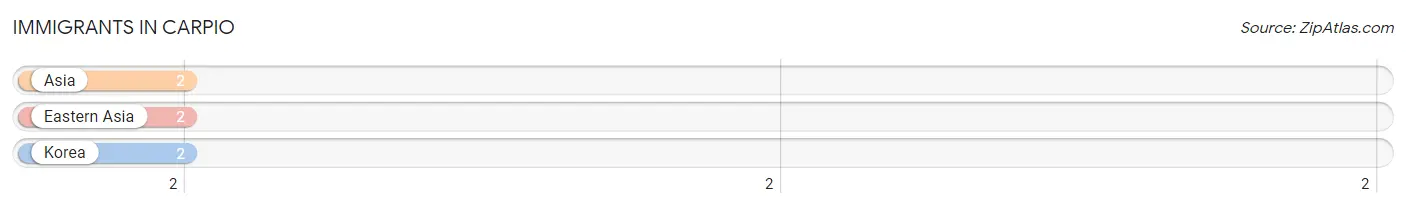
| Immigration Origin | # Population | % Population |
| Asia | 2 | 1.4% |
| Eastern Asia | 2 | 1.4% |
| Korea | 2 | 1.4% | View All 3 Rows |
Sex and Age in Carpio
Sex and Age in Carpio
The most populous age groups in Carpio are 50 to 54 Years (15 | 18.8%) for men and 50 to 54 Years (14 | 21.2%) for women.
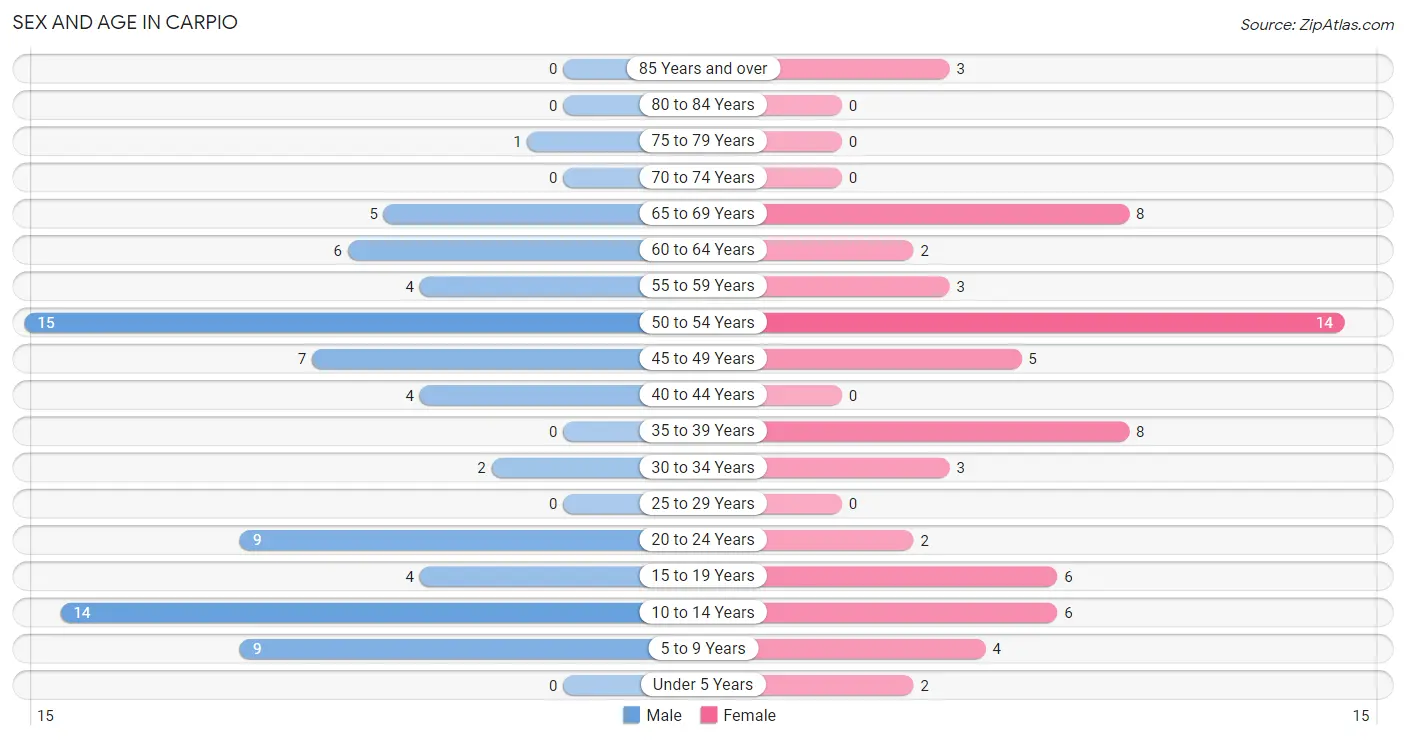
| Age Bracket | Male | Female |
| Under 5 Years | 0 (0.0%) | 2 (3.0%) |
| 5 to 9 Years | 9 (11.3%) | 4 (6.1%) |
| 10 to 14 Years | 14 (17.5%) | 6 (9.1%) |
| 15 to 19 Years | 4 (5.0%) | 6 (9.1%) |
| 20 to 24 Years | 9 (11.3%) | 2 (3.0%) |
| 25 to 29 Years | 0 (0.0%) | 0 (0.0%) |
| 30 to 34 Years | 2 (2.5%) | 3 (4.5%) |
| 35 to 39 Years | 0 (0.0%) | 8 (12.1%) |
| 40 to 44 Years | 4 (5.0%) | 0 (0.0%) |
| 45 to 49 Years | 7 (8.7%) | 5 (7.6%) |
| 50 to 54 Years | 15 (18.8%) | 14 (21.2%) |
| 55 to 59 Years | 4 (5.0%) | 3 (4.5%) |
| 60 to 64 Years | 6 (7.5%) | 2 (3.0%) |
| 65 to 69 Years | 5 (6.2%) | 8 (12.1%) |
| 70 to 74 Years | 0 (0.0%) | 0 (0.0%) |
| 75 to 79 Years | 1 (1.3%) | 0 (0.0%) |
| 80 to 84 Years | 0 (0.0%) | 0 (0.0%) |
| 85 Years and over | 0 (0.0%) | 3 (4.5%) |
| Total | 80 (100.0%) | 66 (100.0%) |
Families and Households in Carpio
Median Family Size in Carpio
The median family size in Carpio is 2.91 persons per family, with married-couple families (33 | 71.7%) accounting for the largest median family size of 3.15 persons per family. On the other hand, single female/mother families (6 | 13.0%) represent the smallest median family size with 2.00 persons per family.
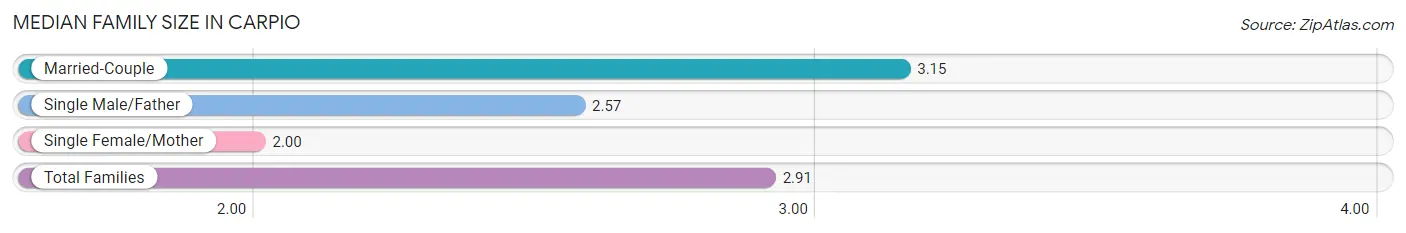
| Family Type | # Families | Family Size |
| Married-Couple | 33 (71.7%) | 3.15 |
| Single Male/Father | 7 (15.2%) | 2.57 |
| Single Female/Mother | 6 (13.0%) | 2.00 |
| Total Families | 46 (100.0%) | 2.91 |
Median Household Size in Carpio
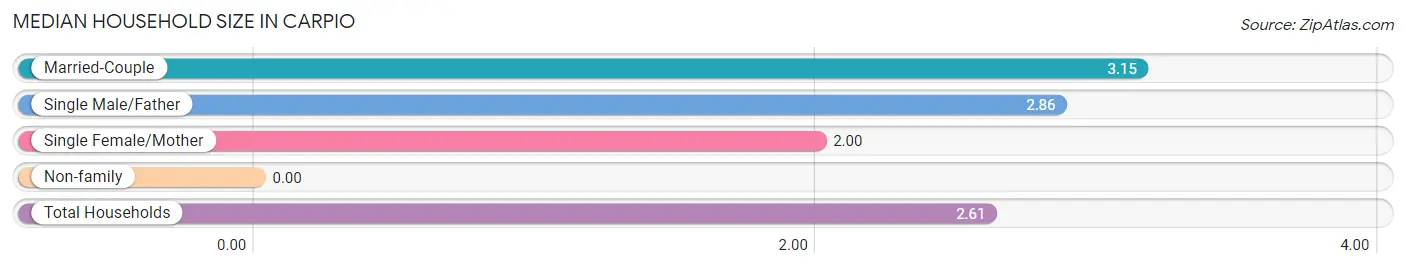
| Household Type | # Households | Household Size |
| Married-Couple | 33 (58.9%) | 3.15 |
| Single Male/Father | 7 (12.5%) | 2.86 |
| Single Female/Mother | 6 (10.7%) | 2.00 |
| Non-family | 10 (17.9%) | - |
| Total Households | 56 (100.0%) | 2.61 |
Household Size by Marriage Status in Carpio
Out of a total of 56 households in Carpio, 46 (82.1%) are family households, while 10 (17.9%) are nonfamily households. The most numerous type of family households are 2-person households, comprising 26, and the most common type of nonfamily households are 1-person households, comprising 10.
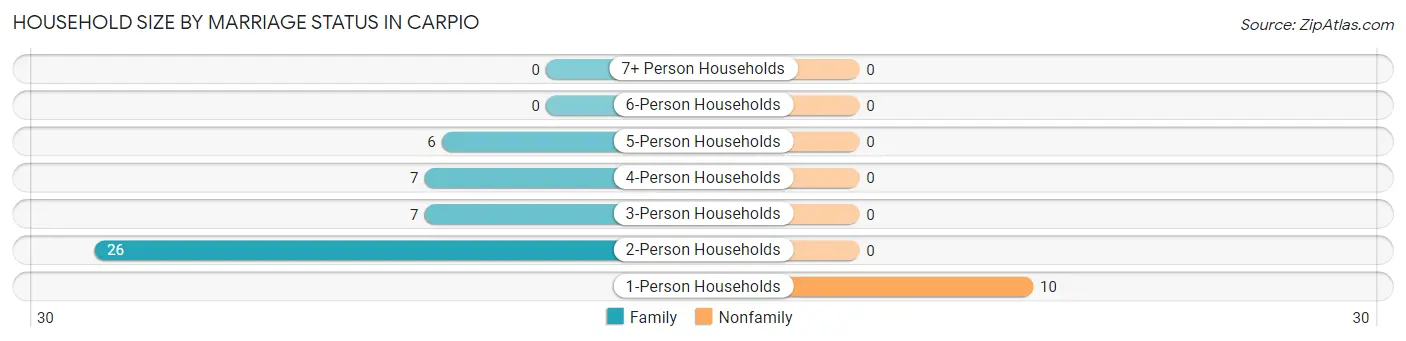
| Household Size | Family Households | Nonfamily Households |
| 1-Person Households | - | 10 (17.9%) |
| 2-Person Households | 26 (46.4%) | 0 (0.0%) |
| 3-Person Households | 7 (12.5%) | 0 (0.0%) |
| 4-Person Households | 7 (12.5%) | 0 (0.0%) |
| 5-Person Households | 6 (10.7%) | 0 (0.0%) |
| 6-Person Households | 0 (0.0%) | 0 (0.0%) |
| 7+ Person Households | 0 (0.0%) | 0 (0.0%) |
| Total | 46 (82.1%) | 10 (17.9%) |
Female Fertility in Carpio
Fertility by Age in Carpio
Average fertility rate in Carpio is 77.0 births per 1,000 women. Women in the age bracket of 20 to 34 years have the highest fertility rate with 400.0 births per 1,000 women. Women in the age bracket of 20 to 34 years acount for 100.0% of all women with births.
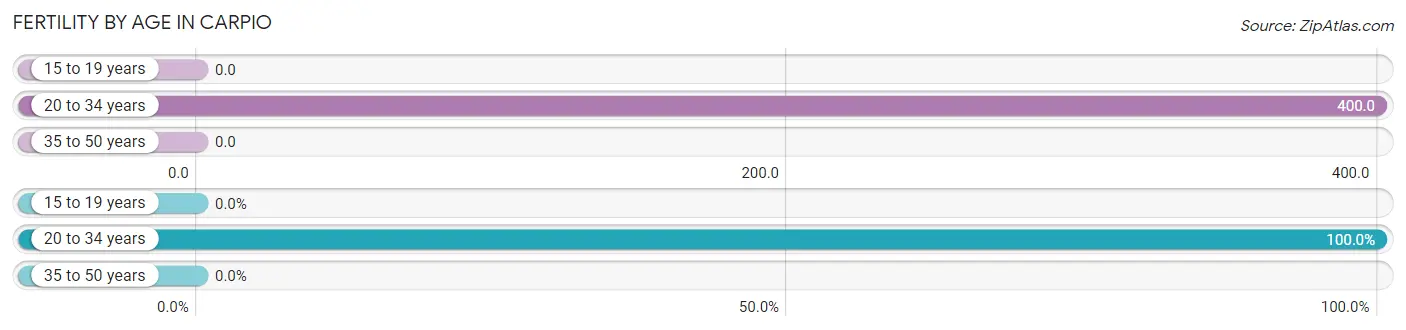
| Age Bracket | Women with Births | Births / 1,000 Women |
| 15 to 19 years | 0 (0.0%) | 0.0 |
| 20 to 34 years | 2 (100.0%) | 400.0 |
| 35 to 50 years | 0 (0.0%) | 0.0 |
| Total | 2 (100.0%) | 77.0 |
Fertility by Age by Marriage Status in Carpio
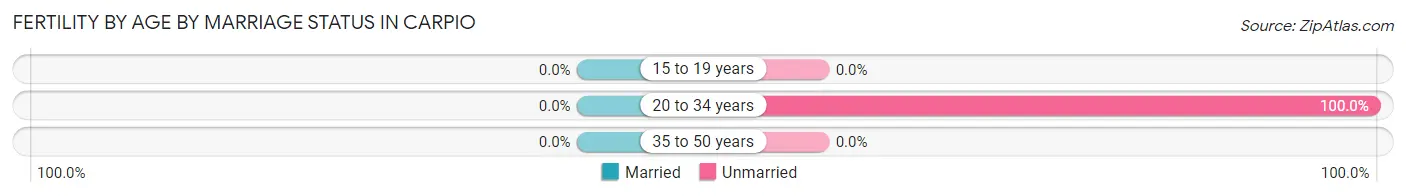
| Age Bracket | Married | Unmarried |
| 15 to 19 years | 0 (0.0%) | 0 (0.0%) |
| 20 to 34 years | 0 (0.0%) | 2 (100.0%) |
| 35 to 50 years | 0 (0.0%) | 0 (0.0%) |
| Total | 0 (0.0%) | 2 (100.0%) |
Fertility by Education in Carpio
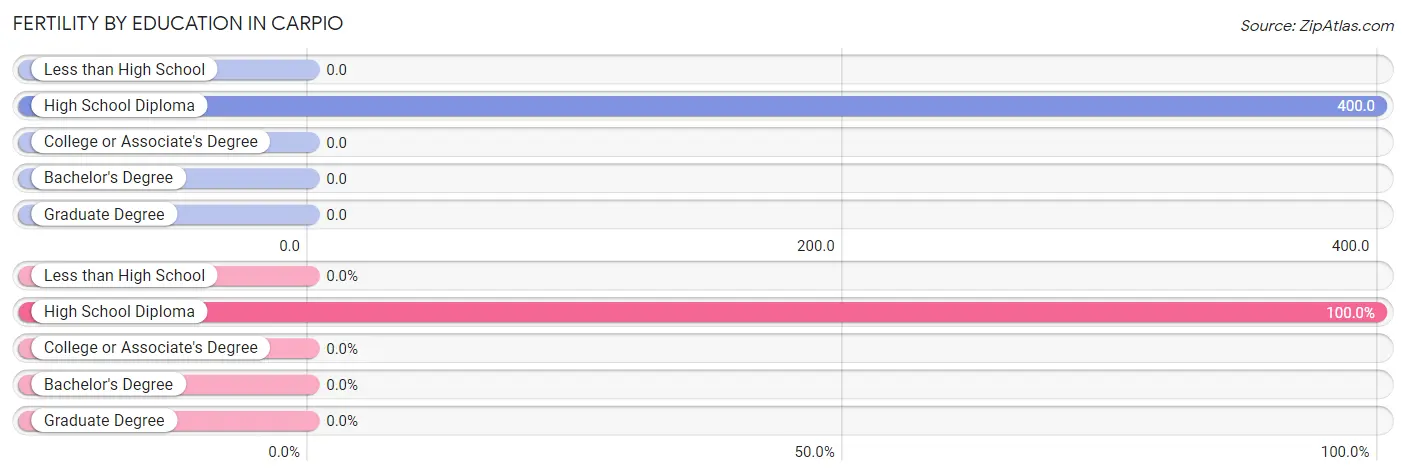
| Educational Attainment | Women with Births | Births / 1,000 Women |
| Less than High School | 0 (0.0%) | 0.0 |
| High School Diploma | 2 (100.0%) | 400.0 |
| College or Associate's Degree | 0 (0.0%) | 0.0 |
| Bachelor's Degree | 0 (0.0%) | 0.0 |
| Graduate Degree | 0 (0.0%) | 0.0 |
| Total | 2 (100.0%) | 77.0 |
Fertility by Education by Marriage Status in Carpio
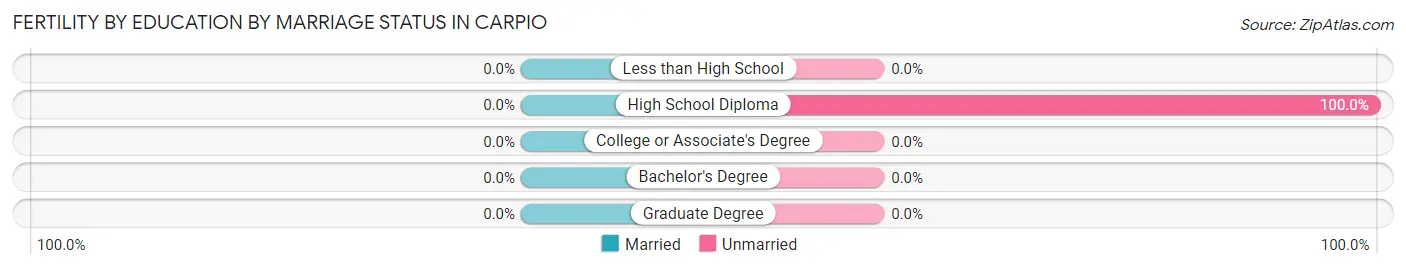
| Educational Attainment | Married | Unmarried |
| Less than High School | 0 (0.0%) | 0 (0.0%) |
| High School Diploma | 0 (0.0%) | 2 (100.0%) |
| College or Associate's Degree | 0 (0.0%) | 0 (0.0%) |
| Bachelor's Degree | 0 (0.0%) | 0 (0.0%) |
| Graduate Degree | 0 (0.0%) | 0 (0.0%) |
| Total | 0 (0.0%) | 2 (100.0%) |
Employment Characteristics in Carpio
Employment by Class of Employer in Carpio
Among the 74 employed individuals in Carpio, private company employees (45 | 60.8%), local government employees (16 | 21.6%), and self-employed (not incorporated) (8 | 10.8%) make up the most common classes of employment.
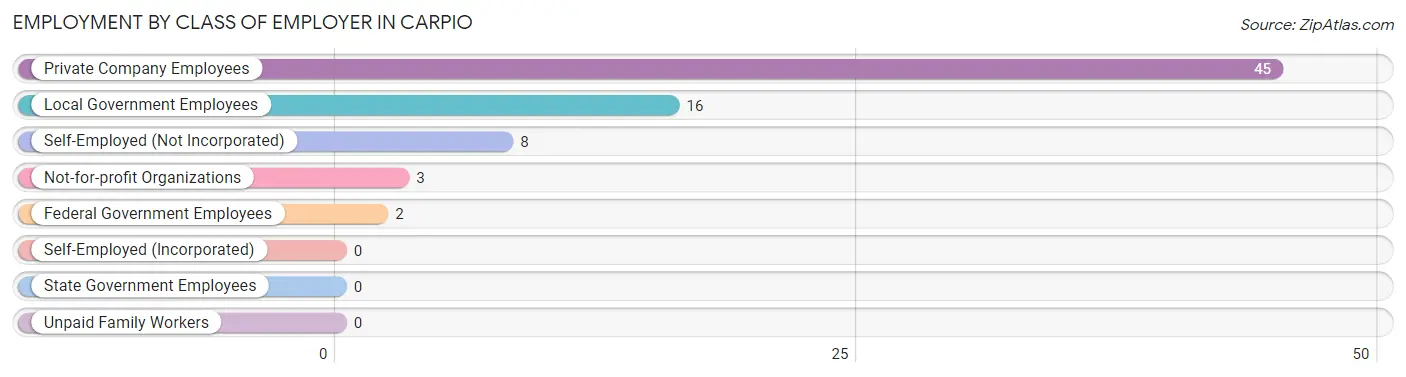
| Employer Class | # Employees | % Employees |
| Private Company Employees | 45 | 60.8% |
| Self-Employed (Incorporated) | 0 | 0.0% |
| Self-Employed (Not Incorporated) | 8 | 10.8% |
| Not-for-profit Organizations | 3 | 4.1% |
| Local Government Employees | 16 | 21.6% |
| State Government Employees | 0 | 0.0% |
| Federal Government Employees | 2 | 2.7% |
| Unpaid Family Workers | 0 | 0.0% |
| Total | 74 | 100.0% |
Employment Status by Age in Carpio
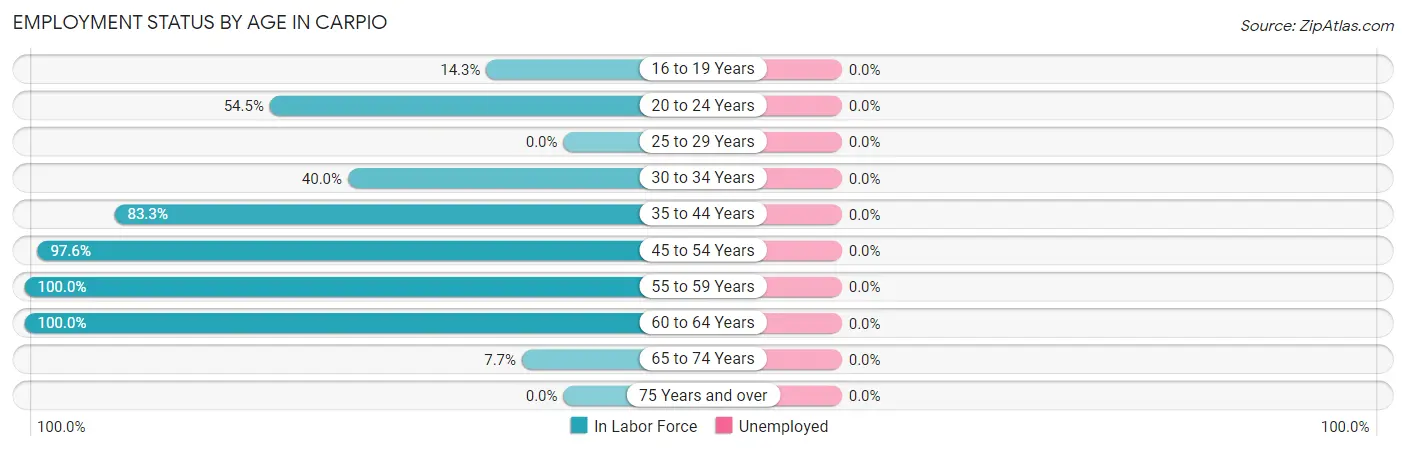
| Age Bracket | In Labor Force | Unemployed |
| 16 to 19 Years | 1 (14.3%) | 0 (0.0%) |
| 20 to 24 Years | 6 (54.5%) | 0 (0.0%) |
| 25 to 29 Years | 0 (0.0%) | 0 (0.0%) |
| 30 to 34 Years | 2 (40.0%) | 0 (0.0%) |
| 35 to 44 Years | 10 (83.3%) | 0 (0.0%) |
| 45 to 54 Years | 40 (97.6%) | 0 (0.0%) |
| 55 to 59 Years | 7 (100.0%) | 0 (0.0%) |
| 60 to 64 Years | 8 (100.0%) | 0 (0.0%) |
| 65 to 74 Years | 1 (7.7%) | 0 (0.0%) |
| 75 Years and over | 0 (0.0%) | 0 (0.0%) |
| Total | 75 (69.4%) | 0 (0.0%) |
Employment Status by Educational Attainment in Carpio
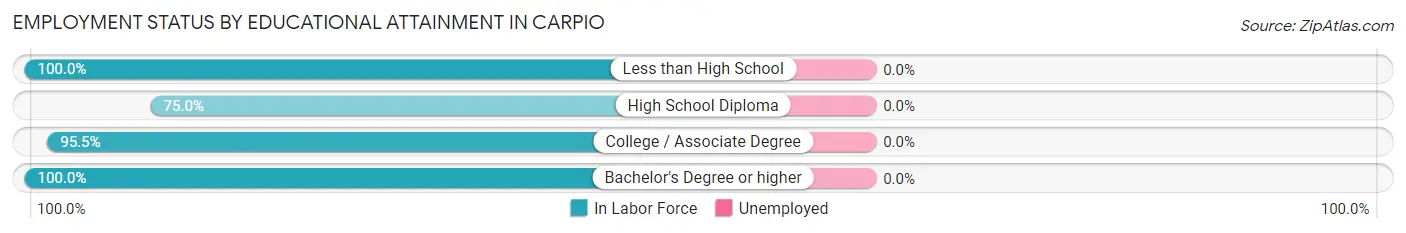
| Educational Attainment | In Labor Force | Unemployed |
| Less than High School | 1 (100.0%) | 0 (0.0%) |
| High School Diploma | 12 (75.0%) | 0 (0.0%) |
| College / Associate Degree | 42 (95.5%) | 0 (0.0%) |
| Bachelor's Degree or higher | 12 (100.0%) | 0 (0.0%) |
| Total | 67 (91.8%) | 0 (0.0%) |
Employment Occupations by Sex in Carpio
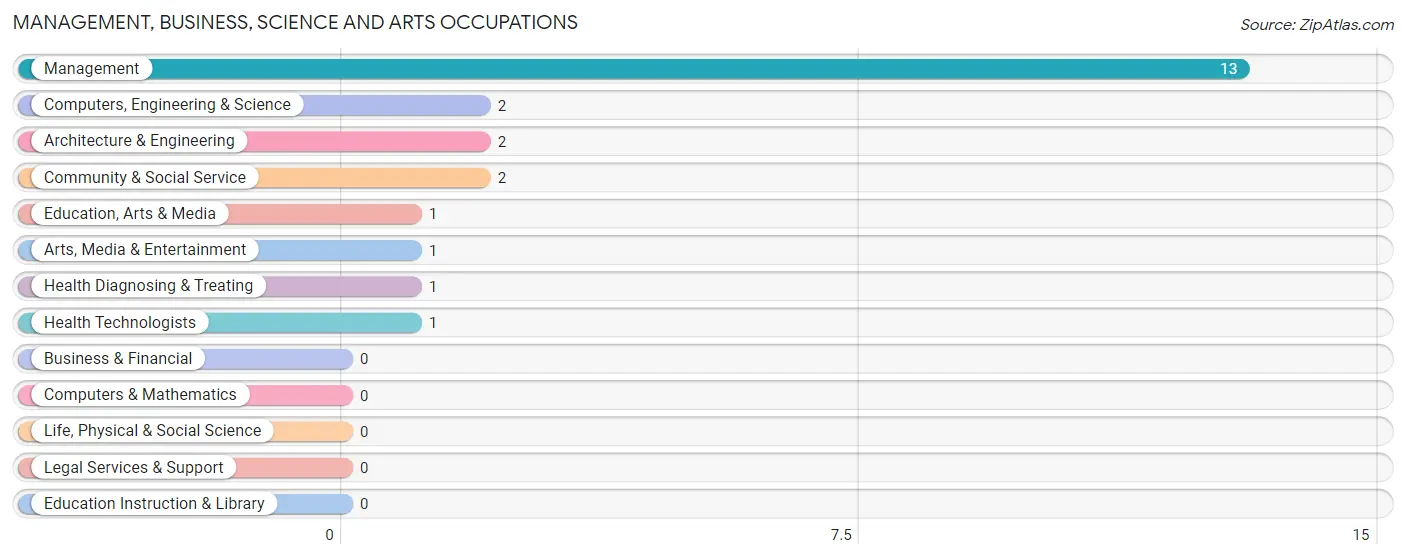
Management, Business, Science and Arts Occupations
The most common Management, Business, Science and Arts occupations in Carpio are Management (13 | 17.3%), Computers, Engineering & Science (2 | 2.7%), Architecture & Engineering (2 | 2.7%), Community & Social Service (2 | 2.7%), and Education, Arts & Media (1 | 1.3%).
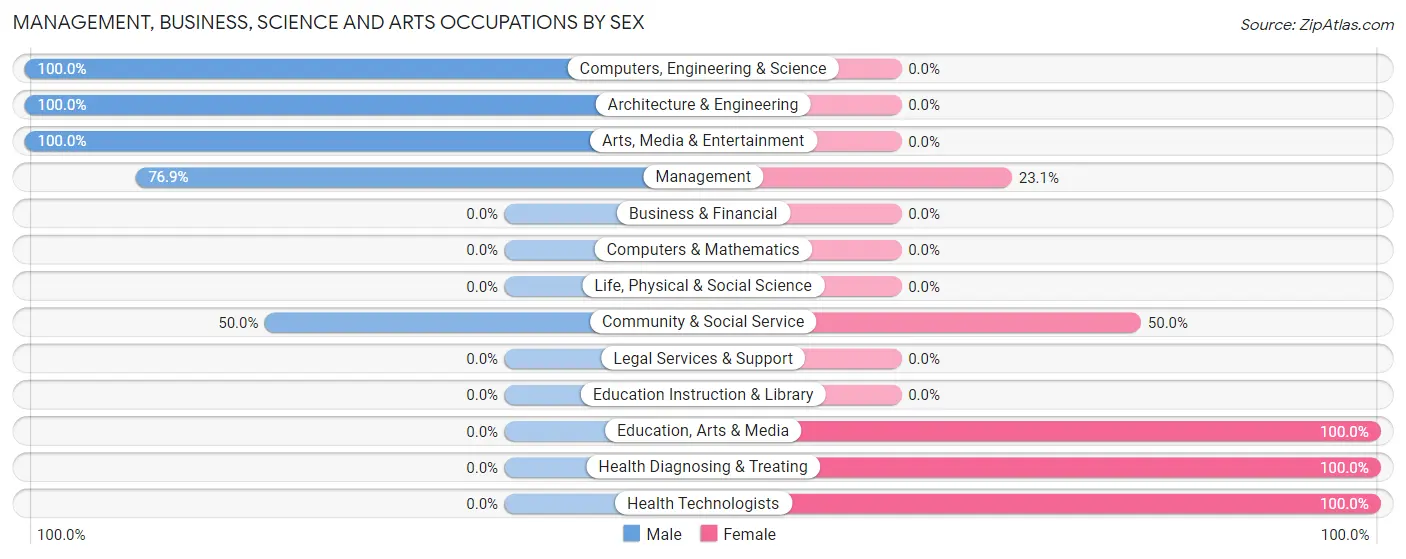
Management, Business, Science and Arts Occupations by Sex
Within the Management, Business, Science and Arts occupations in Carpio, the most male-oriented occupations are Computers, Engineering & Science (100.0%), Architecture & Engineering (100.0%), and Arts, Media & Entertainment (100.0%), while the most female-oriented occupations are Education, Arts & Media (100.0%), Health Diagnosing & Treating (100.0%), and Health Technologists (100.0%).
| Occupation | Male | Female |
| Management | 10 (76.9%) | 3 (23.1%) |
| Business & Financial | 0 (0.0%) | 0 (0.0%) |
| Computers, Engineering & Science | 2 (100.0%) | 0 (0.0%) |
| Computers & Mathematics | 0 (0.0%) | 0 (0.0%) |
| Architecture & Engineering | 2 (100.0%) | 0 (0.0%) |
| Life, Physical & Social Science | 0 (0.0%) | 0 (0.0%) |
| Community & Social Service | 1 (50.0%) | 1 (50.0%) |
| Education, Arts & Media | 0 (0.0%) | 1 (100.0%) |
| Legal Services & Support | 0 (0.0%) | 0 (0.0%) |
| Education Instruction & Library | 0 (0.0%) | 0 (0.0%) |
| Arts, Media & Entertainment | 1 (100.0%) | 0 (0.0%) |
| Health Diagnosing & Treating | 0 (0.0%) | 1 (100.0%) |
| Health Technologists | 0 (0.0%) | 1 (100.0%) |
| Total (Category) | 13 (72.2%) | 5 (27.8%) |
| Total (Overall) | 45 (60.0%) | 30 (40.0%) |
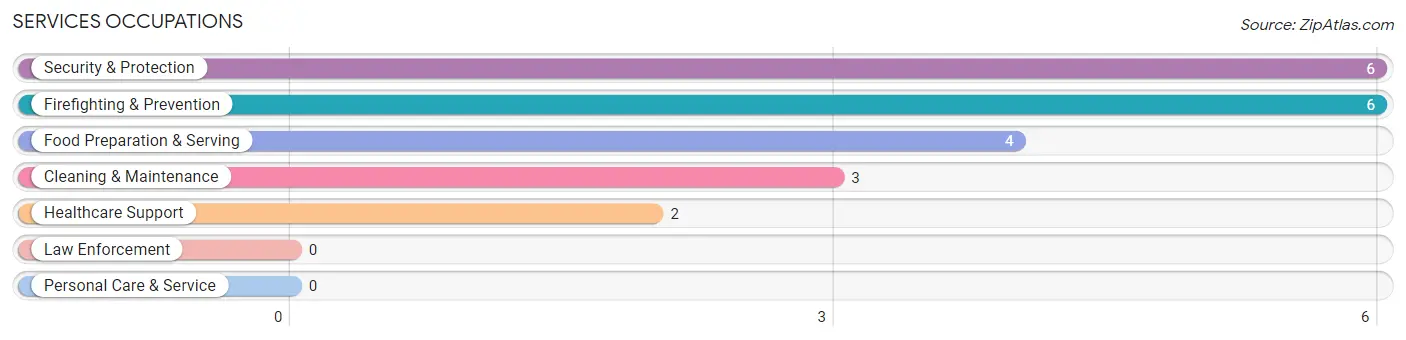
Services Occupations
The most common Services occupations in Carpio are Security & Protection (6 | 8.0%), Firefighting & Prevention (6 | 8.0%), Food Preparation & Serving (4 | 5.3%), Cleaning & Maintenance (3 | 4.0%), and Healthcare Support (2 | 2.7%).
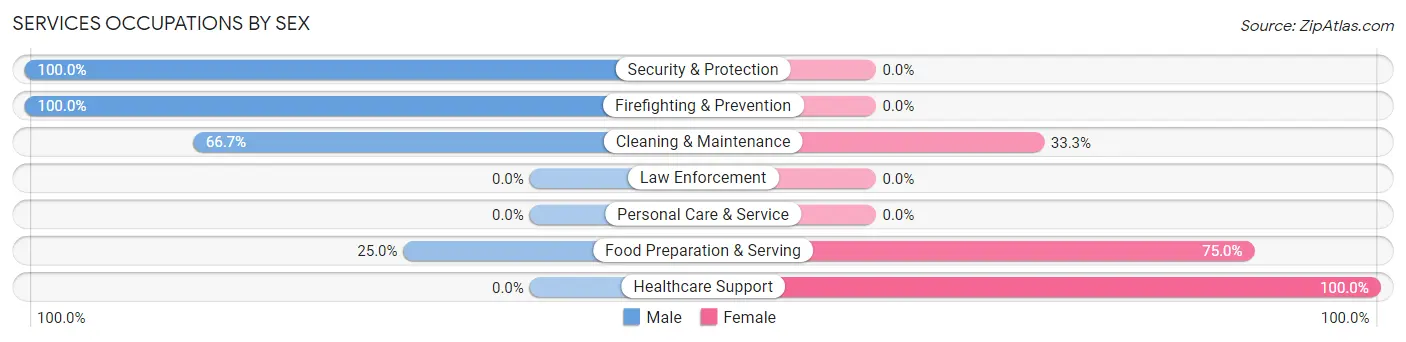
Services Occupations by Sex
Within the Services occupations in Carpio, the most male-oriented occupations are Security & Protection (100.0%), Firefighting & Prevention (100.0%), and Cleaning & Maintenance (66.7%), while the most female-oriented occupations are Healthcare Support (100.0%), Food Preparation & Serving (75.0%), and Cleaning & Maintenance (33.3%).
| Occupation | Male | Female |
| Healthcare Support | 0 (0.0%) | 2 (100.0%) |
| Security & Protection | 6 (100.0%) | 0 (0.0%) |
| Firefighting & Prevention | 6 (100.0%) | 0 (0.0%) |
| Law Enforcement | 0 (0.0%) | 0 (0.0%) |
| Food Preparation & Serving | 1 (25.0%) | 3 (75.0%) |
| Cleaning & Maintenance | 2 (66.7%) | 1 (33.3%) |
| Personal Care & Service | 0 (0.0%) | 0 (0.0%) |
| Total (Category) | 9 (60.0%) | 6 (40.0%) |
| Total (Overall) | 45 (60.0%) | 30 (40.0%) |
Sales and Office Occupations
The most common Sales and Office occupations in Carpio are Sales & Related (9 | 12.0%), and Office & Administration (9 | 12.0%).

Sales and Office Occupations by Sex

| Occupation | Male | Female |
| Sales & Related | 2 (22.2%) | 7 (77.8%) |
| Office & Administration | 0 (0.0%) | 9 (100.0%) |
| Total (Category) | 2 (11.1%) | 16 (88.9%) |
| Total (Overall) | 45 (60.0%) | 30 (40.0%) |
Natural Resources, Construction and Maintenance Occupations
The most common Natural Resources, Construction and Maintenance occupations in Carpio are Construction & Extraction (8 | 10.7%), and Farming, Fishing & Forestry (2 | 2.7%).
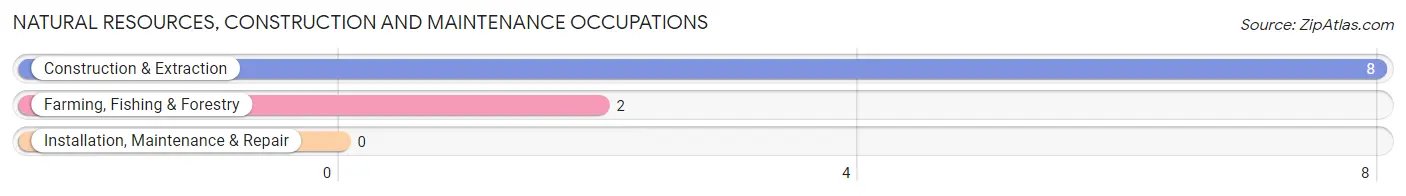
Natural Resources, Construction and Maintenance Occupations by Sex
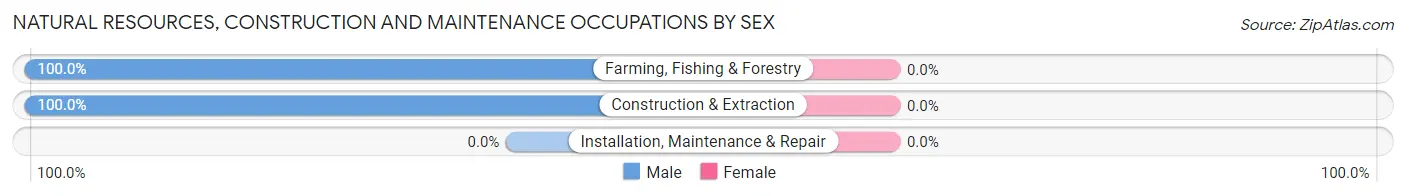
| Occupation | Male | Female |
| Farming, Fishing & Forestry | 2 (100.0%) | 0 (0.0%) |
| Construction & Extraction | 8 (100.0%) | 0 (0.0%) |
| Installation, Maintenance & Repair | 0 (0.0%) | 0 (0.0%) |
| Total (Category) | 10 (100.0%) | 0 (0.0%) |
| Total (Overall) | 45 (60.0%) | 30 (40.0%) |
Production, Transportation and Moving Occupations
The most common Production, Transportation and Moving occupations in Carpio are Production (7 | 9.3%), Transportation (6 | 8.0%), and Material Moving (1 | 1.3%).
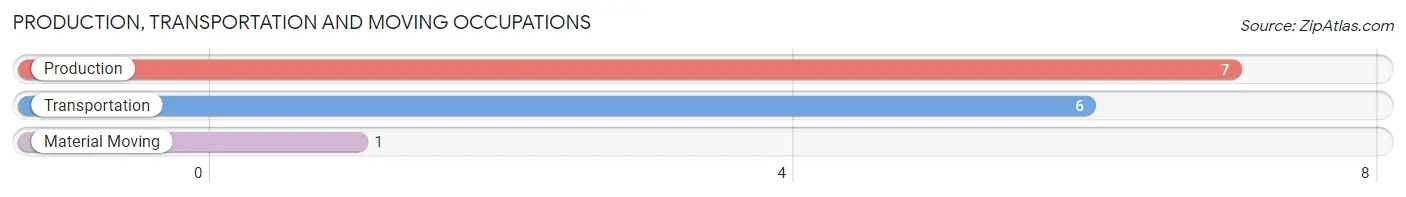
Production, Transportation and Moving Occupations by Sex
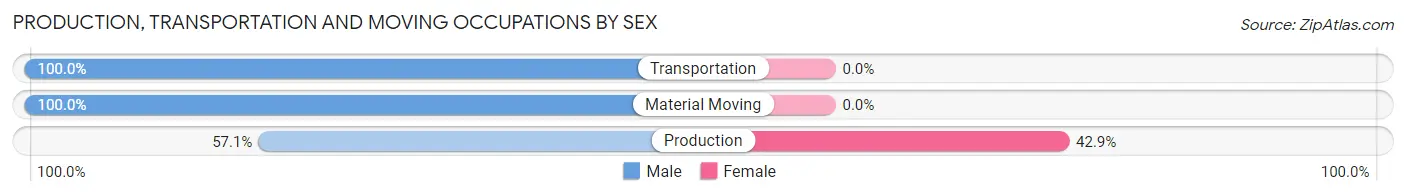
| Occupation | Male | Female |
| Production | 4 (57.1%) | 3 (42.9%) |
| Transportation | 6 (100.0%) | 0 (0.0%) |
| Material Moving | 1 (100.0%) | 0 (0.0%) |
| Total (Category) | 11 (78.6%) | 3 (21.4%) |
| Total (Overall) | 45 (60.0%) | 30 (40.0%) |
Employment Industries by Sex in Carpio
Employment Industries in Carpio
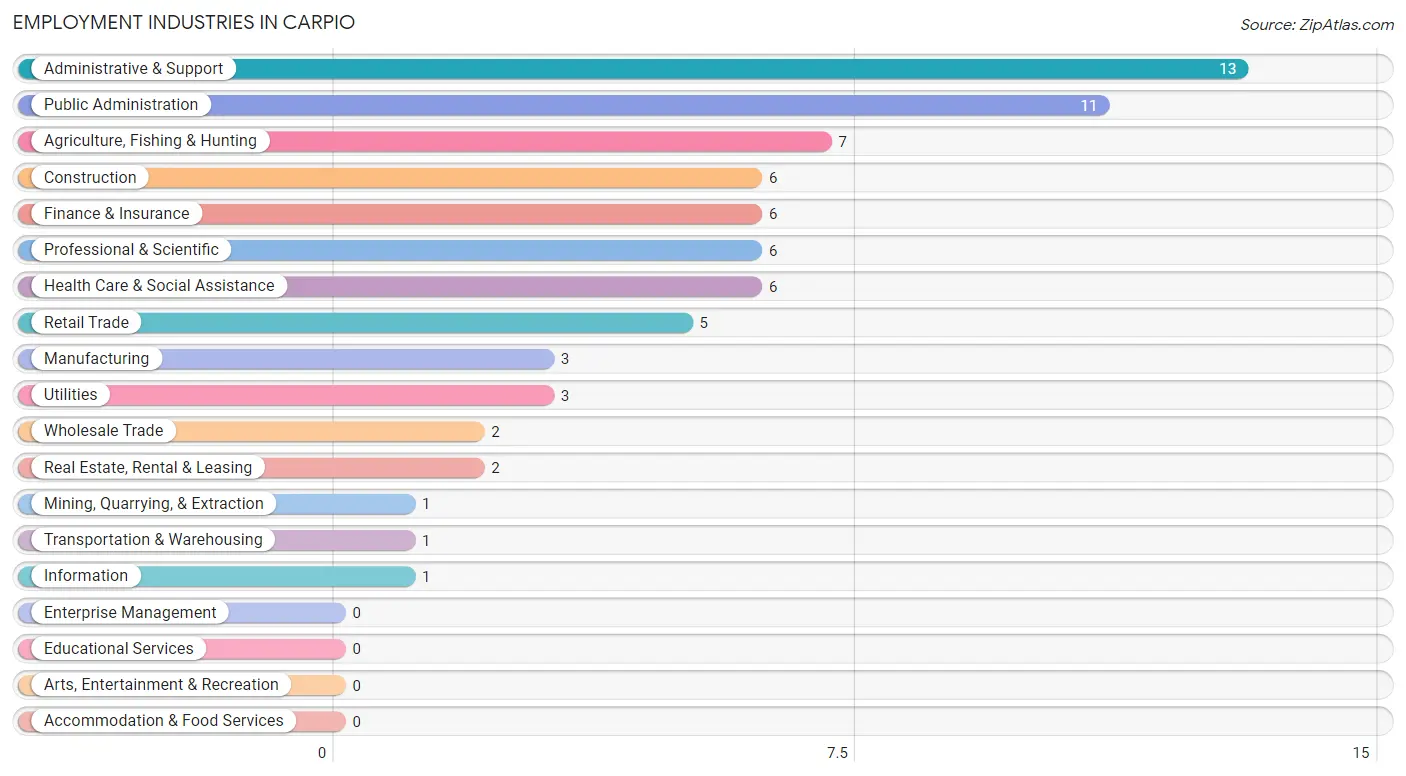
The major employment industries in Carpio include Administrative & Support (13 | 17.3%), Public Administration (11 | 14.7%), Agriculture, Fishing & Hunting (7 | 9.3%), Construction (6 | 8.0%), and Finance & Insurance (6 | 8.0%).
Employment Industries by Sex in Carpio
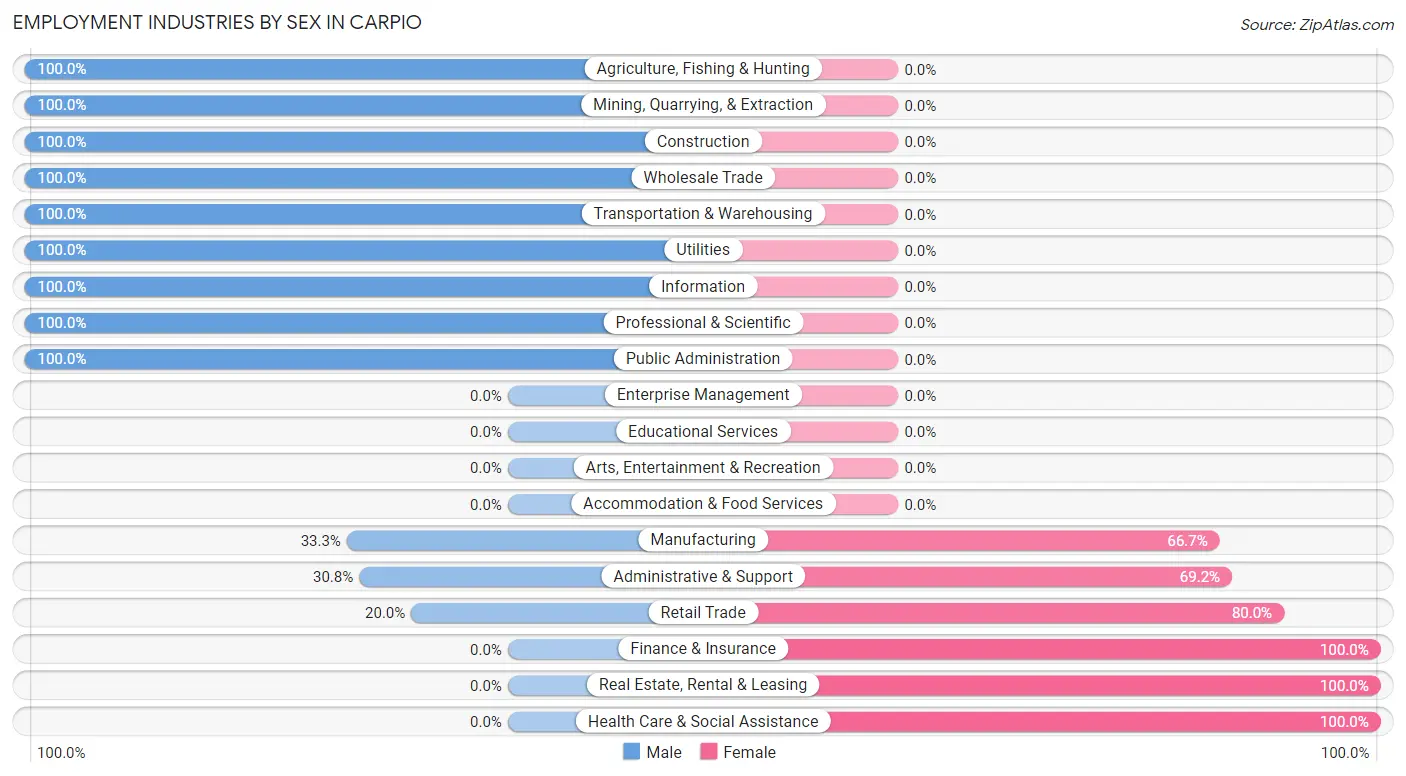
The Carpio industries that see more men than women are Agriculture, Fishing & Hunting (100.0%), Mining, Quarrying, & Extraction (100.0%), and Construction (100.0%), whereas the industries that tend to have a higher number of women are Finance & Insurance (100.0%), Real Estate, Rental & Leasing (100.0%), and Health Care & Social Assistance (100.0%).
| Industry | Male | Female |
| Agriculture, Fishing & Hunting | 7 (100.0%) | 0 (0.0%) |
| Mining, Quarrying, & Extraction | 1 (100.0%) | 0 (0.0%) |
| Construction | 6 (100.0%) | 0 (0.0%) |
| Manufacturing | 1 (33.3%) | 2 (66.7%) |
| Wholesale Trade | 2 (100.0%) | 0 (0.0%) |
| Retail Trade | 1 (20.0%) | 4 (80.0%) |
| Transportation & Warehousing | 1 (100.0%) | 0 (0.0%) |
| Utilities | 3 (100.0%) | 0 (0.0%) |
| Information | 1 (100.0%) | 0 (0.0%) |
| Finance & Insurance | 0 (0.0%) | 6 (100.0%) |
| Real Estate, Rental & Leasing | 0 (0.0%) | 2 (100.0%) |
| Professional & Scientific | 6 (100.0%) | 0 (0.0%) |
| Enterprise Management | 0 (0.0%) | 0 (0.0%) |
| Administrative & Support | 4 (30.8%) | 9 (69.2%) |
| Educational Services | 0 (0.0%) | 0 (0.0%) |
| Health Care & Social Assistance | 0 (0.0%) | 6 (100.0%) |
| Arts, Entertainment & Recreation | 0 (0.0%) | 0 (0.0%) |
| Accommodation & Food Services | 0 (0.0%) | 0 (0.0%) |
| Public Administration | 11 (100.0%) | 0 (0.0%) |
| Total | 45 (60.0%) | 30 (40.0%) |
Education in Carpio
School Enrollment in Carpio
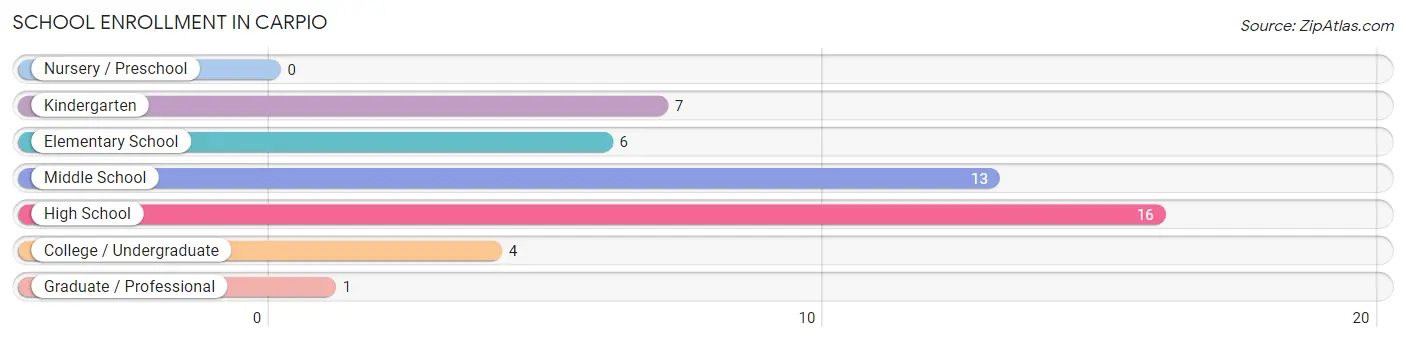
The most common levels of schooling among the 47 students in Carpio are high school (16 | 34.0%), middle school (13 | 27.7%), and kindergarten (7 | 14.9%).
| School Level | # Students | % Students |
| Nursery / Preschool | 0 | 0.0% |
| Kindergarten | 7 | 14.9% |
| Elementary School | 6 | 12.8% |
| Middle School | 13 | 27.7% |
| High School | 16 | 34.0% |
| College / Undergraduate | 4 | 8.5% |
| Graduate / Professional | 1 | 2.1% |
| Total | 47 | 100.0% |
School Enrollment by Age by Funding Source in Carpio
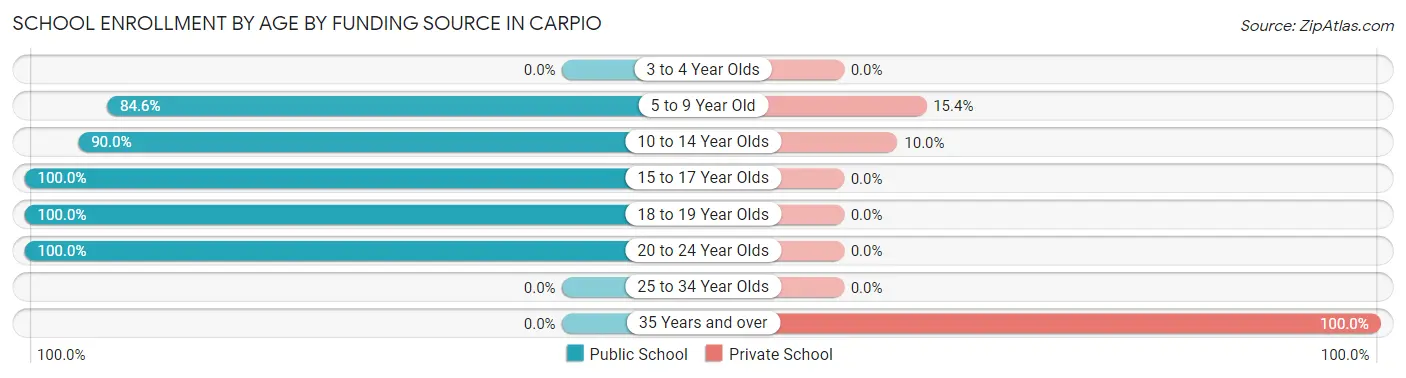
Out of a total of 47 students who are enrolled in schools in Carpio, 5 (10.6%) attend a private institution, while the remaining 42 (89.4%) are enrolled in public schools. The age group of 35 years and over has the highest likelihood of being enrolled in private schools, with 1 (100.0% in the age bracket) enrolled. Conversely, the age group of 15 to 17 year olds has the lowest likelihood of being enrolled in a private school, with 9 (100.0% in the age bracket) attending a public institution.
| Age Bracket | Public School | Private School |
| 3 to 4 Year Olds | 0 (0.0%) | 0 (0.0%) |
| 5 to 9 Year Old | 11 (84.6%) | 2 (15.4%) |
| 10 to 14 Year Olds | 18 (90.0%) | 2 (10.0%) |
| 15 to 17 Year Olds | 9 (100.0%) | 0 (0.0%) |
| 18 to 19 Year Olds | 1 (100.0%) | 0 (0.0%) |
| 20 to 24 Year Olds | 3 (100.0%) | 0 (0.0%) |
| 25 to 34 Year Olds | 0 (0.0%) | 0 (0.0%) |
| 35 Years and over | 0 (0.0%) | 1 (100.0%) |
| Total | 42 (89.4%) | 5 (10.6%) |
Educational Attainment by Field of Study in Carpio
Business (7 | 58.3%), arts & humanities (3 | 25.0%), science & technology (1 | 8.3%), and communications (1 | 8.3%) are the most common fields of study among 12 individuals in Carpio who have obtained a bachelor's degree or higher.
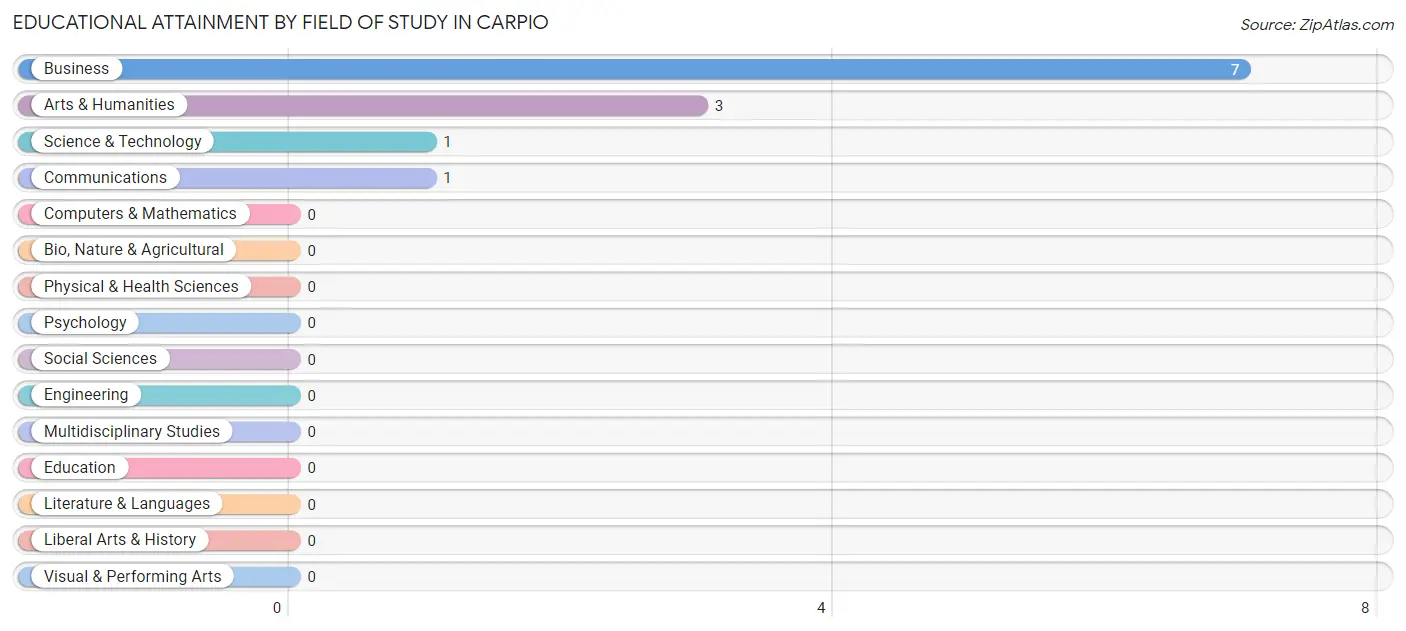
| Field of Study | # Graduates | % Graduates |
| Computers & Mathematics | 0 | 0.0% |
| Bio, Nature & Agricultural | 0 | 0.0% |
| Physical & Health Sciences | 0 | 0.0% |
| Psychology | 0 | 0.0% |
| Social Sciences | 0 | 0.0% |
| Engineering | 0 | 0.0% |
| Multidisciplinary Studies | 0 | 0.0% |
| Science & Technology | 1 | 8.3% |
| Business | 7 | 58.3% |
| Education | 0 | 0.0% |
| Literature & Languages | 0 | 0.0% |
| Liberal Arts & History | 0 | 0.0% |
| Visual & Performing Arts | 0 | 0.0% |
| Communications | 1 | 8.3% |
| Arts & Humanities | 3 | 25.0% |
| Total | 12 | 100.0% |
Transportation & Commute in Carpio
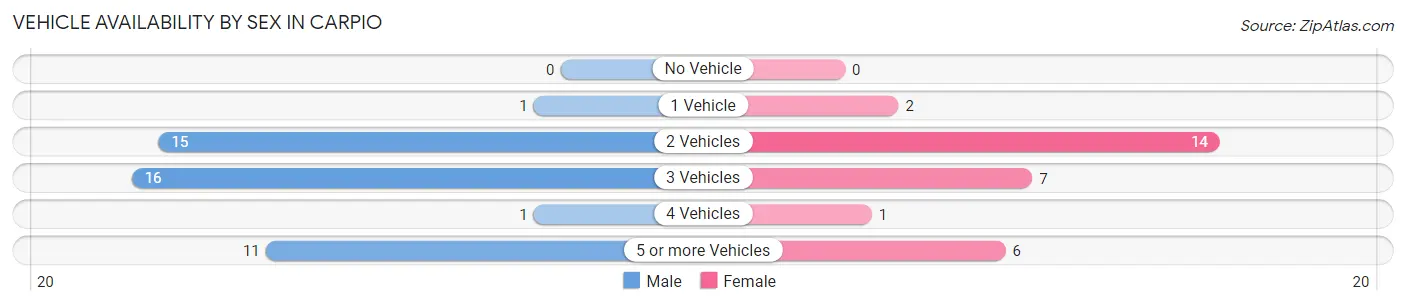
Vehicle Availability by Sex in Carpio
The most prevalent vehicle ownership categories in Carpio are males with 3 vehicles (16, accounting for 36.4%) and females with 3 vehicles (7, making up 53.3%).
| Vehicles Available | Male | Female |
| No Vehicle | 0 (0.0%) | 0 (0.0%) |
| 1 Vehicle | 1 (2.3%) | 2 (6.7%) |
| 2 Vehicles | 15 (34.1%) | 14 (46.7%) |
| 3 Vehicles | 16 (36.4%) | 7 (23.3%) |
| 4 Vehicles | 1 (2.3%) | 1 (3.3%) |
| 5 or more Vehicles | 11 (25.0%) | 6 (20.0%) |
| Total | 44 (100.0%) | 30 (100.0%) |
Commute Time in Carpio
The most frequently occuring commute durations in Carpio are 35 to 39 minutes (20 commuters, 29.0%), 90 or more minutes (15 commuters, 21.7%), and 30 to 34 minutes (11 commuters, 15.9%).
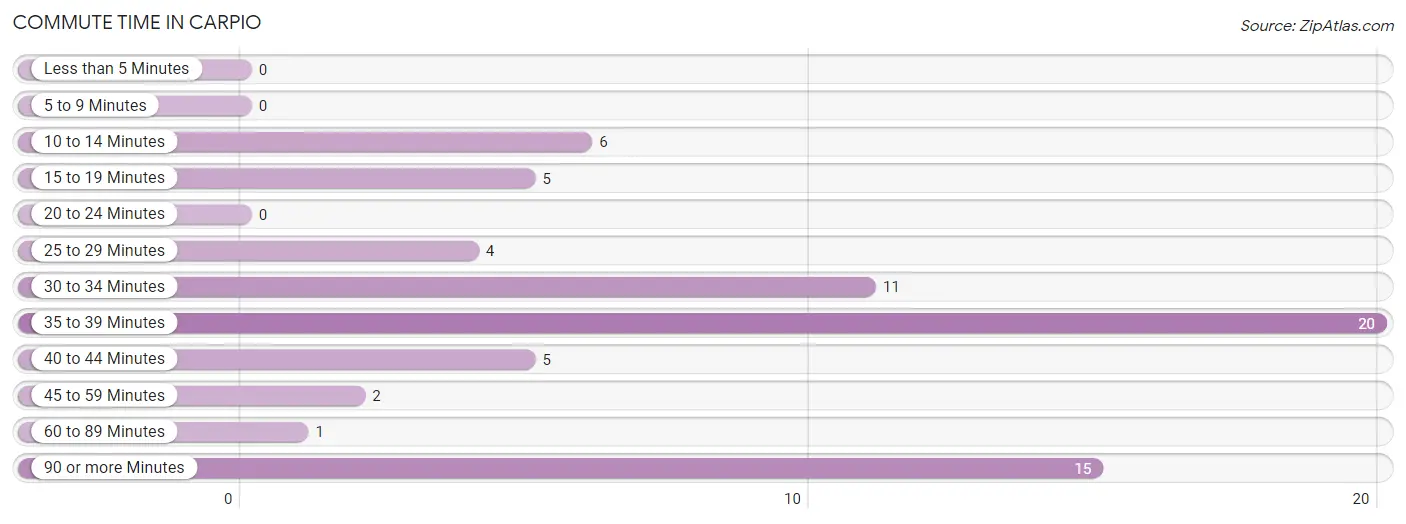
| Commute Time | # Commuters | % Commuters |
| Less than 5 Minutes | 0 | 0.0% |
| 5 to 9 Minutes | 0 | 0.0% |
| 10 to 14 Minutes | 6 | 8.7% |
| 15 to 19 Minutes | 5 | 7.2% |
| 20 to 24 Minutes | 0 | 0.0% |
| 25 to 29 Minutes | 4 | 5.8% |
| 30 to 34 Minutes | 11 | 15.9% |
| 35 to 39 Minutes | 20 | 29.0% |
| 40 to 44 Minutes | 5 | 7.2% |
| 45 to 59 Minutes | 2 | 2.9% |
| 60 to 89 Minutes | 1 | 1.5% |
| 90 or more Minutes | 15 | 21.7% |
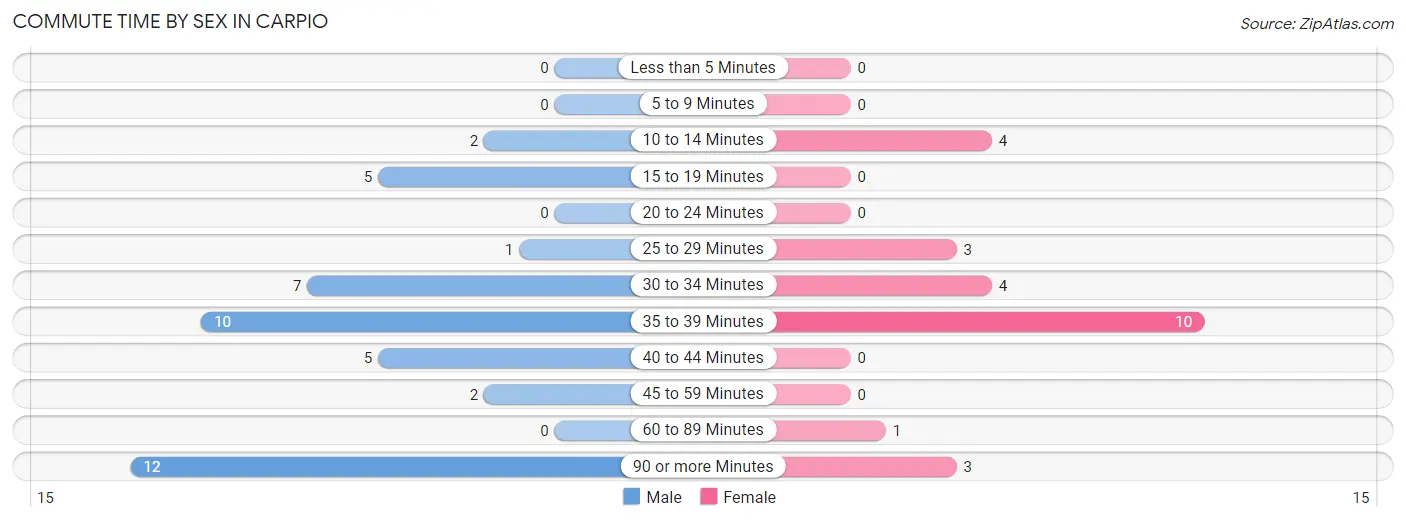
Commute Time by Sex in Carpio
The most common commute times in Carpio are 90 or more minutes (12 commuters, 27.3%) for males and 35 to 39 minutes (10 commuters, 40.0%) for females.
| Commute Time | Male | Female |
| Less than 5 Minutes | 0 (0.0%) | 0 (0.0%) |
| 5 to 9 Minutes | 0 (0.0%) | 0 (0.0%) |
| 10 to 14 Minutes | 2 (4.5%) | 4 (16.0%) |
| 15 to 19 Minutes | 5 (11.4%) | 0 (0.0%) |
| 20 to 24 Minutes | 0 (0.0%) | 0 (0.0%) |
| 25 to 29 Minutes | 1 (2.3%) | 3 (12.0%) |
| 30 to 34 Minutes | 7 (15.9%) | 4 (16.0%) |
| 35 to 39 Minutes | 10 (22.7%) | 10 (40.0%) |
| 40 to 44 Minutes | 5 (11.4%) | 0 (0.0%) |
| 45 to 59 Minutes | 2 (4.5%) | 0 (0.0%) |
| 60 to 89 Minutes | 0 (0.0%) | 1 (4.0%) |
| 90 or more Minutes | 12 (27.3%) | 3 (12.0%) |
Time of Departure to Work by Sex in Carpio
The most frequent times of departure to work in Carpio are 6:00 AM to 6:29 AM (13, 29.5%) for males and 7:30 AM to 7:59 AM (9, 36.0%) for females.
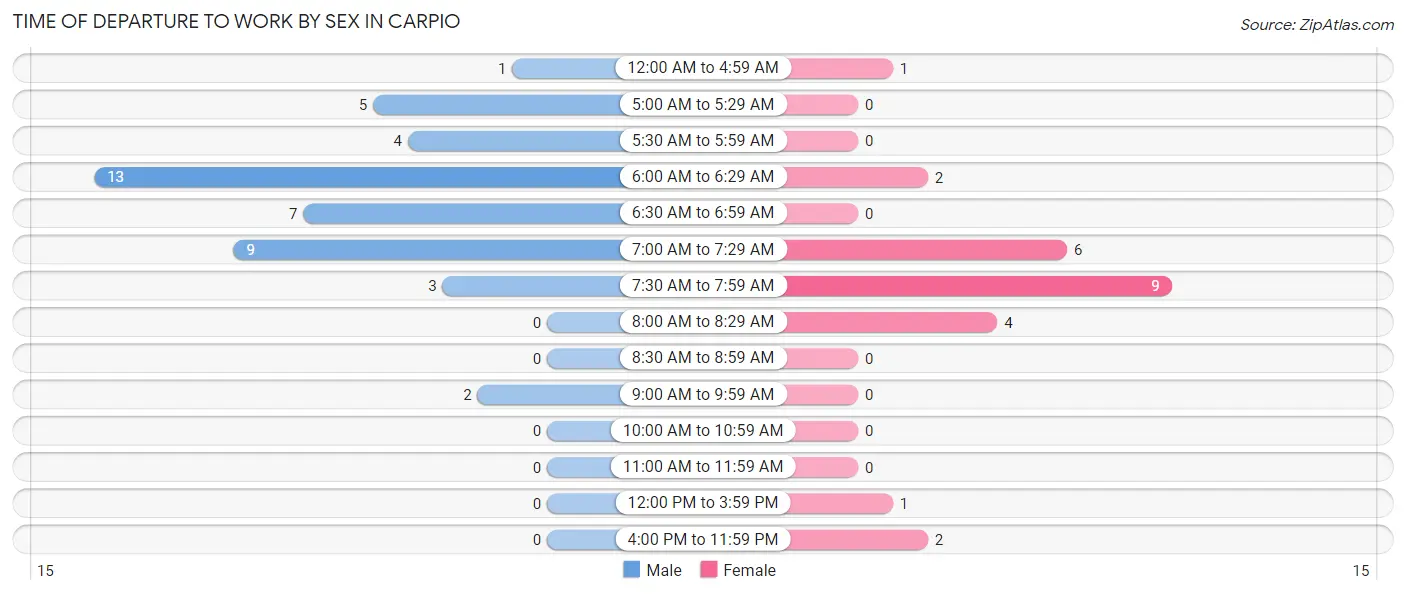
| Time of Departure | Male | Female |
| 12:00 AM to 4:59 AM | 1 (2.3%) | 1 (4.0%) |
| 5:00 AM to 5:29 AM | 5 (11.4%) | 0 (0.0%) |
| 5:30 AM to 5:59 AM | 4 (9.1%) | 0 (0.0%) |
| 6:00 AM to 6:29 AM | 13 (29.5%) | 2 (8.0%) |
| 6:30 AM to 6:59 AM | 7 (15.9%) | 0 (0.0%) |
| 7:00 AM to 7:29 AM | 9 (20.4%) | 6 (24.0%) |
| 7:30 AM to 7:59 AM | 3 (6.8%) | 9 (36.0%) |
| 8:00 AM to 8:29 AM | 0 (0.0%) | 4 (16.0%) |
| 8:30 AM to 8:59 AM | 0 (0.0%) | 0 (0.0%) |
| 9:00 AM to 9:59 AM | 2 (4.5%) | 0 (0.0%) |
| 10:00 AM to 10:59 AM | 0 (0.0%) | 0 (0.0%) |
| 11:00 AM to 11:59 AM | 0 (0.0%) | 0 (0.0%) |
| 12:00 PM to 3:59 PM | 0 (0.0%) | 1 (4.0%) |
| 4:00 PM to 11:59 PM | 0 (0.0%) | 2 (8.0%) |
| Total | 44 (100.0%) | 25 (100.0%) |
Housing Occupancy in Carpio
Occupancy by Ownership in Carpio
Of the total 56 dwellings in Carpio, owner-occupied units account for 55 (98.2%), while renter-occupied units make up 1 (1.8%).
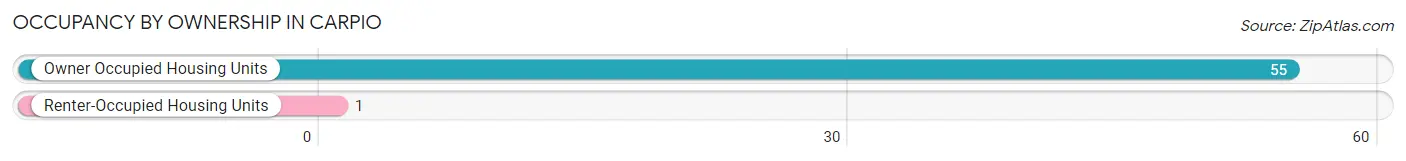
| Occupancy | # Housing Units | % Housing Units |
| Owner Occupied Housing Units | 55 | 98.2% |
| Renter-Occupied Housing Units | 1 | 1.8% |
| Total Occupied Housing Units | 56 | 100.0% |
Occupancy by Household Size in Carpio
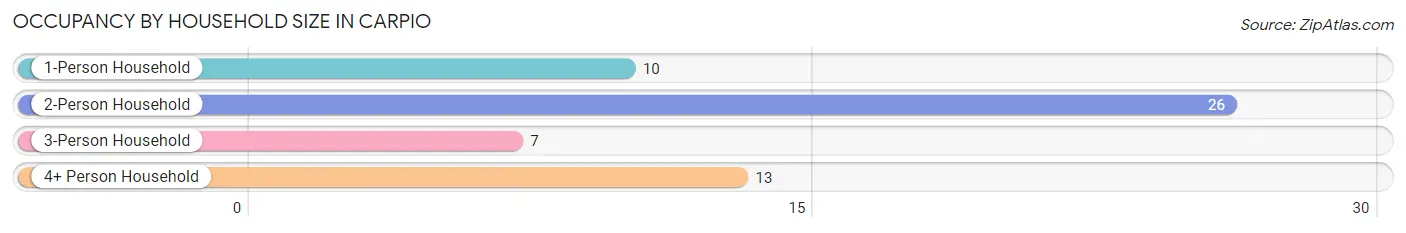
| Household Size | # Housing Units | % Housing Units |
| 1-Person Household | 10 | 17.9% |
| 2-Person Household | 26 | 46.4% |
| 3-Person Household | 7 | 12.5% |
| 4+ Person Household | 13 | 23.2% |
| Total Housing Units | 56 | 100.0% |
Occupancy by Ownership by Household Size in Carpio
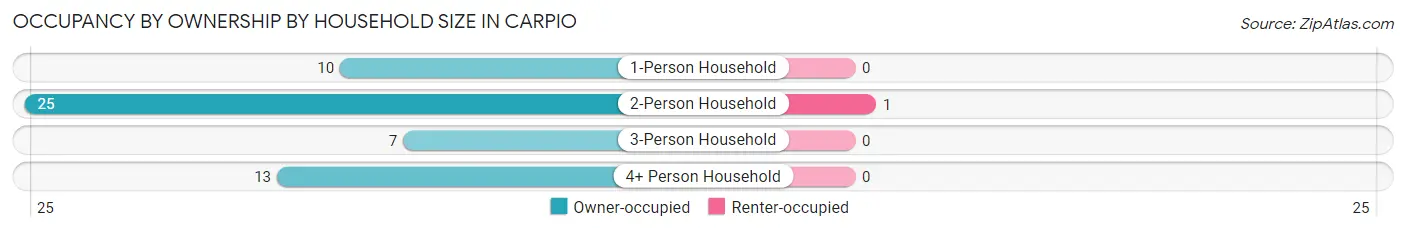
| Household Size | Owner-occupied | Renter-occupied |
| 1-Person Household | 10 (100.0%) | 0 (0.0%) |
| 2-Person Household | 25 (96.2%) | 1 (3.8%) |
| 3-Person Household | 7 (100.0%) | 0 (0.0%) |
| 4+ Person Household | 13 (100.0%) | 0 (0.0%) |
| Total Housing Units | 55 (98.2%) | 1 (1.8%) |
Occupancy by Educational Attainment in Carpio
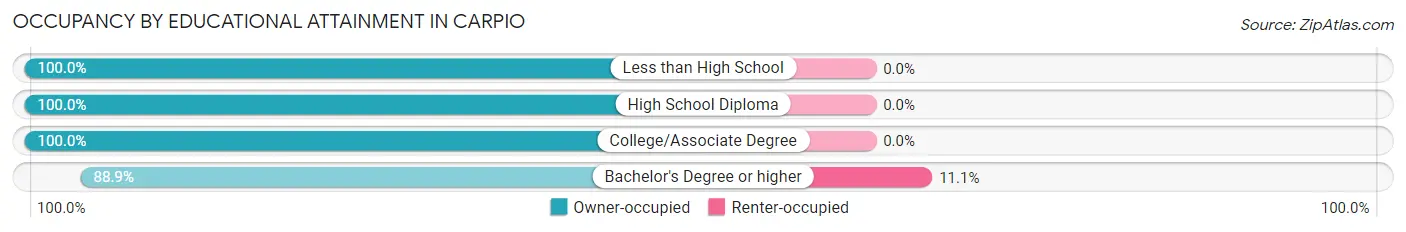
| Household Size | Owner-occupied | Renter-occupied |
| Less than High School | 1 (100.0%) | 0 (0.0%) |
| High School Diploma | 9 (100.0%) | 0 (0.0%) |
| College/Associate Degree | 37 (100.0%) | 0 (0.0%) |
| Bachelor's Degree or higher | 8 (88.9%) | 1 (11.1%) |
Occupancy by Age of Householder in Carpio
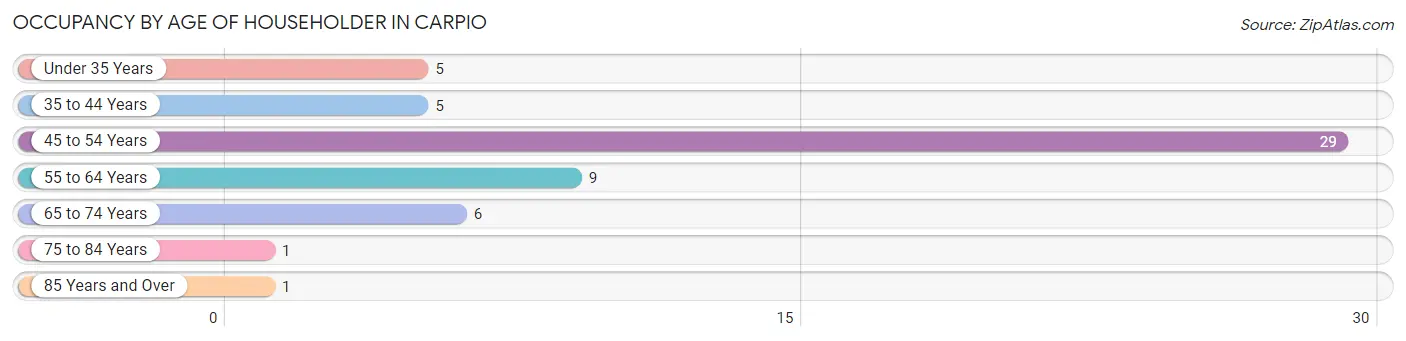
| Age Bracket | # Households | % Households |
| Under 35 Years | 5 | 8.9% |
| 35 to 44 Years | 5 | 8.9% |
| 45 to 54 Years | 29 | 51.8% |
| 55 to 64 Years | 9 | 16.1% |
| 65 to 74 Years | 6 | 10.7% |
| 75 to 84 Years | 1 | 1.8% |
| 85 Years and Over | 1 | 1.8% |
| Total | 56 | 100.0% |
Housing Finances in Carpio
Median Income by Occupancy in Carpio
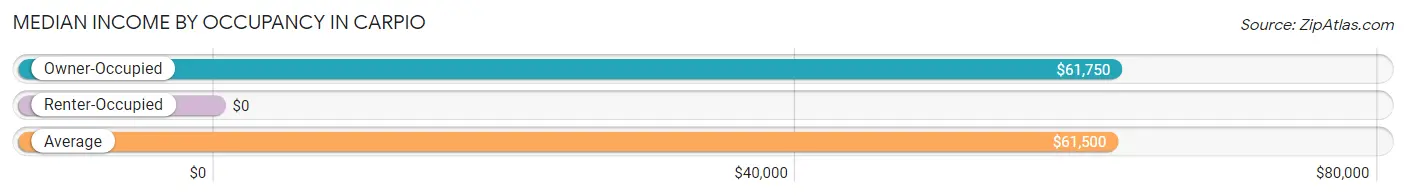
| Occupancy Type | # Households | Median Income |
| Owner-Occupied | 55 (98.2%) | $61,750 |
| Renter-Occupied | 1 (1.8%) | $0 |
| Average | 56 (100.0%) | $61,500 |
Occupancy by Householder Income Bracket in Carpio
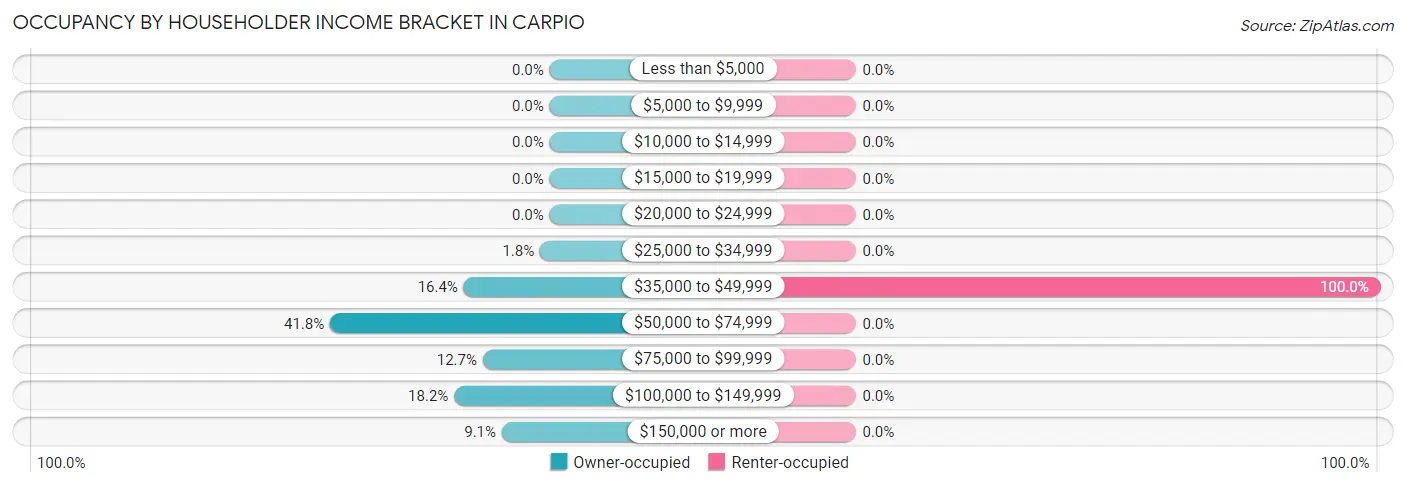
| Income Bracket | Owner-occupied | Renter-occupied |
| Less than $5,000 | 0 (0.0%) | 0 (0.0%) |
| $5,000 to $9,999 | 0 (0.0%) | 0 (0.0%) |
| $10,000 to $14,999 | 0 (0.0%) | 0 (0.0%) |
| $15,000 to $19,999 | 0 (0.0%) | 0 (0.0%) |
| $20,000 to $24,999 | 0 (0.0%) | 0 (0.0%) |
| $25,000 to $34,999 | 1 (1.8%) | 0 (0.0%) |
| $35,000 to $49,999 | 9 (16.4%) | 1 (100.0%) |
| $50,000 to $74,999 | 23 (41.8%) | 0 (0.0%) |
| $75,000 to $99,999 | 7 (12.7%) | 0 (0.0%) |
| $100,000 to $149,999 | 10 (18.2%) | 0 (0.0%) |
| $150,000 or more | 5 (9.1%) | 0 (0.0%) |
| Total | 55 (100.0%) | 1 (100.0%) |
Monthly Housing Cost Tiers in Carpio
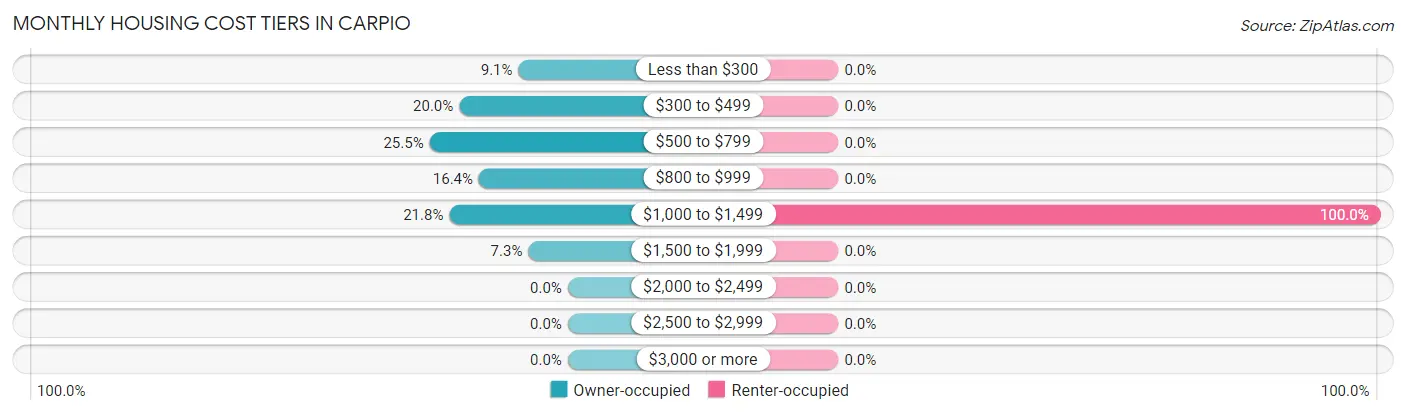
| Monthly Cost | Owner-occupied | Renter-occupied |
| Less than $300 | 5 (9.1%) | 0 (0.0%) |
| $300 to $499 | 11 (20.0%) | 0 (0.0%) |
| $500 to $799 | 14 (25.5%) | 0 (0.0%) |
| $800 to $999 | 9 (16.4%) | 0 (0.0%) |
| $1,000 to $1,499 | 12 (21.8%) | 1 (100.0%) |
| $1,500 to $1,999 | 4 (7.3%) | 0 (0.0%) |
| $2,000 to $2,499 | 0 (0.0%) | 0 (0.0%) |
| $2,500 to $2,999 | 0 (0.0%) | 0 (0.0%) |
| $3,000 or more | 0 (0.0%) | 0 (0.0%) |
| Total | 55 (100.0%) | 1 (100.0%) |
Physical Housing Characteristics in Carpio
Housing Structures in Carpio
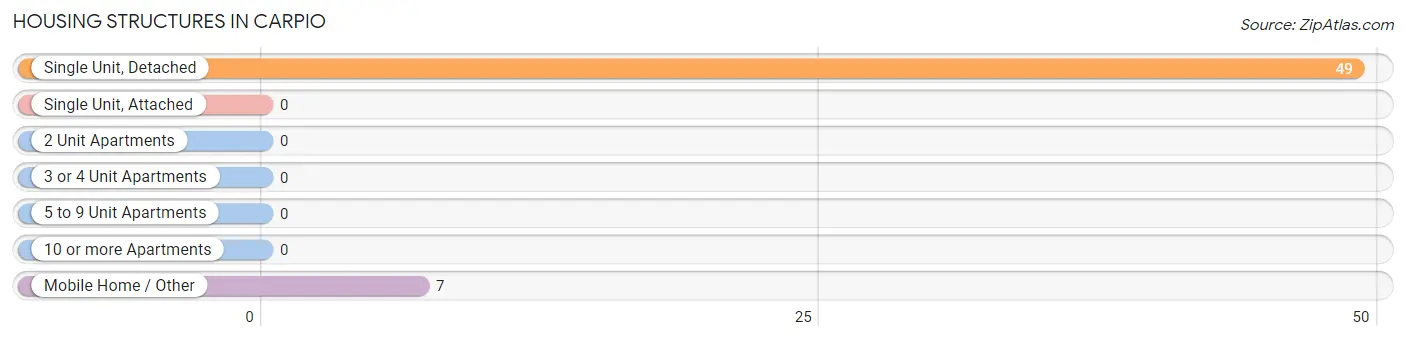
| Structure Type | # Housing Units | % Housing Units |
| Single Unit, Detached | 49 | 87.5% |
| Single Unit, Attached | 0 | 0.0% |
| 2 Unit Apartments | 0 | 0.0% |
| 3 or 4 Unit Apartments | 0 | 0.0% |
| 5 to 9 Unit Apartments | 0 | 0.0% |
| 10 or more Apartments | 0 | 0.0% |
| Mobile Home / Other | 7 | 12.5% |
| Total | 56 | 100.0% |
Housing Structures by Occupancy in Carpio
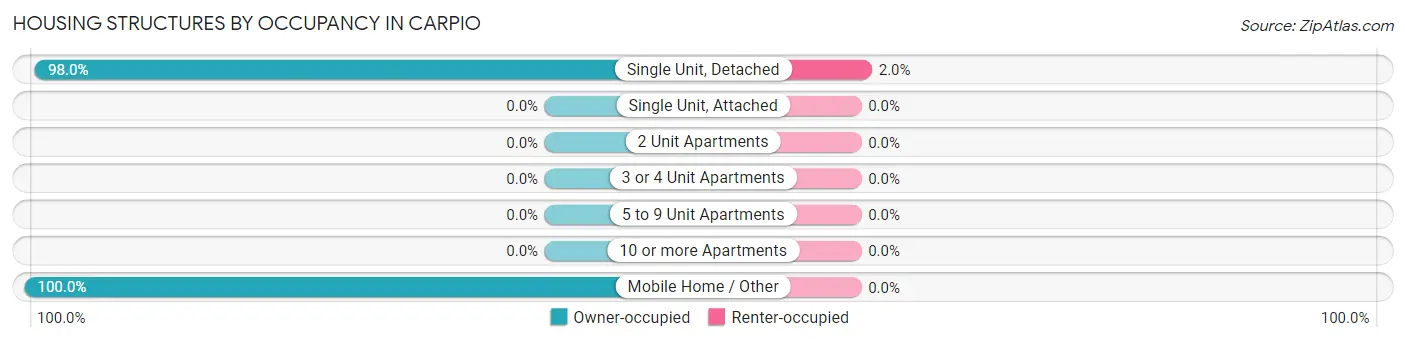
| Structure Type | Owner-occupied | Renter-occupied |
| Single Unit, Detached | 48 (98.0%) | 1 (2.0%) |
| Single Unit, Attached | 0 (0.0%) | 0 (0.0%) |
| 2 Unit Apartments | 0 (0.0%) | 0 (0.0%) |
| 3 or 4 Unit Apartments | 0 (0.0%) | 0 (0.0%) |
| 5 to 9 Unit Apartments | 0 (0.0%) | 0 (0.0%) |
| 10 or more Apartments | 0 (0.0%) | 0 (0.0%) |
| Mobile Home / Other | 7 (100.0%) | 0 (0.0%) |
| Total | 55 (98.2%) | 1 (1.8%) |
Housing Structures by Number of Rooms in Carpio
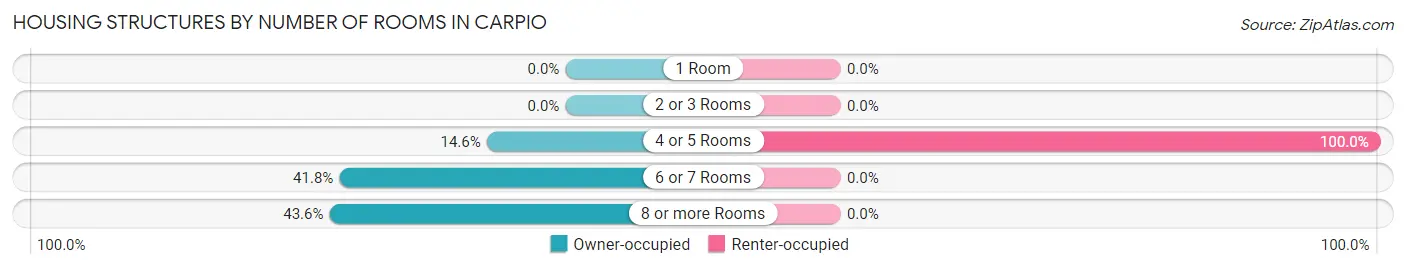
| Number of Rooms | Owner-occupied | Renter-occupied |
| 1 Room | 0 (0.0%) | 0 (0.0%) |
| 2 or 3 Rooms | 0 (0.0%) | 0 (0.0%) |
| 4 or 5 Rooms | 8 (14.5%) | 1 (100.0%) |
| 6 or 7 Rooms | 23 (41.8%) | 0 (0.0%) |
| 8 or more Rooms | 24 (43.6%) | 0 (0.0%) |
| Total | 55 (100.0%) | 1 (100.0%) |
Housing Structure by Heating Type in Carpio
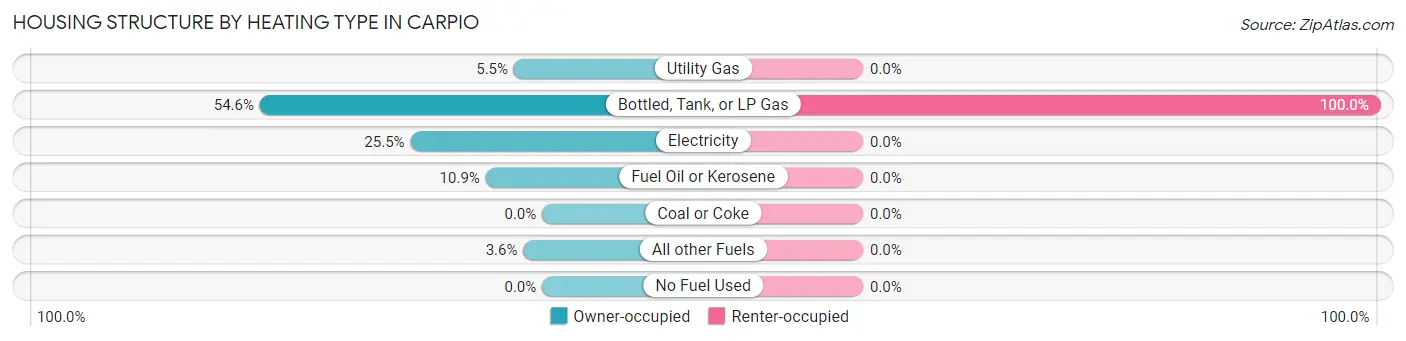
| Heating Type | Owner-occupied | Renter-occupied |
| Utility Gas | 3 (5.4%) | 0 (0.0%) |
| Bottled, Tank, or LP Gas | 30 (54.5%) | 1 (100.0%) |
| Electricity | 14 (25.5%) | 0 (0.0%) |
| Fuel Oil or Kerosene | 6 (10.9%) | 0 (0.0%) |
| Coal or Coke | 0 (0.0%) | 0 (0.0%) |
| All other Fuels | 2 (3.6%) | 0 (0.0%) |
| No Fuel Used | 0 (0.0%) | 0 (0.0%) |
| Total | 55 (100.0%) | 1 (100.0%) |
Household Vehicle Usage in Carpio
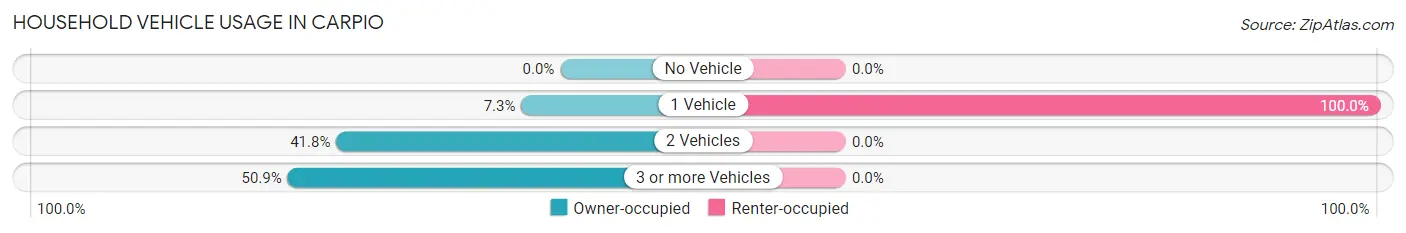
| Vehicles per Household | Owner-occupied | Renter-occupied |
| No Vehicle | 0 (0.0%) | 0 (0.0%) |
| 1 Vehicle | 4 (7.3%) | 1 (100.0%) |
| 2 Vehicles | 23 (41.8%) | 0 (0.0%) |
| 3 or more Vehicles | 28 (50.9%) | 0 (0.0%) |
| Total | 55 (100.0%) | 1 (100.0%) |
Real Estate & Mortgages in Carpio
Real Estate and Mortgage Overview in Carpio
| Characteristic | Without Mortgage | With Mortgage |
| Housing Units | 35 | 20 |
| Median Property Value | $81,700 | $110,700 |
| Median Household Income | $55,417 | $2 |
| Monthly Housing Costs | $515 | $0 |
| Real Estate Taxes | $700 | $0 |
Property Value by Mortgage Status in Carpio
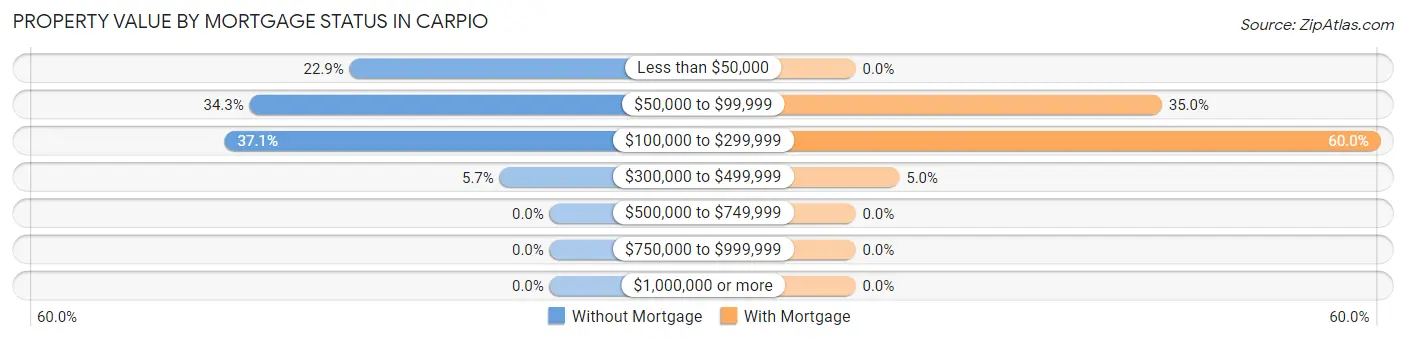
| Property Value | Without Mortgage | With Mortgage |
| Less than $50,000 | 8 (22.9%) | 0 (0.0%) |
| $50,000 to $99,999 | 12 (34.3%) | 7 (35.0%) |
| $100,000 to $299,999 | 13 (37.1%) | 12 (60.0%) |
| $300,000 to $499,999 | 2 (5.7%) | 1 (5.0%) |
| $500,000 to $749,999 | 0 (0.0%) | 0 (0.0%) |
| $750,000 to $999,999 | 0 (0.0%) | 0 (0.0%) |
| $1,000,000 or more | 0 (0.0%) | 0 (0.0%) |
| Total | 35 (100.0%) | 20 (100.0%) |
Household Income by Mortgage Status in Carpio
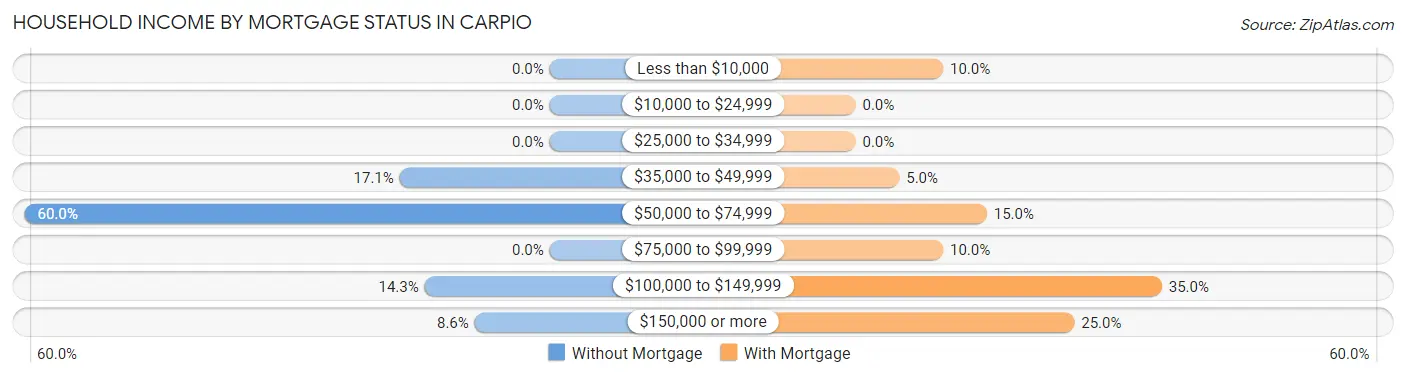
| Household Income | Without Mortgage | With Mortgage |
| Less than $10,000 | 0 (0.0%) | 2 (10.0%) |
| $10,000 to $24,999 | 0 (0.0%) | 0 (0.0%) |
| $25,000 to $34,999 | 0 (0.0%) | 0 (0.0%) |
| $35,000 to $49,999 | 6 (17.1%) | 1 (5.0%) |
| $50,000 to $74,999 | 21 (60.0%) | 3 (15.0%) |
| $75,000 to $99,999 | 0 (0.0%) | 2 (10.0%) |
| $100,000 to $149,999 | 5 (14.3%) | 7 (35.0%) |
| $150,000 or more | 3 (8.6%) | 5 (25.0%) |
| Total | 35 (100.0%) | 20 (100.0%) |
Property Value to Household Income Ratio in Carpio
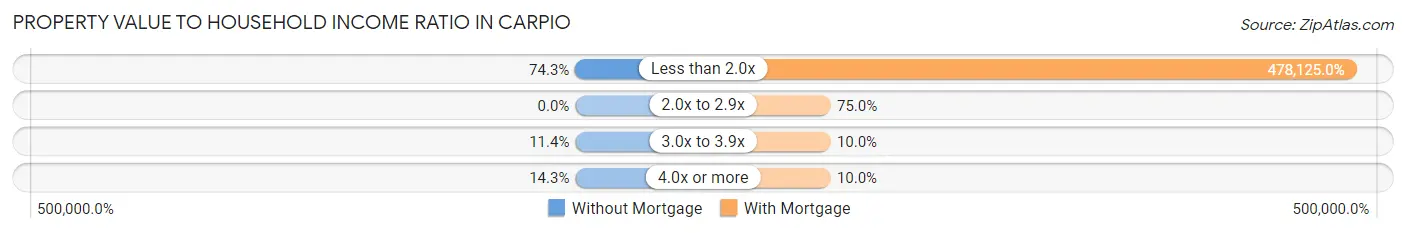
| Value-to-Income Ratio | Without Mortgage | With Mortgage |
| Less than 2.0x | 26 (74.3%) | 95,625 (478,125.0%) |
| 2.0x to 2.9x | 0 (0.0%) | 15 (75.0%) |
| 3.0x to 3.9x | 4 (11.4%) | 2 (10.0%) |
| 4.0x or more | 5 (14.3%) | 2 (10.0%) |
| Total | 35 (100.0%) | 20 (100.0%) |
Real Estate Taxes by Mortgage Status in Carpio
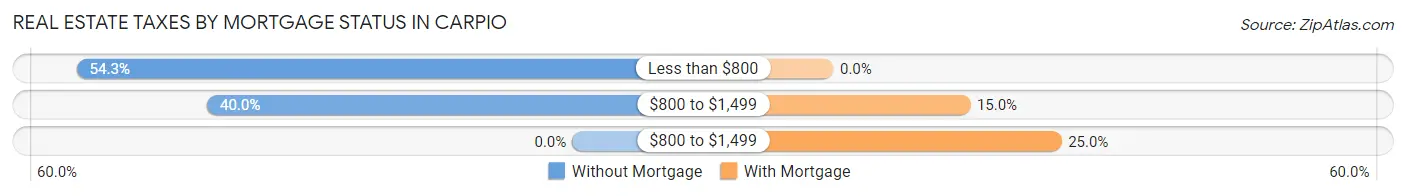
| Property Taxes | Without Mortgage | With Mortgage |
| Less than $800 | 19 (54.3%) | 0 (0.0%) |
| $800 to $1,499 | 14 (40.0%) | 3 (15.0%) |
| $800 to $1,499 | 0 (0.0%) | 5 (25.0%) |
| Total | 35 (100.0%) | 20 (100.0%) |
Health & Disability in Carpio
Health Insurance Coverage by Age in Carpio
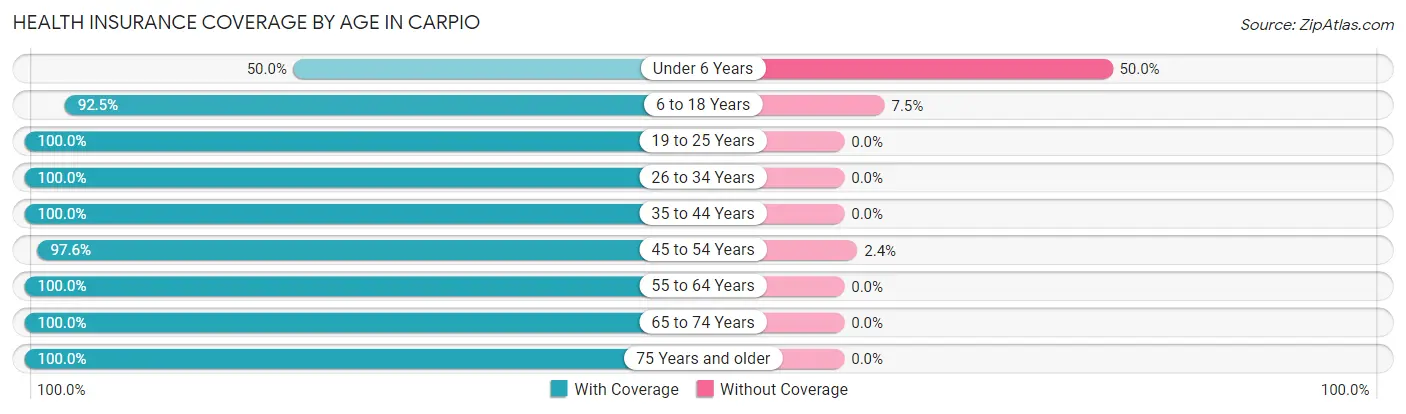
| Age Bracket | With Coverage | Without Coverage |
| Under 6 Years | 2 (50.0%) | 2 (50.0%) |
| 6 to 18 Years | 37 (92.5%) | 3 (7.5%) |
| 19 to 25 Years | 12 (100.0%) | 0 (0.0%) |
| 26 to 34 Years | 5 (100.0%) | 0 (0.0%) |
| 35 to 44 Years | 12 (100.0%) | 0 (0.0%) |
| 45 to 54 Years | 40 (97.6%) | 1 (2.4%) |
| 55 to 64 Years | 15 (100.0%) | 0 (0.0%) |
| 65 to 74 Years | 13 (100.0%) | 0 (0.0%) |
| 75 Years and older | 4 (100.0%) | 0 (0.0%) |
| Total | 140 (95.9%) | 6 (4.1%) |
Health Insurance Coverage by Citizenship Status in Carpio
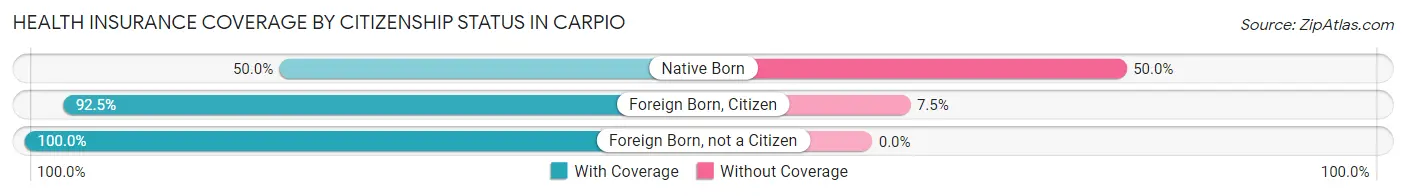
| Citizenship Status | With Coverage | Without Coverage |
| Native Born | 2 (50.0%) | 2 (50.0%) |
| Foreign Born, Citizen | 37 (92.5%) | 3 (7.5%) |
| Foreign Born, not a Citizen | 12 (100.0%) | 0 (0.0%) |
Health Insurance Coverage by Household Income in Carpio
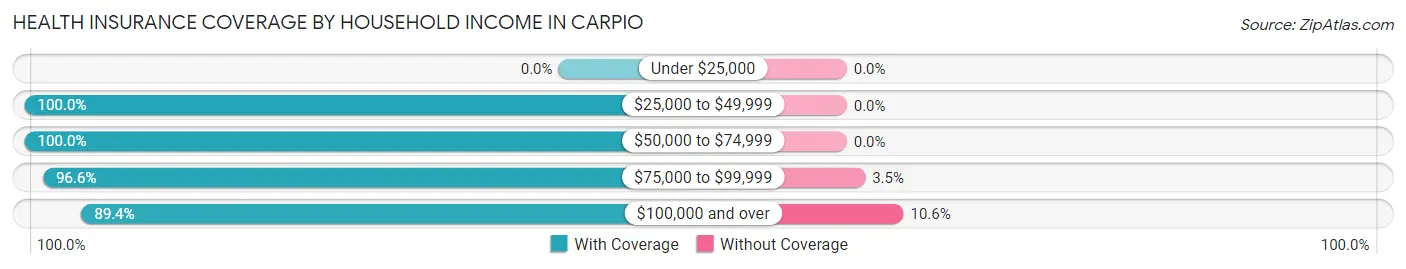
| Household Income | With Coverage | Without Coverage |
| Under $25,000 | 0 (0.0%) | 0 (0.0%) |
| $25,000 to $49,999 | 16 (100.0%) | 0 (0.0%) |
| $50,000 to $74,999 | 54 (100.0%) | 0 (0.0%) |
| $75,000 to $99,999 | 28 (96.6%) | 1 (3.5%) |
| $100,000 and over | 42 (89.4%) | 5 (10.6%) |
Public vs Private Health Insurance Coverage by Age in Carpio
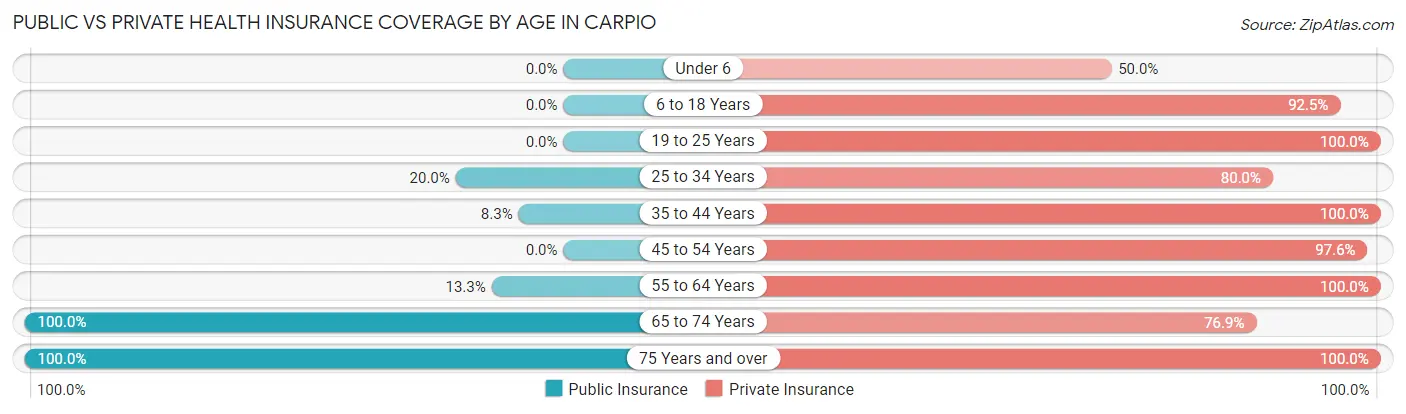
| Age Bracket | Public Insurance | Private Insurance |
| Under 6 | 0 (0.0%) | 2 (50.0%) |
| 6 to 18 Years | 0 (0.0%) | 37 (92.5%) |
| 19 to 25 Years | 0 (0.0%) | 12 (100.0%) |
| 25 to 34 Years | 1 (20.0%) | 4 (80.0%) |
| 35 to 44 Years | 1 (8.3%) | 12 (100.0%) |
| 45 to 54 Years | 0 (0.0%) | 40 (97.6%) |
| 55 to 64 Years | 2 (13.3%) | 15 (100.0%) |
| 65 to 74 Years | 13 (100.0%) | 10 (76.9%) |
| 75 Years and over | 4 (100.0%) | 4 (100.0%) |
| Total | 21 (14.4%) | 136 (93.1%) |
Disability Status by Sex by Age in Carpio
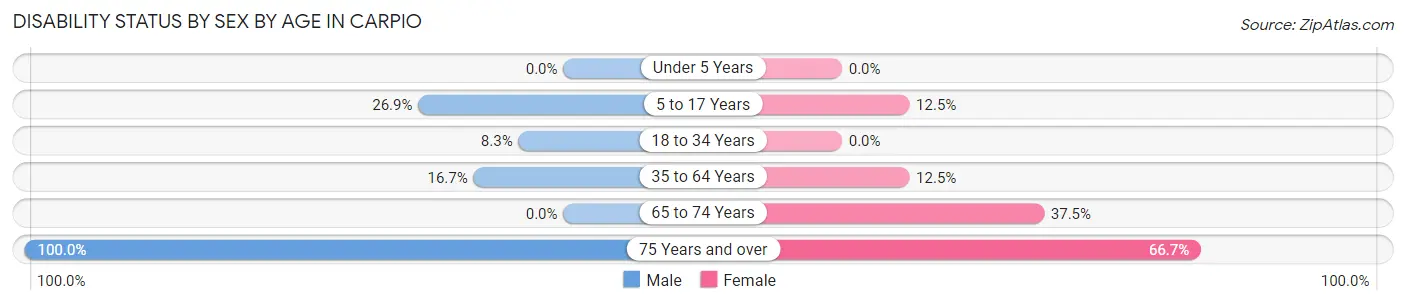
| Age Bracket | Male | Female |
| Under 5 Years | 0 (0.0%) | 0 (0.0%) |
| 5 to 17 Years | 7 (26.9%) | 2 (12.5%) |
| 18 to 34 Years | 1 (8.3%) | 0 (0.0%) |
| 35 to 64 Years | 6 (16.7%) | 4 (12.5%) |
| 65 to 74 Years | 0 (0.0%) | 3 (37.5%) |
| 75 Years and over | 1 (100.0%) | 2 (66.7%) |
Disability Class by Sex by Age in Carpio
Disability Class: Hearing Difficulty
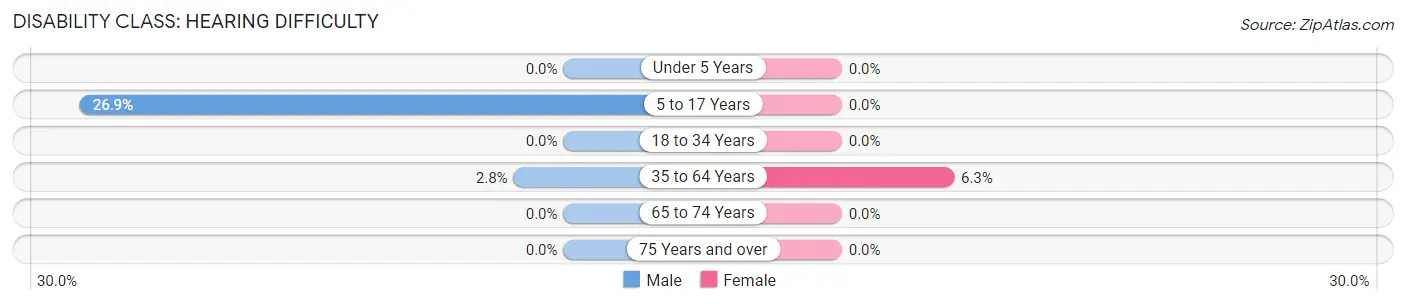
| Age Bracket | Male | Female |
| Under 5 Years | 0 (0.0%) | 0 (0.0%) |
| 5 to 17 Years | 7 (26.9%) | 0 (0.0%) |
| 18 to 34 Years | 0 (0.0%) | 0 (0.0%) |
| 35 to 64 Years | 1 (2.8%) | 2 (6.2%) |
| 65 to 74 Years | 0 (0.0%) | 0 (0.0%) |
| 75 Years and over | 0 (0.0%) | 0 (0.0%) |
Disability Class: Vision Difficulty
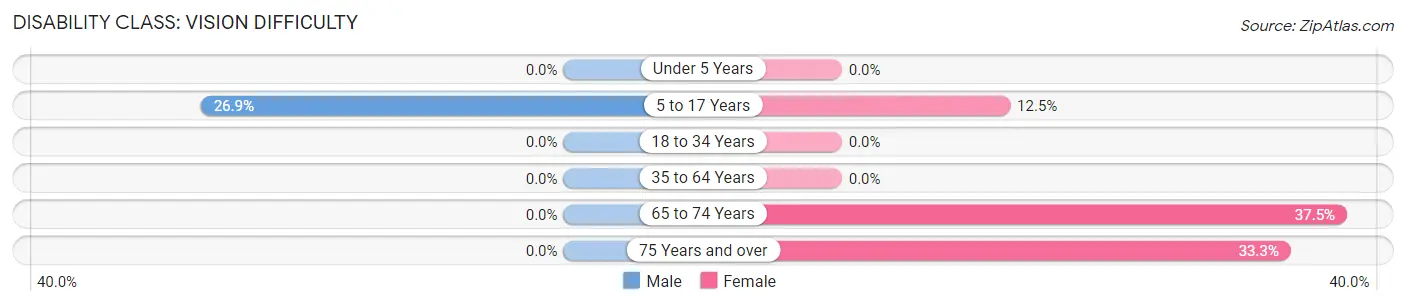
| Age Bracket | Male | Female |
| Under 5 Years | 0 (0.0%) | 0 (0.0%) |
| 5 to 17 Years | 7 (26.9%) | 2 (12.5%) |
| 18 to 34 Years | 0 (0.0%) | 0 (0.0%) |
| 35 to 64 Years | 0 (0.0%) | 0 (0.0%) |
| 65 to 74 Years | 0 (0.0%) | 3 (37.5%) |
| 75 Years and over | 0 (0.0%) | 1 (33.3%) |
Disability Class: Cognitive Difficulty
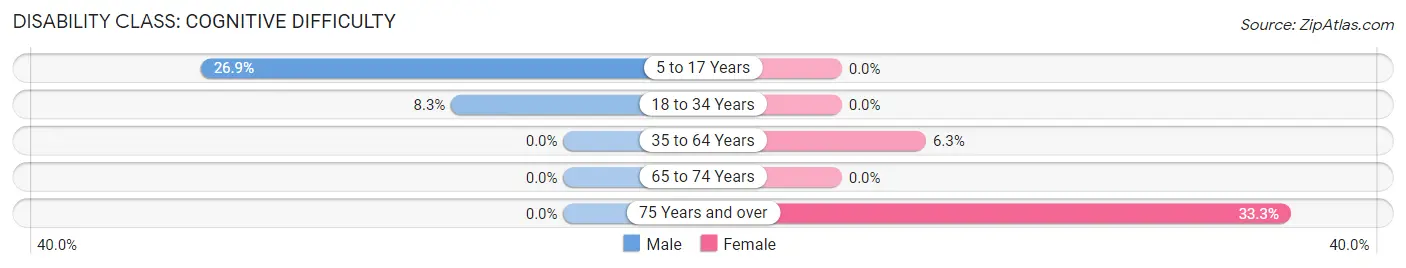
| Age Bracket | Male | Female |
| 5 to 17 Years | 7 (26.9%) | 0 (0.0%) |
| 18 to 34 Years | 1 (8.3%) | 0 (0.0%) |
| 35 to 64 Years | 0 (0.0%) | 2 (6.2%) |
| 65 to 74 Years | 0 (0.0%) | 0 (0.0%) |
| 75 Years and over | 0 (0.0%) | 1 (33.3%) |
Disability Class: Ambulatory Difficulty
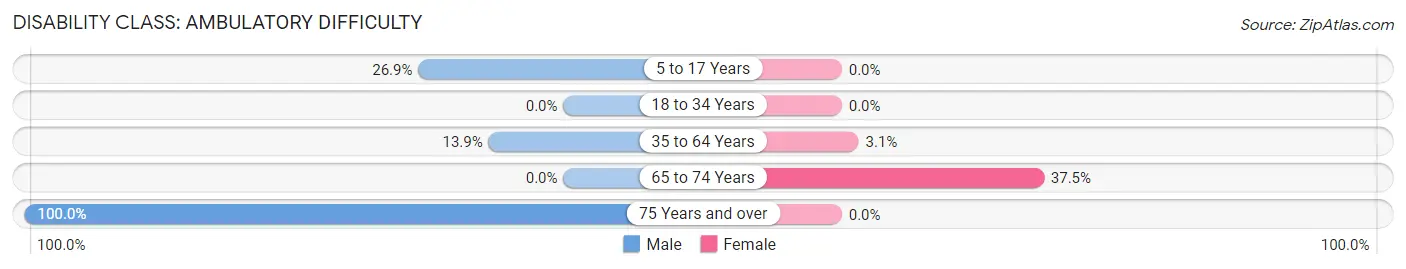
| Age Bracket | Male | Female |
| 5 to 17 Years | 7 (26.9%) | 0 (0.0%) |
| 18 to 34 Years | 0 (0.0%) | 0 (0.0%) |
| 35 to 64 Years | 5 (13.9%) | 1 (3.1%) |
| 65 to 74 Years | 0 (0.0%) | 3 (37.5%) |
| 75 Years and over | 1 (100.0%) | 0 (0.0%) |
Disability Class: Self-Care Difficulty
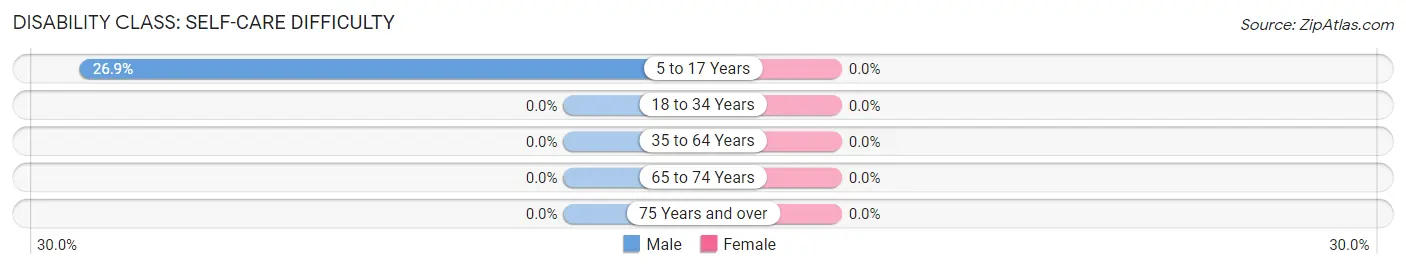
| Age Bracket | Male | Female |
| 5 to 17 Years | 7 (26.9%) | 0 (0.0%) |
| 18 to 34 Years | 0 (0.0%) | 0 (0.0%) |
| 35 to 64 Years | 0 (0.0%) | 0 (0.0%) |
| 65 to 74 Years | 0 (0.0%) | 0 (0.0%) |
| 75 Years and over | 0 (0.0%) | 0 (0.0%) |
Technology Access in Carpio
Computing Device Access in Carpio
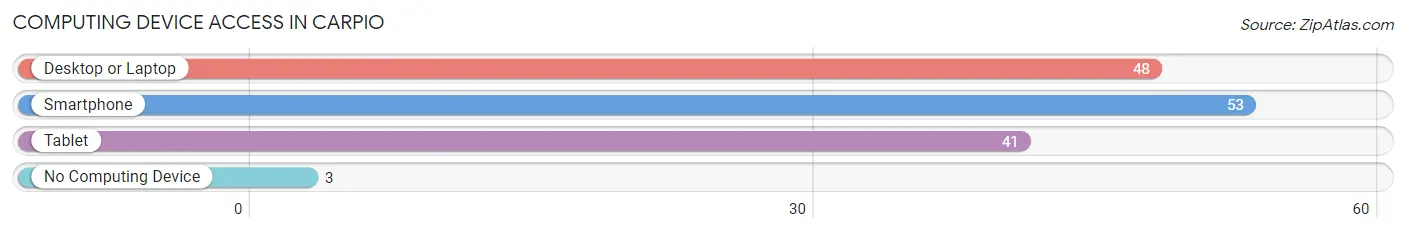
| Device Type | # Households | % Households |
| Desktop or Laptop | 48 | 85.7% |
| Smartphone | 53 | 94.6% |
| Tablet | 41 | 73.2% |
| No Computing Device | 3 | 5.4% |
| Total | 56 | 100.0% |
Internet Access in Carpio
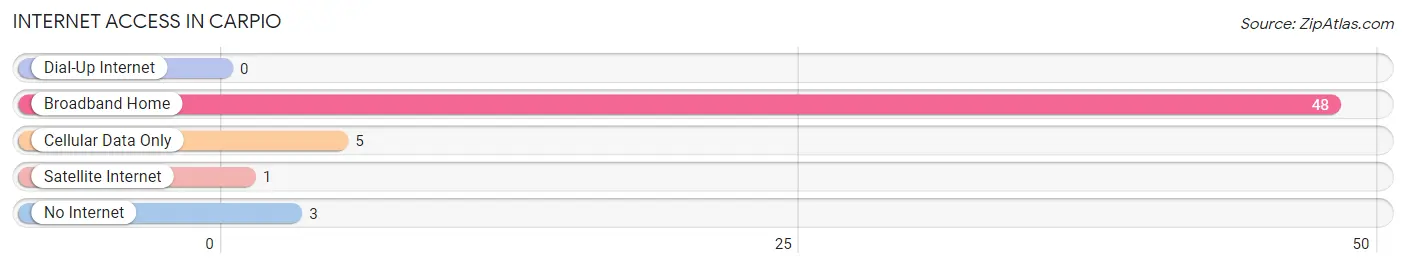
| Internet Type | # Households | % Households |
| Dial-Up Internet | 0 | 0.0% |
| Broadband Home | 48 | 85.7% |
| Cellular Data Only | 5 | 8.9% |
| Satellite Internet | 1 | 1.8% |
| No Internet | 3 | 5.4% |
| Total | 56 | 100.0% |
Carpio Summary
The Republic of the Philippines is an archipelago located in Southeast Asia, consisting of 7,641 islands in the western Pacific Ocean. The country is divided into three main geographical regions: Luzon, Visayas, and Mindanao. The largest island is Luzon, which is home to the capital city of Manila.
The population of the Philippines in 2000 was estimated to be 76.5 million people. The majority of the population is of Malay descent, with a significant minority of Chinese, Spanish, and American descent. The official language is Filipino, which is based on the Tagalog language. English is also widely spoken.
The economy of the Philippines is largely based on agriculture, with rice, corn, and coconut being the main crops. Other important industries include fishing, forestry, and mining. The country is also a major exporter of electronics, textiles, and garments.
The climate of the Philippines is tropical, with temperatures ranging from 21 to 32 degrees Celsius. The country experiences two distinct seasons: the wet season from May to October and the dry season from November to April.
The history of the Philippines dates back to the 16th century, when the Spanish arrived and colonized the islands. The country was ceded to the United States in 1898, and became an independent nation in 1946. Since then, the country has experienced periods of political instability, economic hardship, and natural disasters.
Carpio is a municipality in the province of Davao del Norte, located in the southern part of the Philippines. It is bordered by the municipalities of Kapalong, Asuncion, and New Corella. The population of Carpio in 2000 was estimated to be 24,000 people.
The economy of Carpio is largely based on agriculture, with rice, corn, and coconut being the main crops. Other important industries include fishing, forestry, and mining. The municipality is also a major exporter of electronics, textiles, and garments.
The climate of Carpio is tropical, with temperatures ranging from 21 to 32 degrees Celsius. The municipality experiences two distinct seasons: the wet season from May to October and the dry season from November to April.
Carpio has a rich cultural heritage, with a variety of festivals and celebrations taking place throughout the year. The most popular festival is the Carpio Festival, which is held every April and celebrates the town’s history and culture.
Carpio is a municipality that is rich in history, culture, and natural beauty. It is a great place to visit and explore, and offers a unique insight into the Philippines.
Common Questions
What is Per Capita Income in Carpio?
Per Capita income in Carpio is $38,673.
What is the Median Family Income in Carpio?
Median Family Income in Carpio is $63,750.
What is the Median Household income in Carpio?
Median Household Income in Carpio is $61,500.
What is Income or Wage Gap in Carpio?
Income or Wage Gap in Carpio is 45.9%.
Women in Carpio earn 54.1 cents for every dollar earned by a man.
What is Inequality or Gini Index in Carpio?
Inequality or Gini Index in Carpio is 0.41.
What is the Total Population of Carpio?
Total Population of Carpio is 146.
What is the Total Male Population of Carpio?
Total Male Population of Carpio is 80.
What is the Total Female Population of Carpio?
Total Female Population of Carpio is 66.
What is the Ratio of Males per 100 Females in Carpio?
There are 121.21 Males per 100 Females in Carpio.
What is the Ratio of Females per 100 Males in Carpio?
There are 82.50 Females per 100 Males in Carpio.
What is the Median Population Age in Carpio?
Median Population Age in Carpio is 44.0 Years.
What is the Average Family Size in Carpio
Average Family Size in Carpio is 2.9 People.
What is the Average Household Size in Carpio
Average Household Size in Carpio is 2.6 People.
How Large is the Labor Force in Carpio?
There are 75 People in the Labor Forcein in Carpio.
What is the Percentage of People in the Labor Force in Carpio?
69.4% of People are in the Labor Force in Carpio.