Wishek, ND Map & Demographics
Wishek Map
Wishek Overview
$33,693
PER CAPITA INCOME
$75,000
AVG FAMILY INCOME
$61,953
AVG HOUSEHOLD INCOME
35.0%
WAGE / INCOME GAP [ % ]
65.0¢/ $1
WAGE / INCOME GAP [ $ ]
0.48
INEQUALITY / GINI INDEX
951
TOTAL POPULATION
429
MALE POPULATION
522
FEMALE POPULATION
82.18
MALES / 100 FEMALES
121.68
FEMALES / 100 MALES
42.9
MEDIAN AGE
3.1
AVG FAMILY SIZE
2.4
AVG HOUSEHOLD SIZE
443
LABOR FORCE [ PEOPLE ]
59.5%
PERCENT IN LABOR FORCE
Wishek Zip Codes
Wishek Area Codes
Income in Wishek
Income Overview in Wishek
Per Capita Income in Wishek is $33,693, while median incomes of families and households are $75,000 and $61,953 respectively.
| Characteristic | Number | Measure |
| Per Capita Income | 951 | $33,693 |
| Median Family Income | 236 | $75,000 |
| Mean Family Income | 236 | $103,244 |
| Median Household Income | 375 | $61,953 |
| Mean Household Income | 375 | $81,381 |
| Income Deficit | 236 | $0 |
| Wage / Income Gap (%) | 951 | 35.00% |
| Wage / Income Gap ($) | 951 | 65.00¢ per $1 |
| Gini / Inequality Index | 951 | 0.48 |
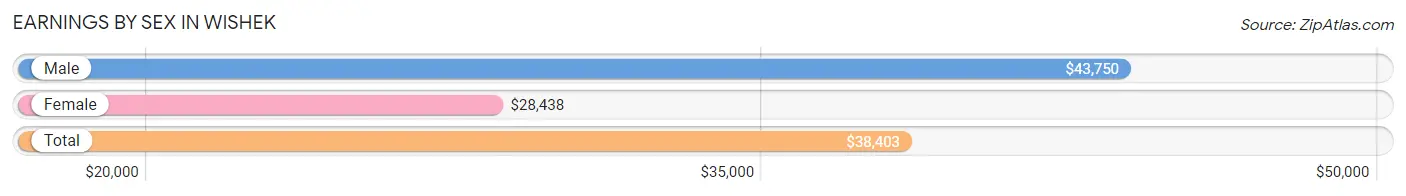
Earnings by Sex in Wishek
Average Earnings in Wishek are $38,403, $43,750 for men and $28,438 for women, a difference of 35.0%.
| Sex | Number | Average Earnings |
| Male | 231 (49.9%) | $43,750 |
| Female | 232 (50.1%) | $28,438 |
| Total | 463 (100.0%) | $38,403 |
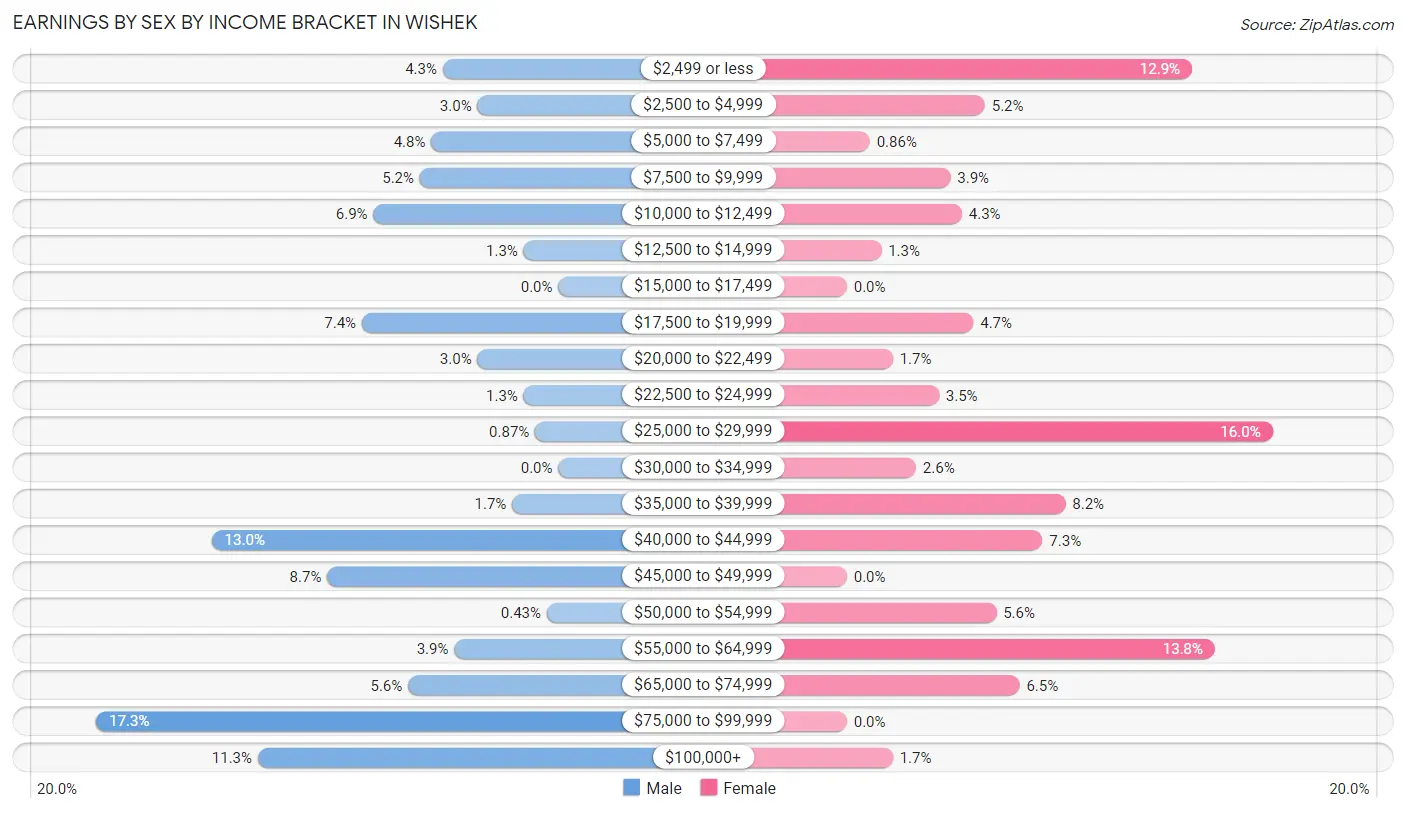
Earnings by Sex by Income Bracket in Wishek
The most common earnings brackets in Wishek are $75,000 to $99,999 for men (40 | 17.3%) and $25,000 to $29,999 for women (37 | 16.0%).
| Income | Male | Female |
| $2,499 or less | 10 (4.3%) | 30 (12.9%) |
| $2,500 to $4,999 | 7 (3.0%) | 12 (5.2%) |
| $5,000 to $7,499 | 11 (4.8%) | 2 (0.9%) |
| $7,500 to $9,999 | 12 (5.2%) | 9 (3.9%) |
| $10,000 to $12,499 | 16 (6.9%) | 10 (4.3%) |
| $12,500 to $14,999 | 3 (1.3%) | 3 (1.3%) |
| $15,000 to $17,499 | 0 (0.0%) | 0 (0.0%) |
| $17,500 to $19,999 | 17 (7.4%) | 11 (4.7%) |
| $20,000 to $22,499 | 7 (3.0%) | 4 (1.7%) |
| $22,500 to $24,999 | 3 (1.3%) | 8 (3.5%) |
| $25,000 to $29,999 | 2 (0.9%) | 37 (16.0%) |
| $30,000 to $34,999 | 0 (0.0%) | 6 (2.6%) |
| $35,000 to $39,999 | 4 (1.7%) | 19 (8.2%) |
| $40,000 to $44,999 | 30 (13.0%) | 17 (7.3%) |
| $45,000 to $49,999 | 20 (8.7%) | 0 (0.0%) |
| $50,000 to $54,999 | 1 (0.4%) | 13 (5.6%) |
| $55,000 to $64,999 | 9 (3.9%) | 32 (13.8%) |
| $65,000 to $74,999 | 13 (5.6%) | 15 (6.5%) |
| $75,000 to $99,999 | 40 (17.3%) | 0 (0.0%) |
| $100,000+ | 26 (11.3%) | 4 (1.7%) |
| Total | 231 (100.0%) | 232 (100.0%) |
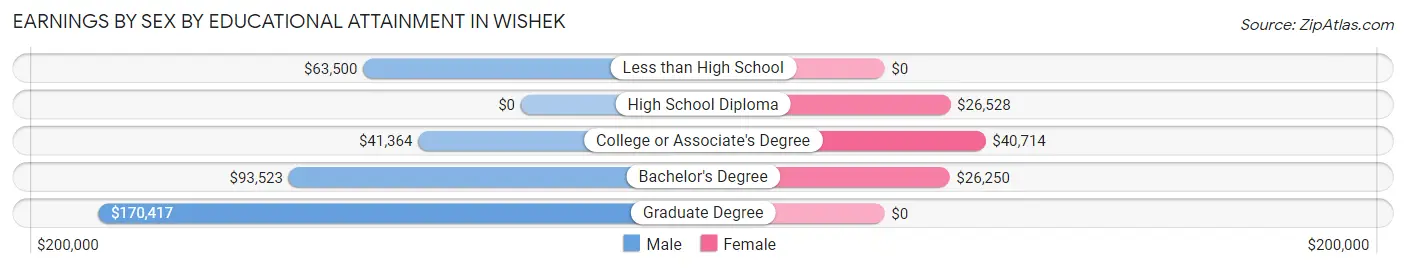
Earnings by Sex by Educational Attainment in Wishek
Average earnings in Wishek are $45,000 for men and $28,750 for women, a difference of 36.1%. Men with an educational attainment of graduate degree enjoy the highest average annual earnings of $170,417, while those with college or associate's degree education earn the least with $41,364. Women with an educational attainment of college or associate's degree earn the most with the average annual earnings of $40,714, while those with bachelor's degree education have the smallest earnings of $26,250.
| Educational Attainment | Male Income | Female Income |
| Less than High School | $63,500 | $0 |
| High School Diploma | - | - |
| College or Associate's Degree | $41,364 | $40,714 |
| Bachelor's Degree | $93,523 | $26,250 |
| Graduate Degree | $170,417 | $0 |
| Total | $45,000 | $28,750 |
Family Income in Wishek
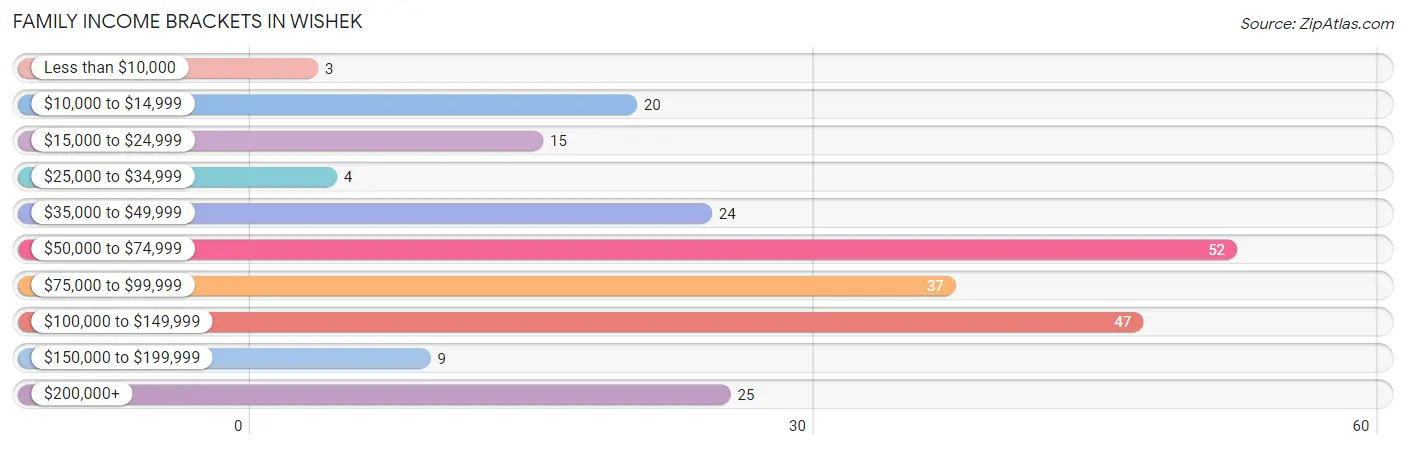
Family Income Brackets in Wishek
According to the Wishek family income data, there are 52 families falling into the $50,000 to $74,999 income range, which is the most common income bracket and makes up 22.0% of all families. Conversely, the less than $10,000 income bracket is the least frequent group with only 3 families (1.3%) belonging to this category.
| Income Bracket | # Families | % Families |
| Less than $10,000 | 3 | 1.3% |
| $10,000 to $14,999 | 20 | 8.5% |
| $15,000 to $24,999 | 15 | 6.4% |
| $25,000 to $34,999 | 4 | 1.7% |
| $35,000 to $49,999 | 24 | 10.2% |
| $50,000 to $74,999 | 52 | 22.0% |
| $75,000 to $99,999 | 37 | 15.7% |
| $100,000 to $149,999 | 47 | 19.9% |
| $150,000 to $199,999 | 9 | 3.8% |
| $200,000+ | 25 | 10.6% |
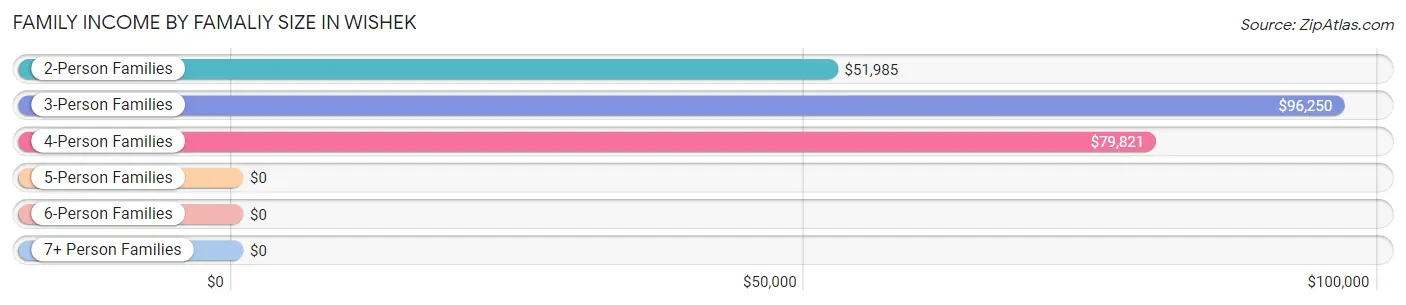
Family Income by Famaliy Size in Wishek
3-person families (20 | 8.5%) account for the highest median family income in Wishek with $96,250 per family, while 3-person families (20 | 8.5%) have the highest median income of $32,083 per family member.
| Income Bracket | # Families | Median Income |
| 2-Person Families | 133 (56.4%) | $51,985 |
| 3-Person Families | 20 (8.5%) | $96,250 |
| 4-Person Families | 35 (14.8%) | $79,821 |
| 5-Person Families | 28 (11.9%) | $0 |
| 6-Person Families | 16 (6.8%) | $0 |
| 7+ Person Families | 4 (1.7%) | $0 |
| Total | 236 (100.0%) | $75,000 |
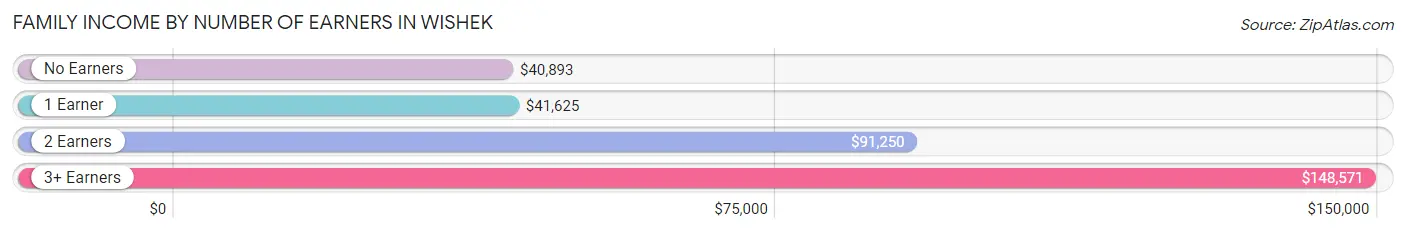
Family Income by Number of Earners in Wishek
The median family income in Wishek is $75,000, with families comprising 3+ earners (24) having the highest median family income of $148,571, while families with no earners (45) have the lowest median family income of $40,893, accounting for 10.2% and 19.1% of families, respectively.
| Number of Earners | # Families | Median Income |
| No Earners | 45 (19.1%) | $40,893 |
| 1 Earner | 31 (13.1%) | $41,625 |
| 2 Earners | 136 (57.6%) | $91,250 |
| 3+ Earners | 24 (10.2%) | $148,571 |
| Total | 236 (100.0%) | $75,000 |
Household Income in Wishek
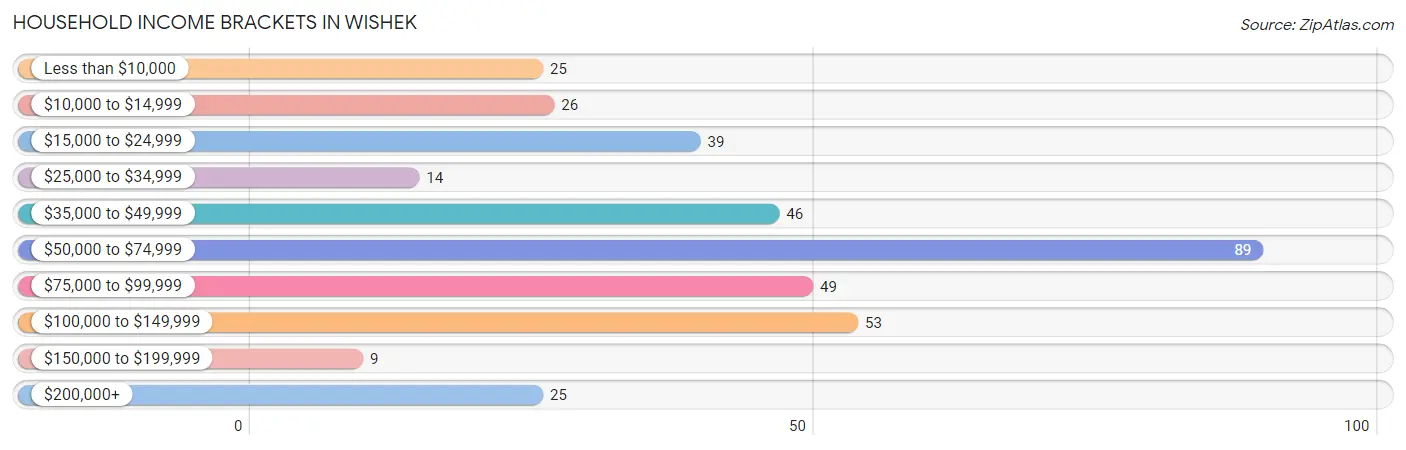
Household Income Brackets in Wishek
With 89 households falling in the category, the $50,000 to $74,999 income range is the most frequent in Wishek, accounting for 23.7% of all households. In contrast, only 9 households (2.4%) fall into the $150,000 to $199,999 income bracket, making it the least populous group.
| Income Bracket | # Households | % Households |
| Less than $10,000 | 25 | 6.7% |
| $10,000 to $14,999 | 26 | 6.9% |
| $15,000 to $24,999 | 39 | 10.4% |
| $25,000 to $34,999 | 14 | 3.7% |
| $35,000 to $49,999 | 46 | 12.3% |
| $50,000 to $74,999 | 89 | 23.7% |
| $75,000 to $99,999 | 49 | 13.1% |
| $100,000 to $149,999 | 53 | 14.1% |
| $150,000 to $199,999 | 9 | 2.4% |
| $200,000+ | 25 | 6.7% |
Household Income by Householder Age in Wishek
The median household income in Wishek is $61,953, with the highest median household income of $79,688 found in the 45 to 64 years age bracket for the primary householder. A total of 110 households (29.3%) fall into this category. Meanwhile, the 15 to 24 years age bracket for the primary householder has the lowest median household income of $0, with 13 households (3.5%) in this group.
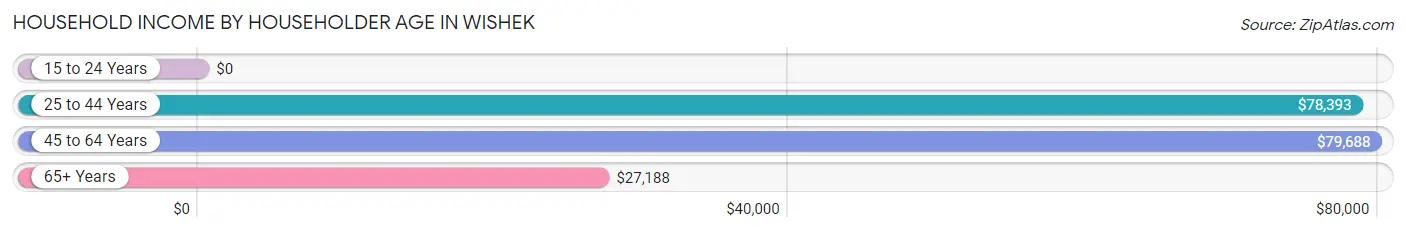
| Income Bracket | # Households | Median Income |
| 15 to 24 Years | 13 (3.5%) | $0 |
| 25 to 44 Years | 111 (29.6%) | $78,393 |
| 45 to 64 Years | 110 (29.3%) | $79,688 |
| 65+ Years | 141 (37.6%) | $27,188 |
| Total | 375 (100.0%) | $61,953 |
Poverty in Wishek
Income Below Poverty by Sex and Age in Wishek
With 17.8% poverty level for males and 15.6% for females among the residents of Wishek, 5 year old males and 25 to 34 year old females are the most vulnerable to poverty, with 3 males (100.0%) and 17 females (36.2%) in their respective age groups living below the poverty level.
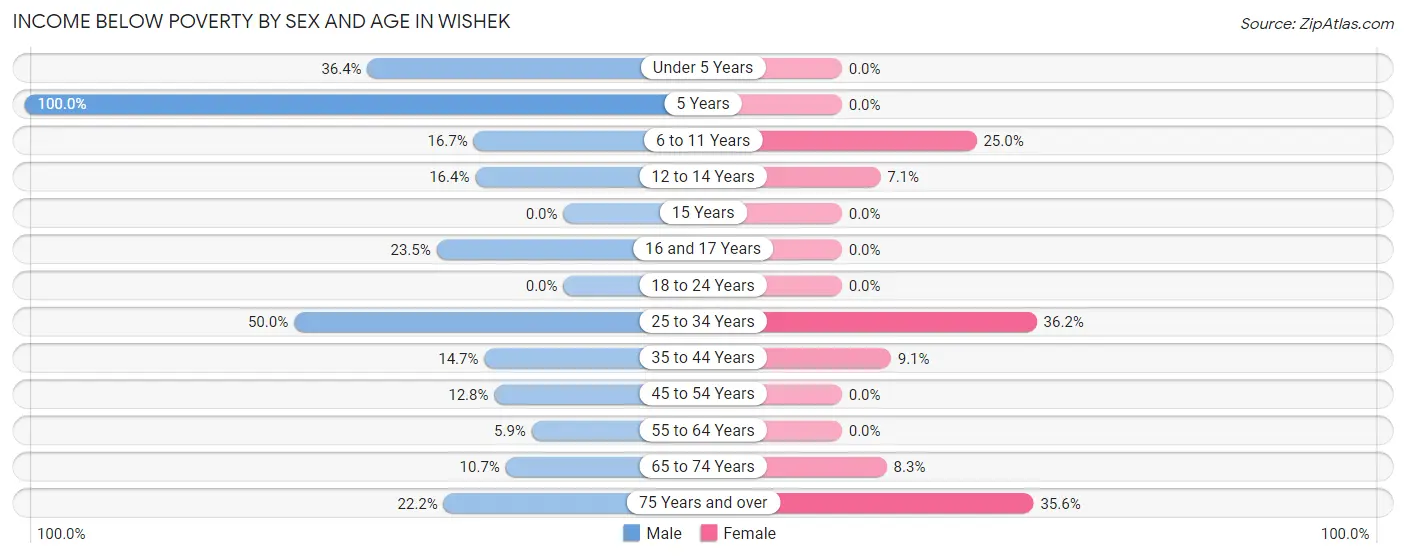
| Age Bracket | Male | Female |
| Under 5 Years | 8 (36.4%) | 0 (0.0%) |
| 5 Years | 3 (100.0%) | 0 (0.0%) |
| 6 to 11 Years | 3 (16.7%) | 8 (25.0%) |
| 12 to 14 Years | 9 (16.4%) | 2 (7.1%) |
| 15 Years | 0 (0.0%) | 0 (0.0%) |
| 16 and 17 Years | 4 (23.5%) | 0 (0.0%) |
| 18 to 24 Years | 0 (0.0%) | 0 (0.0%) |
| 25 to 34 Years | 11 (50.0%) | 17 (36.2%) |
| 35 to 44 Years | 11 (14.7%) | 7 (9.1%) |
| 45 to 54 Years | 5 (12.8%) | 0 (0.0%) |
| 55 to 64 Years | 3 (5.9%) | 0 (0.0%) |
| 65 to 74 Years | 3 (10.7%) | 3 (8.3%) |
| 75 Years and over | 12 (22.2%) | 37 (35.6%) |
| Total | 72 (17.8%) | 74 (15.6%) |
Income Above Poverty by Sex and Age in Wishek
According to the poverty statistics in Wishek, males aged 15 years and females aged under 5 years are the age groups that are most secure financially, with 100.0% of males and 100.0% of females in these age groups living above the poverty line.
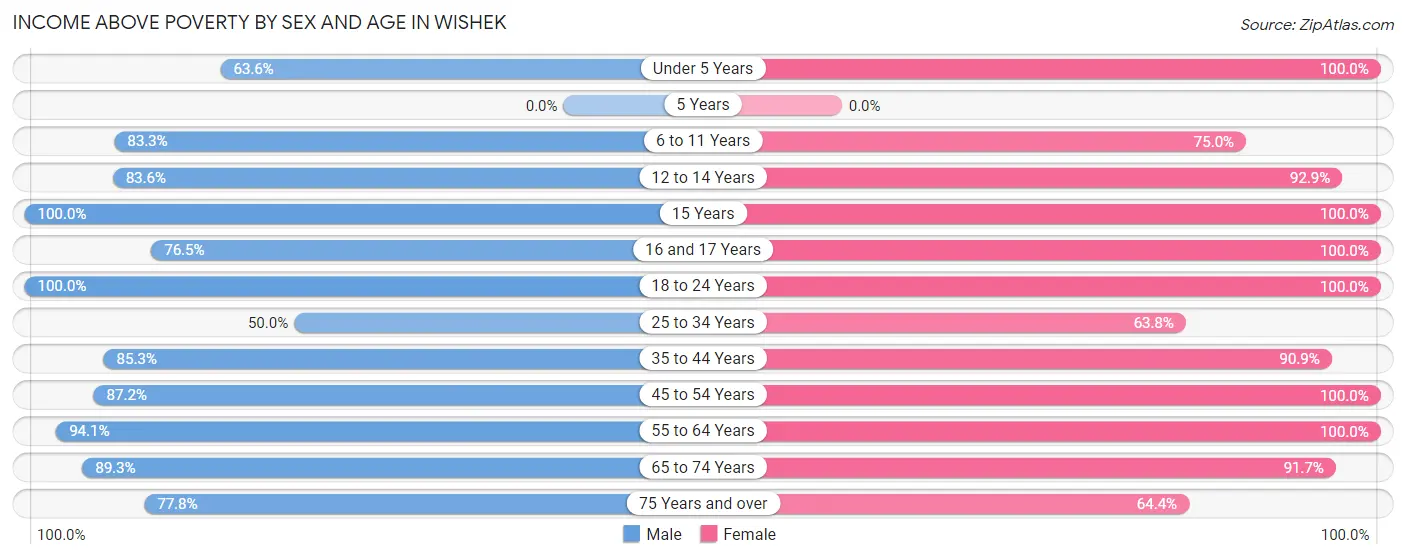
| Age Bracket | Male | Female |
| Under 5 Years | 14 (63.6%) | 23 (100.0%) |
| 5 Years | 0 (0.0%) | 0 (0.0%) |
| 6 to 11 Years | 15 (83.3%) | 24 (75.0%) |
| 12 to 14 Years | 46 (83.6%) | 26 (92.9%) |
| 15 Years | 4 (100.0%) | 19 (100.0%) |
| 16 and 17 Years | 13 (76.5%) | 10 (100.0%) |
| 18 to 24 Years | 16 (100.0%) | 13 (100.0%) |
| 25 to 34 Years | 11 (50.0%) | 30 (63.8%) |
| 35 to 44 Years | 64 (85.3%) | 70 (90.9%) |
| 45 to 54 Years | 34 (87.2%) | 33 (100.0%) |
| 55 to 64 Years | 48 (94.1%) | 52 (100.0%) |
| 65 to 74 Years | 25 (89.3%) | 33 (91.7%) |
| 75 Years and over | 42 (77.8%) | 67 (64.4%) |
| Total | 332 (82.2%) | 400 (84.4%) |
Income Below Poverty Among Married-Couple Families in Wishek
The poverty statistics for married-couple families in Wishek show that 13.2% or 28 of the total 212 families live below the poverty line. Families with no children have the highest poverty rate of 18.9%, comprising of 25 families. On the other hand, families with 3 or 4 children have the lowest poverty rate of 0.0%, which includes 0 families.
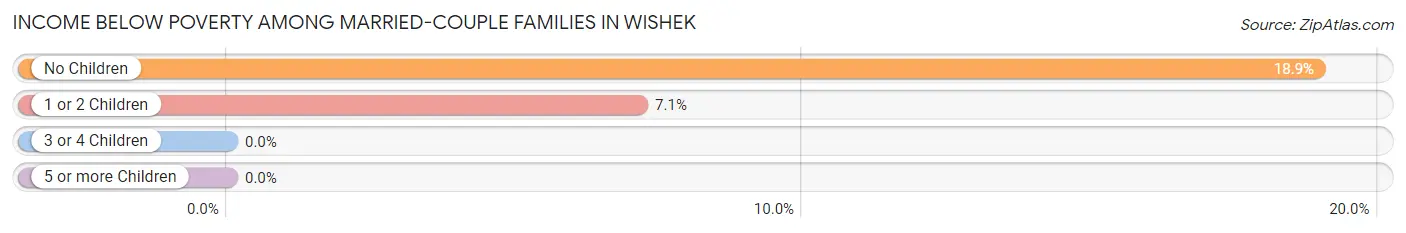
| Children | Above Poverty | Below Poverty |
| No Children | 107 (81.1%) | 25 (18.9%) |
| 1 or 2 Children | 39 (92.9%) | 3 (7.1%) |
| 3 or 4 Children | 38 (100.0%) | 0 (0.0%) |
| 5 or more Children | 0 (0.0%) | 0 (0.0%) |
| Total | 184 (86.8%) | 28 (13.2%) |
Income Below Poverty Among Single-Parent Households in Wishek
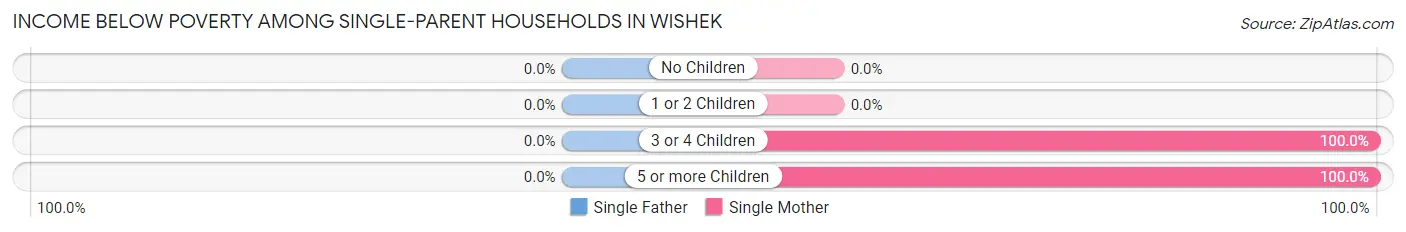
| Children | Single Father | Single Mother |
| No Children | 0 (0.0%) | 0 (0.0%) |
| 1 or 2 Children | 0 (0.0%) | 0 (0.0%) |
| 3 or 4 Children | 0 (0.0%) | 6 (100.0%) |
| 5 or more Children | 0 (0.0%) | 4 (100.0%) |
| Total | 0 (0.0%) | 10 (45.5%) |
Income Below Poverty Among Married-Couple vs Single-Parent Households in Wishek
The poverty data for Wishek shows that 28 of the married-couple family households (13.2%) and 10 of the single-parent households (41.7%) are living below the poverty level. Within the married-couple family households, those with no children have the highest poverty rate, with 25 households (18.9%) falling below the poverty line. Among the single-parent households, those with 3 or 4 children have the highest poverty rate, with 6 household (100.0%) living below poverty.
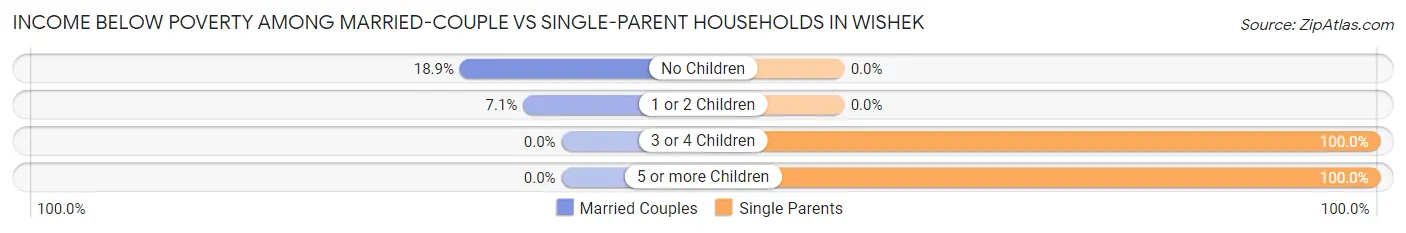
| Children | Married-Couple Families | Single-Parent Households |
| No Children | 25 (18.9%) | 0 (0.0%) |
| 1 or 2 Children | 3 (7.1%) | 0 (0.0%) |
| 3 or 4 Children | 0 (0.0%) | 6 (100.0%) |
| 5 or more Children | 0 (0.0%) | 4 (100.0%) |
| Total | 28 (13.2%) | 10 (41.7%) |
Race in Wishek
The most populous races in Wishek are White / Caucasian (856 | 90.0%), Some other Race (59 | 6.2%), and Hispanic or Latino (54 | 5.7%).
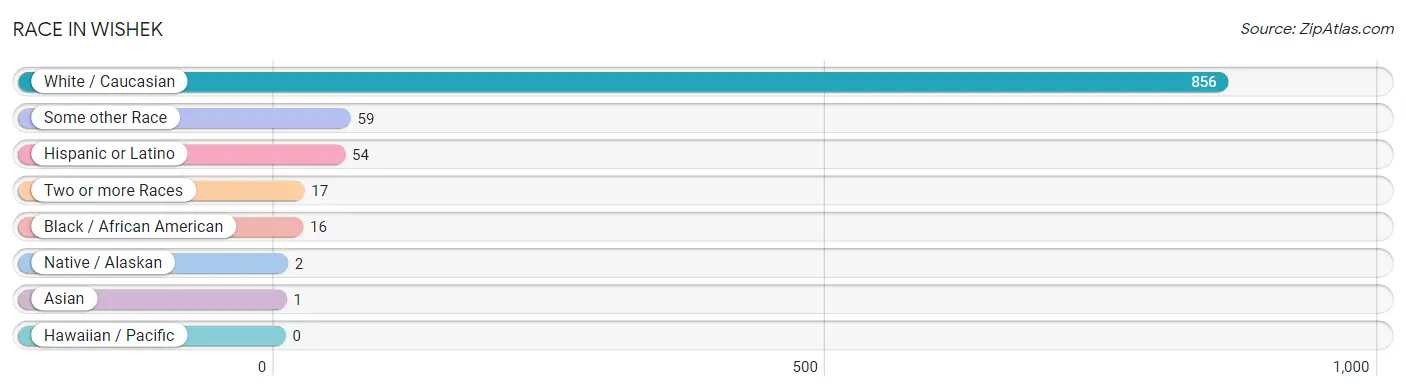
| Race | # Population | % Population |
| Asian | 1 | 0.1% |
| Black / African American | 16 | 1.7% |
| Hawaiian / Pacific | 0 | 0.0% |
| Hispanic or Latino | 54 | 5.7% |
| Native / Alaskan | 2 | 0.2% |
| White / Caucasian | 856 | 90.0% |
| Two or more Races | 17 | 1.8% |
| Some other Race | 59 | 6.2% |
| Total | 951 | 100.0% |
Ancestry in Wishek
The most populous ancestries reported in Wishek are German (595 | 62.6%), Russian (176 | 18.5%), Mexican (52 | 5.5%), German Russian (43 | 4.5%), and Polish (31 | 3.3%), together accounting for 94.3% of all Wishek residents.
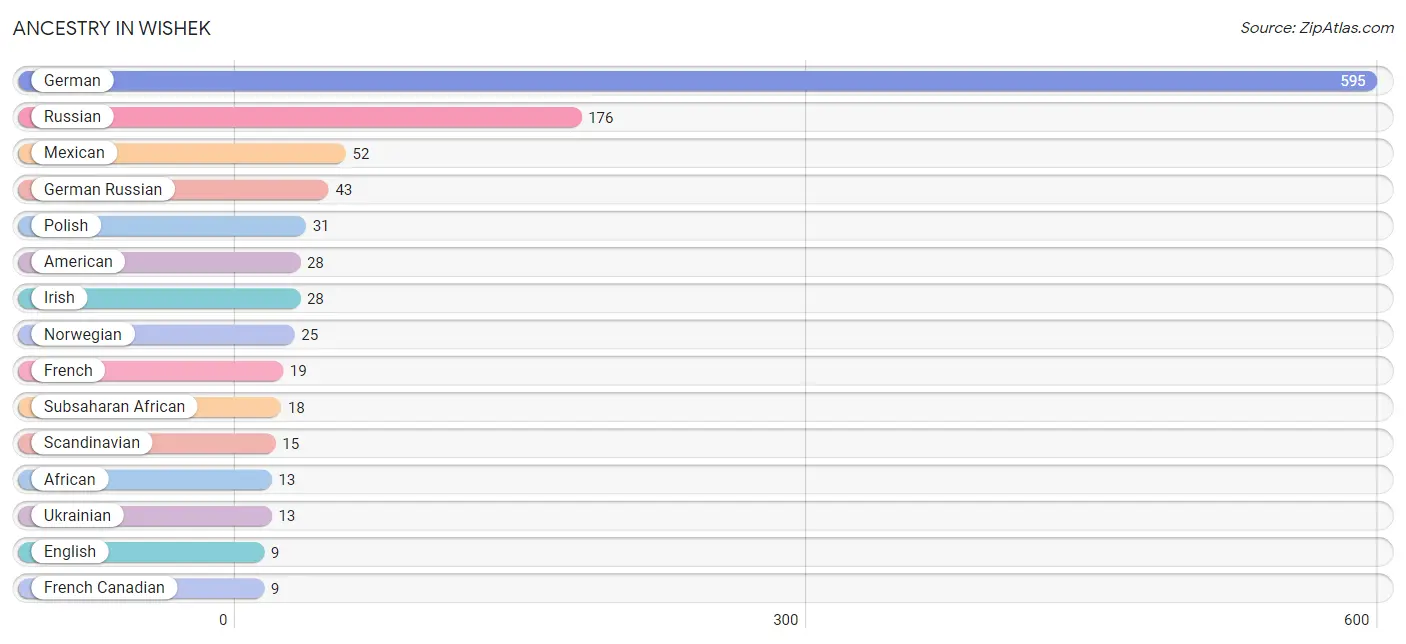
| Ancestry | # Population | % Population |
| African | 13 | 1.4% |
| American | 28 | 2.9% |
| Blackfeet | 4 | 0.4% |
| Chippewa | 4 | 0.4% |
| Czech | 2 | 0.2% |
| English | 9 | 0.9% |
| European | 2 | 0.2% |
| French | 19 | 2.0% |
| French Canadian | 9 | 0.9% |
| German | 595 | 62.6% |
| German Russian | 43 | 4.5% |
| Hungarian | 6 | 0.6% |
| Irish | 28 | 2.9% |
| Korean | 2 | 0.2% |
| Mexican | 52 | 5.5% |
| Norwegian | 25 | 2.6% |
| Polish | 31 | 3.3% |
| Puerto Rican | 2 | 0.2% |
| Russian | 176 | 18.5% |
| Scandinavian | 15 | 1.6% |
| Scotch-Irish | 2 | 0.2% |
| Scottish | 6 | 0.6% |
| Sioux | 2 | 0.2% |
| Subsaharan African | 18 | 1.9% |
| Swedish | 2 | 0.2% |
| Ukrainian | 13 | 1.4% | View All 26 Rows |
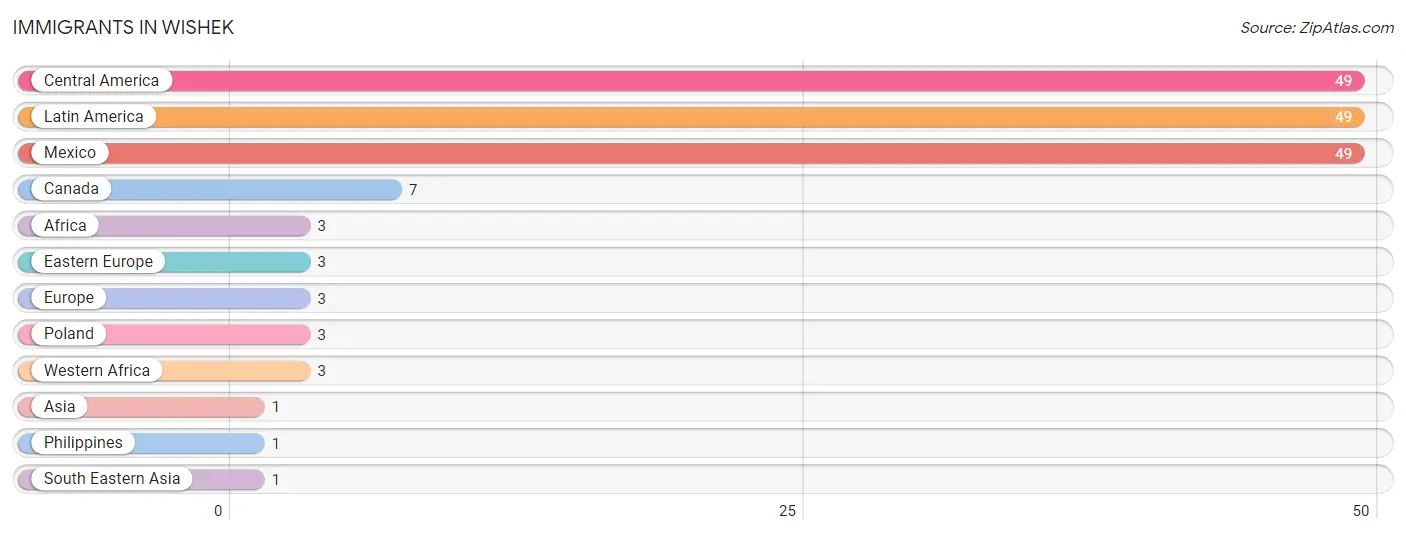
Immigrants in Wishek
The most numerous immigrant groups reported in Wishek came from Central America (49 | 5.1%), Latin America (49 | 5.1%), Mexico (49 | 5.1%), Canada (7 | 0.7%), and Africa (3 | 0.3%), together accounting for 16.5% of all Wishek residents.
| Immigration Origin | # Population | % Population |
| Africa | 3 | 0.3% |
| Asia | 1 | 0.1% |
| Canada | 7 | 0.7% |
| Central America | 49 | 5.1% |
| Eastern Europe | 3 | 0.3% |
| Europe | 3 | 0.3% |
| Latin America | 49 | 5.1% |
| Mexico | 49 | 5.1% |
| Philippines | 1 | 0.1% |
| Poland | 3 | 0.3% |
| South Eastern Asia | 1 | 0.1% |
| Western Africa | 3 | 0.3% | View All 12 Rows |
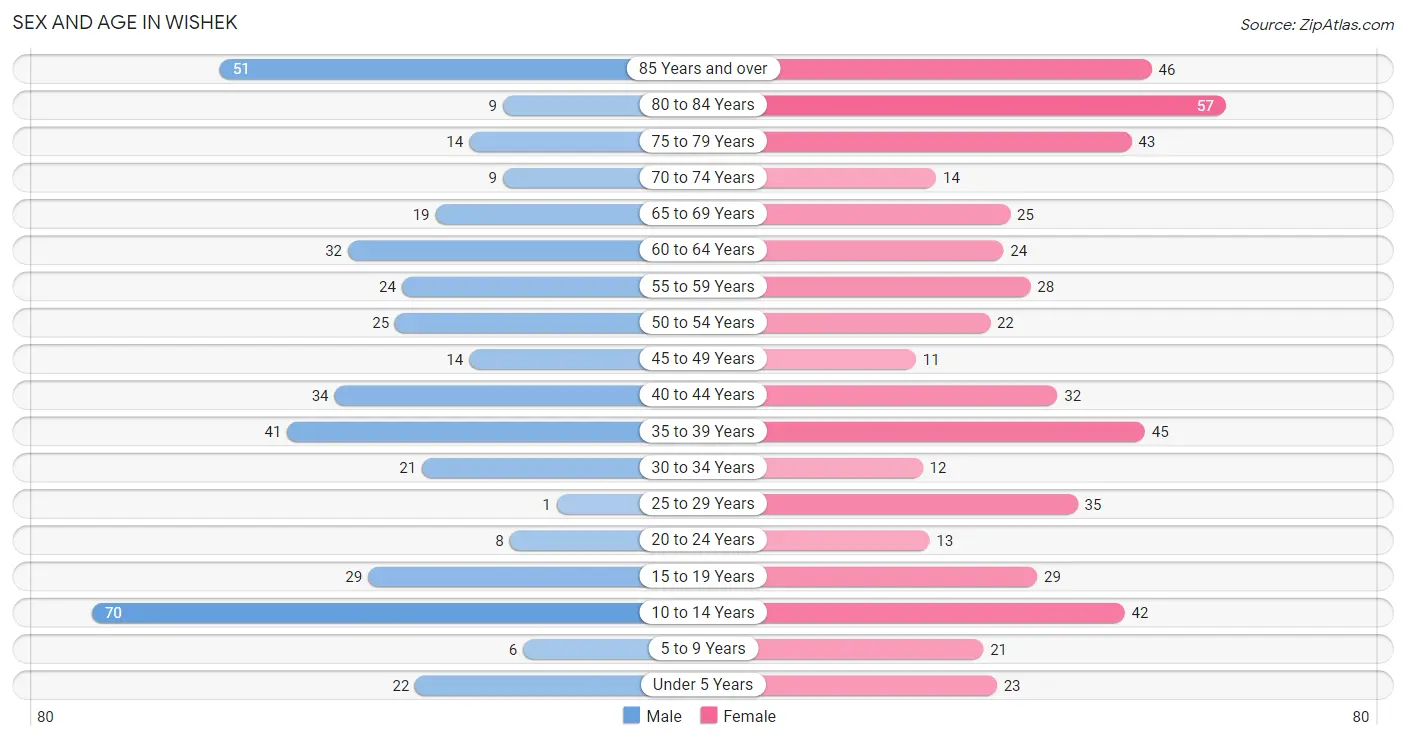
Sex and Age in Wishek
Sex and Age in Wishek
The most populous age groups in Wishek are 10 to 14 Years (70 | 16.3%) for men and 80 to 84 Years (57 | 10.9%) for women.
| Age Bracket | Male | Female |
| Under 5 Years | 22 (5.1%) | 23 (4.4%) |
| 5 to 9 Years | 6 (1.4%) | 21 (4.0%) |
| 10 to 14 Years | 70 (16.3%) | 42 (8.1%) |
| 15 to 19 Years | 29 (6.8%) | 29 (5.6%) |
| 20 to 24 Years | 8 (1.9%) | 13 (2.5%) |
| 25 to 29 Years | 1 (0.2%) | 35 (6.7%) |
| 30 to 34 Years | 21 (4.9%) | 12 (2.3%) |
| 35 to 39 Years | 41 (9.6%) | 45 (8.6%) |
| 40 to 44 Years | 34 (7.9%) | 32 (6.1%) |
| 45 to 49 Years | 14 (3.3%) | 11 (2.1%) |
| 50 to 54 Years | 25 (5.8%) | 22 (4.2%) |
| 55 to 59 Years | 24 (5.6%) | 28 (5.4%) |
| 60 to 64 Years | 32 (7.5%) | 24 (4.6%) |
| 65 to 69 Years | 19 (4.4%) | 25 (4.8%) |
| 70 to 74 Years | 9 (2.1%) | 14 (2.7%) |
| 75 to 79 Years | 14 (3.3%) | 43 (8.2%) |
| 80 to 84 Years | 9 (2.1%) | 57 (10.9%) |
| 85 Years and over | 51 (11.9%) | 46 (8.8%) |
| Total | 429 (100.0%) | 522 (100.0%) |
Families and Households in Wishek
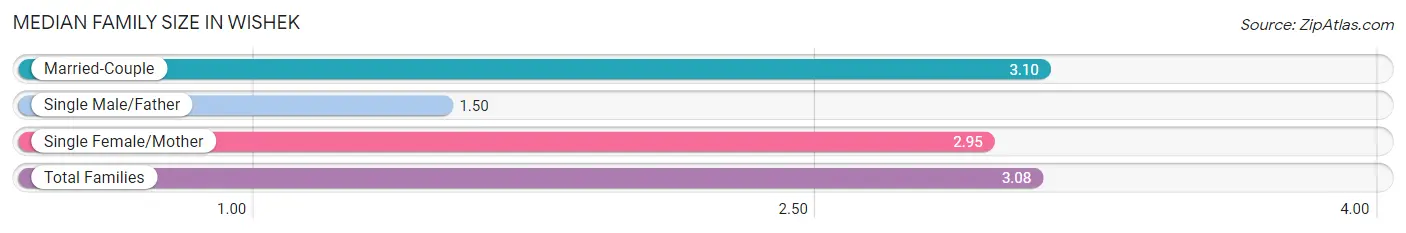
Median Family Size in Wishek
The median family size in Wishek is 3.08 persons per family, with married-couple families (212 | 89.8%) accounting for the largest median family size of 3.1 persons per family. On the other hand, single male/father families (2 | 0.9%) represent the smallest median family size with 1.50 persons per family.
| Family Type | # Families | Family Size |
| Married-Couple | 212 (89.8%) | 3.10 |
| Single Male/Father | 2 (0.9%) | 1.50 |
| Single Female/Mother | 22 (9.3%) | 2.95 |
| Total Families | 236 (100.0%) | 3.08 |
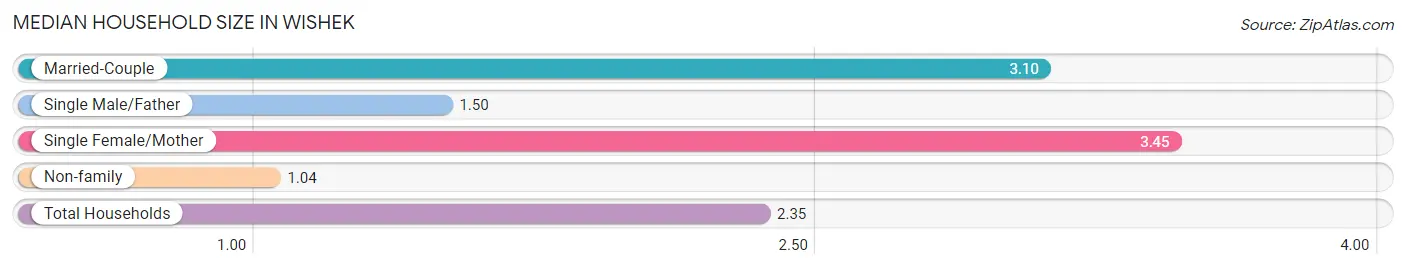
Median Household Size in Wishek
The median household size in Wishek is 2.35 persons per household, with single female/mother households (22 | 5.9%) accounting for the largest median household size of 3.45 persons per household. non-family households (139 | 37.1%) represent the smallest median household size with 1.04 persons per household.
| Household Type | # Households | Household Size |
| Married-Couple | 212 (56.5%) | 3.10 |
| Single Male/Father | 2 (0.5%) | 1.50 |
| Single Female/Mother | 22 (5.9%) | 3.45 |
| Non-family | 139 (37.1%) | 1.04 |
| Total Households | 375 (100.0%) | 2.35 |
Household Size by Marriage Status in Wishek
Out of a total of 375 households in Wishek, 236 (62.9%) are family households, while 139 (37.1%) are nonfamily households. The most numerous type of family households are 2-person households, comprising 133, and the most common type of nonfamily households are 1-person households, comprising 130.
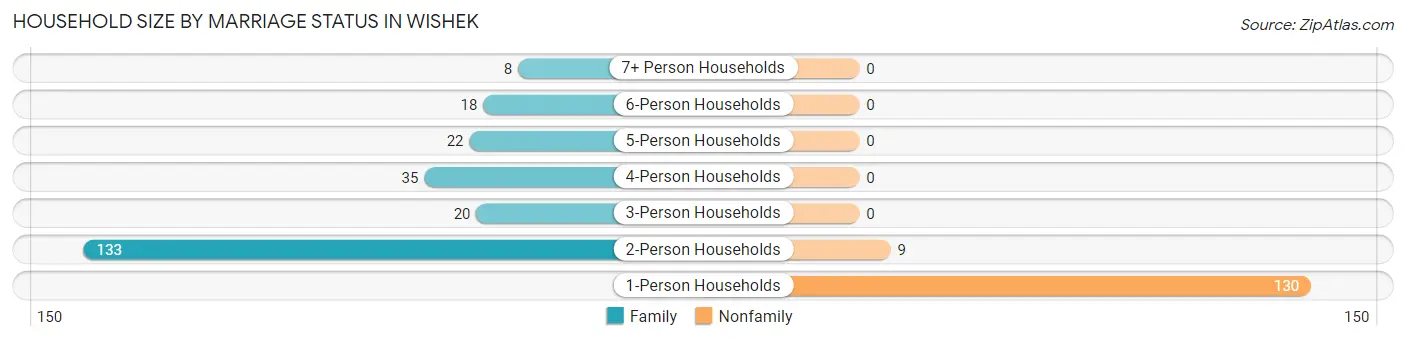
| Household Size | Family Households | Nonfamily Households |
| 1-Person Households | - | 130 (34.7%) |
| 2-Person Households | 133 (35.5%) | 9 (2.4%) |
| 3-Person Households | 20 (5.3%) | 0 (0.0%) |
| 4-Person Households | 35 (9.3%) | 0 (0.0%) |
| 5-Person Households | 22 (5.9%) | 0 (0.0%) |
| 6-Person Households | 18 (4.8%) | 0 (0.0%) |
| 7+ Person Households | 8 (2.1%) | 0 (0.0%) |
| Total | 236 (62.9%) | 139 (37.1%) |
Female Fertility in Wishek
Fertility by Age in Wishek
Average fertility rate in Wishek is 16.0 births per 1,000 women. Women in the age bracket of 35 to 50 years have the highest fertility rate with 31.0 births per 1,000 women. Women in the age bracket of 35 to 50 years acount for 100.0% of all women with births.
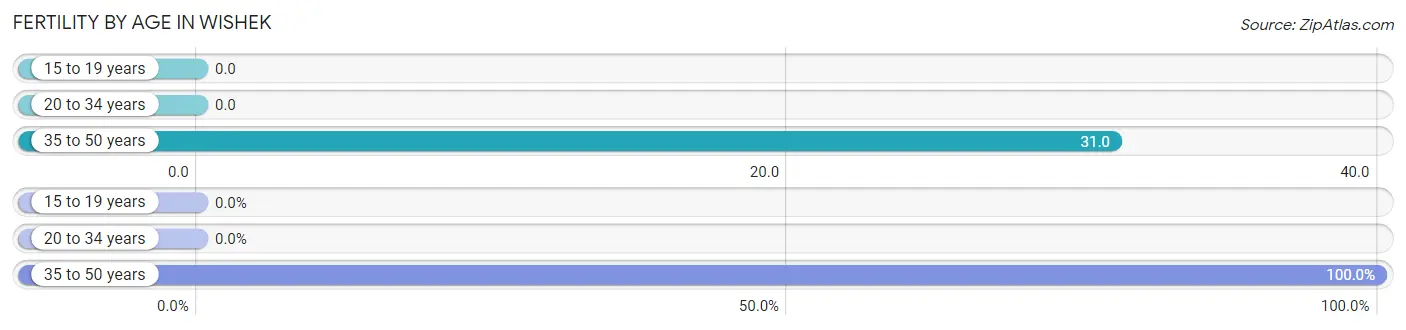
| Age Bracket | Women with Births | Births / 1,000 Women |
| 15 to 19 years | 0 (0.0%) | 0.0 |
| 20 to 34 years | 0 (0.0%) | 0.0 |
| 35 to 50 years | 3 (100.0%) | 31.0 |
| Total | 3 (100.0%) | 16.0 |
Fertility by Age by Marriage Status in Wishek
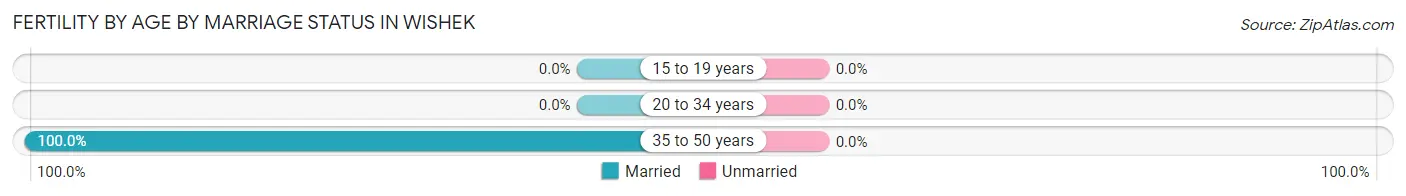
| Age Bracket | Married | Unmarried |
| 15 to 19 years | 0 (0.0%) | 0 (0.0%) |
| 20 to 34 years | 0 (0.0%) | 0 (0.0%) |
| 35 to 50 years | 3 (100.0%) | 0 (0.0%) |
| Total | 3 (100.0%) | 0 (0.0%) |
Fertility by Education in Wishek
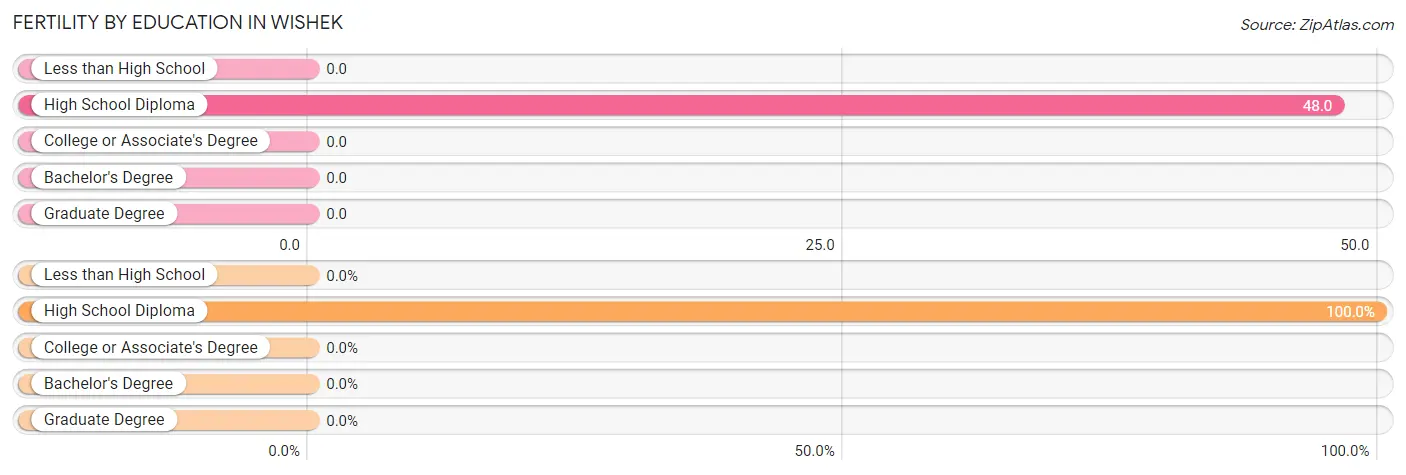
| Educational Attainment | Women with Births | Births / 1,000 Women |
| Less than High School | 0 (0.0%) | 0.0 |
| High School Diploma | 3 (100.0%) | 48.0 |
| College or Associate's Degree | 0 (0.0%) | 0.0 |
| Bachelor's Degree | 0 (0.0%) | 0.0 |
| Graduate Degree | 0 (0.0%) | 0.0 |
| Total | 3 (100.0%) | 16.0 |
Fertility by Education by Marriage Status in Wishek
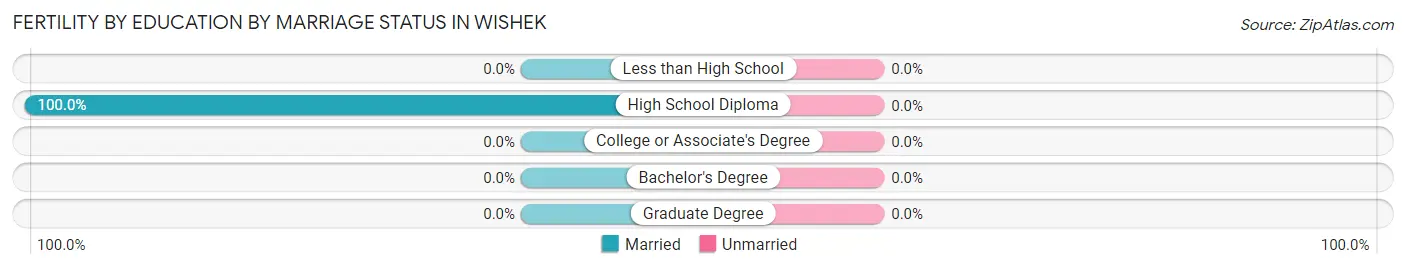
| Educational Attainment | Married | Unmarried |
| Less than High School | 0 (0.0%) | 0 (0.0%) |
| High School Diploma | 3 (100.0%) | 0 (0.0%) |
| College or Associate's Degree | 0 (0.0%) | 0 (0.0%) |
| Bachelor's Degree | 0 (0.0%) | 0 (0.0%) |
| Graduate Degree | 0 (0.0%) | 0 (0.0%) |
| Total | 3 (100.0%) | 0 (0.0%) |
Employment Characteristics in Wishek
Employment by Class of Employer in Wishek
Among the 443 employed individuals in Wishek, private company employees (207 | 46.7%), local government employees (78 | 17.6%), and not-for-profit organizations (66 | 14.9%) make up the most common classes of employment.
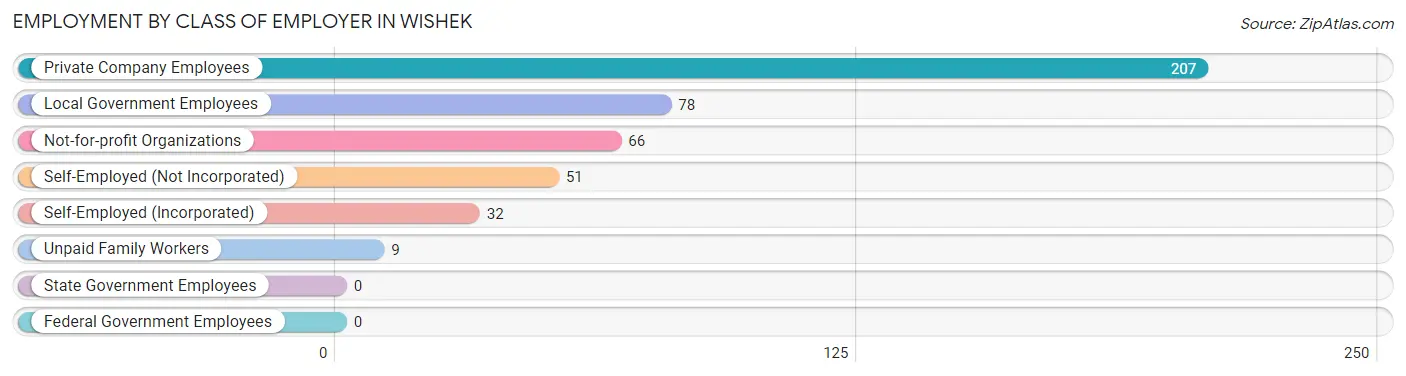
| Employer Class | # Employees | % Employees |
| Private Company Employees | 207 | 46.7% |
| Self-Employed (Incorporated) | 32 | 7.2% |
| Self-Employed (Not Incorporated) | 51 | 11.5% |
| Not-for-profit Organizations | 66 | 14.9% |
| Local Government Employees | 78 | 17.6% |
| State Government Employees | 0 | 0.0% |
| Federal Government Employees | 0 | 0.0% |
| Unpaid Family Workers | 9 | 2.0% |
| Total | 443 | 100.0% |
Employment Status by Age in Wishek
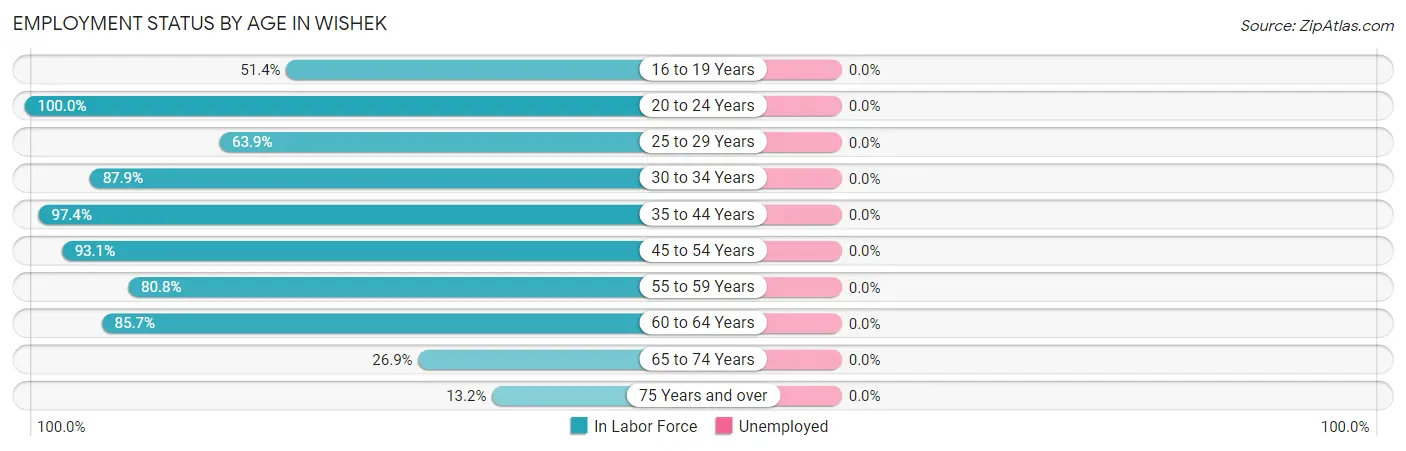
| Age Bracket | In Labor Force | Unemployed |
| 16 to 19 Years | 18 (51.4%) | 0 (0.0%) |
| 20 to 24 Years | 21 (100.0%) | 0 (0.0%) |
| 25 to 29 Years | 23 (63.9%) | 0 (0.0%) |
| 30 to 34 Years | 29 (87.9%) | 0 (0.0%) |
| 35 to 44 Years | 148 (97.4%) | 0 (0.0%) |
| 45 to 54 Years | 67 (93.1%) | 0 (0.0%) |
| 55 to 59 Years | 42 (80.8%) | 0 (0.0%) |
| 60 to 64 Years | 48 (85.7%) | 0 (0.0%) |
| 65 to 74 Years | 18 (26.9%) | 0 (0.0%) |
| 75 Years and over | 29 (13.2%) | 0 (0.0%) |
| Total | 443 (59.5%) | 0 (0.0%) |
Employment Status by Educational Attainment in Wishek
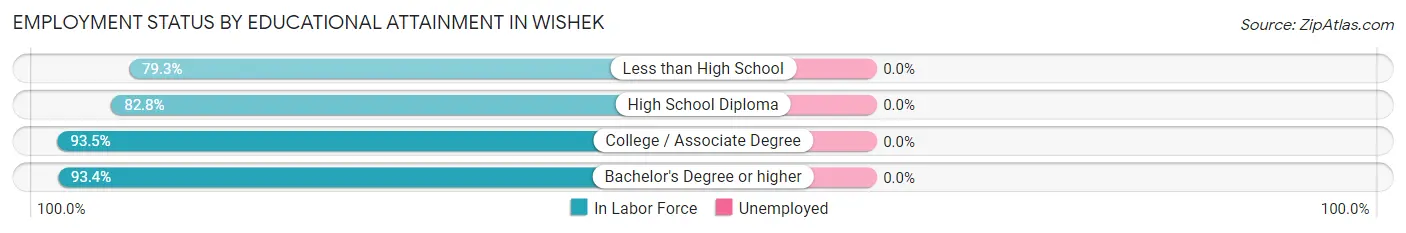
| Educational Attainment | In Labor Force | Unemployed |
| Less than High School | 23 (79.3%) | 0 (0.0%) |
| High School Diploma | 106 (82.8%) | 0 (0.0%) |
| College / Associate Degree | 129 (93.5%) | 0 (0.0%) |
| Bachelor's Degree or higher | 99 (93.4%) | 0 (0.0%) |
| Total | 357 (89.0%) | 0 (0.0%) |
Employment Occupations by Sex in Wishek
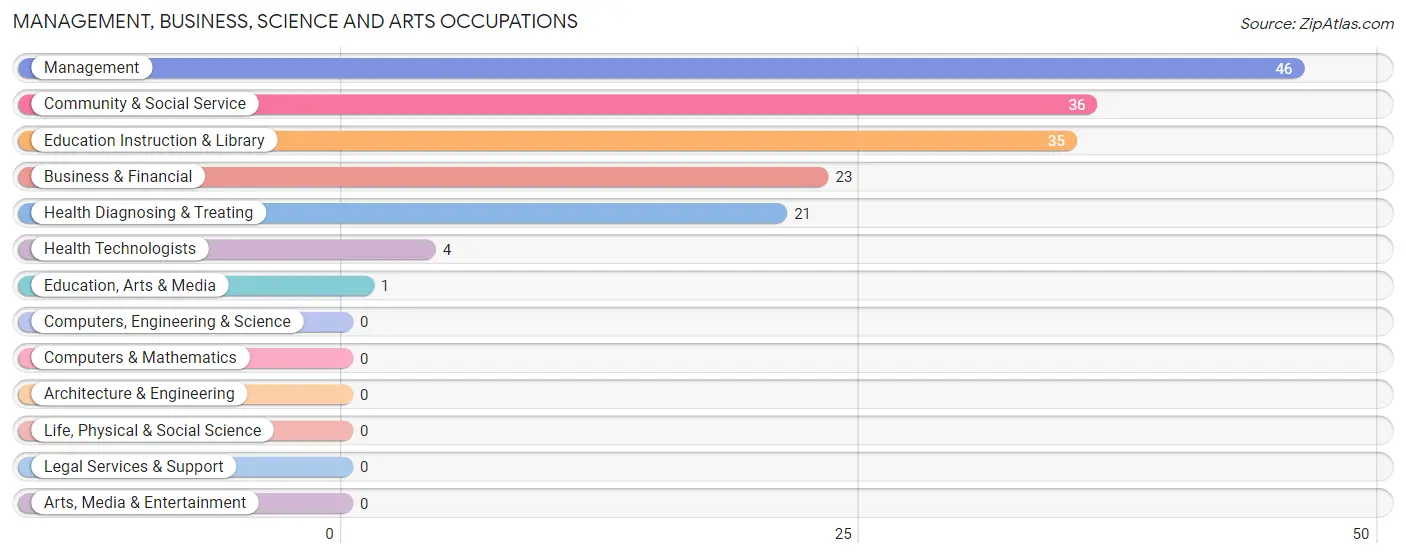
Management, Business, Science and Arts Occupations
The most common Management, Business, Science and Arts occupations in Wishek are Management (46 | 10.4%), Community & Social Service (36 | 8.1%), Education Instruction & Library (35 | 7.9%), Business & Financial (23 | 5.2%), and Health Diagnosing & Treating (21 | 4.7%).
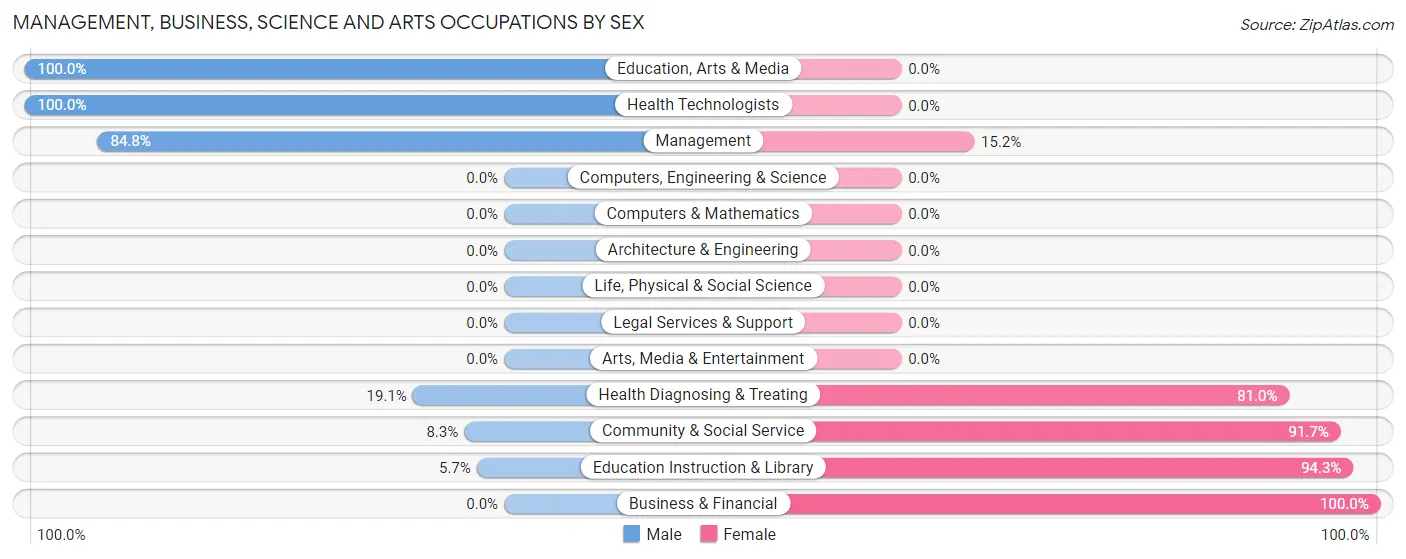
Management, Business, Science and Arts Occupations by Sex
Within the Management, Business, Science and Arts occupations in Wishek, the most male-oriented occupations are Education, Arts & Media (100.0%), Health Technologists (100.0%), and Management (84.8%), while the most female-oriented occupations are Business & Financial (100.0%), Education Instruction & Library (94.3%), and Community & Social Service (91.7%).
| Occupation | Male | Female |
| Management | 39 (84.8%) | 7 (15.2%) |
| Business & Financial | 0 (0.0%) | 23 (100.0%) |
| Computers, Engineering & Science | 0 (0.0%) | 0 (0.0%) |
| Computers & Mathematics | 0 (0.0%) | 0 (0.0%) |
| Architecture & Engineering | 0 (0.0%) | 0 (0.0%) |
| Life, Physical & Social Science | 0 (0.0%) | 0 (0.0%) |
| Community & Social Service | 3 (8.3%) | 33 (91.7%) |
| Education, Arts & Media | 1 (100.0%) | 0 (0.0%) |
| Legal Services & Support | 0 (0.0%) | 0 (0.0%) |
| Education Instruction & Library | 2 (5.7%) | 33 (94.3%) |
| Arts, Media & Entertainment | 0 (0.0%) | 0 (0.0%) |
| Health Diagnosing & Treating | 4 (19.1%) | 17 (80.9%) |
| Health Technologists | 4 (100.0%) | 0 (0.0%) |
| Total (Category) | 46 (36.5%) | 80 (63.5%) |
| Total (Overall) | 224 (50.6%) | 219 (49.4%) |
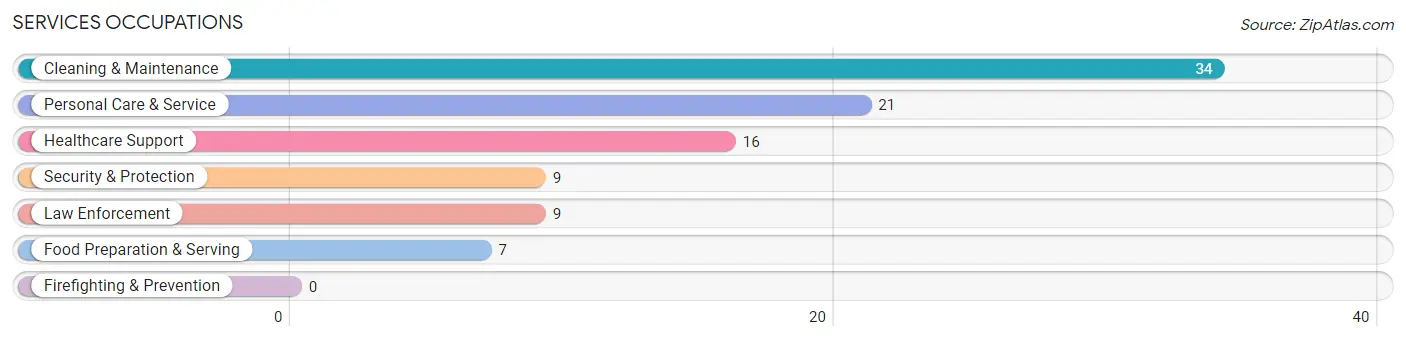
Services Occupations
The most common Services occupations in Wishek are Cleaning & Maintenance (34 | 7.7%), Personal Care & Service (21 | 4.7%), Healthcare Support (16 | 3.6%), Security & Protection (9 | 2.0%), and Law Enforcement (9 | 2.0%).
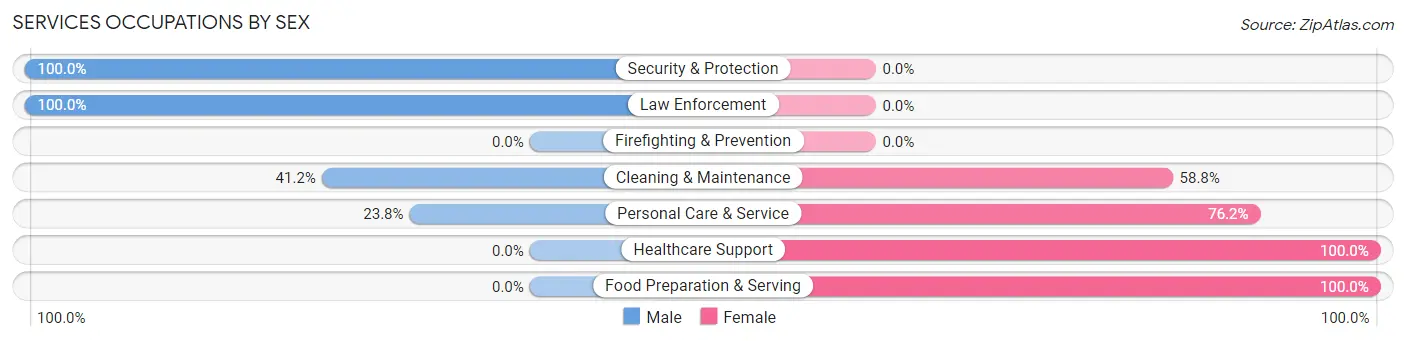
Services Occupations by Sex
Within the Services occupations in Wishek, the most male-oriented occupations are Security & Protection (100.0%), Law Enforcement (100.0%), and Cleaning & Maintenance (41.2%), while the most female-oriented occupations are Healthcare Support (100.0%), Food Preparation & Serving (100.0%), and Personal Care & Service (76.2%).
| Occupation | Male | Female |
| Healthcare Support | 0 (0.0%) | 16 (100.0%) |
| Security & Protection | 9 (100.0%) | 0 (0.0%) |
| Firefighting & Prevention | 0 (0.0%) | 0 (0.0%) |
| Law Enforcement | 9 (100.0%) | 0 (0.0%) |
| Food Preparation & Serving | 0 (0.0%) | 7 (100.0%) |
| Cleaning & Maintenance | 14 (41.2%) | 20 (58.8%) |
| Personal Care & Service | 5 (23.8%) | 16 (76.2%) |
| Total (Category) | 28 (32.2%) | 59 (67.8%) |
| Total (Overall) | 224 (50.6%) | 219 (49.4%) |
Sales and Office Occupations
The most common Sales and Office occupations in Wishek are Office & Administration (49 | 11.1%), and Sales & Related (24 | 5.4%).
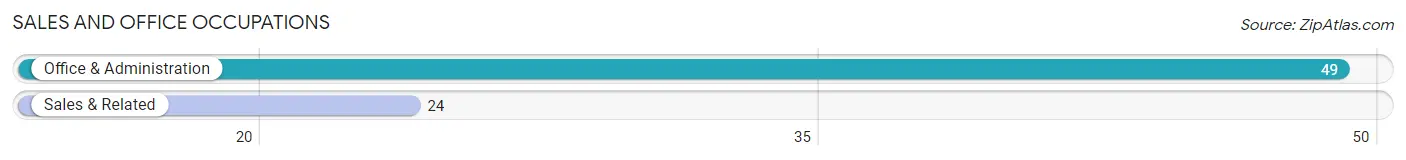
Sales and Office Occupations by Sex
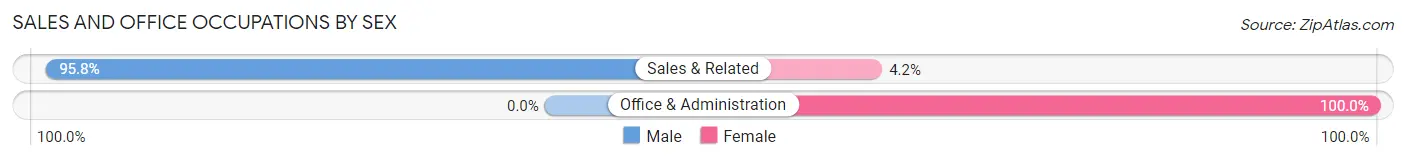
| Occupation | Male | Female |
| Sales & Related | 23 (95.8%) | 1 (4.2%) |
| Office & Administration | 0 (0.0%) | 49 (100.0%) |
| Total (Category) | 23 (31.5%) | 50 (68.5%) |
| Total (Overall) | 224 (50.6%) | 219 (49.4%) |
Natural Resources, Construction and Maintenance Occupations
The most common Natural Resources, Construction and Maintenance occupations in Wishek are Farming, Fishing & Forestry (44 | 9.9%), Construction & Extraction (29 | 6.6%), and Installation, Maintenance & Repair (20 | 4.5%).
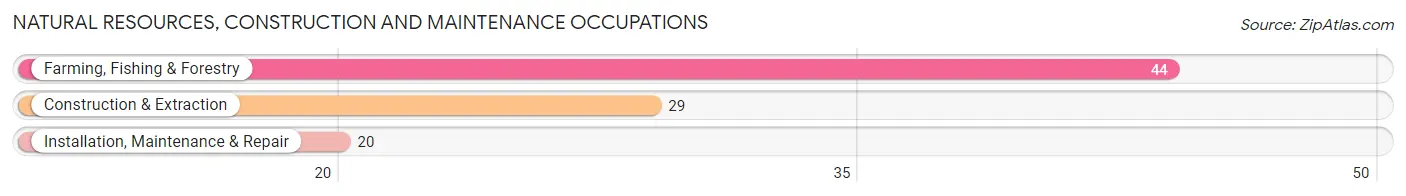
Natural Resources, Construction and Maintenance Occupations by Sex
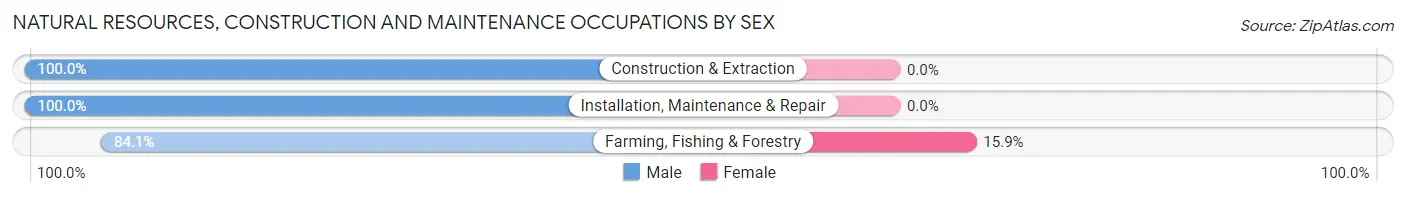
| Occupation | Male | Female |
| Farming, Fishing & Forestry | 37 (84.1%) | 7 (15.9%) |
| Construction & Extraction | 29 (100.0%) | 0 (0.0%) |
| Installation, Maintenance & Repair | 20 (100.0%) | 0 (0.0%) |
| Total (Category) | 86 (92.5%) | 7 (7.5%) |
| Total (Overall) | 224 (50.6%) | 219 (49.4%) |
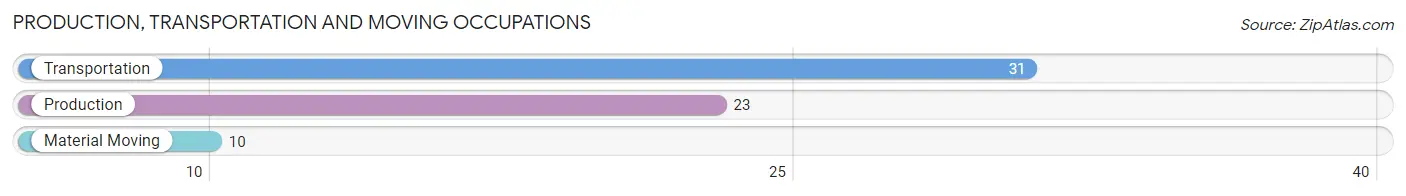
Production, Transportation and Moving Occupations
The most common Production, Transportation and Moving occupations in Wishek are Transportation (31 | 7.0%), Production (23 | 5.2%), and Material Moving (10 | 2.3%).
Production, Transportation and Moving Occupations by Sex
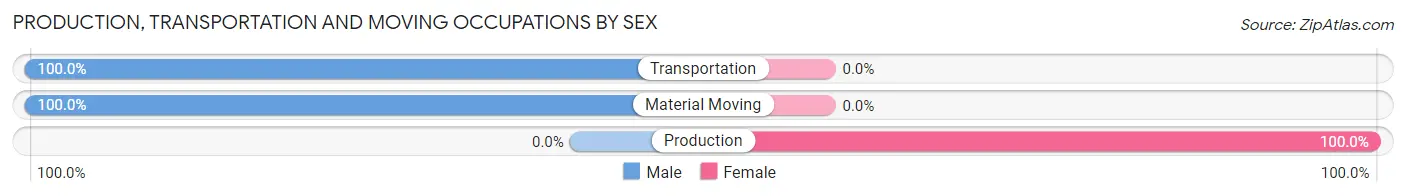
| Occupation | Male | Female |
| Production | 0 (0.0%) | 23 (100.0%) |
| Transportation | 31 (100.0%) | 0 (0.0%) |
| Material Moving | 10 (100.0%) | 0 (0.0%) |
| Total (Category) | 41 (64.1%) | 23 (35.9%) |
| Total (Overall) | 224 (50.6%) | 219 (49.4%) |
Employment Industries by Sex in Wishek
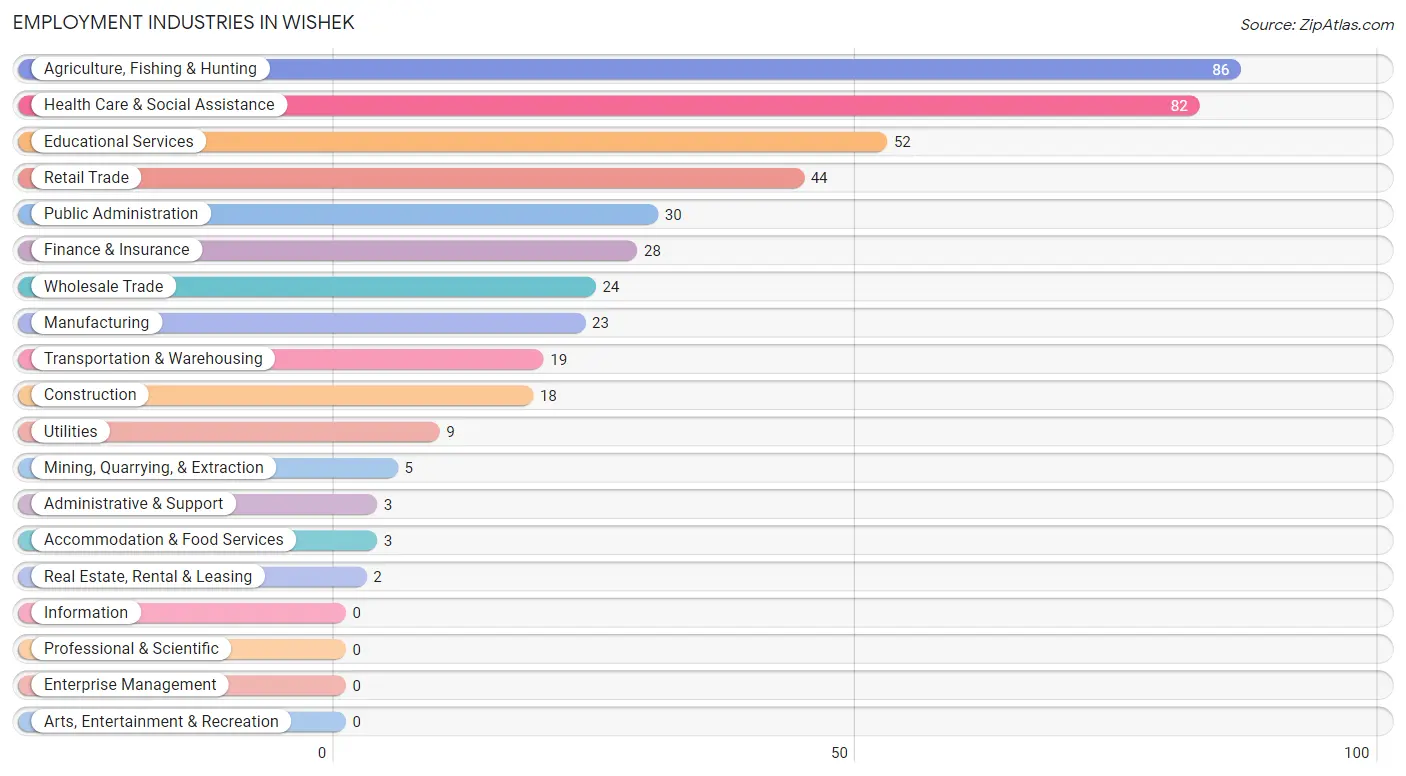
Employment Industries in Wishek
The major employment industries in Wishek include Agriculture, Fishing & Hunting (86 | 19.4%), Health Care & Social Assistance (82 | 18.5%), Educational Services (52 | 11.7%), Retail Trade (44 | 9.9%), and Public Administration (30 | 6.8%).
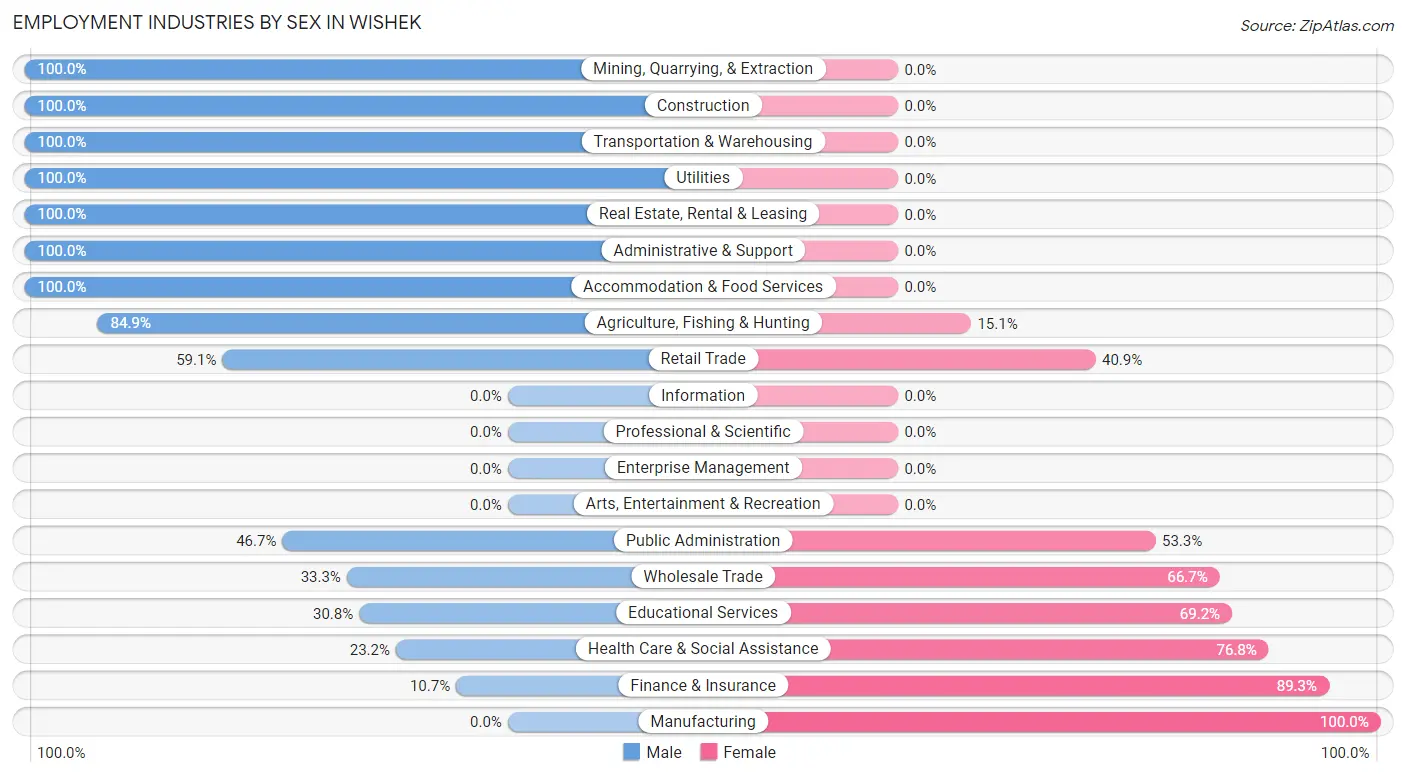
Employment Industries by Sex in Wishek
The Wishek industries that see more men than women are Mining, Quarrying, & Extraction (100.0%), Construction (100.0%), and Transportation & Warehousing (100.0%), whereas the industries that tend to have a higher number of women are Manufacturing (100.0%), Finance & Insurance (89.3%), and Health Care & Social Assistance (76.8%).
| Industry | Male | Female |
| Agriculture, Fishing & Hunting | 73 (84.9%) | 13 (15.1%) |
| Mining, Quarrying, & Extraction | 5 (100.0%) | 0 (0.0%) |
| Construction | 18 (100.0%) | 0 (0.0%) |
| Manufacturing | 0 (0.0%) | 23 (100.0%) |
| Wholesale Trade | 8 (33.3%) | 16 (66.7%) |
| Retail Trade | 26 (59.1%) | 18 (40.9%) |
| Transportation & Warehousing | 19 (100.0%) | 0 (0.0%) |
| Utilities | 9 (100.0%) | 0 (0.0%) |
| Information | 0 (0.0%) | 0 (0.0%) |
| Finance & Insurance | 3 (10.7%) | 25 (89.3%) |
| Real Estate, Rental & Leasing | 2 (100.0%) | 0 (0.0%) |
| Professional & Scientific | 0 (0.0%) | 0 (0.0%) |
| Enterprise Management | 0 (0.0%) | 0 (0.0%) |
| Administrative & Support | 3 (100.0%) | 0 (0.0%) |
| Educational Services | 16 (30.8%) | 36 (69.2%) |
| Health Care & Social Assistance | 19 (23.2%) | 63 (76.8%) |
| Arts, Entertainment & Recreation | 0 (0.0%) | 0 (0.0%) |
| Accommodation & Food Services | 3 (100.0%) | 0 (0.0%) |
| Public Administration | 14 (46.7%) | 16 (53.3%) |
| Total | 224 (50.6%) | 219 (49.4%) |
Education in Wishek
School Enrollment in Wishek
The most common levels of schooling among the 231 students in Wishek are middle school (100 | 43.3%), high school (62 | 26.8%), and elementary school (31 | 13.4%).
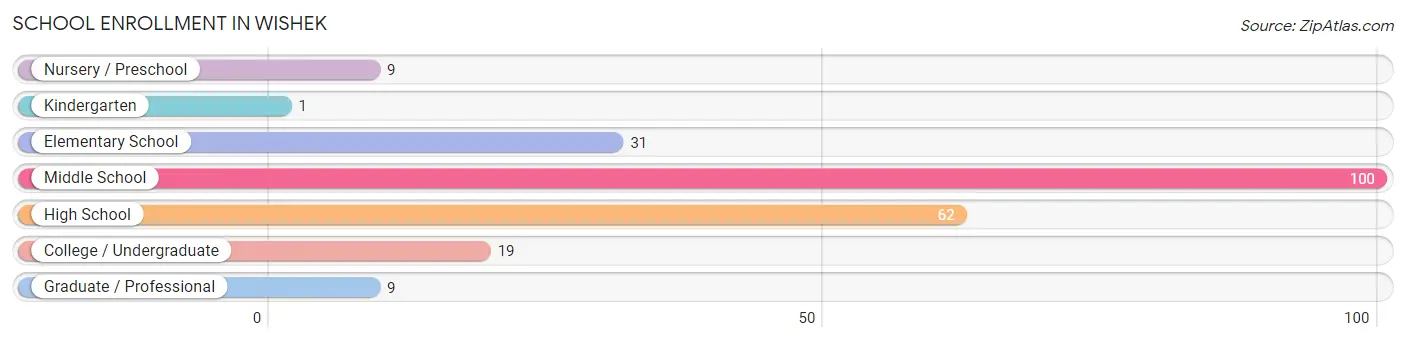
| School Level | # Students | % Students |
| Nursery / Preschool | 9 | 3.9% |
| Kindergarten | 1 | 0.4% |
| Elementary School | 31 | 13.4% |
| Middle School | 100 | 43.3% |
| High School | 62 | 26.8% |
| College / Undergraduate | 19 | 8.2% |
| Graduate / Professional | 9 | 3.9% |
| Total | 231 | 100.0% |
School Enrollment by Age by Funding Source in Wishek
Out of a total of 231 students who are enrolled in schools in Wishek, 3 (1.3%) attend a private institution, while the remaining 228 (98.7%) are enrolled in public schools. The age group of 35 years and over has the highest likelihood of being enrolled in private schools, with 3 (12.0% in the age bracket) enrolled. Conversely, the age group of 3 to 4 year olds has the lowest likelihood of being enrolled in a private school, with 6 (100.0% in the age bracket) attending a public institution.
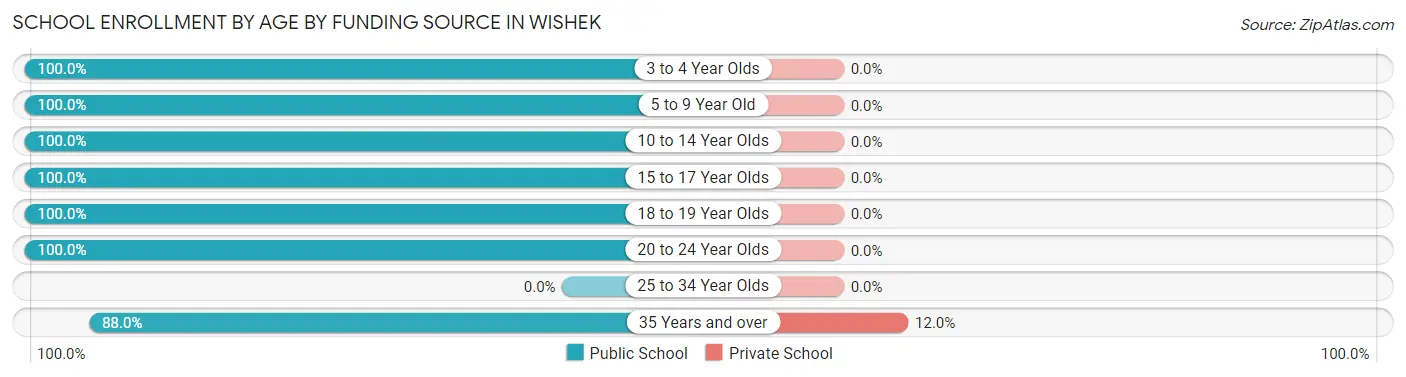
| Age Bracket | Public School | Private School |
| 3 to 4 Year Olds | 6 (100.0%) | 0 (0.0%) |
| 5 to 9 Year Old | 27 (100.0%) | 0 (0.0%) |
| 10 to 14 Year Olds | 112 (100.0%) | 0 (0.0%) |
| 15 to 17 Year Olds | 50 (100.0%) | 0 (0.0%) |
| 18 to 19 Year Olds | 8 (100.0%) | 0 (0.0%) |
| 20 to 24 Year Olds | 3 (100.0%) | 0 (0.0%) |
| 25 to 34 Year Olds | 0 (0.0%) | 0 (0.0%) |
| 35 Years and over | 22 (88.0%) | 3 (12.0%) |
| Total | 228 (98.7%) | 3 (1.3%) |
Educational Attainment by Field of Study in Wishek
Business (47 | 31.5%), education (43 | 28.9%), bio, nature & agricultural (21 | 14.1%), computers & mathematics (11 | 7.4%), and communications (5 | 3.4%) are the most common fields of study among 149 individuals in Wishek who have obtained a bachelor's degree or higher.
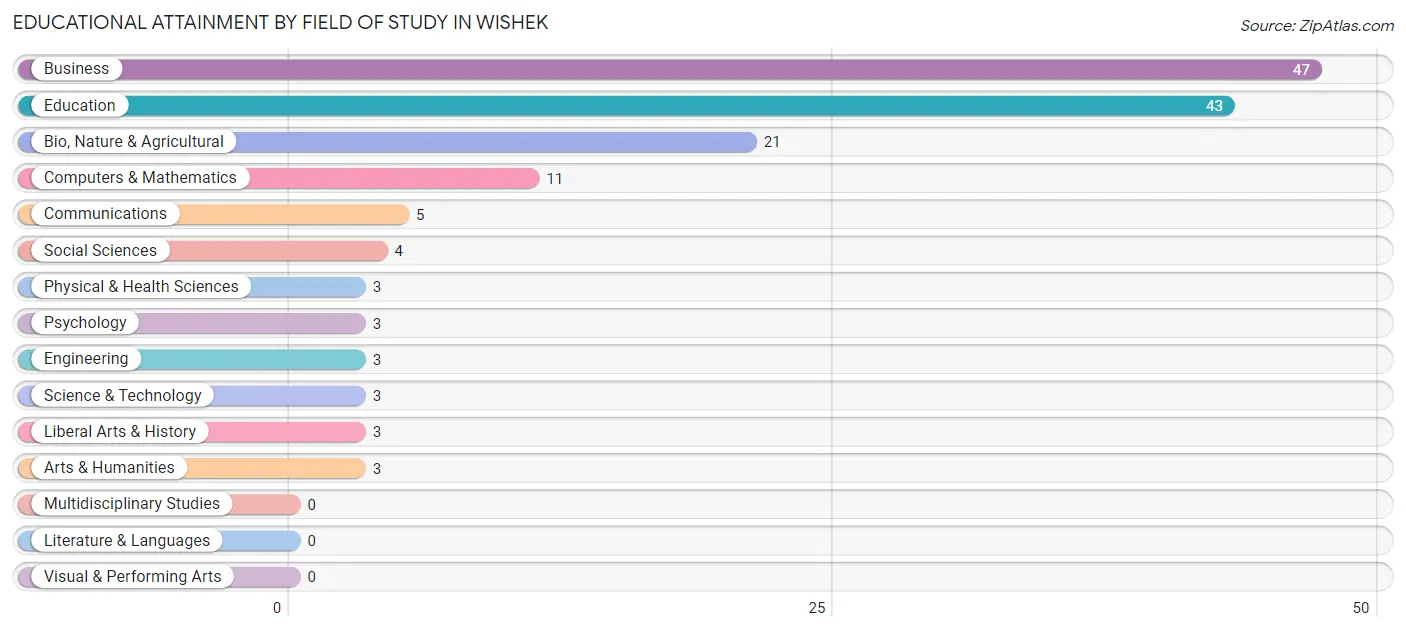
| Field of Study | # Graduates | % Graduates |
| Computers & Mathematics | 11 | 7.4% |
| Bio, Nature & Agricultural | 21 | 14.1% |
| Physical & Health Sciences | 3 | 2.0% |
| Psychology | 3 | 2.0% |
| Social Sciences | 4 | 2.7% |
| Engineering | 3 | 2.0% |
| Multidisciplinary Studies | 0 | 0.0% |
| Science & Technology | 3 | 2.0% |
| Business | 47 | 31.5% |
| Education | 43 | 28.9% |
| Literature & Languages | 0 | 0.0% |
| Liberal Arts & History | 3 | 2.0% |
| Visual & Performing Arts | 0 | 0.0% |
| Communications | 5 | 3.4% |
| Arts & Humanities | 3 | 2.0% |
| Total | 149 | 100.0% |
Transportation & Commute in Wishek
Vehicle Availability by Sex in Wishek
The most prevalent vehicle ownership categories in Wishek are males with 2 vehicles (98, accounting for 43.8%) and females with 2 vehicles (96, making up 44.8%).
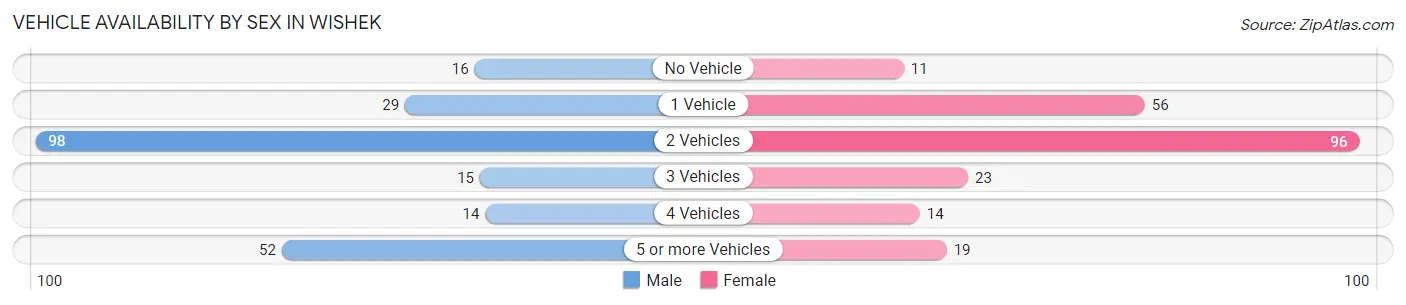
| Vehicles Available | Male | Female |
| No Vehicle | 16 (7.1%) | 11 (5.0%) |
| 1 Vehicle | 29 (13.0%) | 56 (25.6%) |
| 2 Vehicles | 98 (43.8%) | 96 (43.8%) |
| 3 Vehicles | 15 (6.7%) | 23 (10.5%) |
| 4 Vehicles | 14 (6.2%) | 14 (6.4%) |
| 5 or more Vehicles | 52 (23.2%) | 19 (8.7%) |
| Total | 224 (100.0%) | 219 (100.0%) |
Commute Time in Wishek
The most frequently occuring commute durations in Wishek are less than 5 minutes (176 commuters, 40.4%), 5 to 9 minutes (169 commuters, 38.8%), and 30 to 34 minutes (30 commuters, 6.9%).
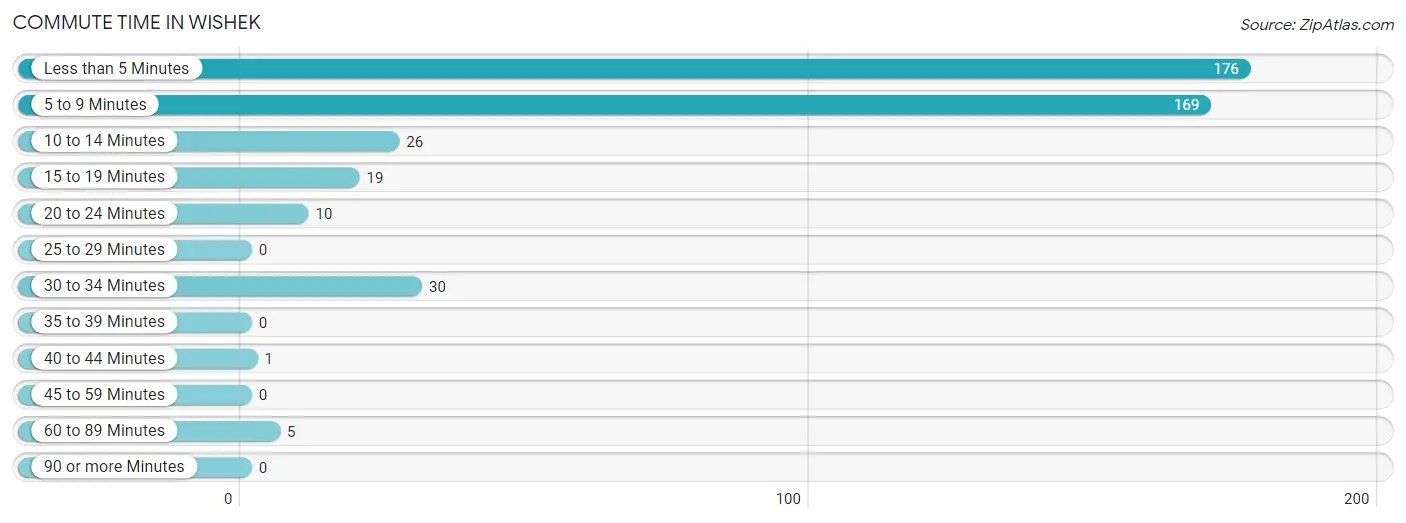
| Commute Time | # Commuters | % Commuters |
| Less than 5 Minutes | 176 | 40.4% |
| 5 to 9 Minutes | 169 | 38.8% |
| 10 to 14 Minutes | 26 | 6.0% |
| 15 to 19 Minutes | 19 | 4.4% |
| 20 to 24 Minutes | 10 | 2.3% |
| 25 to 29 Minutes | 0 | 0.0% |
| 30 to 34 Minutes | 30 | 6.9% |
| 35 to 39 Minutes | 0 | 0.0% |
| 40 to 44 Minutes | 1 | 0.2% |
| 45 to 59 Minutes | 0 | 0.0% |
| 60 to 89 Minutes | 5 | 1.1% |
| 90 or more Minutes | 0 | 0.0% |
Commute Time by Sex in Wishek
The most common commute times in Wishek are 5 to 9 minutes (103 commuters, 46.2%) for males and less than 5 minutes (99 commuters, 46.5%) for females.
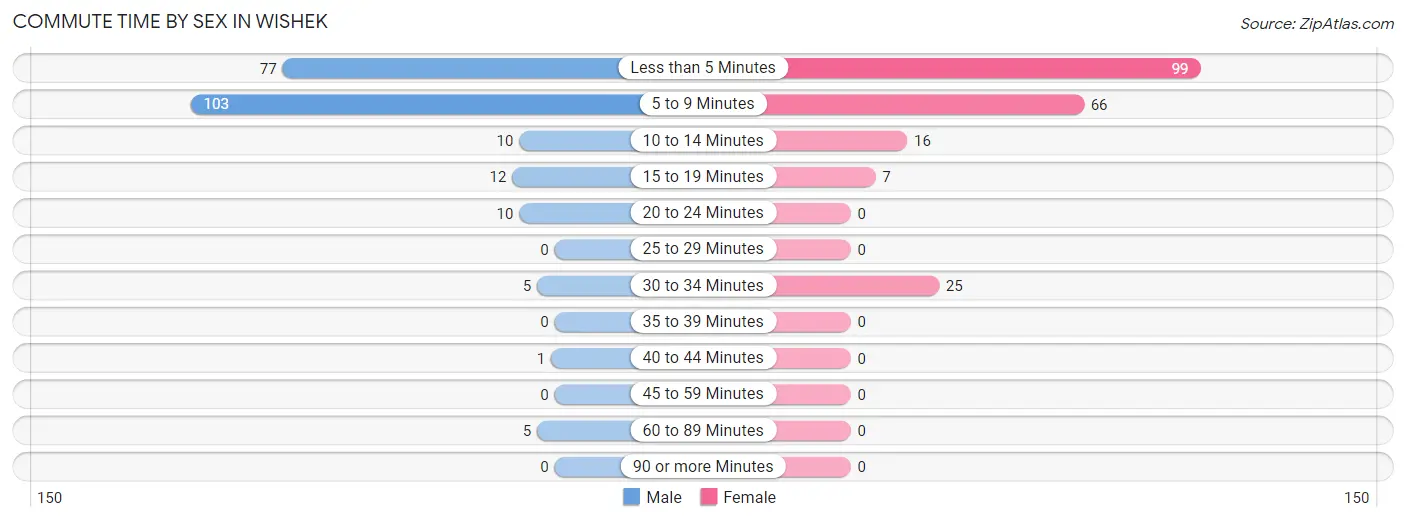
| Commute Time | Male | Female |
| Less than 5 Minutes | 77 (34.5%) | 99 (46.5%) |
| 5 to 9 Minutes | 103 (46.2%) | 66 (31.0%) |
| 10 to 14 Minutes | 10 (4.5%) | 16 (7.5%) |
| 15 to 19 Minutes | 12 (5.4%) | 7 (3.3%) |
| 20 to 24 Minutes | 10 (4.5%) | 0 (0.0%) |
| 25 to 29 Minutes | 0 (0.0%) | 0 (0.0%) |
| 30 to 34 Minutes | 5 (2.2%) | 25 (11.7%) |
| 35 to 39 Minutes | 0 (0.0%) | 0 (0.0%) |
| 40 to 44 Minutes | 1 (0.4%) | 0 (0.0%) |
| 45 to 59 Minutes | 0 (0.0%) | 0 (0.0%) |
| 60 to 89 Minutes | 5 (2.2%) | 0 (0.0%) |
| 90 or more Minutes | 0 (0.0%) | 0 (0.0%) |
Time of Departure to Work by Sex in Wishek
The most frequent times of departure to work in Wishek are 7:00 AM to 7:29 AM (75, 33.6%) for males and 7:30 AM to 7:59 AM (82, 38.5%) for females.
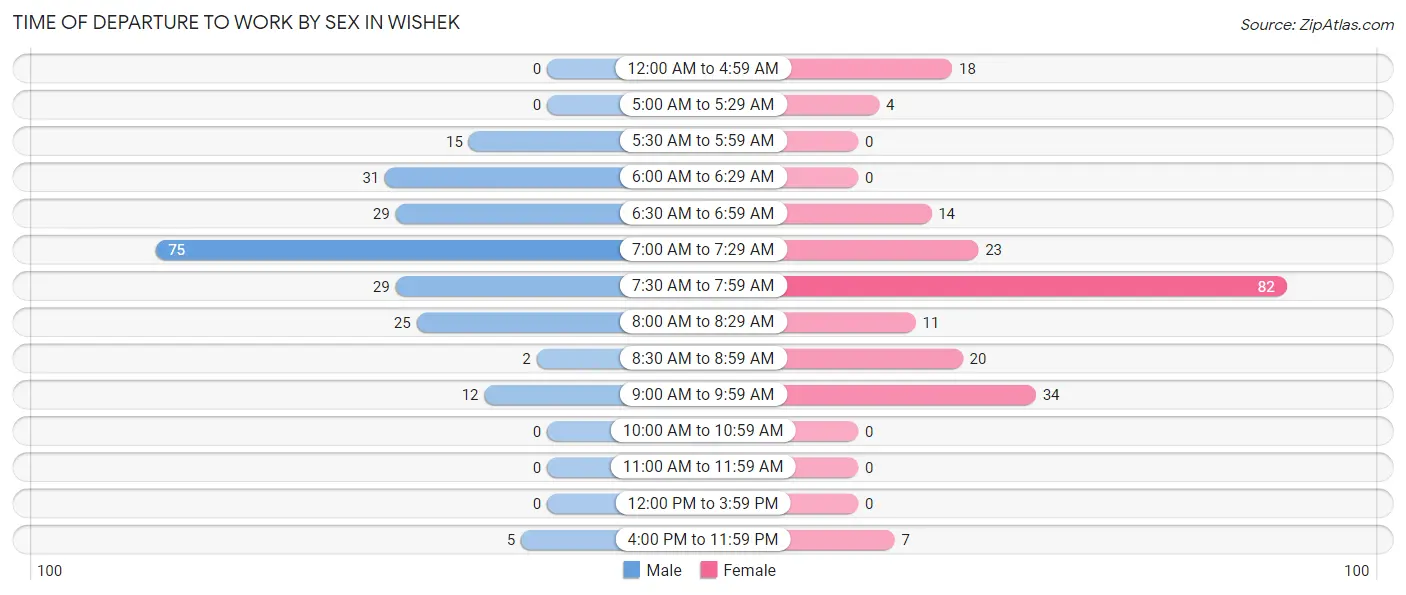
| Time of Departure | Male | Female |
| 12:00 AM to 4:59 AM | 0 (0.0%) | 18 (8.5%) |
| 5:00 AM to 5:29 AM | 0 (0.0%) | 4 (1.9%) |
| 5:30 AM to 5:59 AM | 15 (6.7%) | 0 (0.0%) |
| 6:00 AM to 6:29 AM | 31 (13.9%) | 0 (0.0%) |
| 6:30 AM to 6:59 AM | 29 (13.0%) | 14 (6.6%) |
| 7:00 AM to 7:29 AM | 75 (33.6%) | 23 (10.8%) |
| 7:30 AM to 7:59 AM | 29 (13.0%) | 82 (38.5%) |
| 8:00 AM to 8:29 AM | 25 (11.2%) | 11 (5.2%) |
| 8:30 AM to 8:59 AM | 2 (0.9%) | 20 (9.4%) |
| 9:00 AM to 9:59 AM | 12 (5.4%) | 34 (16.0%) |
| 10:00 AM to 10:59 AM | 0 (0.0%) | 0 (0.0%) |
| 11:00 AM to 11:59 AM | 0 (0.0%) | 0 (0.0%) |
| 12:00 PM to 3:59 PM | 0 (0.0%) | 0 (0.0%) |
| 4:00 PM to 11:59 PM | 5 (2.2%) | 7 (3.3%) |
| Total | 223 (100.0%) | 213 (100.0%) |
Housing Occupancy in Wishek
Occupancy by Ownership in Wishek
Of the total 375 dwellings in Wishek, owner-occupied units account for 267 (71.2%), while renter-occupied units make up 108 (28.8%).
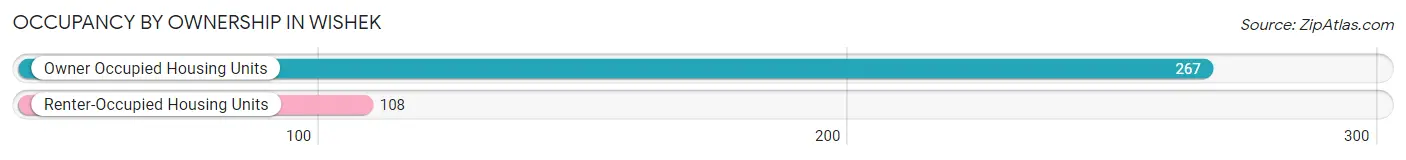
| Occupancy | # Housing Units | % Housing Units |
| Owner Occupied Housing Units | 267 | 71.2% |
| Renter-Occupied Housing Units | 108 | 28.8% |
| Total Occupied Housing Units | 375 | 100.0% |
Occupancy by Household Size in Wishek
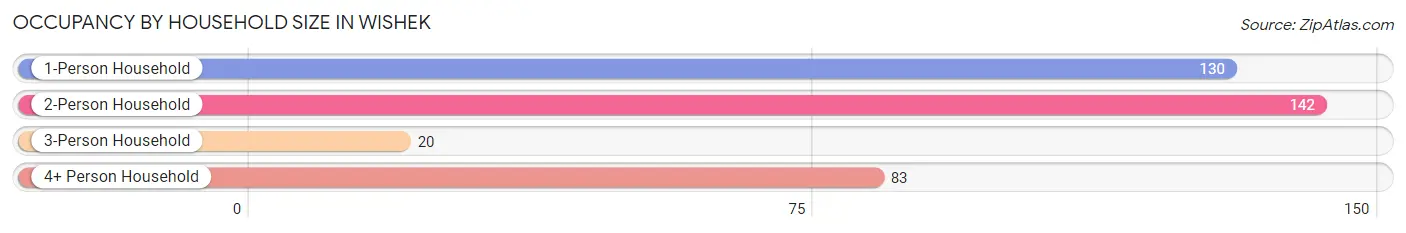
| Household Size | # Housing Units | % Housing Units |
| 1-Person Household | 130 | 34.7% |
| 2-Person Household | 142 | 37.9% |
| 3-Person Household | 20 | 5.3% |
| 4+ Person Household | 83 | 22.1% |
| Total Housing Units | 375 | 100.0% |
Occupancy by Ownership by Household Size in Wishek
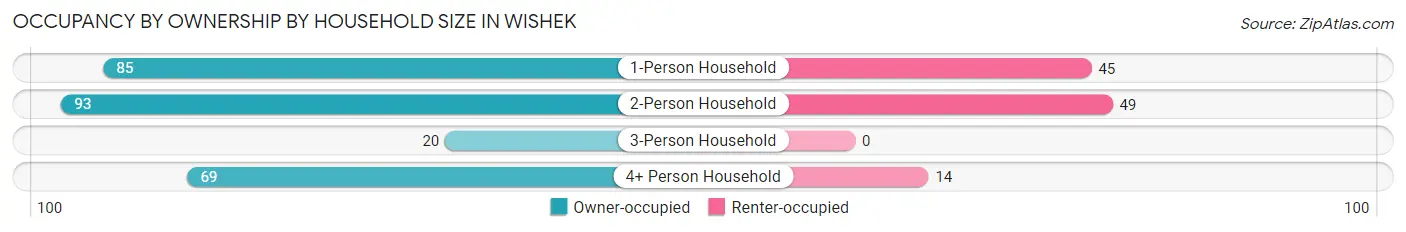
| Household Size | Owner-occupied | Renter-occupied |
| 1-Person Household | 85 (65.4%) | 45 (34.6%) |
| 2-Person Household | 93 (65.5%) | 49 (34.5%) |
| 3-Person Household | 20 (100.0%) | 0 (0.0%) |
| 4+ Person Household | 69 (83.1%) | 14 (16.9%) |
| Total Housing Units | 267 (71.2%) | 108 (28.8%) |
Occupancy by Educational Attainment in Wishek
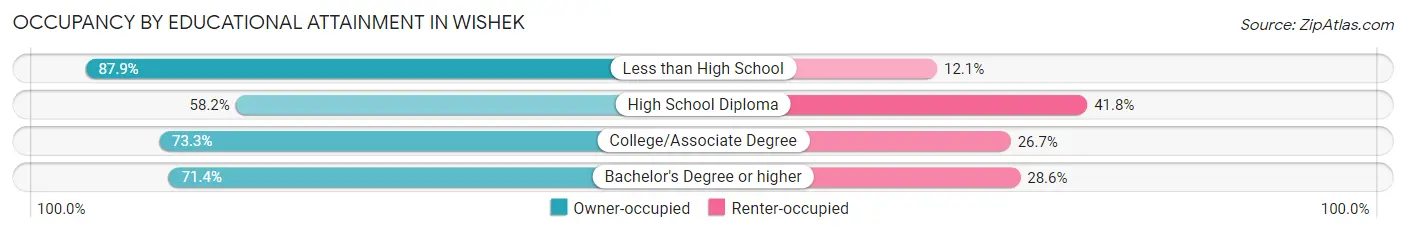
| Household Size | Owner-occupied | Renter-occupied |
| Less than High School | 51 (87.9%) | 7 (12.1%) |
| High School Diploma | 57 (58.2%) | 41 (41.8%) |
| College/Associate Degree | 99 (73.3%) | 36 (26.7%) |
| Bachelor's Degree or higher | 60 (71.4%) | 24 (28.6%) |
Occupancy by Age of Householder in Wishek
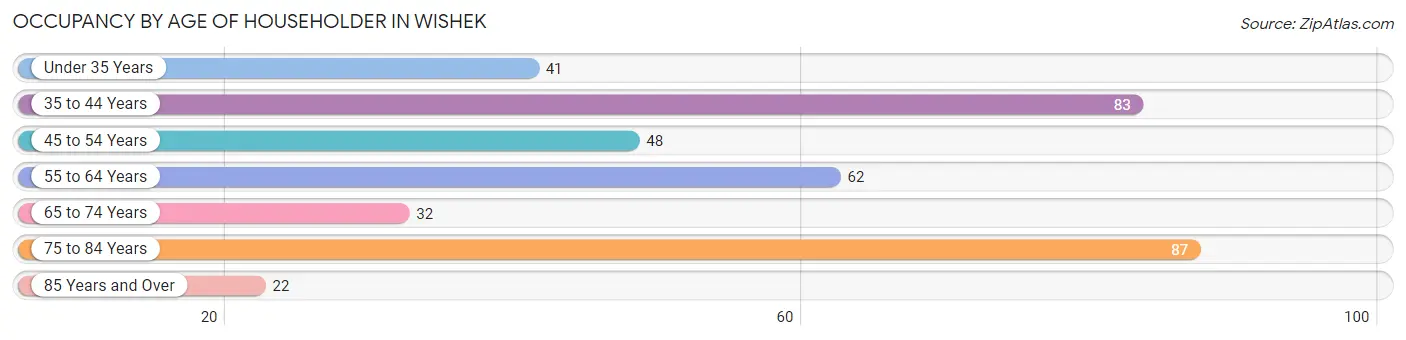
| Age Bracket | # Households | % Households |
| Under 35 Years | 41 | 10.9% |
| 35 to 44 Years | 83 | 22.1% |
| 45 to 54 Years | 48 | 12.8% |
| 55 to 64 Years | 62 | 16.5% |
| 65 to 74 Years | 32 | 8.5% |
| 75 to 84 Years | 87 | 23.2% |
| 85 Years and Over | 22 | 5.9% |
| Total | 375 | 100.0% |
Housing Finances in Wishek
Median Income by Occupancy in Wishek
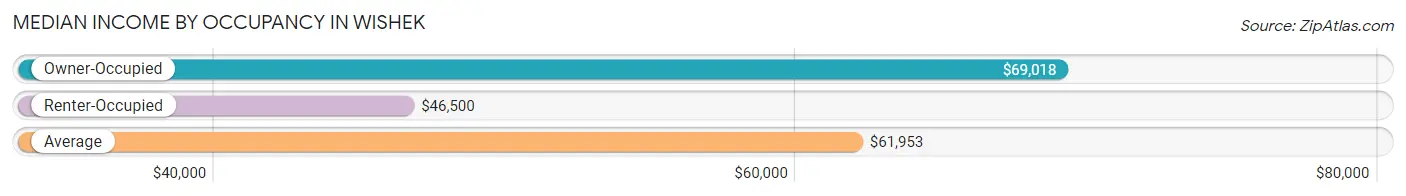
| Occupancy Type | # Households | Median Income |
| Owner-Occupied | 267 (71.2%) | $69,018 |
| Renter-Occupied | 108 (28.8%) | $46,500 |
| Average | 375 (100.0%) | $61,953 |
Occupancy by Householder Income Bracket in Wishek
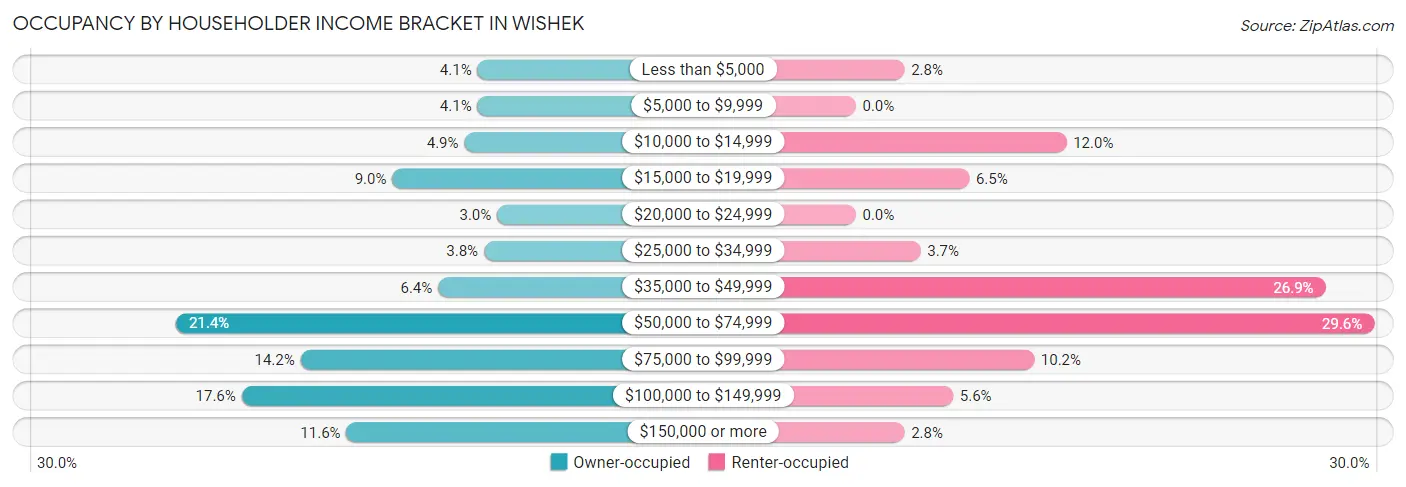
| Income Bracket | Owner-occupied | Renter-occupied |
| Less than $5,000 | 11 (4.1%) | 3 (2.8%) |
| $5,000 to $9,999 | 11 (4.1%) | 0 (0.0%) |
| $10,000 to $14,999 | 13 (4.9%) | 13 (12.0%) |
| $15,000 to $19,999 | 24 (9.0%) | 7 (6.5%) |
| $20,000 to $24,999 | 8 (3.0%) | 0 (0.0%) |
| $25,000 to $34,999 | 10 (3.7%) | 4 (3.7%) |
| $35,000 to $49,999 | 17 (6.4%) | 29 (26.9%) |
| $50,000 to $74,999 | 57 (21.3%) | 32 (29.6%) |
| $75,000 to $99,999 | 38 (14.2%) | 11 (10.2%) |
| $100,000 to $149,999 | 47 (17.6%) | 6 (5.6%) |
| $150,000 or more | 31 (11.6%) | 3 (2.8%) |
| Total | 267 (100.0%) | 108 (100.0%) |
Monthly Housing Cost Tiers in Wishek
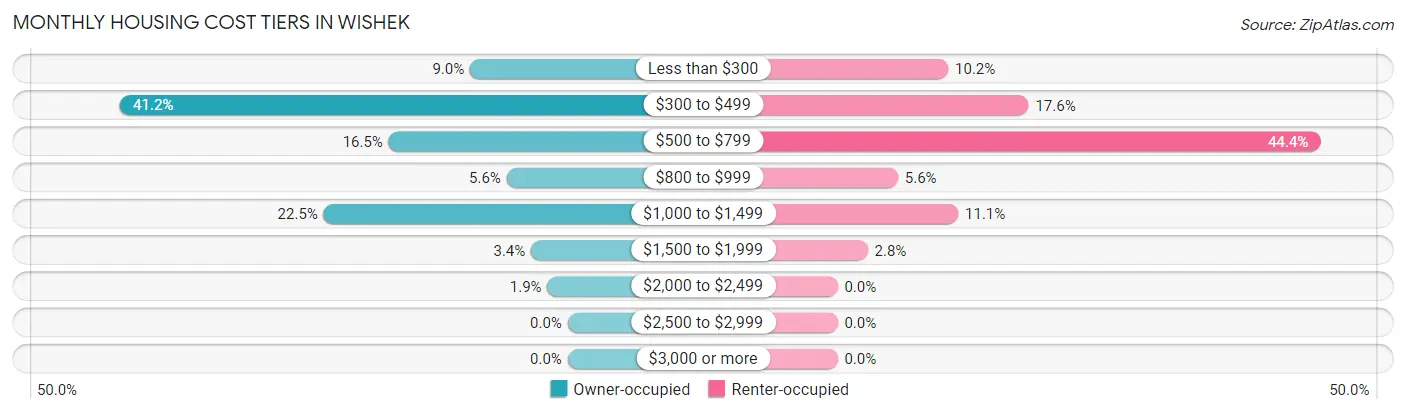
| Monthly Cost | Owner-occupied | Renter-occupied |
| Less than $300 | 24 (9.0%) | 11 (10.2%) |
| $300 to $499 | 110 (41.2%) | 19 (17.6%) |
| $500 to $799 | 44 (16.5%) | 48 (44.4%) |
| $800 to $999 | 15 (5.6%) | 6 (5.6%) |
| $1,000 to $1,499 | 60 (22.5%) | 12 (11.1%) |
| $1,500 to $1,999 | 9 (3.4%) | 3 (2.8%) |
| $2,000 to $2,499 | 5 (1.9%) | 0 (0.0%) |
| $2,500 to $2,999 | 0 (0.0%) | 0 (0.0%) |
| $3,000 or more | 0 (0.0%) | 0 (0.0%) |
| Total | 267 (100.0%) | 108 (100.0%) |
Physical Housing Characteristics in Wishek
Housing Structures in Wishek
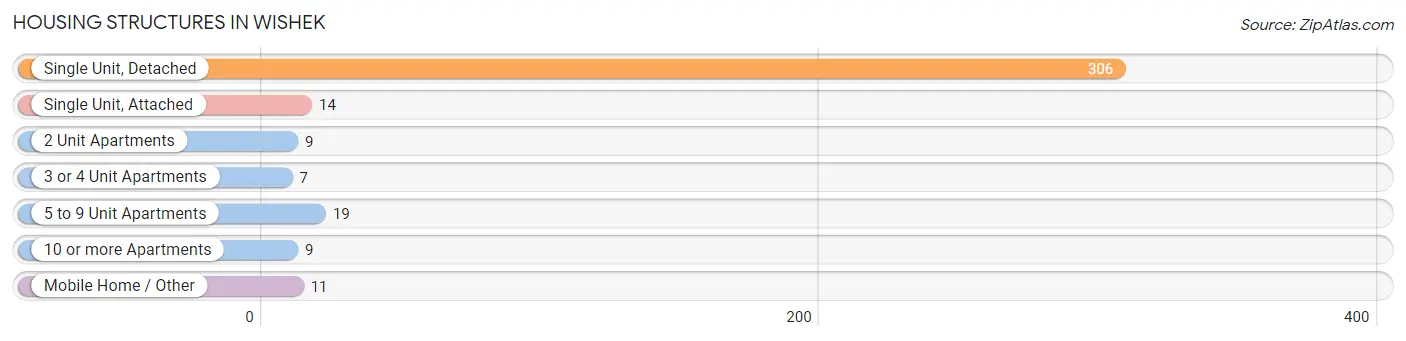
| Structure Type | # Housing Units | % Housing Units |
| Single Unit, Detached | 306 | 81.6% |
| Single Unit, Attached | 14 | 3.7% |
| 2 Unit Apartments | 9 | 2.4% |
| 3 or 4 Unit Apartments | 7 | 1.9% |
| 5 to 9 Unit Apartments | 19 | 5.1% |
| 10 or more Apartments | 9 | 2.4% |
| Mobile Home / Other | 11 | 2.9% |
| Total | 375 | 100.0% |
Housing Structures by Occupancy in Wishek
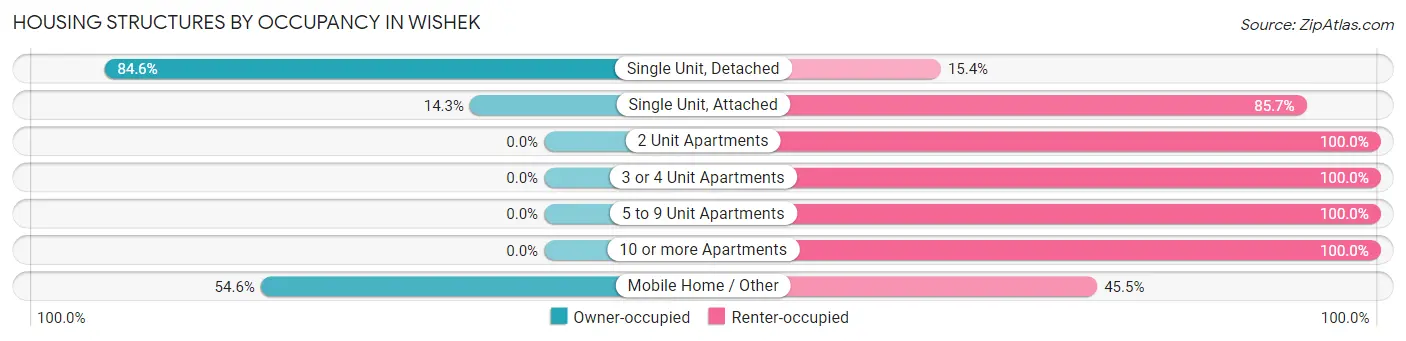
| Structure Type | Owner-occupied | Renter-occupied |
| Single Unit, Detached | 259 (84.6%) | 47 (15.4%) |
| Single Unit, Attached | 2 (14.3%) | 12 (85.7%) |
| 2 Unit Apartments | 0 (0.0%) | 9 (100.0%) |
| 3 or 4 Unit Apartments | 0 (0.0%) | 7 (100.0%) |
| 5 to 9 Unit Apartments | 0 (0.0%) | 19 (100.0%) |
| 10 or more Apartments | 0 (0.0%) | 9 (100.0%) |
| Mobile Home / Other | 6 (54.5%) | 5 (45.5%) |
| Total | 267 (71.2%) | 108 (28.8%) |
Housing Structures by Number of Rooms in Wishek
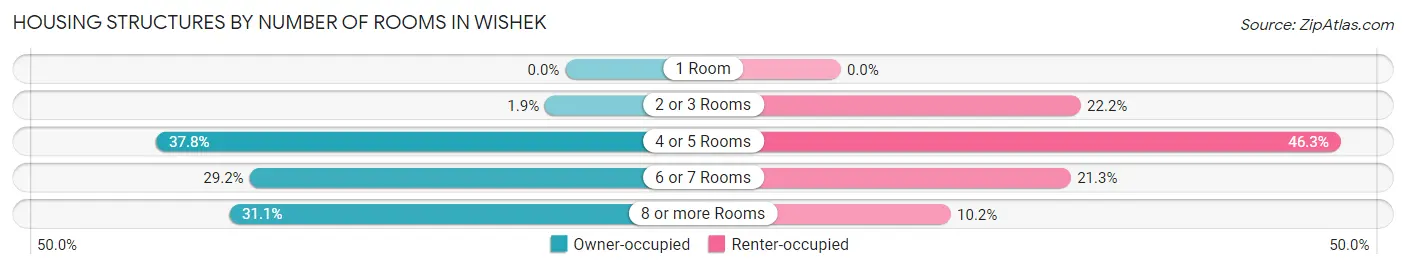
| Number of Rooms | Owner-occupied | Renter-occupied |
| 1 Room | 0 (0.0%) | 0 (0.0%) |
| 2 or 3 Rooms | 5 (1.9%) | 24 (22.2%) |
| 4 or 5 Rooms | 101 (37.8%) | 50 (46.3%) |
| 6 or 7 Rooms | 78 (29.2%) | 23 (21.3%) |
| 8 or more Rooms | 83 (31.1%) | 11 (10.2%) |
| Total | 267 (100.0%) | 108 (100.0%) |
Housing Structure by Heating Type in Wishek
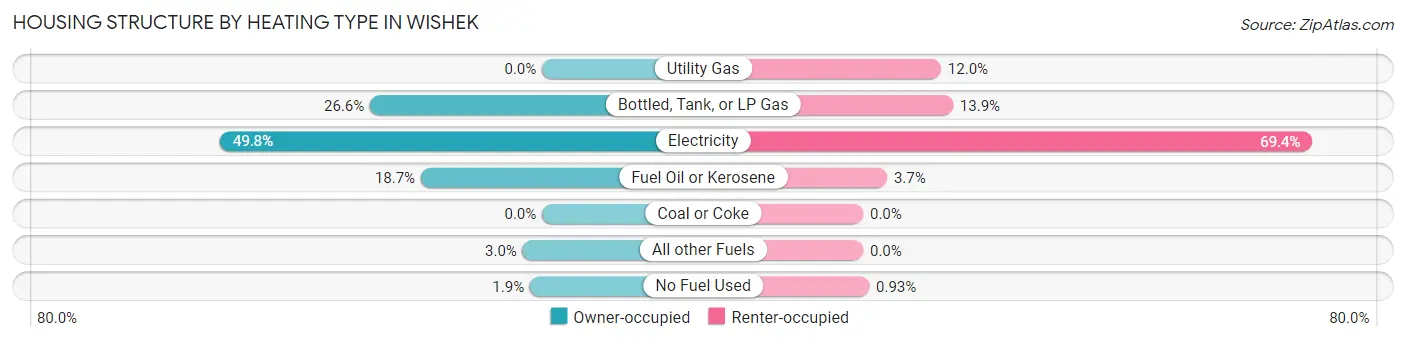
| Heating Type | Owner-occupied | Renter-occupied |
| Utility Gas | 0 (0.0%) | 13 (12.0%) |
| Bottled, Tank, or LP Gas | 71 (26.6%) | 15 (13.9%) |
| Electricity | 133 (49.8%) | 75 (69.4%) |
| Fuel Oil or Kerosene | 50 (18.7%) | 4 (3.7%) |
| Coal or Coke | 0 (0.0%) | 0 (0.0%) |
| All other Fuels | 8 (3.0%) | 0 (0.0%) |
| No Fuel Used | 5 (1.9%) | 1 (0.9%) |
| Total | 267 (100.0%) | 108 (100.0%) |
Household Vehicle Usage in Wishek
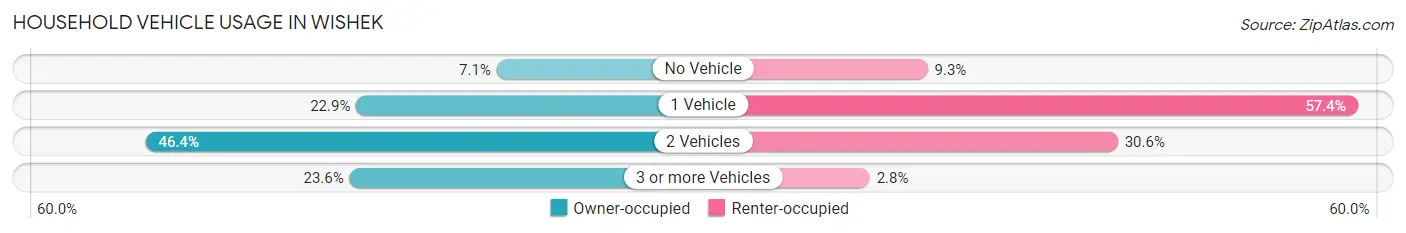
| Vehicles per Household | Owner-occupied | Renter-occupied |
| No Vehicle | 19 (7.1%) | 10 (9.3%) |
| 1 Vehicle | 61 (22.9%) | 62 (57.4%) |
| 2 Vehicles | 124 (46.4%) | 33 (30.6%) |
| 3 or more Vehicles | 63 (23.6%) | 3 (2.8%) |
| Total | 267 (100.0%) | 108 (100.0%) |
Real Estate & Mortgages in Wishek
Real Estate and Mortgage Overview in Wishek
| Characteristic | Without Mortgage | With Mortgage |
| Housing Units | 175 | 92 |
| Median Property Value | $86,800 | $138,800 |
| Median Household Income | $41,964 | $18 |
| Monthly Housing Costs | $424 | $0 |
| Real Estate Taxes | $989 | $0 |
Property Value by Mortgage Status in Wishek
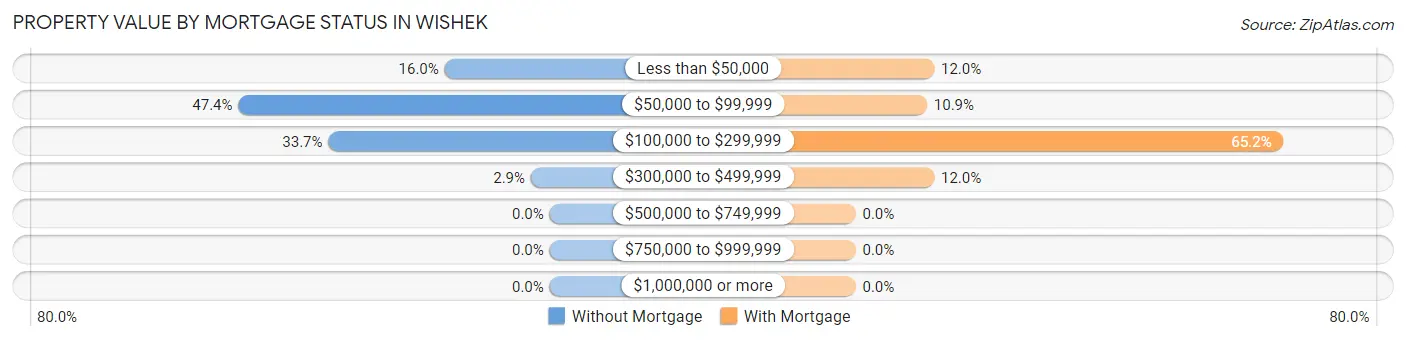
| Property Value | Without Mortgage | With Mortgage |
| Less than $50,000 | 28 (16.0%) | 11 (12.0%) |
| $50,000 to $99,999 | 83 (47.4%) | 10 (10.9%) |
| $100,000 to $299,999 | 59 (33.7%) | 60 (65.2%) |
| $300,000 to $499,999 | 5 (2.9%) | 11 (12.0%) |
| $500,000 to $749,999 | 0 (0.0%) | 0 (0.0%) |
| $750,000 to $999,999 | 0 (0.0%) | 0 (0.0%) |
| $1,000,000 or more | 0 (0.0%) | 0 (0.0%) |
| Total | 175 (100.0%) | 92 (100.0%) |
Household Income by Mortgage Status in Wishek
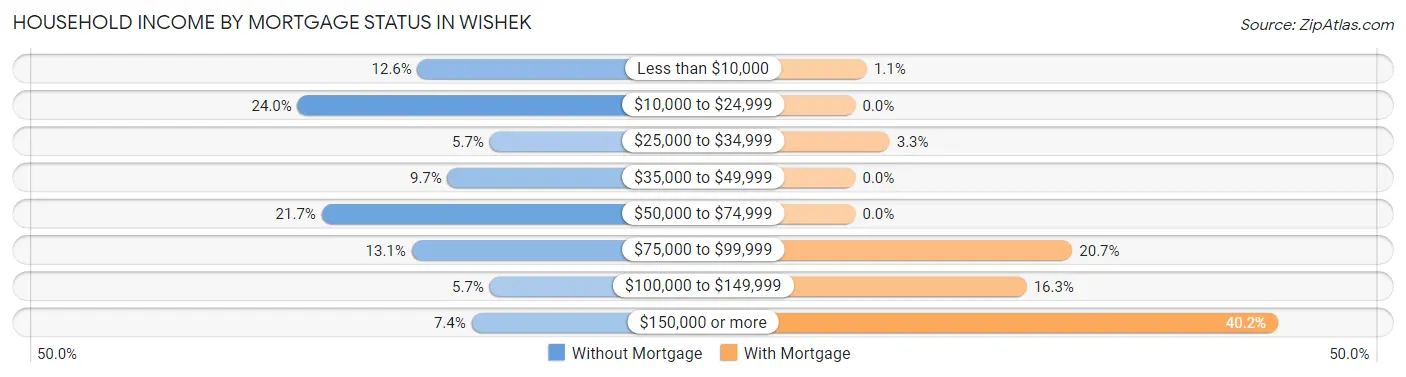
| Household Income | Without Mortgage | With Mortgage |
| Less than $10,000 | 22 (12.6%) | 1 (1.1%) |
| $10,000 to $24,999 | 42 (24.0%) | 0 (0.0%) |
| $25,000 to $34,999 | 10 (5.7%) | 3 (3.3%) |
| $35,000 to $49,999 | 17 (9.7%) | 0 (0.0%) |
| $50,000 to $74,999 | 38 (21.7%) | 0 (0.0%) |
| $75,000 to $99,999 | 23 (13.1%) | 19 (20.6%) |
| $100,000 to $149,999 | 10 (5.7%) | 15 (16.3%) |
| $150,000 or more | 13 (7.4%) | 37 (40.2%) |
| Total | 175 (100.0%) | 92 (100.0%) |
Property Value to Household Income Ratio in Wishek
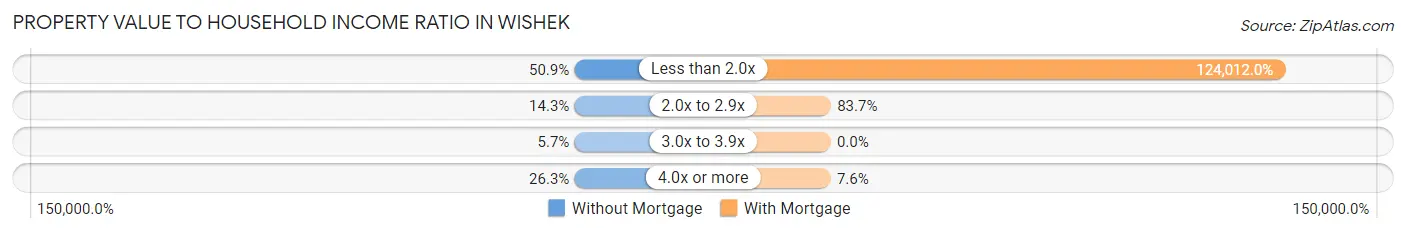
| Value-to-Income Ratio | Without Mortgage | With Mortgage |
| Less than 2.0x | 89 (50.9%) | 114,091 (124,012.0%) |
| 2.0x to 2.9x | 25 (14.3%) | 77 (83.7%) |
| 3.0x to 3.9x | 10 (5.7%) | 0 (0.0%) |
| 4.0x or more | 46 (26.3%) | 7 (7.6%) |
| Total | 175 (100.0%) | 92 (100.0%) |
Real Estate Taxes by Mortgage Status in Wishek
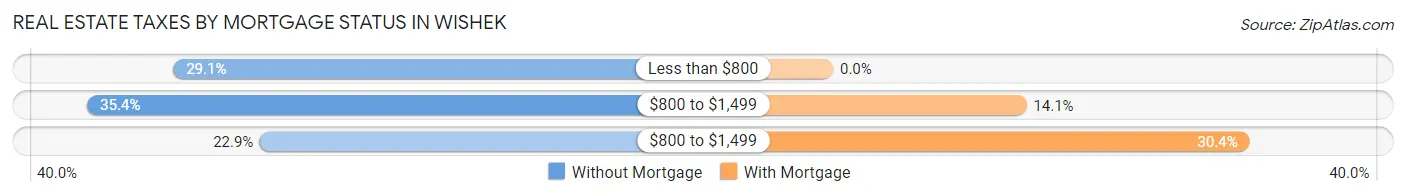
| Property Taxes | Without Mortgage | With Mortgage |
| Less than $800 | 51 (29.1%) | 0 (0.0%) |
| $800 to $1,499 | 62 (35.4%) | 13 (14.1%) |
| $800 to $1,499 | 40 (22.9%) | 28 (30.4%) |
| Total | 175 (100.0%) | 92 (100.0%) |
Health & Disability in Wishek
Health Insurance Coverage by Age in Wishek
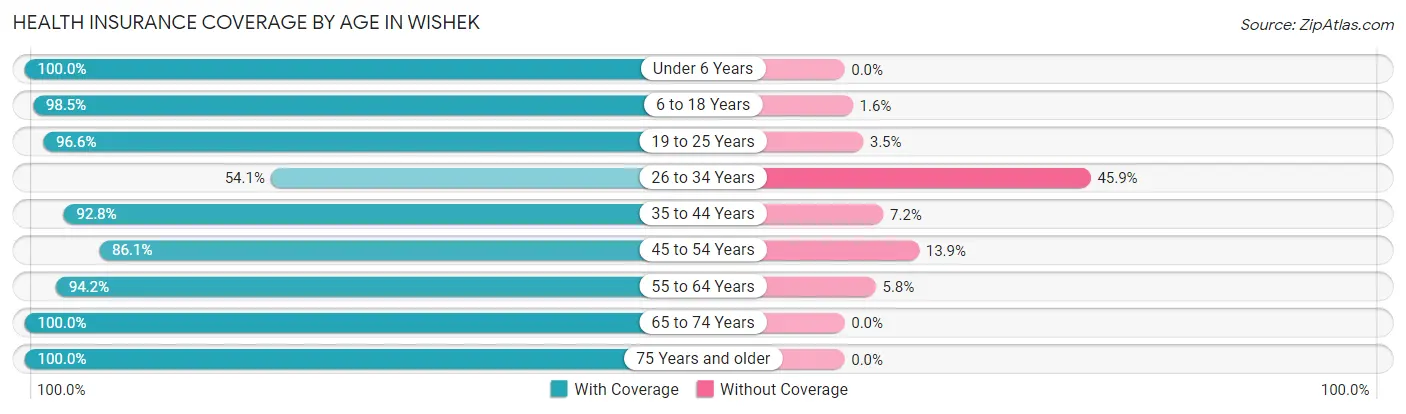
| Age Bracket | With Coverage | Without Coverage |
| Under 6 Years | 48 (100.0%) | 0 (0.0%) |
| 6 to 18 Years | 191 (98.5%) | 3 (1.5%) |
| 19 to 25 Years | 28 (96.6%) | 1 (3.5%) |
| 26 to 34 Years | 33 (54.1%) | 28 (45.9%) |
| 35 to 44 Years | 141 (92.8%) | 11 (7.2%) |
| 45 to 54 Years | 62 (86.1%) | 10 (13.9%) |
| 55 to 64 Years | 97 (94.2%) | 6 (5.8%) |
| 65 to 74 Years | 64 (100.0%) | 0 (0.0%) |
| 75 Years and older | 158 (100.0%) | 0 (0.0%) |
| Total | 822 (93.3%) | 59 (6.7%) |
Health Insurance Coverage by Citizenship Status in Wishek
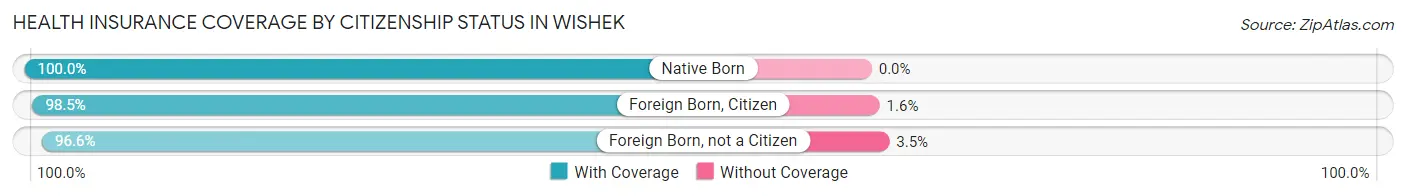
| Citizenship Status | With Coverage | Without Coverage |
| Native Born | 48 (100.0%) | 0 (0.0%) |
| Foreign Born, Citizen | 191 (98.5%) | 3 (1.5%) |
| Foreign Born, not a Citizen | 28 (96.6%) | 1 (3.5%) |
Health Insurance Coverage by Household Income in Wishek
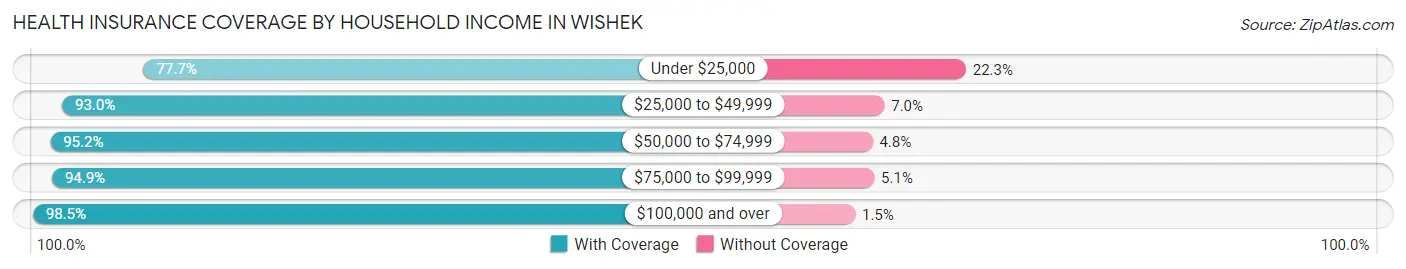
| Household Income | With Coverage | Without Coverage |
| Under $25,000 | 108 (77.7%) | 31 (22.3%) |
| $25,000 to $49,999 | 106 (93.0%) | 8 (7.0%) |
| $50,000 to $74,999 | 178 (95.2%) | 9 (4.8%) |
| $75,000 to $99,999 | 111 (94.9%) | 6 (5.1%) |
| $100,000 and over | 319 (98.5%) | 5 (1.5%) |
Public vs Private Health Insurance Coverage by Age in Wishek
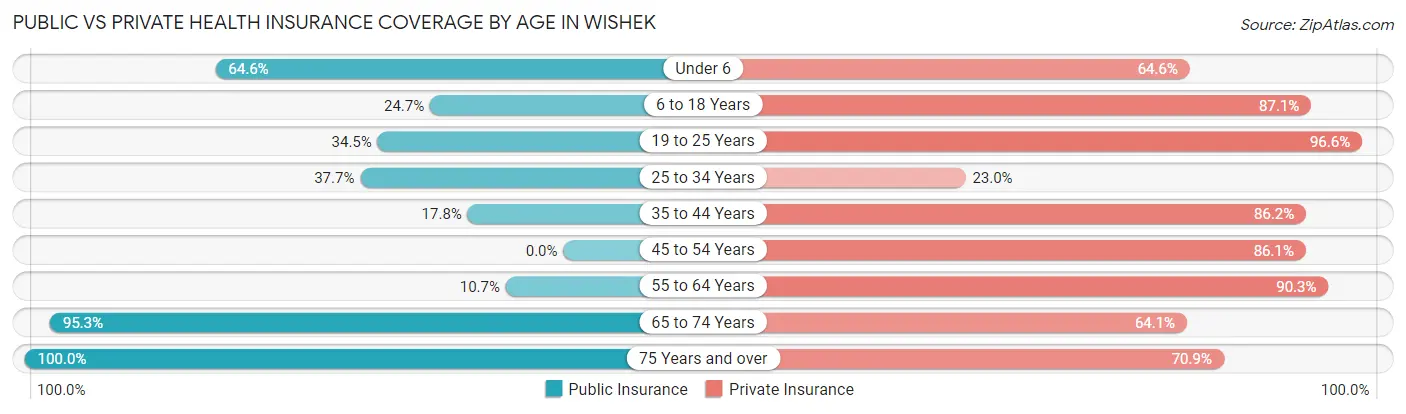
| Age Bracket | Public Insurance | Private Insurance |
| Under 6 | 31 (64.6%) | 31 (64.6%) |
| 6 to 18 Years | 48 (24.7%) | 169 (87.1%) |
| 19 to 25 Years | 10 (34.5%) | 28 (96.6%) |
| 25 to 34 Years | 23 (37.7%) | 14 (23.0%) |
| 35 to 44 Years | 27 (17.8%) | 131 (86.2%) |
| 45 to 54 Years | 0 (0.0%) | 62 (86.1%) |
| 55 to 64 Years | 11 (10.7%) | 93 (90.3%) |
| 65 to 74 Years | 61 (95.3%) | 41 (64.1%) |
| 75 Years and over | 158 (100.0%) | 112 (70.9%) |
| Total | 369 (41.9%) | 681 (77.3%) |
Disability Status by Sex by Age in Wishek
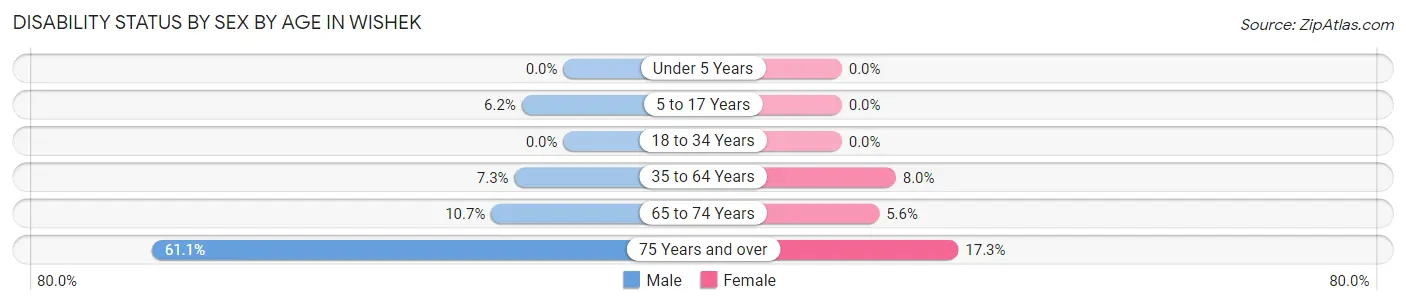
| Age Bracket | Male | Female |
| Under 5 Years | 0 (0.0%) | 0 (0.0%) |
| 5 to 17 Years | 6 (6.2%) | 0 (0.0%) |
| 18 to 34 Years | 0 (0.0%) | 0 (0.0%) |
| 35 to 64 Years | 12 (7.3%) | 13 (8.0%) |
| 65 to 74 Years | 3 (10.7%) | 2 (5.6%) |
| 75 Years and over | 33 (61.1%) | 18 (17.3%) |
Disability Class by Sex by Age in Wishek
Disability Class: Hearing Difficulty
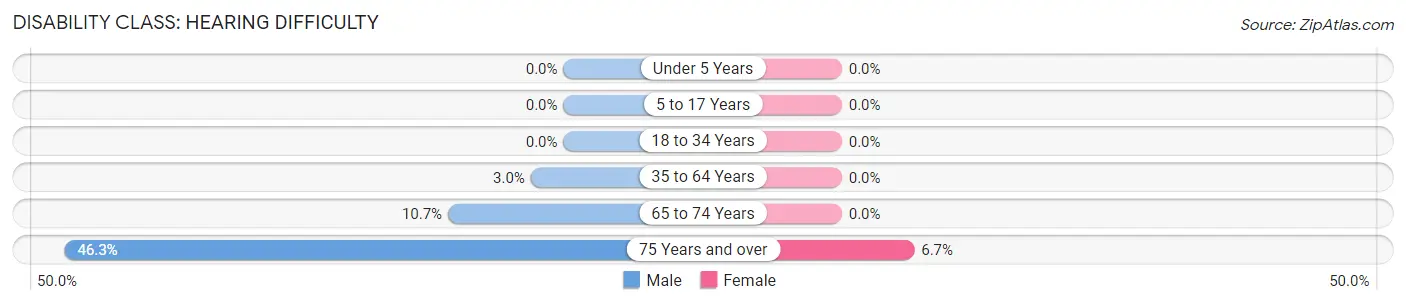
| Age Bracket | Male | Female |
| Under 5 Years | 0 (0.0%) | 0 (0.0%) |
| 5 to 17 Years | 0 (0.0%) | 0 (0.0%) |
| 18 to 34 Years | 0 (0.0%) | 0 (0.0%) |
| 35 to 64 Years | 5 (3.0%) | 0 (0.0%) |
| 65 to 74 Years | 3 (10.7%) | 0 (0.0%) |
| 75 Years and over | 25 (46.3%) | 7 (6.7%) |
Disability Class: Vision Difficulty
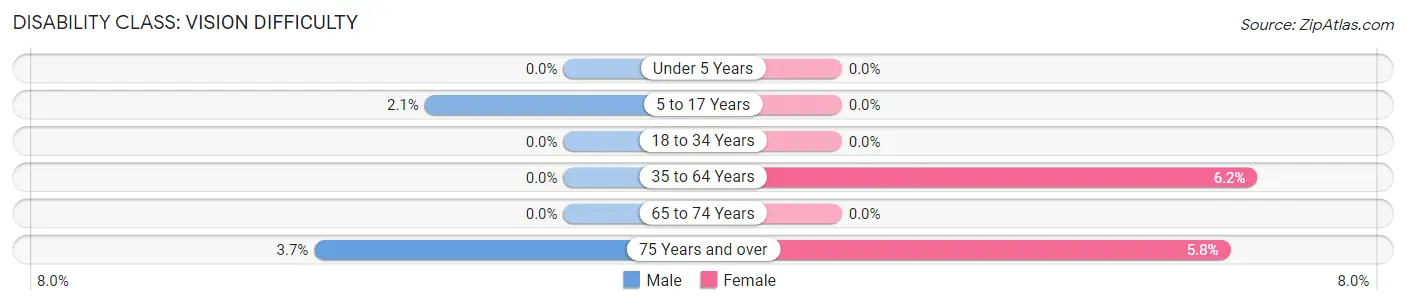
| Age Bracket | Male | Female |
| Under 5 Years | 0 (0.0%) | 0 (0.0%) |
| 5 to 17 Years | 2 (2.1%) | 0 (0.0%) |
| 18 to 34 Years | 0 (0.0%) | 0 (0.0%) |
| 35 to 64 Years | 0 (0.0%) | 10 (6.2%) |
| 65 to 74 Years | 0 (0.0%) | 0 (0.0%) |
| 75 Years and over | 2 (3.7%) | 6 (5.8%) |
Disability Class: Cognitive Difficulty
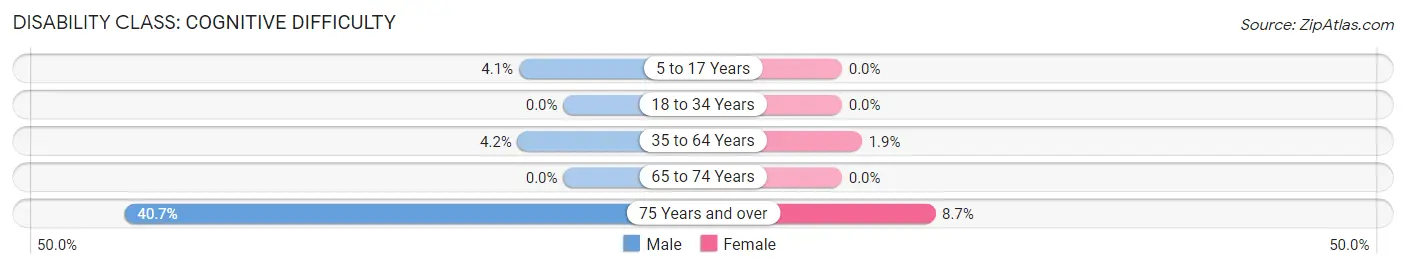
| Age Bracket | Male | Female |
| 5 to 17 Years | 4 (4.1%) | 0 (0.0%) |
| 18 to 34 Years | 0 (0.0%) | 0 (0.0%) |
| 35 to 64 Years | 7 (4.2%) | 3 (1.8%) |
| 65 to 74 Years | 0 (0.0%) | 0 (0.0%) |
| 75 Years and over | 22 (40.7%) | 9 (8.6%) |
Disability Class: Ambulatory Difficulty
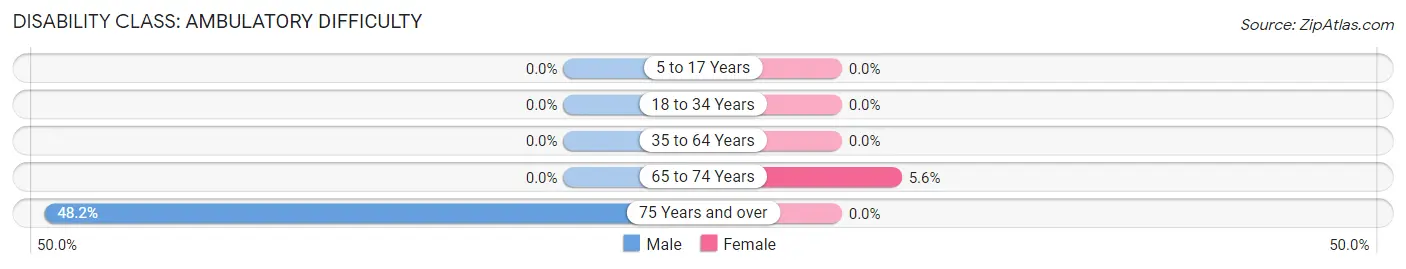
| Age Bracket | Male | Female |
| 5 to 17 Years | 0 (0.0%) | 0 (0.0%) |
| 18 to 34 Years | 0 (0.0%) | 0 (0.0%) |
| 35 to 64 Years | 0 (0.0%) | 0 (0.0%) |
| 65 to 74 Years | 0 (0.0%) | 2 (5.6%) |
| 75 Years and over | 26 (48.1%) | 0 (0.0%) |
Disability Class: Self-Care Difficulty
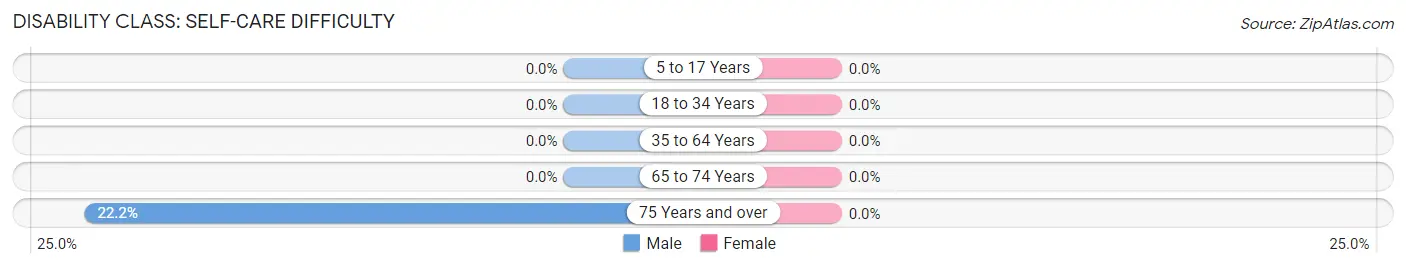
| Age Bracket | Male | Female |
| 5 to 17 Years | 0 (0.0%) | 0 (0.0%) |
| 18 to 34 Years | 0 (0.0%) | 0 (0.0%) |
| 35 to 64 Years | 0 (0.0%) | 0 (0.0%) |
| 65 to 74 Years | 0 (0.0%) | 0 (0.0%) |
| 75 Years and over | 12 (22.2%) | 0 (0.0%) |
Technology Access in Wishek
Computing Device Access in Wishek
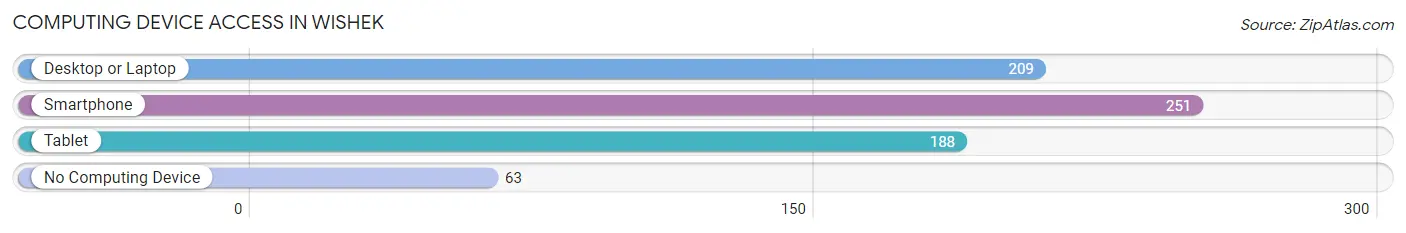
| Device Type | # Households | % Households |
| Desktop or Laptop | 209 | 55.7% |
| Smartphone | 251 | 66.9% |
| Tablet | 188 | 50.1% |
| No Computing Device | 63 | 16.8% |
| Total | 375 | 100.0% |
Internet Access in Wishek
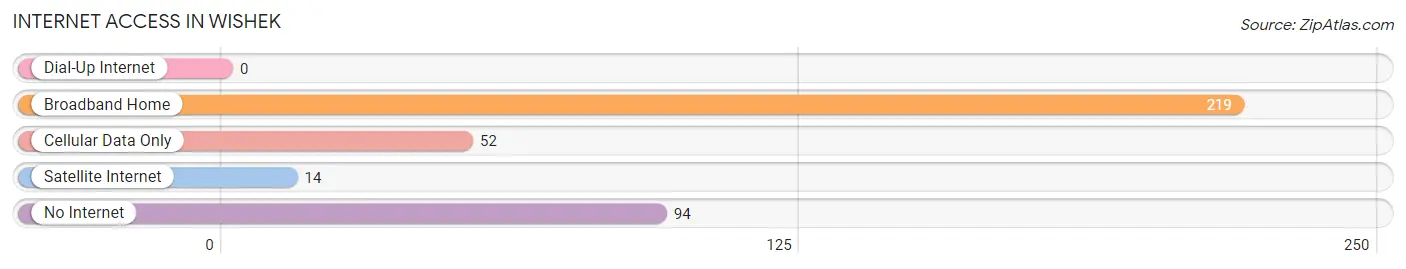
| Internet Type | # Households | % Households |
| Dial-Up Internet | 0 | 0.0% |
| Broadband Home | 219 | 58.4% |
| Cellular Data Only | 52 | 13.9% |
| Satellite Internet | 14 | 3.7% |
| No Internet | 94 | 25.1% |
| Total | 375 | 100.0% |
Wishek Summary
Wishek is a small city located in McIntosh County, North Dakota, United States. It is the county seat of McIntosh County and has a population of 1,093 as of the 2010 census. The city is located in the south-central part of the state, about 50 miles south of Bismarck, the state capital.
History
The area around Wishek was first settled in the late 1800s by German-Russian immigrants. The city was founded in 1883 and was named after the nearby Wishek Creek. The city was incorporated in 1887 and was named the county seat of McIntosh County in 1889.
The city grew rapidly in the early 1900s, with the population reaching 1,000 by 1910. The city was a major agricultural center in the region, with many of the local farmers growing wheat, oats, barley, and flax.
The city was also home to a number of businesses, including a flour mill, a creamery, a lumber yard, and a brickyard. The city also had a number of churches, including a Catholic church, a Lutheran church, and a Methodist church.
Geography
Wishek is located at 46°25'N 99°45'W (46.4167, -99.7500). The city is located in the south-central part of North Dakota, about 50 miles south of Bismarck, the state capital.
The city is situated in a flat, open area of the Great Plains. The city is surrounded by farmland, with the nearest major city being Bismarck, about 50 miles to the north.
Economy
The economy of Wishek is largely based on agriculture. The city is home to a number of farms, which grow wheat, oats, barley, and flax. The city is also home to a number of businesses, including a flour mill, a creamery, a lumber yard, and a brickyard.
The city is also home to a number of manufacturing businesses, including a furniture factory, a metal fabrication plant, and a plastics factory. The city is also home to a number of retail businesses, including a grocery store, a hardware store, and a number of restaurants.
Demographics
As of the 2010 census, the population of Wishek was 1,093. The racial makeup of the city was 97.2% White, 0.7% Native American, 0.3% Asian, 0.2% from other races, and 1.6% from two or more races. Hispanic or Latino of any race were 0.7% of the population.
The median income for a household in the city was $37,500, and the median income for a family was $45,000. The per capita income for the city was $18,845. About 10.2% of families and 13.2% of the population were below the poverty line, including 16.7% of those under age 18 and 8.3% of those age 65 or over.
Common Questions
What is Per Capita Income in Wishek?
Per Capita income in Wishek is $33,693.
What is the Median Family Income in Wishek?
Median Family Income in Wishek is $75,000.
What is the Median Household income in Wishek?
Median Household Income in Wishek is $61,953.
What is Income or Wage Gap in Wishek?
Income or Wage Gap in Wishek is 35.0%.
Women in Wishek earn 65.0 cents for every dollar earned by a man.
What is Inequality or Gini Index in Wishek?
Inequality or Gini Index in Wishek is 0.48.
What is the Total Population of Wishek?
Total Population of Wishek is 951.
What is the Total Male Population of Wishek?
Total Male Population of Wishek is 429.
What is the Total Female Population of Wishek?
Total Female Population of Wishek is 522.
What is the Ratio of Males per 100 Females in Wishek?
There are 82.18 Males per 100 Females in Wishek.
What is the Ratio of Females per 100 Males in Wishek?
There are 121.68 Females per 100 Males in Wishek.
What is the Median Population Age in Wishek?
Median Population Age in Wishek is 42.9 Years.
What is the Average Family Size in Wishek
Average Family Size in Wishek is 3.1 People.
What is the Average Household Size in Wishek
Average Household Size in Wishek is 2.4 People.
How Large is the Labor Force in Wishek?
There are 443 People in the Labor Forcein in Wishek.
What is the Percentage of People in the Labor Force in Wishek?
59.5% of People are in the Labor Force in Wishek.