Underwood, ND Map & Demographics
Underwood Map
Underwood Overview
$40,760
PER CAPITA INCOME
$85,938
AVG FAMILY INCOME
$72,917
AVG HOUSEHOLD INCOME
50.2%
WAGE / INCOME GAP [ % ]
49.8¢/ $1
WAGE / INCOME GAP [ $ ]
0.37
INEQUALITY / GINI INDEX
732
TOTAL POPULATION
360
MALE POPULATION
372
FEMALE POPULATION
96.77
MALES / 100 FEMALES
103.33
FEMALES / 100 MALES
47.3
MEDIAN AGE
2.7
AVG FAMILY SIZE
2.1
AVG HOUSEHOLD SIZE
377
LABOR FORCE [ PEOPLE ]
62.1%
PERCENT IN LABOR FORCE
6.9%
UNEMPLOYMENT RATE
Underwood Zip Codes
Underwood Area Codes
Income in Underwood
Income Overview in Underwood
Per Capita Income in Underwood is $40,760, while median incomes of families and households are $85,938 and $72,917 respectively.
| Characteristic | Number | Measure |
| Per Capita Income | 732 | $40,760 |
| Median Family Income | 209 | $85,938 |
| Mean Family Income | 209 | $99,472 |
| Median Household Income | 343 | $72,917 |
| Mean Household Income | 343 | $85,395 |
| Income Deficit | 209 | $0 |
| Wage / Income Gap (%) | 732 | 50.16% |
| Wage / Income Gap ($) | 732 | 49.84¢ per $1 |
| Gini / Inequality Index | 732 | 0.37 |
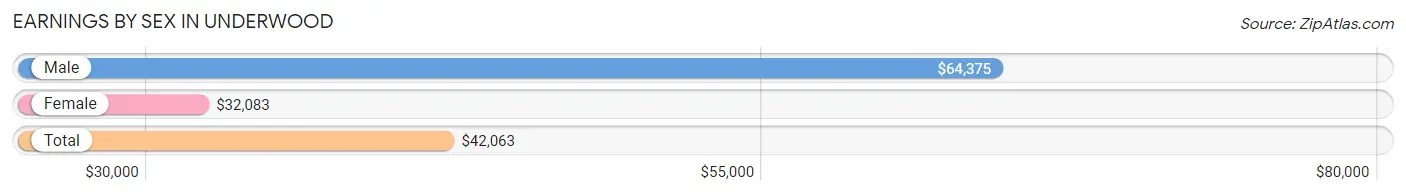
Earnings by Sex in Underwood
Average Earnings in Underwood are $42,063, $64,375 for men and $32,083 for women, a difference of 50.2%.
| Sex | Number | Average Earnings |
| Male | 233 (58.3%) | $64,375 |
| Female | 167 (41.7%) | $32,083 |
| Total | 400 (100.0%) | $42,063 |
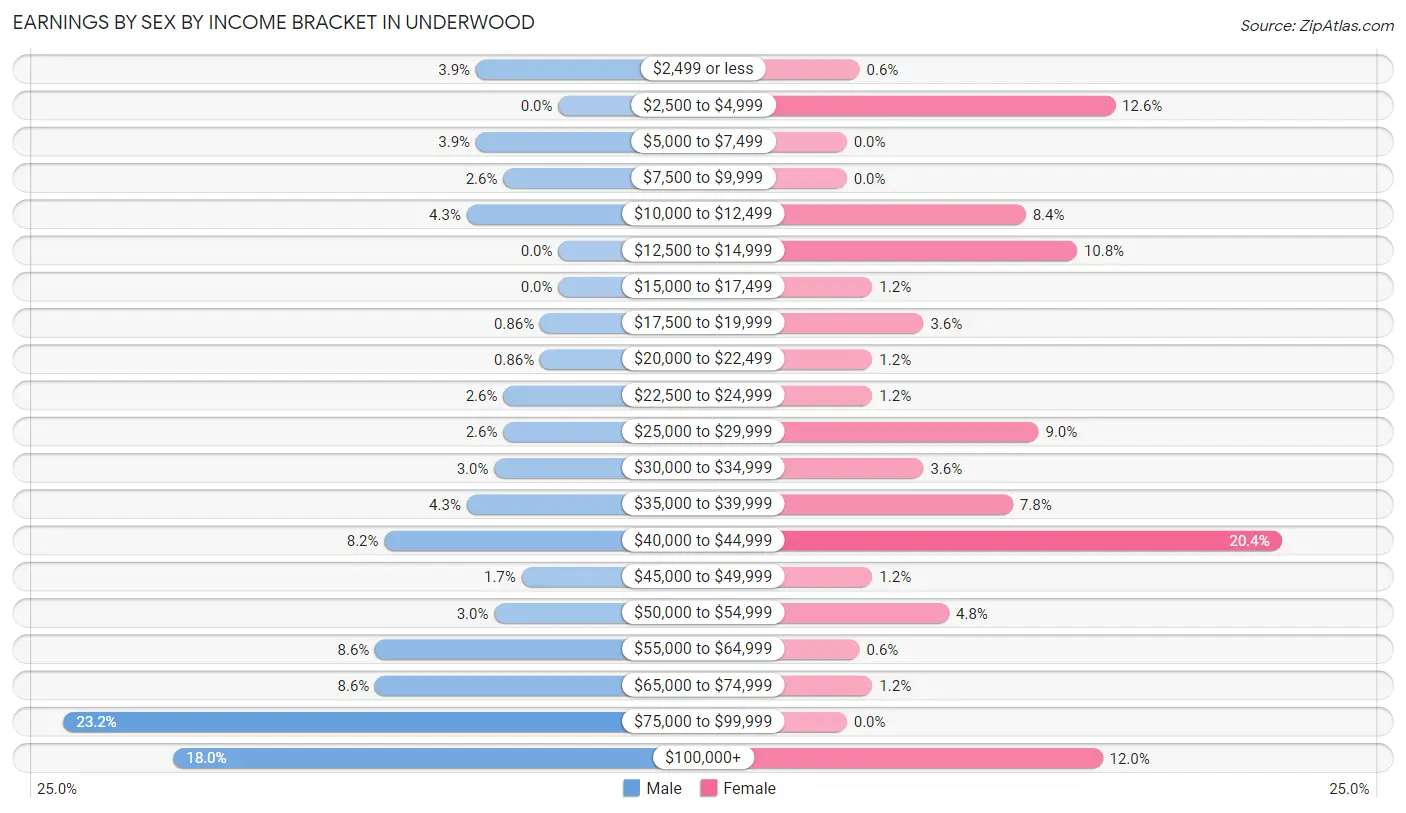
Earnings by Sex by Income Bracket in Underwood
The most common earnings brackets in Underwood are $75,000 to $99,999 for men (54 | 23.2%) and $40,000 to $44,999 for women (34 | 20.4%).
| Income | Male | Female |
| $2,499 or less | 9 (3.9%) | 1 (0.6%) |
| $2,500 to $4,999 | 0 (0.0%) | 21 (12.6%) |
| $5,000 to $7,499 | 9 (3.9%) | 0 (0.0%) |
| $7,500 to $9,999 | 6 (2.6%) | 0 (0.0%) |
| $10,000 to $12,499 | 10 (4.3%) | 14 (8.4%) |
| $12,500 to $14,999 | 0 (0.0%) | 18 (10.8%) |
| $15,000 to $17,499 | 0 (0.0%) | 2 (1.2%) |
| $17,500 to $19,999 | 2 (0.9%) | 6 (3.6%) |
| $20,000 to $22,499 | 2 (0.9%) | 2 (1.2%) |
| $22,500 to $24,999 | 6 (2.6%) | 2 (1.2%) |
| $25,000 to $29,999 | 6 (2.6%) | 15 (9.0%) |
| $30,000 to $34,999 | 7 (3.0%) | 6 (3.6%) |
| $35,000 to $39,999 | 10 (4.3%) | 13 (7.8%) |
| $40,000 to $44,999 | 19 (8.2%) | 34 (20.4%) |
| $45,000 to $49,999 | 4 (1.7%) | 2 (1.2%) |
| $50,000 to $54,999 | 7 (3.0%) | 8 (4.8%) |
| $55,000 to $64,999 | 20 (8.6%) | 1 (0.6%) |
| $65,000 to $74,999 | 20 (8.6%) | 2 (1.2%) |
| $75,000 to $99,999 | 54 (23.2%) | 0 (0.0%) |
| $100,000+ | 42 (18.0%) | 20 (12.0%) |
| Total | 233 (100.0%) | 167 (100.0%) |
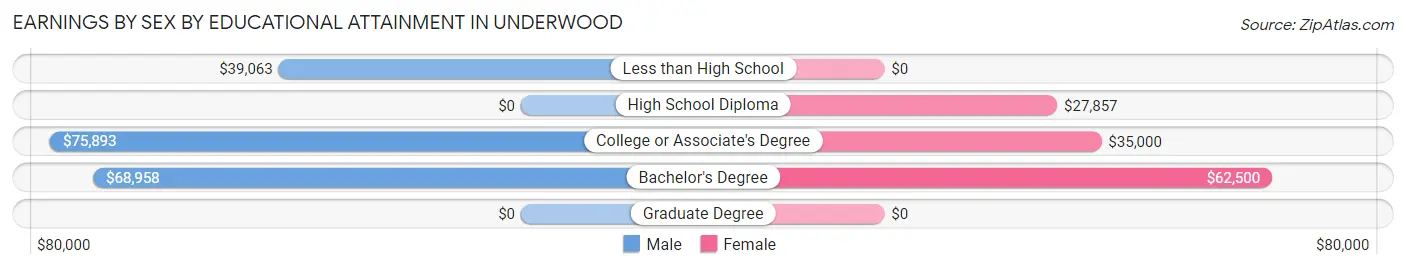
Earnings by Sex by Educational Attainment in Underwood
Average earnings in Underwood are $70,568 for men and $35,417 for women, a difference of 49.8%. Men with an educational attainment of college or associate's degree enjoy the highest average annual earnings of $75,893, while those with less than high school education earn the least with $39,063. Women with an educational attainment of bachelor's degree earn the most with the average annual earnings of $62,500, while those with high school diploma education have the smallest earnings of $27,857.
| Educational Attainment | Male Income | Female Income |
| Less than High School | $39,063 | $0 |
| High School Diploma | - | - |
| College or Associate's Degree | $75,893 | $35,000 |
| Bachelor's Degree | $68,958 | $62,500 |
| Graduate Degree | - | - |
| Total | $70,568 | $35,417 |
Family Income in Underwood
Family Income Brackets in Underwood
According to the Underwood family income data, there are 55 families falling into the $100,000 to $149,999 income range, which is the most common income bracket and makes up 26.3% of all families.
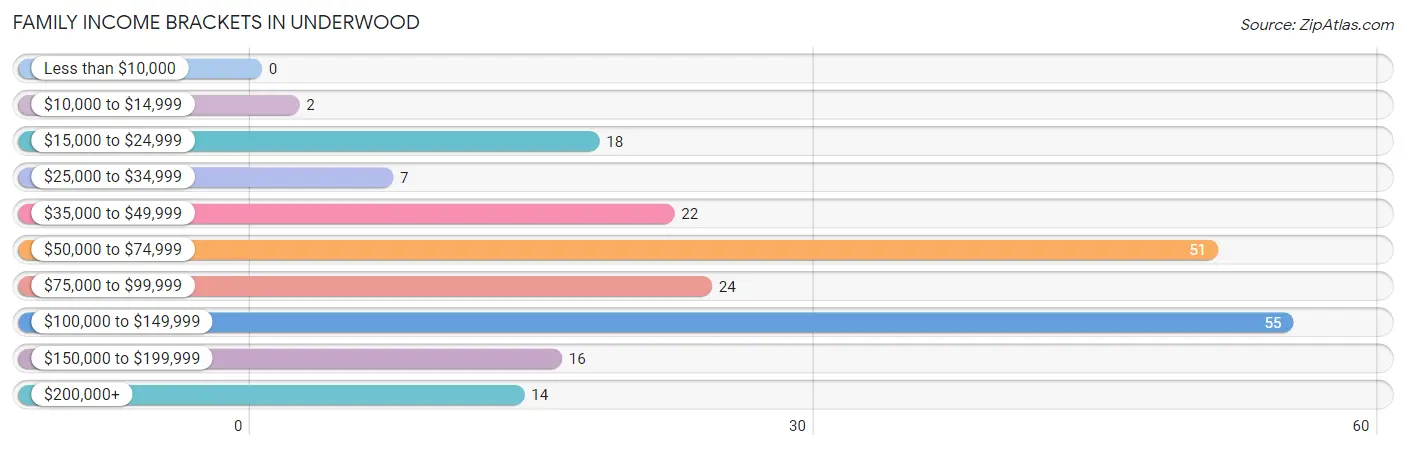
| Income Bracket | # Families | % Families |
| Less than $10,000 | 0 | 0.0% |
| $10,000 to $14,999 | 2 | 1.0% |
| $15,000 to $24,999 | 18 | 8.6% |
| $25,000 to $34,999 | 7 | 3.3% |
| $35,000 to $49,999 | 22 | 10.5% |
| $50,000 to $74,999 | 51 | 24.4% |
| $75,000 to $99,999 | 24 | 11.5% |
| $100,000 to $149,999 | 55 | 26.3% |
| $150,000 to $199,999 | 16 | 7.7% |
| $200,000+ | 14 | 6.7% |
Family Income by Famaliy Size in Underwood
4-person families (10 | 4.8%) account for the highest median family income in Underwood with $170,625 per family, while 4-person families (10 | 4.8%) have the highest median income of $42,656 per family member.
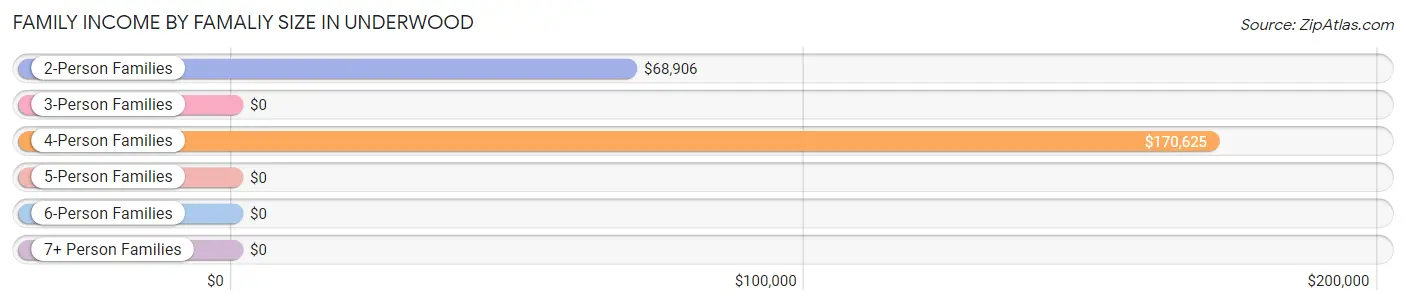
| Income Bracket | # Families | Median Income |
| 2-Person Families | 143 (68.4%) | $68,906 |
| 3-Person Families | 25 (12.0%) | $0 |
| 4-Person Families | 10 (4.8%) | $170,625 |
| 5-Person Families | 15 (7.2%) | $0 |
| 6-Person Families | 11 (5.3%) | $0 |
| 7+ Person Families | 5 (2.4%) | $0 |
| Total | 209 (100.0%) | $85,938 |
Family Income by Number of Earners in Underwood
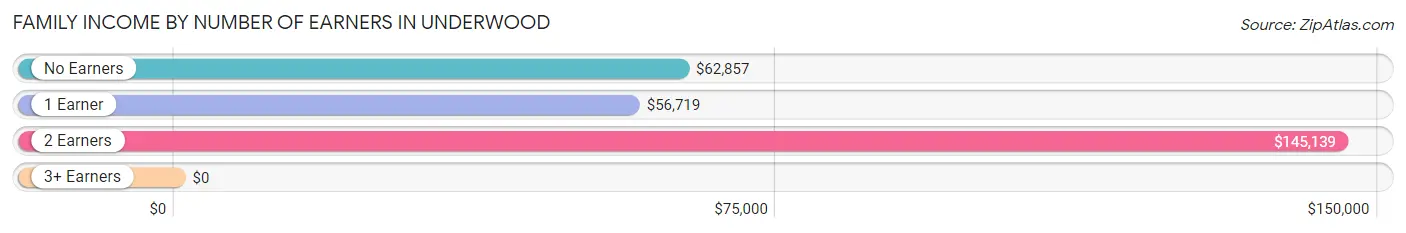
| Number of Earners | # Families | Median Income |
| No Earners | 46 (22.0%) | $62,857 |
| 1 Earner | 51 (24.4%) | $56,719 |
| 2 Earners | 99 (47.4%) | $145,139 |
| 3+ Earners | 13 (6.2%) | $0 |
| Total | 209 (100.0%) | $85,938 |
Household Income in Underwood
Household Income Brackets in Underwood
With 68 households falling in the category, the $100,000 to $149,999 income range is the most frequent in Underwood, accounting for 19.8% of all households. In contrast, only 8 households (2.3%) fall into the less than $10,000 income bracket, making it the least populous group.
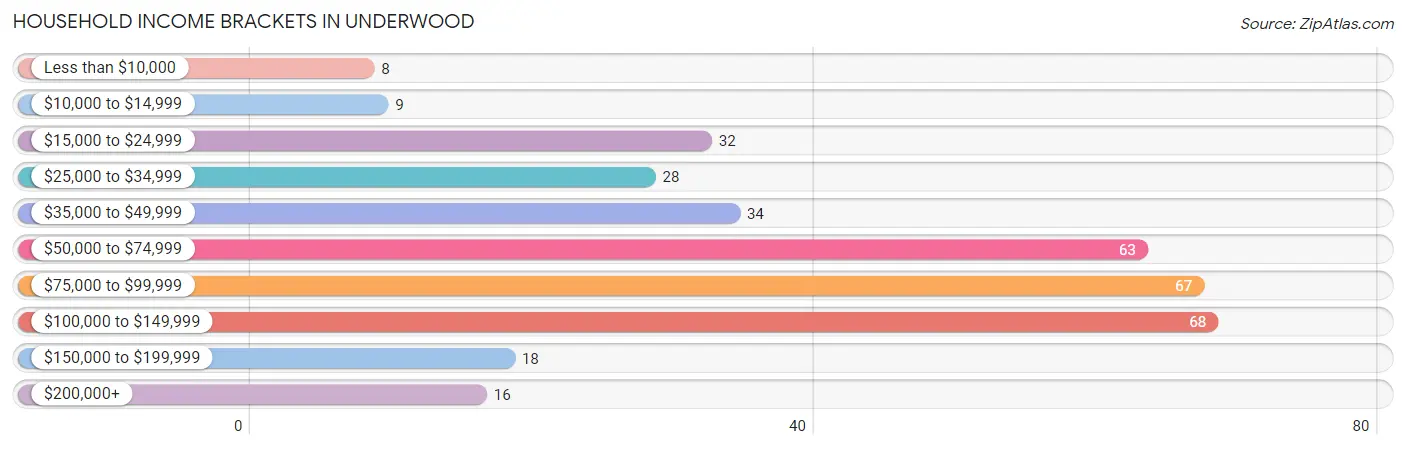
| Income Bracket | # Households | % Households |
| Less than $10,000 | 8 | 2.3% |
| $10,000 to $14,999 | 9 | 2.6% |
| $15,000 to $24,999 | 32 | 9.3% |
| $25,000 to $34,999 | 28 | 8.2% |
| $35,000 to $49,999 | 34 | 9.9% |
| $50,000 to $74,999 | 63 | 18.4% |
| $75,000 to $99,999 | 67 | 19.5% |
| $100,000 to $149,999 | 68 | 19.8% |
| $150,000 to $199,999 | 18 | 5.2% |
| $200,000+ | 16 | 4.7% |
Household Income by Householder Age in Underwood
The median household income in Underwood is $72,917, with the highest median household income of $119,792 found in the 25 to 44 years age bracket for the primary householder. A total of 77 households (22.5%) fall into this category. Meanwhile, the 15 to 24 years age bracket for the primary householder has the lowest median household income of $0, with 25 households (7.3%) in this group.
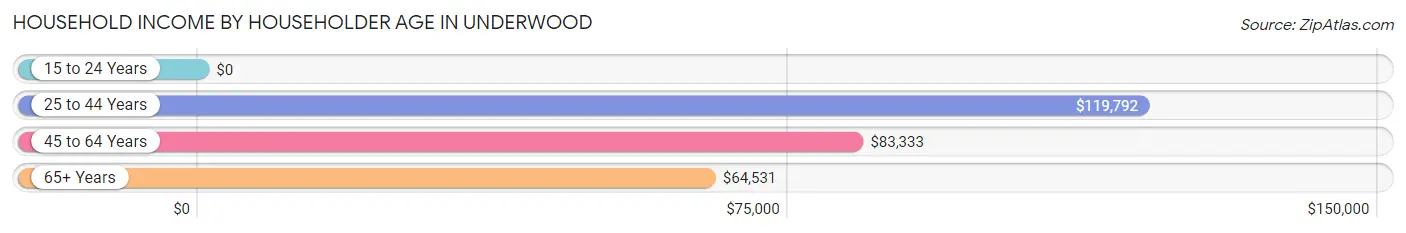
| Income Bracket | # Households | Median Income |
| 15 to 24 Years | 25 (7.3%) | $0 |
| 25 to 44 Years | 77 (22.5%) | $119,792 |
| 45 to 64 Years | 130 (37.9%) | $83,333 |
| 65+ Years | 111 (32.4%) | $64,531 |
| Total | 343 (100.0%) | $72,917 |
Poverty in Underwood
Income Below Poverty by Sex and Age in Underwood
With 5.1% poverty level for males and 9.9% for females among the residents of Underwood, 12 to 14 year old males and 5 year old females are the most vulnerable to poverty, with 3 males (50.0%) and 3 females (60.0%) in their respective age groups living below the poverty level.
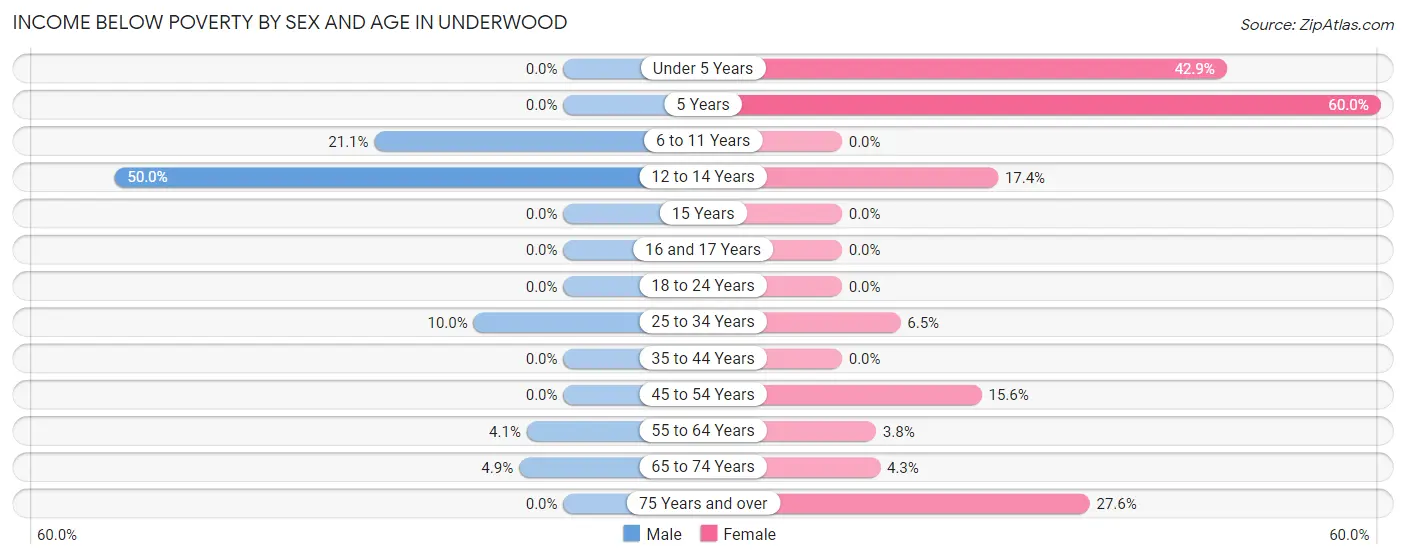
| Age Bracket | Male | Female |
| Under 5 Years | 0 (0.0%) | 6 (42.9%) |
| 5 Years | 0 (0.0%) | 3 (60.0%) |
| 6 to 11 Years | 4 (21.0%) | 0 (0.0%) |
| 12 to 14 Years | 3 (50.0%) | 4 (17.4%) |
| 15 Years | 0 (0.0%) | 0 (0.0%) |
| 16 and 17 Years | 0 (0.0%) | 0 (0.0%) |
| 18 to 24 Years | 0 (0.0%) | 0 (0.0%) |
| 25 to 34 Years | 5 (10.0%) | 3 (6.5%) |
| 35 to 44 Years | 0 (0.0%) | 0 (0.0%) |
| 45 to 54 Years | 0 (0.0%) | 7 (15.6%) |
| 55 to 64 Years | 2 (4.1%) | 3 (3.8%) |
| 65 to 74 Years | 4 (4.9%) | 2 (4.3%) |
| 75 Years and over | 0 (0.0%) | 8 (27.6%) |
| Total | 18 (5.1%) | 36 (9.9%) |
Income Above Poverty by Sex and Age in Underwood
According to the poverty statistics in Underwood, males aged under 5 years and females aged 6 to 11 years are the age groups that are most secure financially, with 100.0% of males and 100.0% of females in these age groups living above the poverty line.
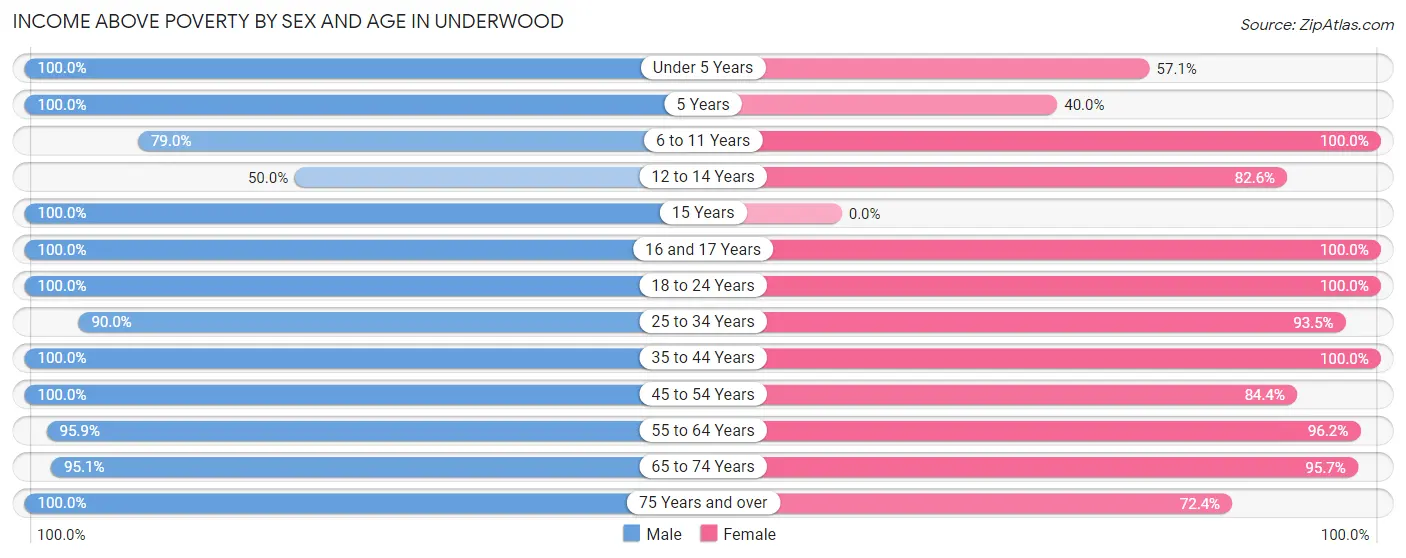
| Age Bracket | Male | Female |
| Under 5 Years | 6 (100.0%) | 8 (57.1%) |
| 5 Years | 9 (100.0%) | 2 (40.0%) |
| 6 to 11 Years | 15 (78.9%) | 28 (100.0%) |
| 12 to 14 Years | 3 (50.0%) | 19 (82.6%) |
| 15 Years | 3 (100.0%) | 0 (0.0%) |
| 16 and 17 Years | 11 (100.0%) | 12 (100.0%) |
| 18 to 24 Years | 31 (100.0%) | 10 (100.0%) |
| 25 to 34 Years | 45 (90.0%) | 43 (93.5%) |
| 35 to 44 Years | 26 (100.0%) | 26 (100.0%) |
| 45 to 54 Years | 50 (100.0%) | 38 (84.4%) |
| 55 to 64 Years | 47 (95.9%) | 76 (96.2%) |
| 65 to 74 Years | 77 (95.1%) | 45 (95.7%) |
| 75 Years and over | 15 (100.0%) | 21 (72.4%) |
| Total | 338 (94.9%) | 328 (90.1%) |
Income Below Poverty Among Married-Couple Families in Underwood
The poverty statistics for married-couple families in Underwood show that 3.7% or 7 of the total 187 families live below the poverty line. Families with 5 or more children have the highest poverty rate of 100.0%, comprising of 5 families. On the other hand, families with 1 or 2 children have the lowest poverty rate of 0.0%, which includes 0 families.
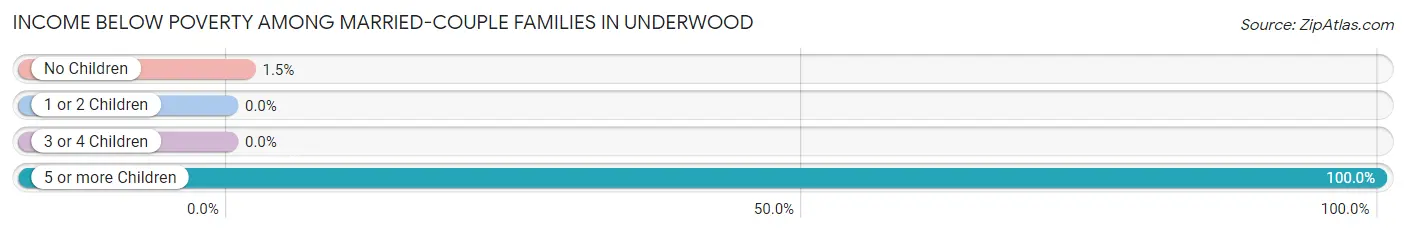
| Children | Above Poverty | Below Poverty |
| No Children | 130 (98.5%) | 2 (1.5%) |
| 1 or 2 Children | 28 (100.0%) | 0 (0.0%) |
| 3 or 4 Children | 22 (100.0%) | 0 (0.0%) |
| 5 or more Children | 0 (0.0%) | 5 (100.0%) |
| Total | 180 (96.3%) | 7 (3.7%) |
Income Below Poverty Among Single-Parent Households in Underwood
| Children | Single Father | Single Mother |
| No Children | 0 (0.0%) | 0 (0.0%) |
| 1 or 2 Children | 0 (0.0%) | 0 (0.0%) |
| 3 or 4 Children | 0 (0.0%) | 0 (0.0%) |
| 5 or more Children | 0 (0.0%) | 0 (0.0%) |
| Total | 0 (0.0%) | 0 (0.0%) |
Income Below Poverty Among Married-Couple vs Single-Parent Households in Underwood
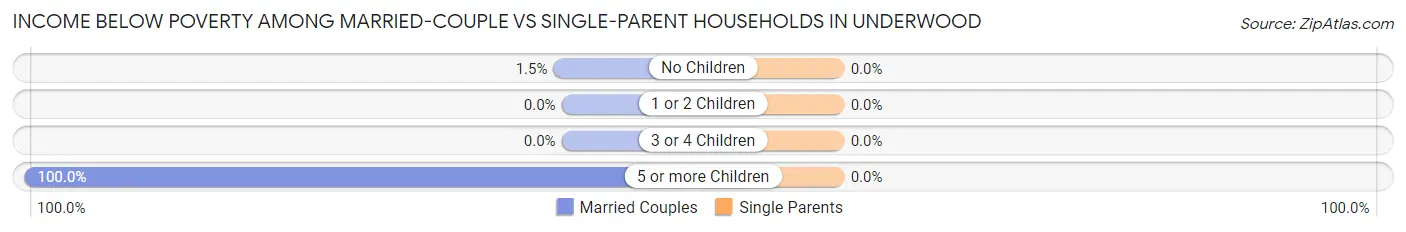
| Children | Married-Couple Families | Single-Parent Households |
| No Children | 2 (1.5%) | 0 (0.0%) |
| 1 or 2 Children | 0 (0.0%) | 0 (0.0%) |
| 3 or 4 Children | 0 (0.0%) | 0 (0.0%) |
| 5 or more Children | 5 (100.0%) | 0 (0.0%) |
| Total | 7 (3.7%) | 0 (0.0%) |
Race in Underwood
The most populous races in Underwood are White / Caucasian (637 | 87.0%), Two or more Races (43 | 5.9%), and Asian (22 | 3.0%).
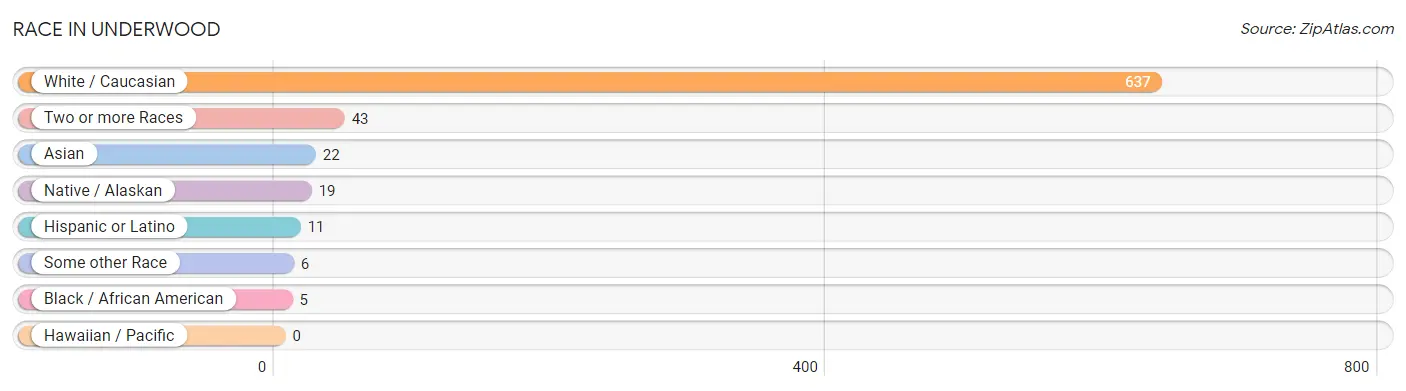
| Race | # Population | % Population |
| Asian | 22 | 3.0% |
| Black / African American | 5 | 0.7% |
| Hawaiian / Pacific | 0 | 0.0% |
| Hispanic or Latino | 11 | 1.5% |
| Native / Alaskan | 19 | 2.6% |
| White / Caucasian | 637 | 87.0% |
| Two or more Races | 43 | 5.9% |
| Some other Race | 6 | 0.8% |
| Total | 732 | 100.0% |
Ancestry in Underwood
The most populous ancestries reported in Underwood are German (223 | 30.5%), Norwegian (117 | 16.0%), English (41 | 5.6%), Irish (33 | 4.5%), and French (27 | 3.7%), together accounting for 60.2% of all Underwood residents.
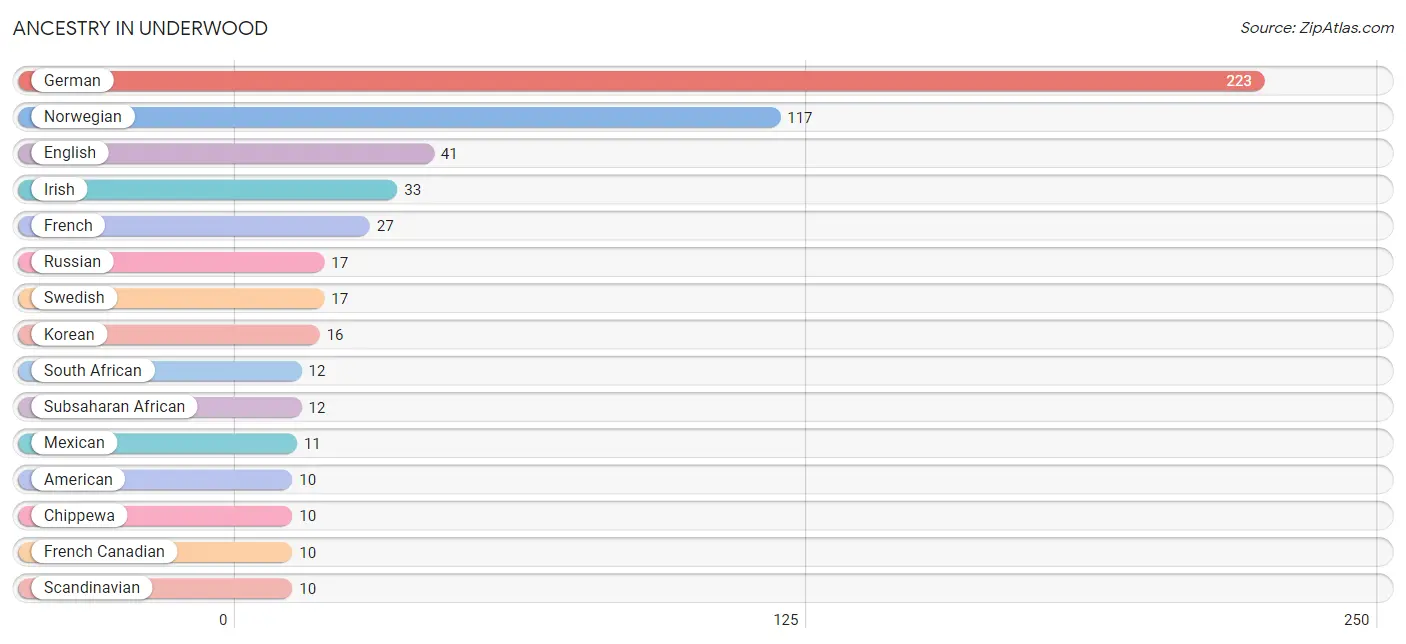
| Ancestry | # Population | % Population |
| American | 10 | 1.4% |
| Bhutanese | 6 | 0.8% |
| British | 5 | 0.7% |
| Canadian | 4 | 0.5% |
| Chippewa | 10 | 1.4% |
| Czech | 3 | 0.4% |
| Danish | 5 | 0.7% |
| Dutch | 3 | 0.4% |
| English | 41 | 5.6% |
| Finnish | 5 | 0.7% |
| French | 27 | 3.7% |
| French Canadian | 10 | 1.4% |
| German | 223 | 30.5% |
| Greek | 4 | 0.5% |
| Hungarian | 2 | 0.3% |
| Irish | 33 | 4.5% |
| Italian | 4 | 0.5% |
| Korean | 16 | 2.2% |
| Mexican | 11 | 1.5% |
| Norwegian | 117 | 16.0% |
| Polish | 4 | 0.5% |
| Russian | 17 | 2.3% |
| Scandinavian | 10 | 1.4% |
| South African | 12 | 1.6% |
| Subsaharan African | 12 | 1.6% |
| Swedish | 17 | 2.3% |
| Ukrainian | 1 | 0.1% | View All 27 Rows |
Immigrants in Underwood
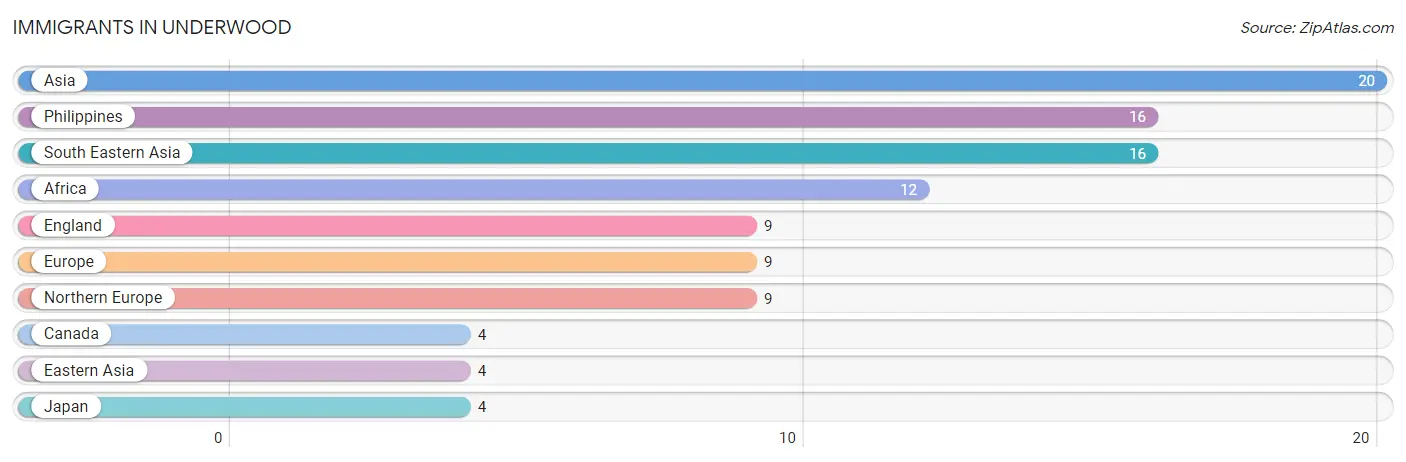
The most numerous immigrant groups reported in Underwood came from Asia (20 | 2.7%), Philippines (16 | 2.2%), South Eastern Asia (16 | 2.2%), Africa (12 | 1.6%), and England (9 | 1.2%), together accounting for 10.0% of all Underwood residents.
| Immigration Origin | # Population | % Population |
| Africa | 12 | 1.6% |
| Asia | 20 | 2.7% |
| Canada | 4 | 0.5% |
| Eastern Asia | 4 | 0.5% |
| England | 9 | 1.2% |
| Europe | 9 | 1.2% |
| Japan | 4 | 0.5% |
| Northern Europe | 9 | 1.2% |
| Philippines | 16 | 2.2% |
| South Eastern Asia | 16 | 2.2% | View All 10 Rows |
Sex and Age in Underwood
Sex and Age in Underwood
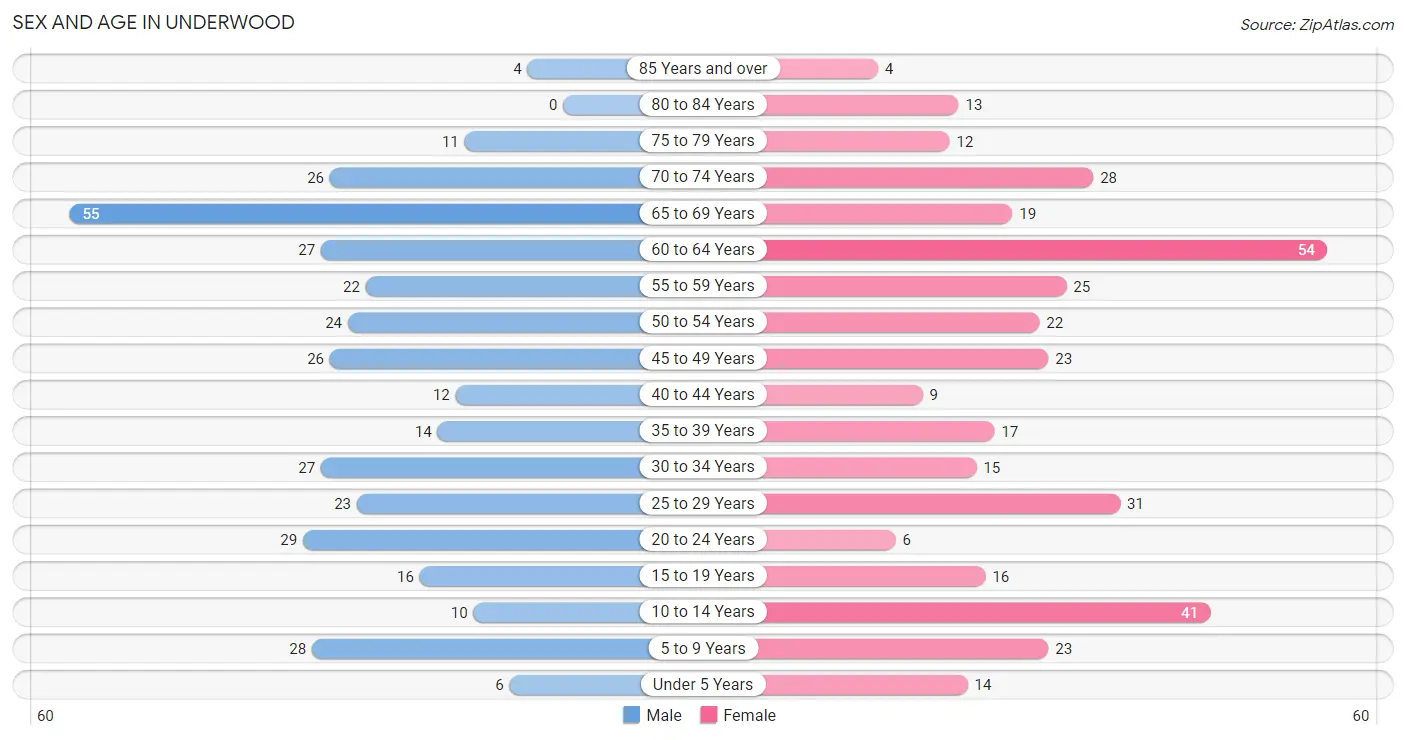
The most populous age groups in Underwood are 65 to 69 Years (55 | 15.3%) for men and 60 to 64 Years (54 | 14.5%) for women.
| Age Bracket | Male | Female |
| Under 5 Years | 6 (1.7%) | 14 (3.8%) |
| 5 to 9 Years | 28 (7.8%) | 23 (6.2%) |
| 10 to 14 Years | 10 (2.8%) | 41 (11.0%) |
| 15 to 19 Years | 16 (4.4%) | 16 (4.3%) |
| 20 to 24 Years | 29 (8.1%) | 6 (1.6%) |
| 25 to 29 Years | 23 (6.4%) | 31 (8.3%) |
| 30 to 34 Years | 27 (7.5%) | 15 (4.0%) |
| 35 to 39 Years | 14 (3.9%) | 17 (4.6%) |
| 40 to 44 Years | 12 (3.3%) | 9 (2.4%) |
| 45 to 49 Years | 26 (7.2%) | 23 (6.2%) |
| 50 to 54 Years | 24 (6.7%) | 22 (5.9%) |
| 55 to 59 Years | 22 (6.1%) | 25 (6.7%) |
| 60 to 64 Years | 27 (7.5%) | 54 (14.5%) |
| 65 to 69 Years | 55 (15.3%) | 19 (5.1%) |
| 70 to 74 Years | 26 (7.2%) | 28 (7.5%) |
| 75 to 79 Years | 11 (3.1%) | 12 (3.2%) |
| 80 to 84 Years | 0 (0.0%) | 13 (3.5%) |
| 85 Years and over | 4 (1.1%) | 4 (1.1%) |
| Total | 360 (100.0%) | 372 (100.0%) |
Families and Households in Underwood
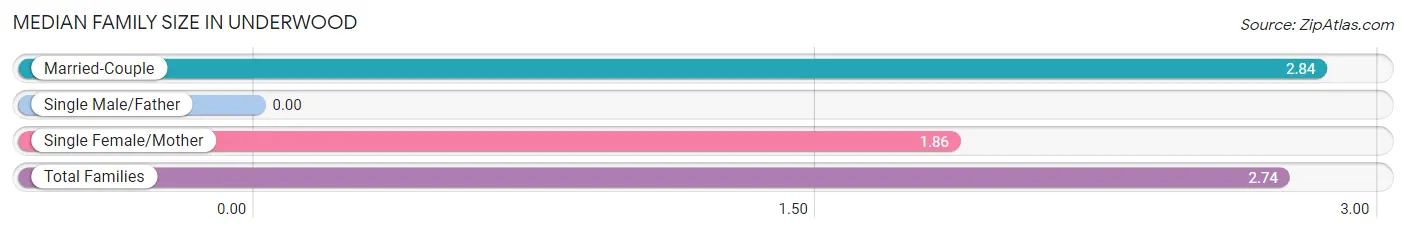
Median Family Size in Underwood
| Family Type | # Families | Family Size |
| Married-Couple | 187 (89.5%) | 2.84 |
| Single Male/Father | 0 (0.0%) | - |
| Single Female/Mother | 22 (10.5%) | 1.86 |
| Total Families | 209 (100.0%) | 2.74 |
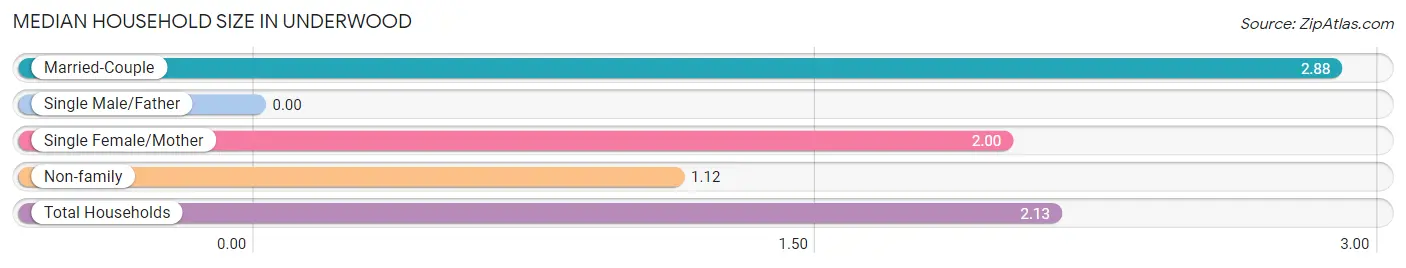
Median Household Size in Underwood
| Household Type | # Households | Household Size |
| Married-Couple | 187 (54.5%) | 2.88 |
| Single Male/Father | 0 (0.0%) | - |
| Single Female/Mother | 22 (6.4%) | 2.00 |
| Non-family | 134 (39.1%) | 1.12 |
| Total Households | 343 (100.0%) | 2.13 |
Household Size by Marriage Status in Underwood
Out of a total of 343 households in Underwood, 209 (60.9%) are family households, while 134 (39.1%) are nonfamily households. The most numerous type of family households are 2-person households, comprising 140, and the most common type of nonfamily households are 1-person households, comprising 119.
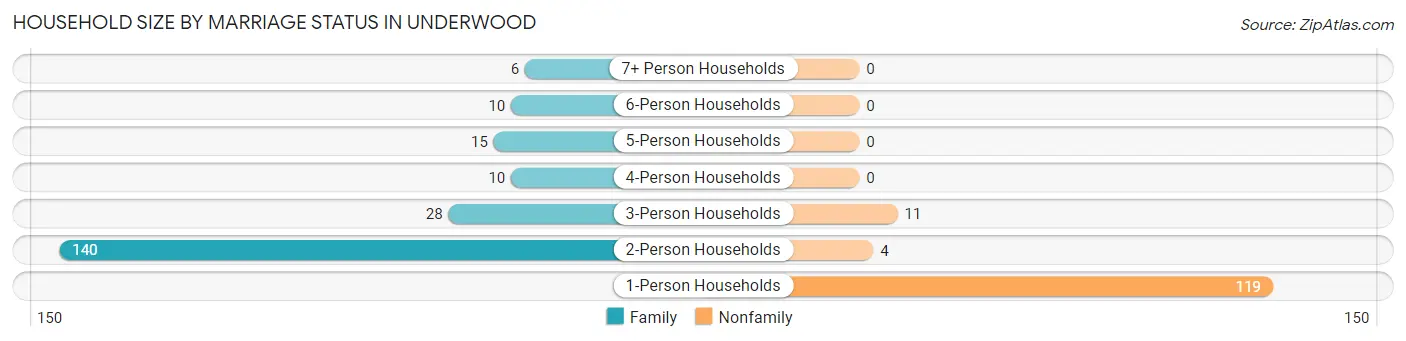
| Household Size | Family Households | Nonfamily Households |
| 1-Person Households | - | 119 (34.7%) |
| 2-Person Households | 140 (40.8%) | 4 (1.2%) |
| 3-Person Households | 28 (8.2%) | 11 (3.2%) |
| 4-Person Households | 10 (2.9%) | 0 (0.0%) |
| 5-Person Households | 15 (4.4%) | 0 (0.0%) |
| 6-Person Households | 10 (2.9%) | 0 (0.0%) |
| 7+ Person Households | 6 (1.8%) | 0 (0.0%) |
| Total | 209 (60.9%) | 134 (39.1%) |
Female Fertility in Underwood
Fertility by Age in Underwood
Average fertility rate in Underwood is 145.0 births per 1,000 women. Women in the age bracket of 35 to 50 years have the highest fertility rate with 327.0 births per 1,000 women. Women in the age bracket of 35 to 50 years acount for 94.1% of all women with births.
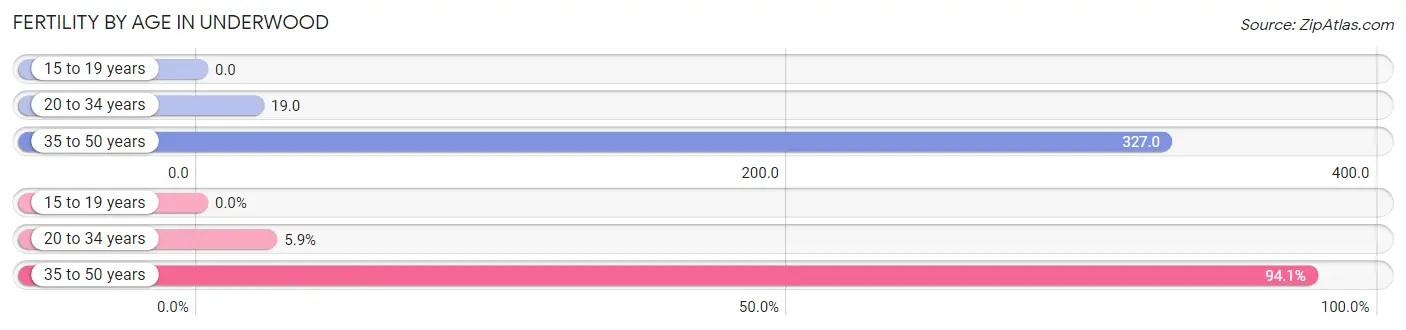
| Age Bracket | Women with Births | Births / 1,000 Women |
| 15 to 19 years | 0 (0.0%) | 0.0 |
| 20 to 34 years | 1 (5.9%) | 19.0 |
| 35 to 50 years | 16 (94.1%) | 327.0 |
| Total | 17 (100.0%) | 145.0 |
Fertility by Age by Marriage Status in Underwood
58.8% of women with births (17) in Underwood are married. The highest percentage of unmarried women with births falls into 35 to 50 years age bracket with 43.8% of them unmarried at the time of birth, while the lowest percentage of unmarried women with births belong to 20 to 34 years age bracket with 0.0% of them unmarried.
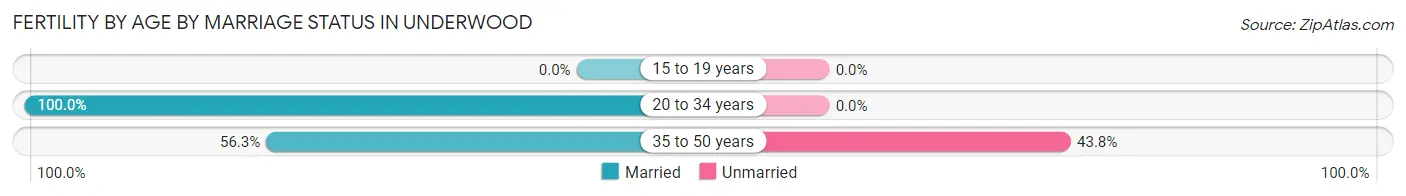
| Age Bracket | Married | Unmarried |
| 15 to 19 years | 0 (0.0%) | 0 (0.0%) |
| 20 to 34 years | 1 (100.0%) | 0 (0.0%) |
| 35 to 50 years | 9 (56.2%) | 7 (43.8%) |
| Total | 10 (58.8%) | 7 (41.2%) |
Fertility by Education in Underwood
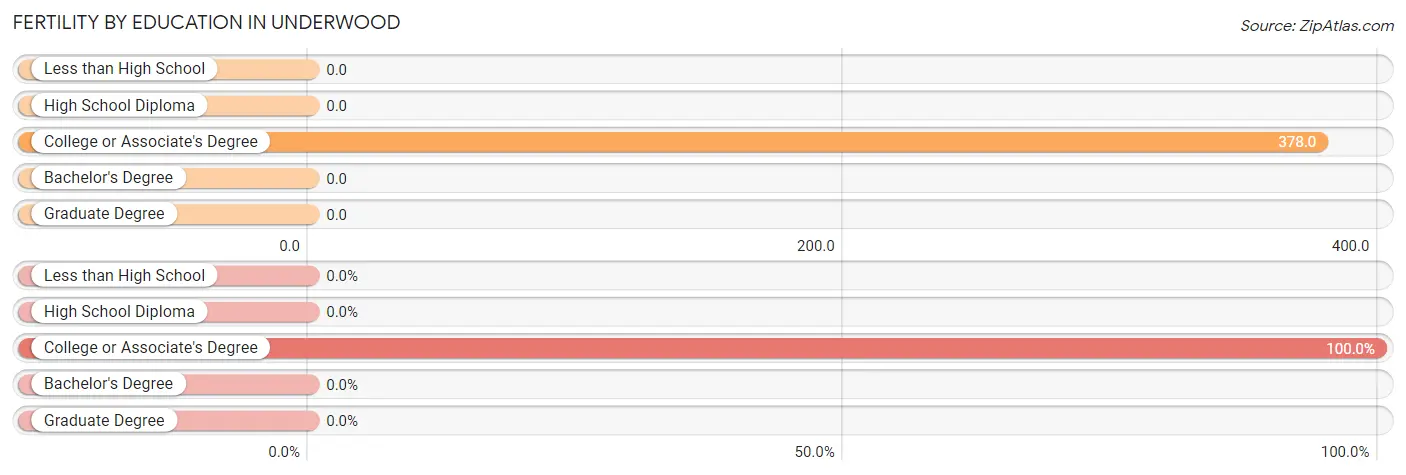
| Educational Attainment | Women with Births | Births / 1,000 Women |
| Less than High School | 0 (0.0%) | 0.0 |
| High School Diploma | 0 (0.0%) | 0.0 |
| College or Associate's Degree | 17 (100.0%) | 378.0 |
| Bachelor's Degree | 0 (0.0%) | 0.0 |
| Graduate Degree | 0 (0.0%) | 0.0 |
| Total | 17 (100.0%) | 145.0 |
Fertility by Education by Marriage Status in Underwood
41.2% of women with births in Underwood are unmarried. Women with the educational attainment of college or associate's degree are most likely to be married with 58.8% of them married at childbirth, while women with the educational attainment of college or associate's degree are least likely to be married with 41.2% of them unmarried at childbirth.
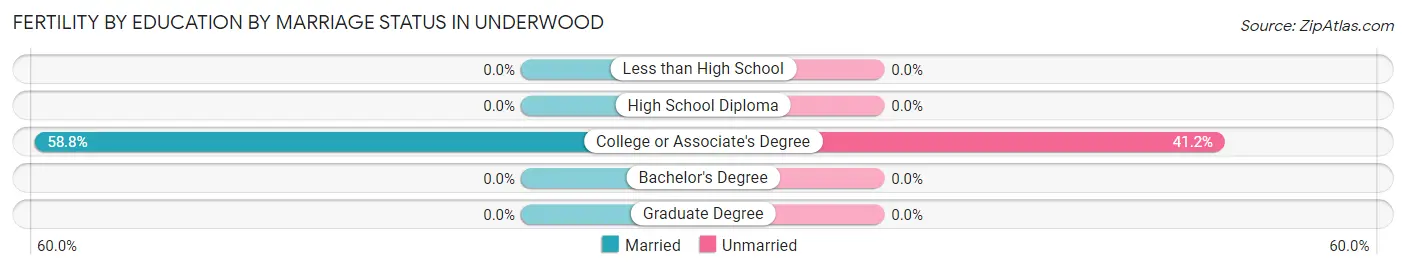
| Educational Attainment | Married | Unmarried |
| Less than High School | 0 (0.0%) | 0 (0.0%) |
| High School Diploma | 0 (0.0%) | 0 (0.0%) |
| College or Associate's Degree | 10 (58.8%) | 7 (41.2%) |
| Bachelor's Degree | 0 (0.0%) | 0 (0.0%) |
| Graduate Degree | 0 (0.0%) | 0 (0.0%) |
| Total | 10 (58.8%) | 7 (41.2%) |
Employment Characteristics in Underwood
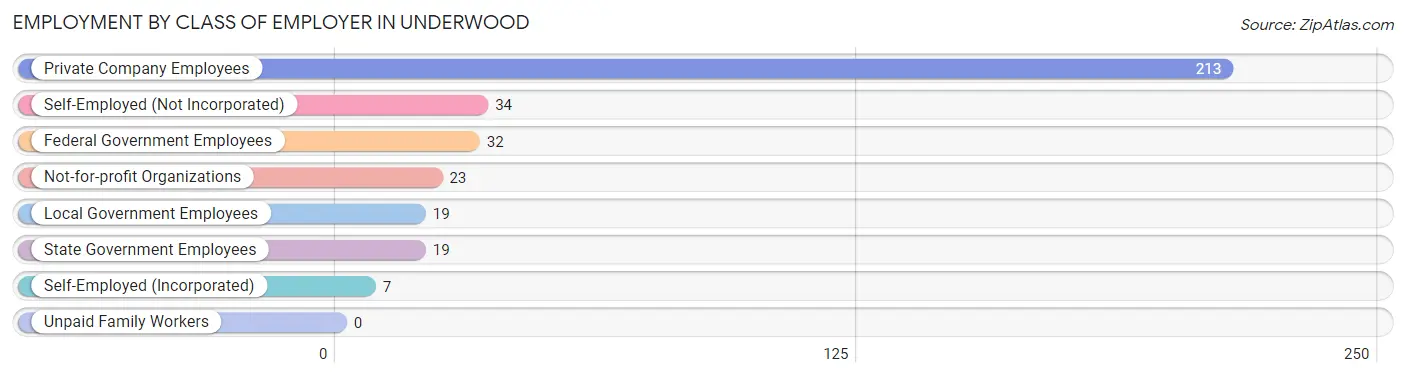
Employment by Class of Employer in Underwood
Among the 347 employed individuals in Underwood, private company employees (213 | 61.4%), self-employed (not incorporated) (34 | 9.8%), and federal government employees (32 | 9.2%) make up the most common classes of employment.
| Employer Class | # Employees | % Employees |
| Private Company Employees | 213 | 61.4% |
| Self-Employed (Incorporated) | 7 | 2.0% |
| Self-Employed (Not Incorporated) | 34 | 9.8% |
| Not-for-profit Organizations | 23 | 6.6% |
| Local Government Employees | 19 | 5.5% |
| State Government Employees | 19 | 5.5% |
| Federal Government Employees | 32 | 9.2% |
| Unpaid Family Workers | 0 | 0.0% |
| Total | 347 | 100.0% |
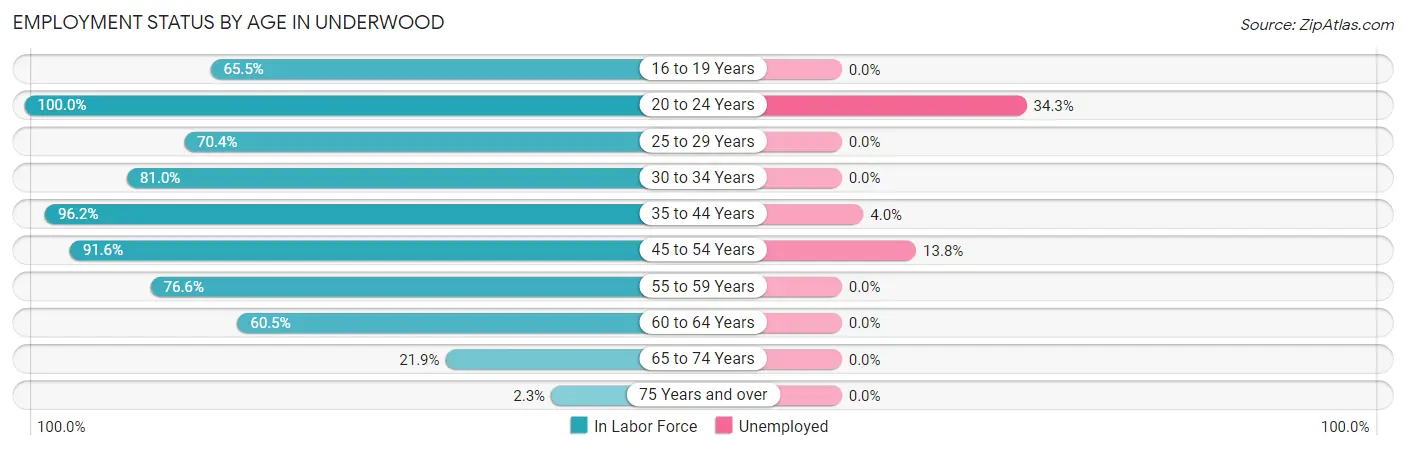
Employment Status by Age in Underwood
According to the labor force statistics for Underwood, out of the total population over 16 years of age (607), 62.1% or 377 individuals are in the labor force, with 6.9% or 26 of them unemployed. The age group with the highest labor force participation rate is 20 to 24 years, with 100.0% or 35 individuals in the labor force. Within the labor force, the 20 to 24 years age range has the highest percentage of unemployed individuals, with 34.3% or 12 of them being unemployed.
| Age Bracket | In Labor Force | Unemployed |
| 16 to 19 Years | 19 (65.5%) | 0 (0.0%) |
| 20 to 24 Years | 35 (100.0%) | 12 (34.3%) |
| 25 to 29 Years | 38 (70.4%) | 0 (0.0%) |
| 30 to 34 Years | 34 (81.0%) | 0 (0.0%) |
| 35 to 44 Years | 50 (96.2%) | 2 (4.0%) |
| 45 to 54 Years | 87 (91.6%) | 12 (13.8%) |
| 55 to 59 Years | 36 (76.6%) | 0 (0.0%) |
| 60 to 64 Years | 49 (60.5%) | 0 (0.0%) |
| 65 to 74 Years | 28 (21.9%) | 0 (0.0%) |
| 75 Years and over | 1 (2.3%) | 0 (0.0%) |
| Total | 377 (62.1%) | 26 (6.9%) |
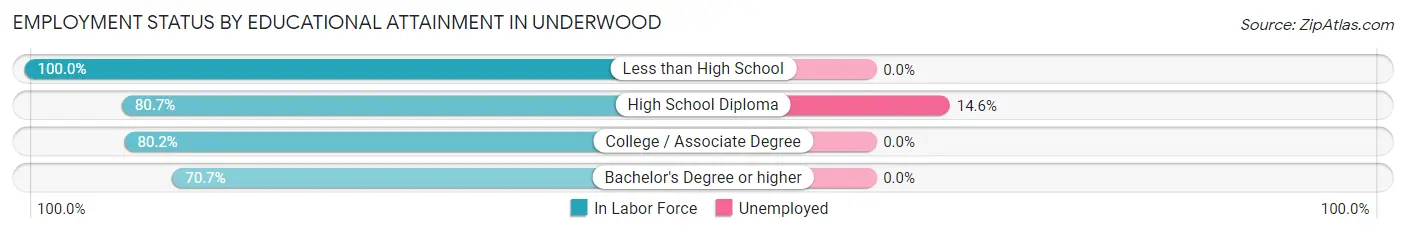
Employment Status by Educational Attainment in Underwood
According to labor force statistics for Underwood, 79.2% of individuals (294) out of the total population between 25 and 64 years of age (371) are in the labor force, with 4.8% or 14 of them being unemployed. The group with the highest labor force participation rate are those with the educational attainment of less than high school, with 100.0% or 15 individuals in the labor force. Within the labor force, individuals with high school diploma education have the highest percentage of unemployment, with 14.6% or 14 of them being unemployed.
| Educational Attainment | In Labor Force | Unemployed |
| Less than High School | 15 (100.0%) | 0 (0.0%) |
| High School Diploma | 96 (80.7%) | 17 (14.6%) |
| College / Associate Degree | 130 (80.2%) | 0 (0.0%) |
| Bachelor's Degree or higher | 53 (70.7%) | 0 (0.0%) |
| Total | 294 (79.2%) | 18 (4.8%) |
Employment Occupations by Sex in Underwood
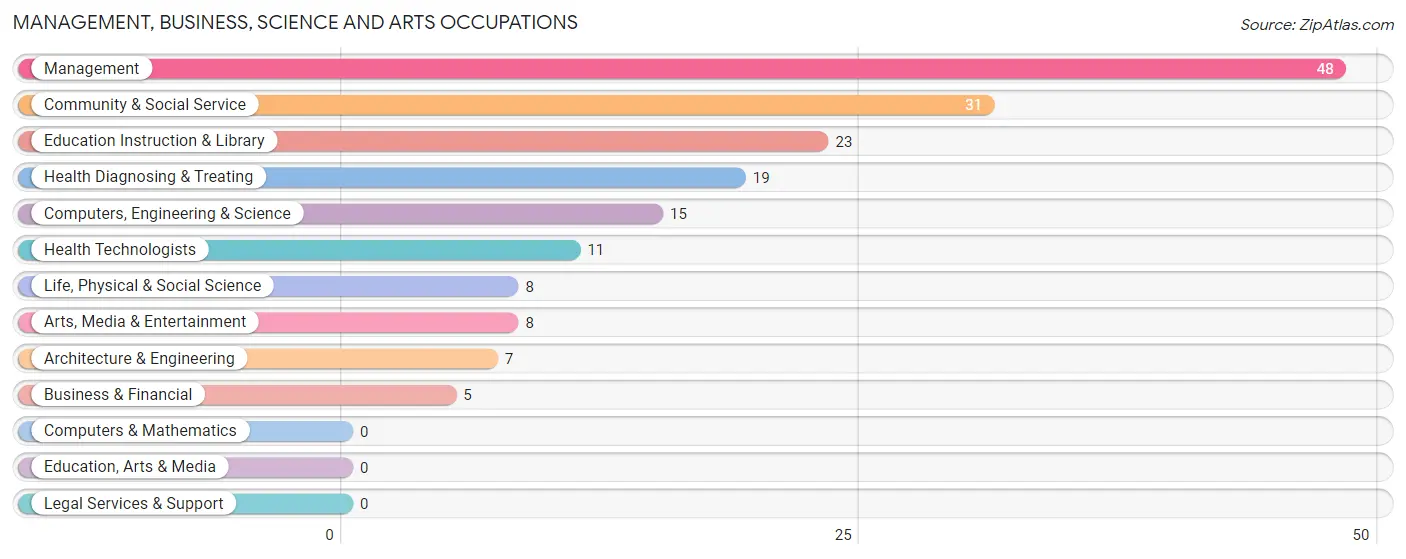
Management, Business, Science and Arts Occupations
The most common Management, Business, Science and Arts occupations in Underwood are Management (48 | 13.7%), Community & Social Service (31 | 8.8%), Education Instruction & Library (23 | 6.6%), Health Diagnosing & Treating (19 | 5.4%), and Computers, Engineering & Science (15 | 4.3%).
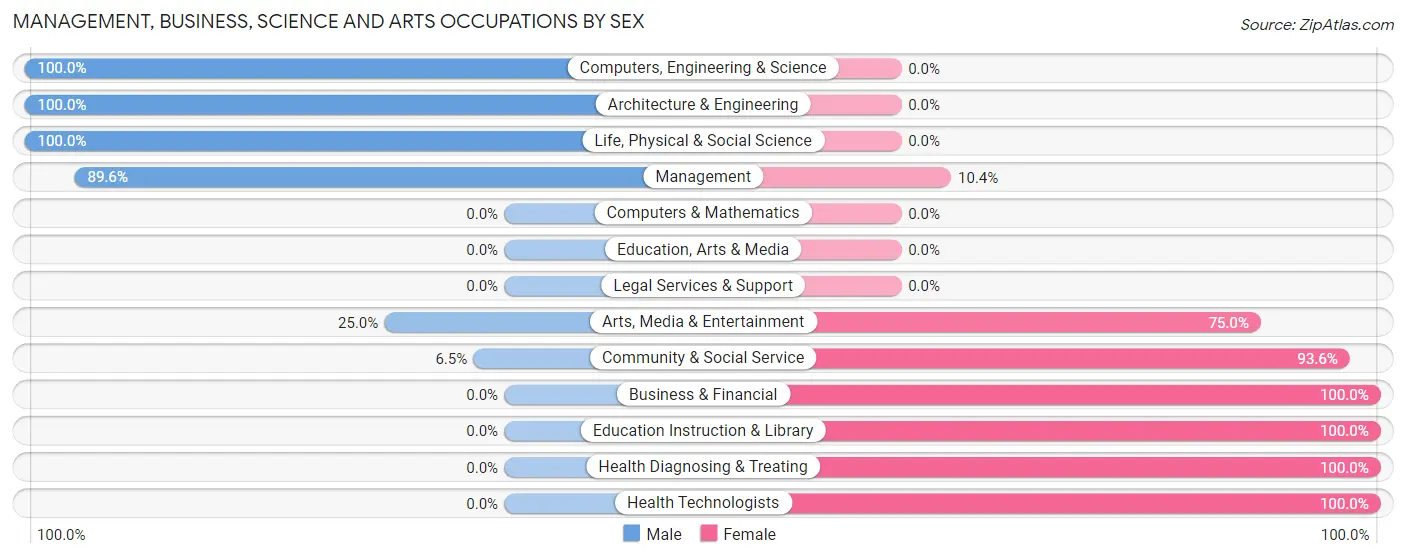
Management, Business, Science and Arts Occupations by Sex
Within the Management, Business, Science and Arts occupations in Underwood, the most male-oriented occupations are Computers, Engineering & Science (100.0%), Architecture & Engineering (100.0%), and Life, Physical & Social Science (100.0%), while the most female-oriented occupations are Business & Financial (100.0%), Education Instruction & Library (100.0%), and Health Diagnosing & Treating (100.0%).
| Occupation | Male | Female |
| Management | 43 (89.6%) | 5 (10.4%) |
| Business & Financial | 0 (0.0%) | 5 (100.0%) |
| Computers, Engineering & Science | 15 (100.0%) | 0 (0.0%) |
| Computers & Mathematics | 0 (0.0%) | 0 (0.0%) |
| Architecture & Engineering | 7 (100.0%) | 0 (0.0%) |
| Life, Physical & Social Science | 8 (100.0%) | 0 (0.0%) |
| Community & Social Service | 2 (6.5%) | 29 (93.5%) |
| Education, Arts & Media | 0 (0.0%) | 0 (0.0%) |
| Legal Services & Support | 0 (0.0%) | 0 (0.0%) |
| Education Instruction & Library | 0 (0.0%) | 23 (100.0%) |
| Arts, Media & Entertainment | 2 (25.0%) | 6 (75.0%) |
| Health Diagnosing & Treating | 0 (0.0%) | 19 (100.0%) |
| Health Technologists | 0 (0.0%) | 11 (100.0%) |
| Total (Category) | 60 (50.8%) | 58 (49.1%) |
| Total (Overall) | 206 (58.7%) | 145 (41.3%) |
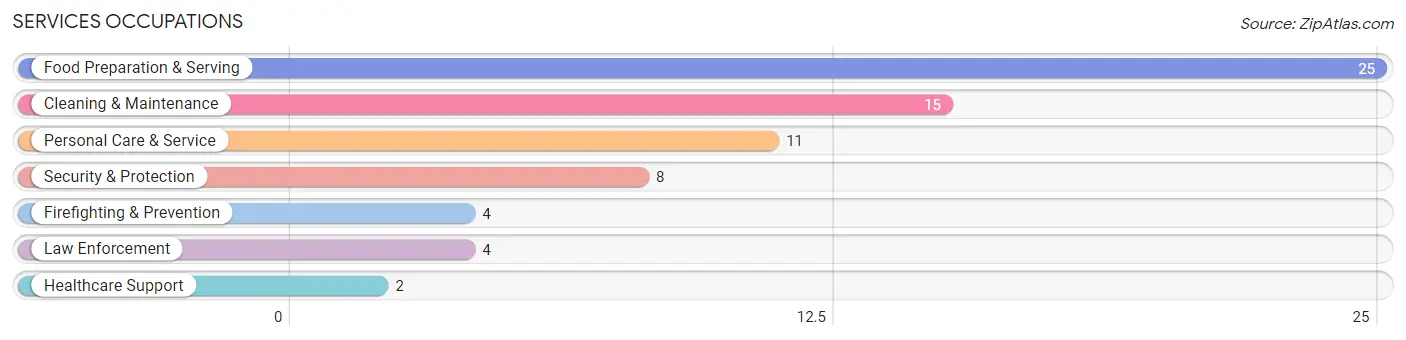
Services Occupations
The most common Services occupations in Underwood are Food Preparation & Serving (25 | 7.1%), Cleaning & Maintenance (15 | 4.3%), Personal Care & Service (11 | 3.1%), Security & Protection (8 | 2.3%), and Firefighting & Prevention (4 | 1.1%).
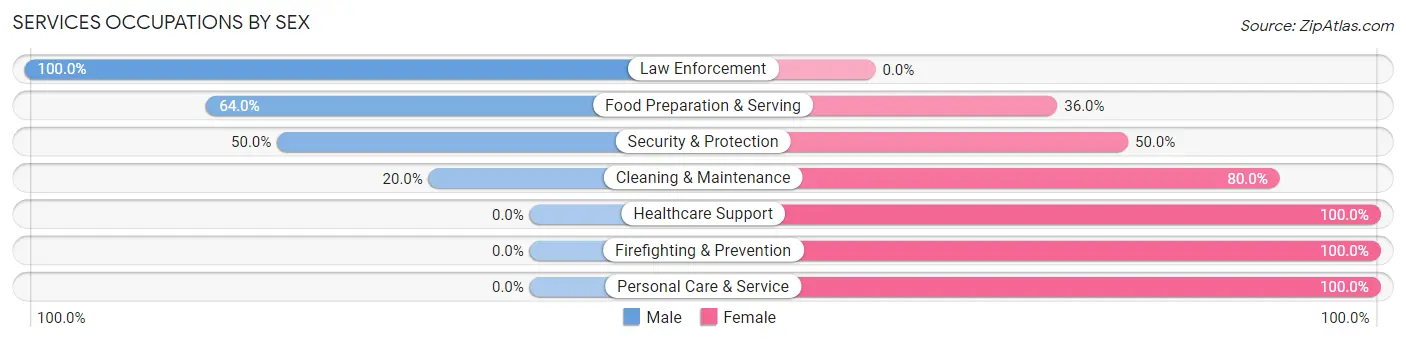
Services Occupations by Sex
Within the Services occupations in Underwood, the most male-oriented occupations are Law Enforcement (100.0%), Food Preparation & Serving (64.0%), and Security & Protection (50.0%), while the most female-oriented occupations are Healthcare Support (100.0%), Firefighting & Prevention (100.0%), and Personal Care & Service (100.0%).
| Occupation | Male | Female |
| Healthcare Support | 0 (0.0%) | 2 (100.0%) |
| Security & Protection | 4 (50.0%) | 4 (50.0%) |
| Firefighting & Prevention | 0 (0.0%) | 4 (100.0%) |
| Law Enforcement | 4 (100.0%) | 0 (0.0%) |
| Food Preparation & Serving | 16 (64.0%) | 9 (36.0%) |
| Cleaning & Maintenance | 3 (20.0%) | 12 (80.0%) |
| Personal Care & Service | 0 (0.0%) | 11 (100.0%) |
| Total (Category) | 23 (37.7%) | 38 (62.3%) |
| Total (Overall) | 206 (58.7%) | 145 (41.3%) |
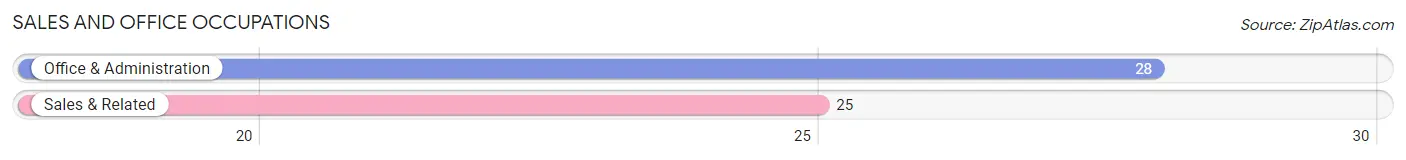
Sales and Office Occupations
The most common Sales and Office occupations in Underwood are Office & Administration (28 | 8.0%), and Sales & Related (25 | 7.1%).
Sales and Office Occupations by Sex
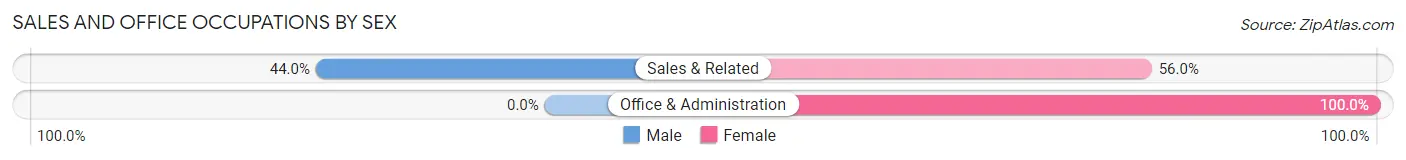
| Occupation | Male | Female |
| Sales & Related | 11 (44.0%) | 14 (56.0%) |
| Office & Administration | 0 (0.0%) | 28 (100.0%) |
| Total (Category) | 11 (20.7%) | 42 (79.2%) |
| Total (Overall) | 206 (58.7%) | 145 (41.3%) |
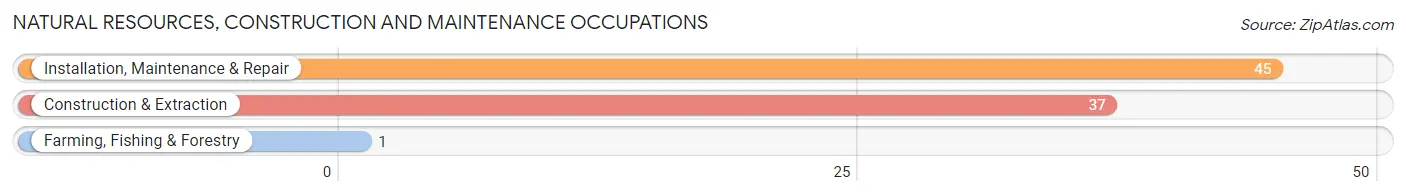
Natural Resources, Construction and Maintenance Occupations
The most common Natural Resources, Construction and Maintenance occupations in Underwood are Installation, Maintenance & Repair (45 | 12.8%), Construction & Extraction (37 | 10.5%), and Farming, Fishing & Forestry (1 | 0.3%).
Natural Resources, Construction and Maintenance Occupations by Sex
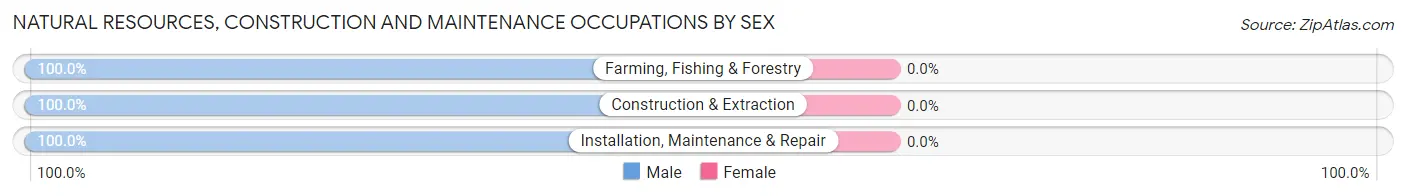
| Occupation | Male | Female |
| Farming, Fishing & Forestry | 1 (100.0%) | 0 (0.0%) |
| Construction & Extraction | 37 (100.0%) | 0 (0.0%) |
| Installation, Maintenance & Repair | 45 (100.0%) | 0 (0.0%) |
| Total (Category) | 83 (100.0%) | 0 (0.0%) |
| Total (Overall) | 206 (58.7%) | 145 (41.3%) |
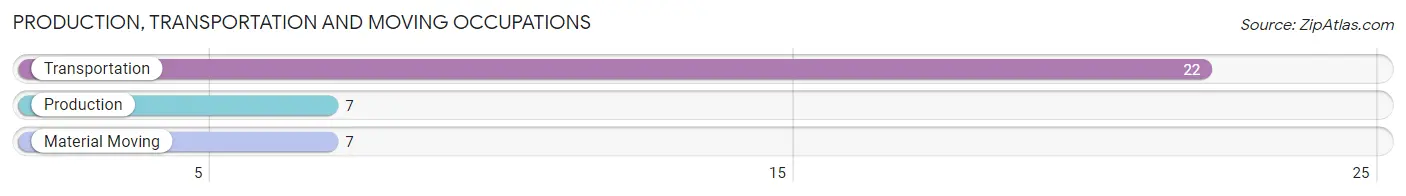
Production, Transportation and Moving Occupations
The most common Production, Transportation and Moving occupations in Underwood are Transportation (22 | 6.3%), Production (7 | 2.0%), and Material Moving (7 | 2.0%).
Production, Transportation and Moving Occupations by Sex
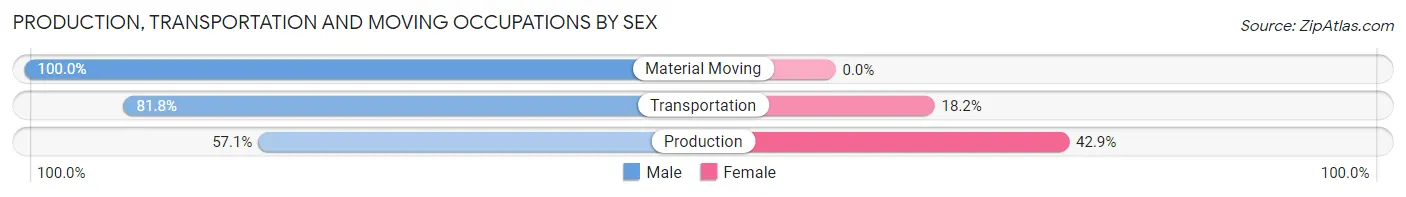
| Occupation | Male | Female |
| Production | 4 (57.1%) | 3 (42.9%) |
| Transportation | 18 (81.8%) | 4 (18.2%) |
| Material Moving | 7 (100.0%) | 0 (0.0%) |
| Total (Category) | 29 (80.6%) | 7 (19.4%) |
| Total (Overall) | 206 (58.7%) | 145 (41.3%) |
Employment Industries by Sex in Underwood
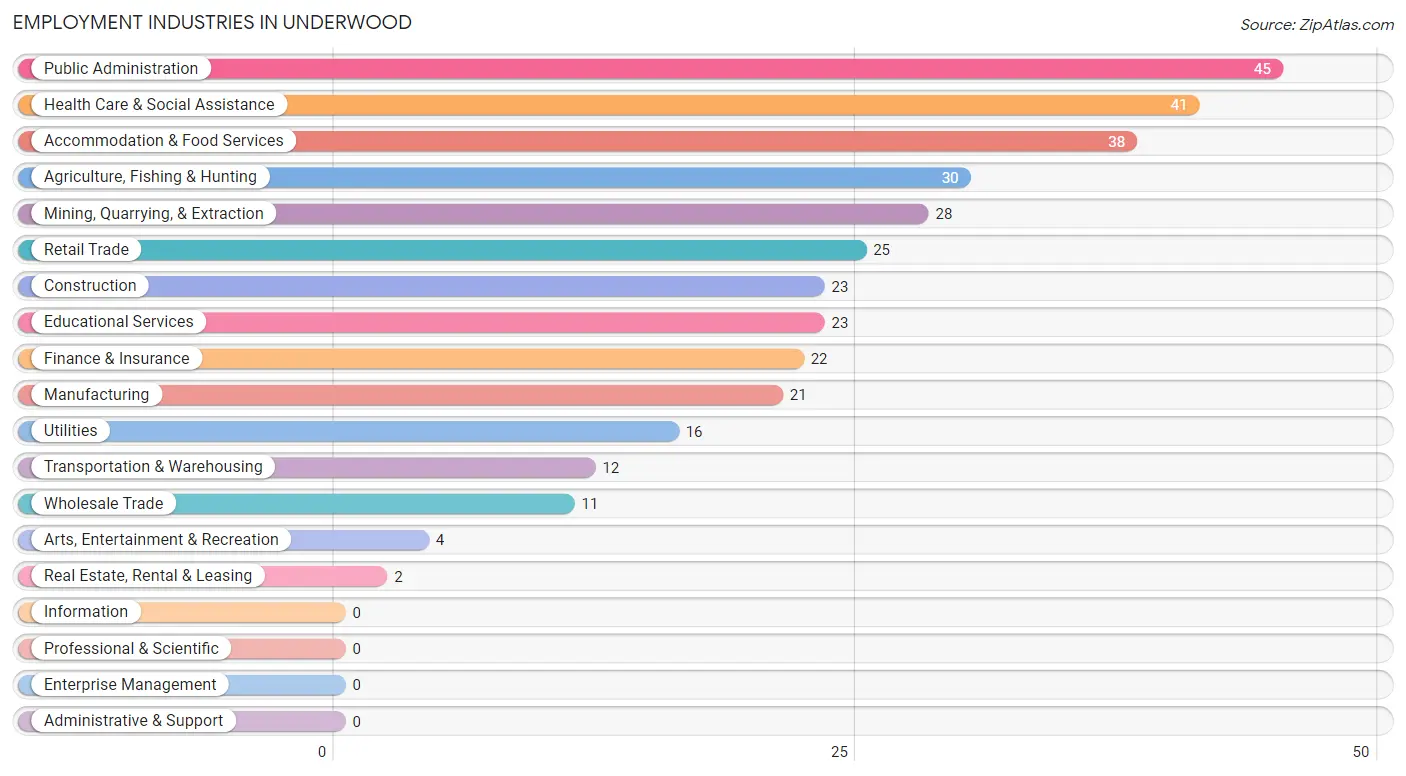
Employment Industries in Underwood
The major employment industries in Underwood include Public Administration (45 | 12.8%), Health Care & Social Assistance (41 | 11.7%), Accommodation & Food Services (38 | 10.8%), Agriculture, Fishing & Hunting (30 | 8.6%), and Mining, Quarrying, & Extraction (28 | 8.0%).
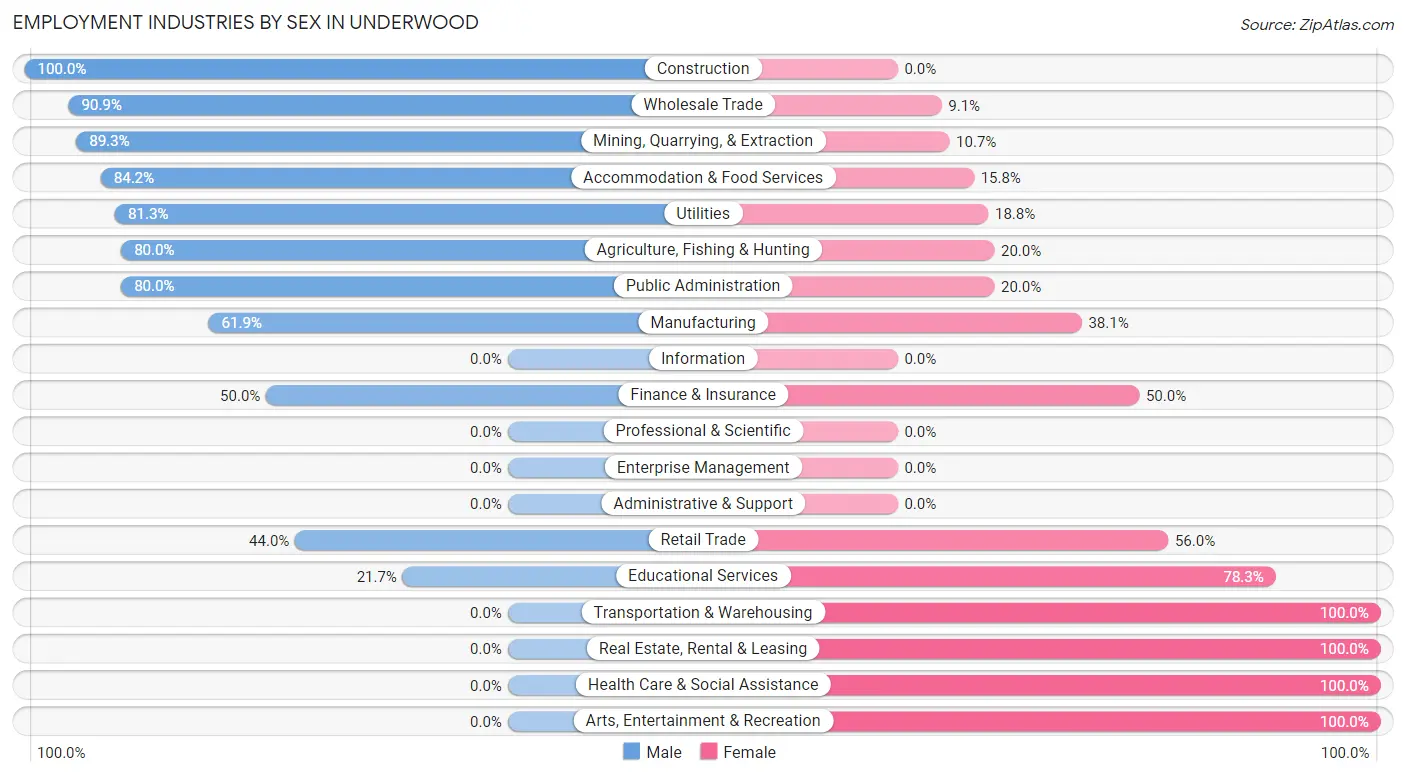
Employment Industries by Sex in Underwood
The Underwood industries that see more men than women are Construction (100.0%), Wholesale Trade (90.9%), and Mining, Quarrying, & Extraction (89.3%), whereas the industries that tend to have a higher number of women are Transportation & Warehousing (100.0%), Real Estate, Rental & Leasing (100.0%), and Health Care & Social Assistance (100.0%).
| Industry | Male | Female |
| Agriculture, Fishing & Hunting | 24 (80.0%) | 6 (20.0%) |
| Mining, Quarrying, & Extraction | 25 (89.3%) | 3 (10.7%) |
| Construction | 23 (100.0%) | 0 (0.0%) |
| Manufacturing | 13 (61.9%) | 8 (38.1%) |
| Wholesale Trade | 10 (90.9%) | 1 (9.1%) |
| Retail Trade | 11 (44.0%) | 14 (56.0%) |
| Transportation & Warehousing | 0 (0.0%) | 12 (100.0%) |
| Utilities | 13 (81.2%) | 3 (18.8%) |
| Information | 0 (0.0%) | 0 (0.0%) |
| Finance & Insurance | 11 (50.0%) | 11 (50.0%) |
| Real Estate, Rental & Leasing | 0 (0.0%) | 2 (100.0%) |
| Professional & Scientific | 0 (0.0%) | 0 (0.0%) |
| Enterprise Management | 0 (0.0%) | 0 (0.0%) |
| Administrative & Support | 0 (0.0%) | 0 (0.0%) |
| Educational Services | 5 (21.7%) | 18 (78.3%) |
| Health Care & Social Assistance | 0 (0.0%) | 41 (100.0%) |
| Arts, Entertainment & Recreation | 0 (0.0%) | 4 (100.0%) |
| Accommodation & Food Services | 32 (84.2%) | 6 (15.8%) |
| Public Administration | 36 (80.0%) | 9 (20.0%) |
| Total | 206 (58.7%) | 145 (41.3%) |
Education in Underwood
School Enrollment in Underwood
The most common levels of schooling among the 148 students in Underwood are elementary school (44 | 29.7%), middle school (36 | 24.3%), and high school (36 | 24.3%).
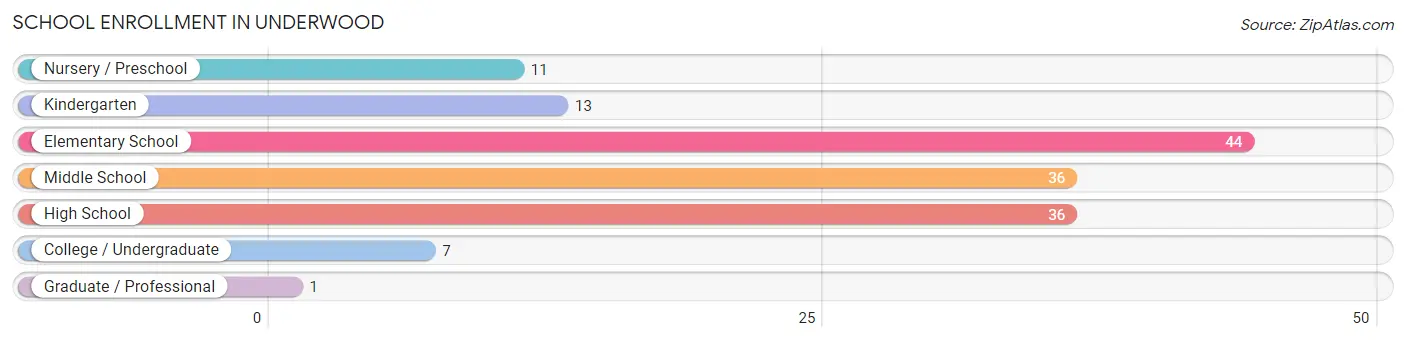
| School Level | # Students | % Students |
| Nursery / Preschool | 11 | 7.4% |
| Kindergarten | 13 | 8.8% |
| Elementary School | 44 | 29.7% |
| Middle School | 36 | 24.3% |
| High School | 36 | 24.3% |
| College / Undergraduate | 7 | 4.7% |
| Graduate / Professional | 1 | 0.7% |
| Total | 148 | 100.0% |
School Enrollment by Age by Funding Source in Underwood
Out of a total of 148 students who are enrolled in schools in Underwood, 16 (10.8%) attend a private institution, while the remaining 132 (89.2%) are enrolled in public schools. The age group of 35 years and over has the highest likelihood of being enrolled in private schools, with 3 (75.0% in the age bracket) enrolled. Conversely, the age group of 3 to 4 year olds has the lowest likelihood of being enrolled in a private school, with 6 (100.0% in the age bracket) attending a public institution.
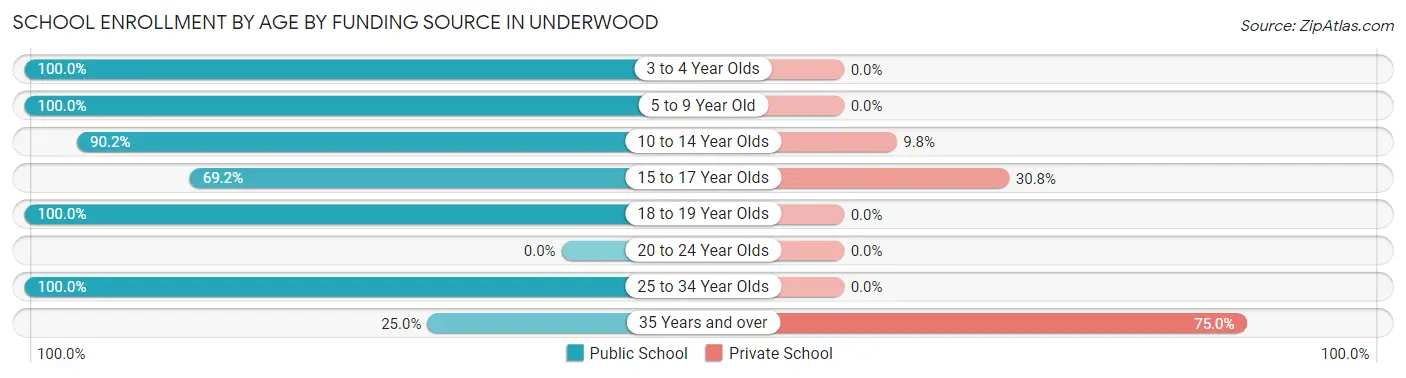
| Age Bracket | Public School | Private School |
| 3 to 4 Year Olds | 6 (100.0%) | 0 (0.0%) |
| 5 to 9 Year Old | 51 (100.0%) | 0 (0.0%) |
| 10 to 14 Year Olds | 46 (90.2%) | 5 (9.8%) |
| 15 to 17 Year Olds | 18 (69.2%) | 8 (30.8%) |
| 18 to 19 Year Olds | 6 (100.0%) | 0 (0.0%) |
| 20 to 24 Year Olds | 0 (0.0%) | 0 (0.0%) |
| 25 to 34 Year Olds | 4 (100.0%) | 0 (0.0%) |
| 35 Years and over | 1 (25.0%) | 3 (75.0%) |
| Total | 132 (89.2%) | 16 (10.8%) |
Educational Attainment by Field of Study in Underwood
Business (33 | 32.4%), education (26 | 25.5%), bio, nature & agricultural (17 | 16.7%), science & technology (15 | 14.7%), and psychology (7 | 6.9%) are the most common fields of study among 102 individuals in Underwood who have obtained a bachelor's degree or higher.
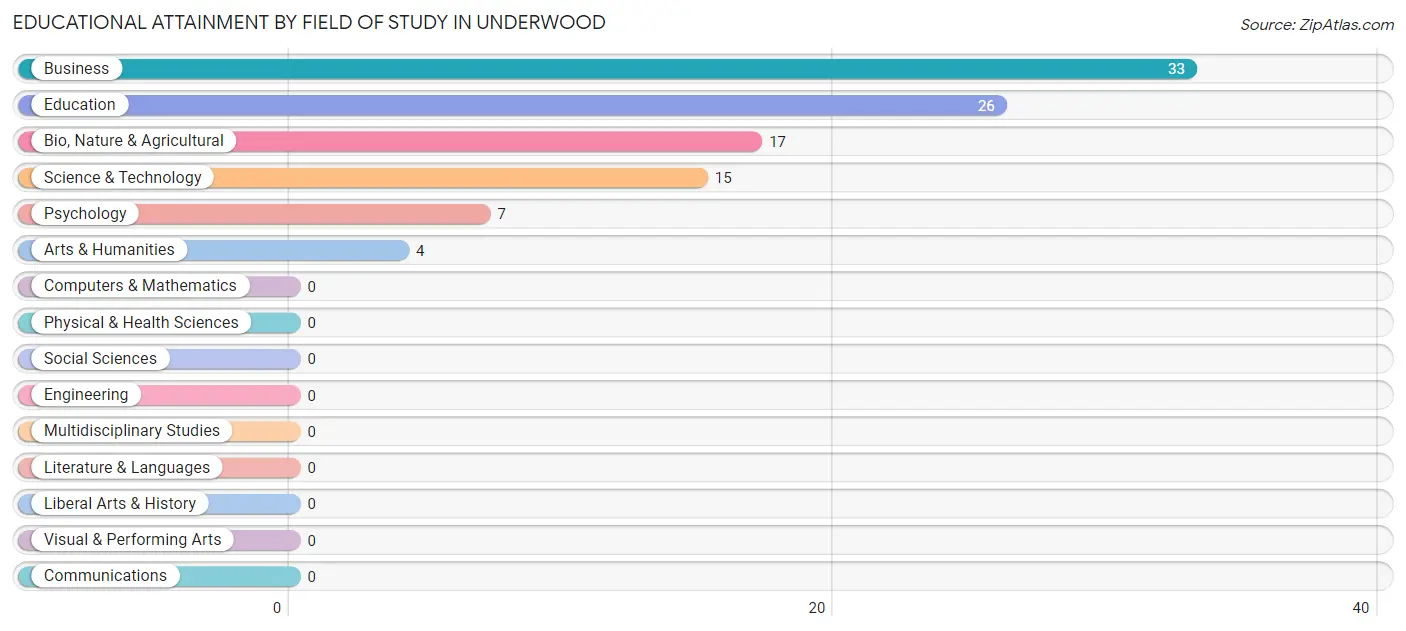
| Field of Study | # Graduates | % Graduates |
| Computers & Mathematics | 0 | 0.0% |
| Bio, Nature & Agricultural | 17 | 16.7% |
| Physical & Health Sciences | 0 | 0.0% |
| Psychology | 7 | 6.9% |
| Social Sciences | 0 | 0.0% |
| Engineering | 0 | 0.0% |
| Multidisciplinary Studies | 0 | 0.0% |
| Science & Technology | 15 | 14.7% |
| Business | 33 | 32.4% |
| Education | 26 | 25.5% |
| Literature & Languages | 0 | 0.0% |
| Liberal Arts & History | 0 | 0.0% |
| Visual & Performing Arts | 0 | 0.0% |
| Communications | 0 | 0.0% |
| Arts & Humanities | 4 | 3.9% |
| Total | 102 | 100.0% |
Transportation & Commute in Underwood
Vehicle Availability by Sex in Underwood
The most prevalent vehicle ownership categories in Underwood are males with 3 vehicles (63, accounting for 31.2%) and females with 3 vehicles (54, making up 43.4%).
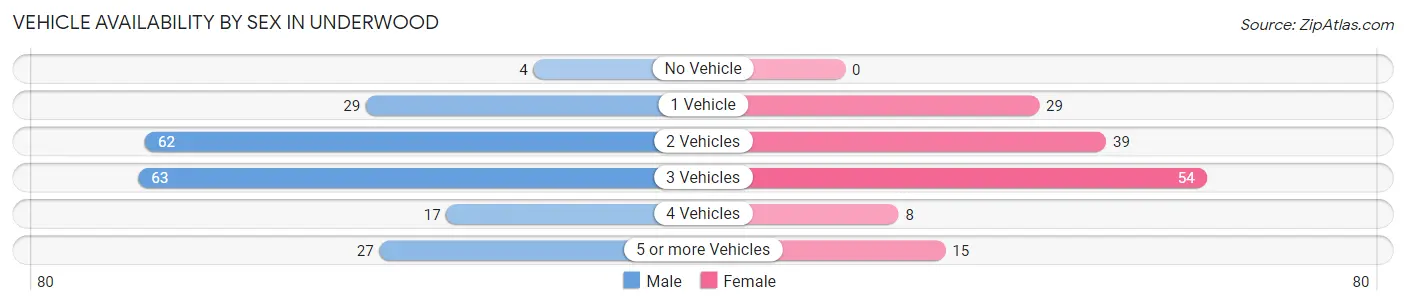
| Vehicles Available | Male | Female |
| No Vehicle | 4 (2.0%) | 0 (0.0%) |
| 1 Vehicle | 29 (14.4%) | 29 (20.0%) |
| 2 Vehicles | 62 (30.7%) | 39 (26.9%) |
| 3 Vehicles | 63 (31.2%) | 54 (37.2%) |
| 4 Vehicles | 17 (8.4%) | 8 (5.5%) |
| 5 or more Vehicles | 27 (13.4%) | 15 (10.3%) |
| Total | 202 (100.0%) | 145 (100.0%) |
Commute Time in Underwood
The most frequently occuring commute durations in Underwood are 5 to 9 minutes (69 commuters, 21.6%), less than 5 minutes (67 commuters, 21.0%), and 20 to 24 minutes (44 commuters, 13.8%).
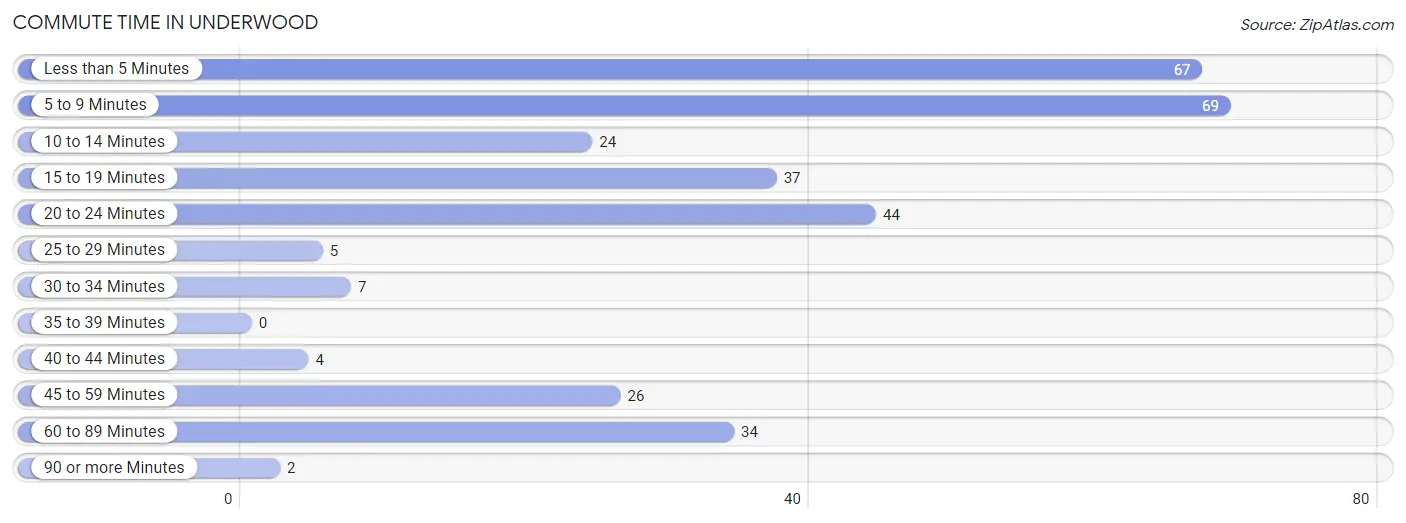
| Commute Time | # Commuters | % Commuters |
| Less than 5 Minutes | 67 | 21.0% |
| 5 to 9 Minutes | 69 | 21.6% |
| 10 to 14 Minutes | 24 | 7.5% |
| 15 to 19 Minutes | 37 | 11.6% |
| 20 to 24 Minutes | 44 | 13.8% |
| 25 to 29 Minutes | 5 | 1.6% |
| 30 to 34 Minutes | 7 | 2.2% |
| 35 to 39 Minutes | 0 | 0.0% |
| 40 to 44 Minutes | 4 | 1.3% |
| 45 to 59 Minutes | 26 | 8.2% |
| 60 to 89 Minutes | 34 | 10.7% |
| 90 or more Minutes | 2 | 0.6% |
Commute Time by Sex in Underwood
The most common commute times in Underwood are 5 to 9 minutes (45 commuters, 22.7%) for males and less than 5 minutes (25 commuters, 20.7%) for females.
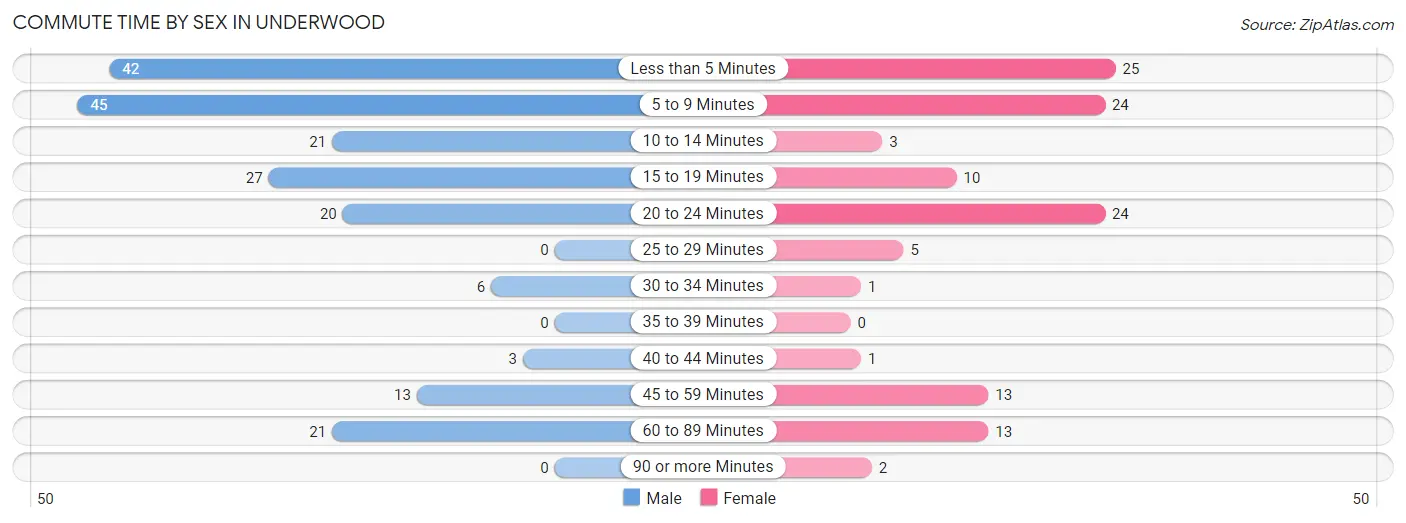
| Commute Time | Male | Female |
| Less than 5 Minutes | 42 (21.2%) | 25 (20.7%) |
| 5 to 9 Minutes | 45 (22.7%) | 24 (19.8%) |
| 10 to 14 Minutes | 21 (10.6%) | 3 (2.5%) |
| 15 to 19 Minutes | 27 (13.6%) | 10 (8.3%) |
| 20 to 24 Minutes | 20 (10.1%) | 24 (19.8%) |
| 25 to 29 Minutes | 0 (0.0%) | 5 (4.1%) |
| 30 to 34 Minutes | 6 (3.0%) | 1 (0.8%) |
| 35 to 39 Minutes | 0 (0.0%) | 0 (0.0%) |
| 40 to 44 Minutes | 3 (1.5%) | 1 (0.8%) |
| 45 to 59 Minutes | 13 (6.6%) | 13 (10.7%) |
| 60 to 89 Minutes | 21 (10.6%) | 13 (10.7%) |
| 90 or more Minutes | 0 (0.0%) | 2 (1.7%) |
Time of Departure to Work by Sex in Underwood
The most frequent times of departure to work in Underwood are 5:30 AM to 5:59 AM (39, 19.7%) for males and 7:30 AM to 7:59 AM (36, 29.7%) for females.
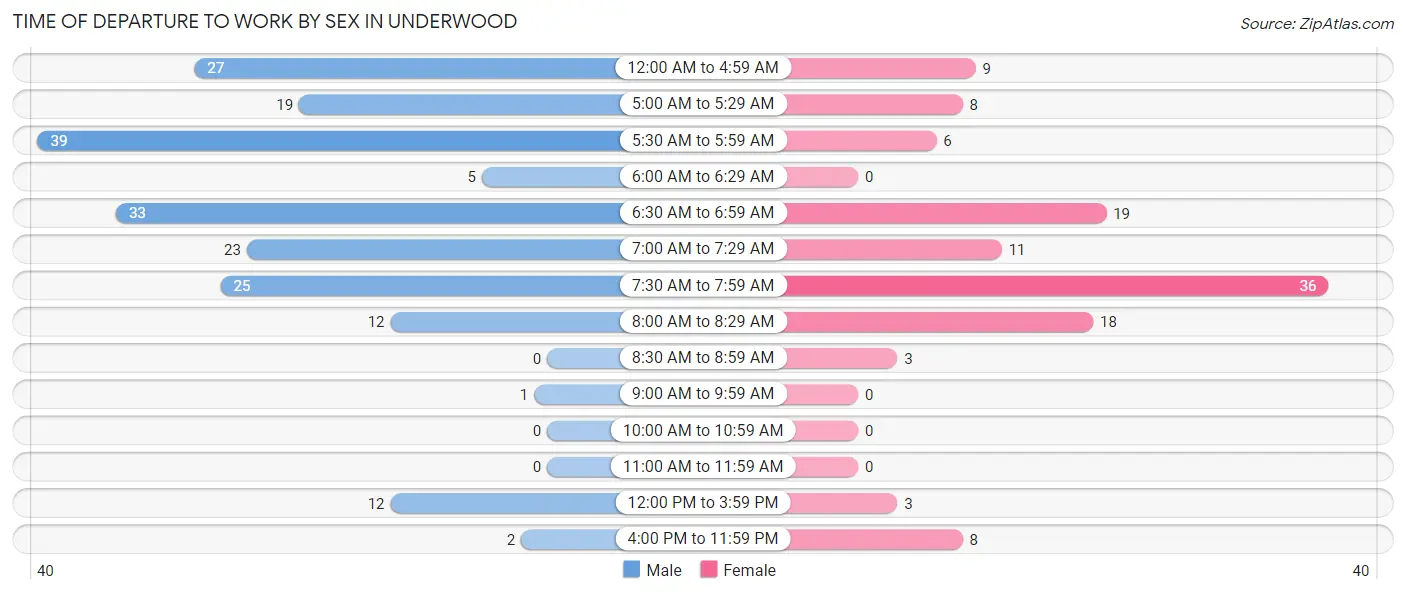
| Time of Departure | Male | Female |
| 12:00 AM to 4:59 AM | 27 (13.6%) | 9 (7.4%) |
| 5:00 AM to 5:29 AM | 19 (9.6%) | 8 (6.6%) |
| 5:30 AM to 5:59 AM | 39 (19.7%) | 6 (5.0%) |
| 6:00 AM to 6:29 AM | 5 (2.5%) | 0 (0.0%) |
| 6:30 AM to 6:59 AM | 33 (16.7%) | 19 (15.7%) |
| 7:00 AM to 7:29 AM | 23 (11.6%) | 11 (9.1%) |
| 7:30 AM to 7:59 AM | 25 (12.6%) | 36 (29.7%) |
| 8:00 AM to 8:29 AM | 12 (6.1%) | 18 (14.9%) |
| 8:30 AM to 8:59 AM | 0 (0.0%) | 3 (2.5%) |
| 9:00 AM to 9:59 AM | 1 (0.5%) | 0 (0.0%) |
| 10:00 AM to 10:59 AM | 0 (0.0%) | 0 (0.0%) |
| 11:00 AM to 11:59 AM | 0 (0.0%) | 0 (0.0%) |
| 12:00 PM to 3:59 PM | 12 (6.1%) | 3 (2.5%) |
| 4:00 PM to 11:59 PM | 2 (1.0%) | 8 (6.6%) |
| Total | 198 (100.0%) | 121 (100.0%) |
Housing Occupancy in Underwood
Occupancy by Ownership in Underwood
Of the total 343 dwellings in Underwood, owner-occupied units account for 276 (80.5%), while renter-occupied units make up 67 (19.5%).
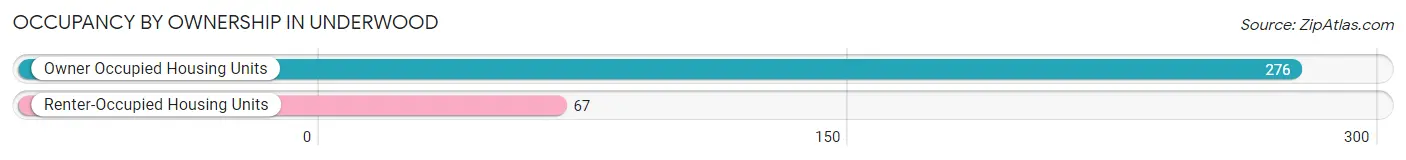
| Occupancy | # Housing Units | % Housing Units |
| Owner Occupied Housing Units | 276 | 80.5% |
| Renter-Occupied Housing Units | 67 | 19.5% |
| Total Occupied Housing Units | 343 | 100.0% |
Occupancy by Household Size in Underwood
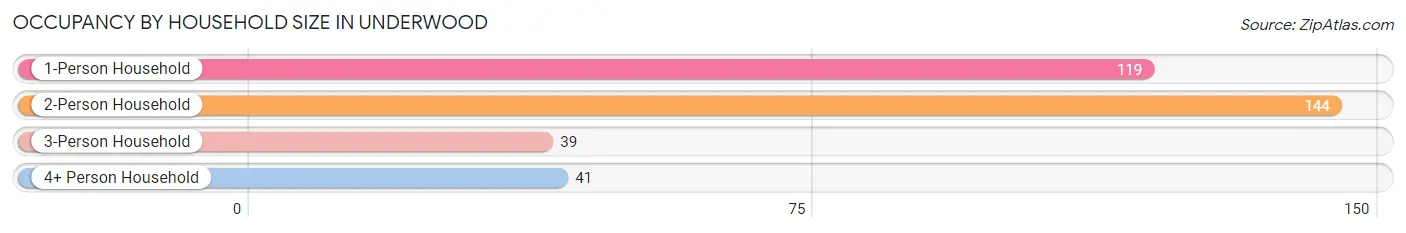
| Household Size | # Housing Units | % Housing Units |
| 1-Person Household | 119 | 34.7% |
| 2-Person Household | 144 | 42.0% |
| 3-Person Household | 39 | 11.4% |
| 4+ Person Household | 41 | 11.9% |
| Total Housing Units | 343 | 100.0% |
Occupancy by Ownership by Household Size in Underwood
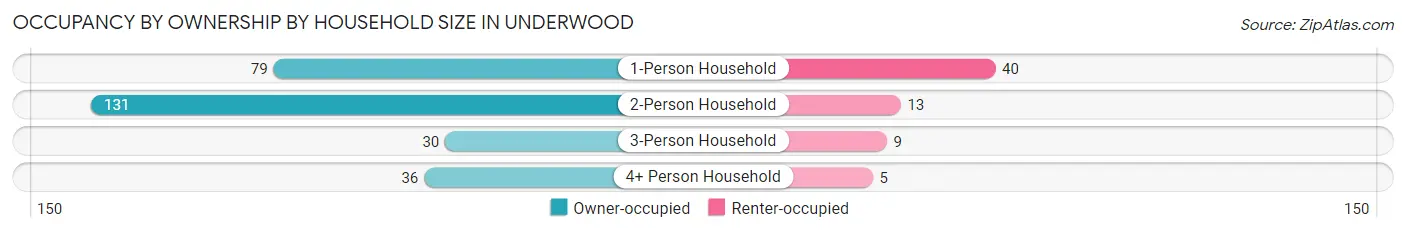
| Household Size | Owner-occupied | Renter-occupied |
| 1-Person Household | 79 (66.4%) | 40 (33.6%) |
| 2-Person Household | 131 (91.0%) | 13 (9.0%) |
| 3-Person Household | 30 (76.9%) | 9 (23.1%) |
| 4+ Person Household | 36 (87.8%) | 5 (12.2%) |
| Total Housing Units | 276 (80.5%) | 67 (19.5%) |
Occupancy by Educational Attainment in Underwood
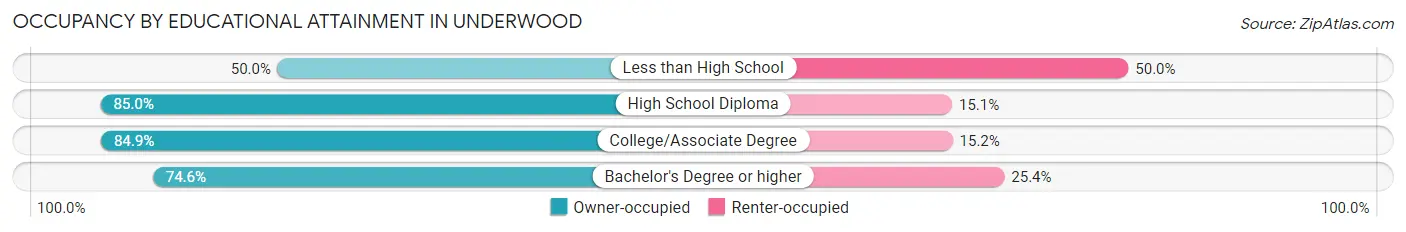
| Household Size | Owner-occupied | Renter-occupied |
| Less than High School | 13 (50.0%) | 13 (50.0%) |
| High School Diploma | 79 (85.0%) | 14 (15.0%) |
| College/Associate Degree | 140 (84.9%) | 25 (15.1%) |
| Bachelor's Degree or higher | 44 (74.6%) | 15 (25.4%) |
Occupancy by Age of Householder in Underwood
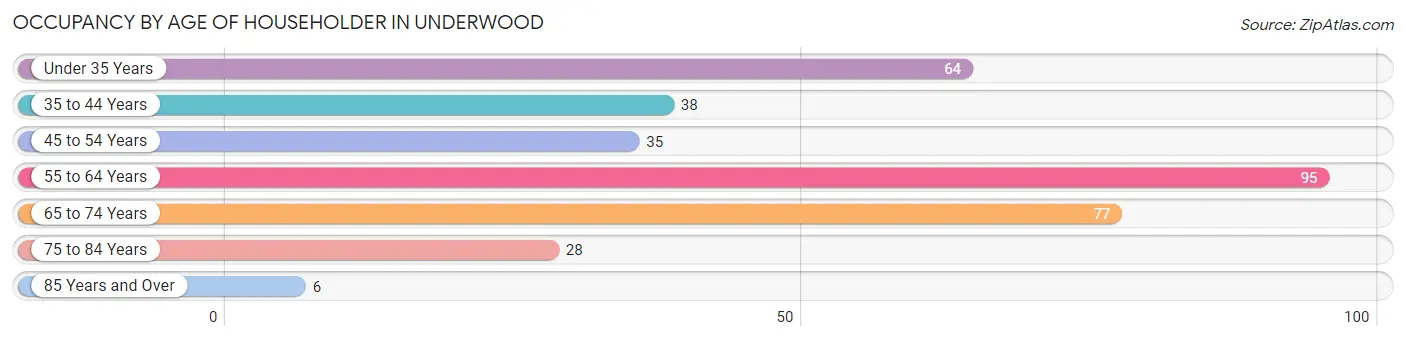
| Age Bracket | # Households | % Households |
| Under 35 Years | 64 | 18.7% |
| 35 to 44 Years | 38 | 11.1% |
| 45 to 54 Years | 35 | 10.2% |
| 55 to 64 Years | 95 | 27.7% |
| 65 to 74 Years | 77 | 22.5% |
| 75 to 84 Years | 28 | 8.2% |
| 85 Years and Over | 6 | 1.8% |
| Total | 343 | 100.0% |
Housing Finances in Underwood
Median Income by Occupancy in Underwood
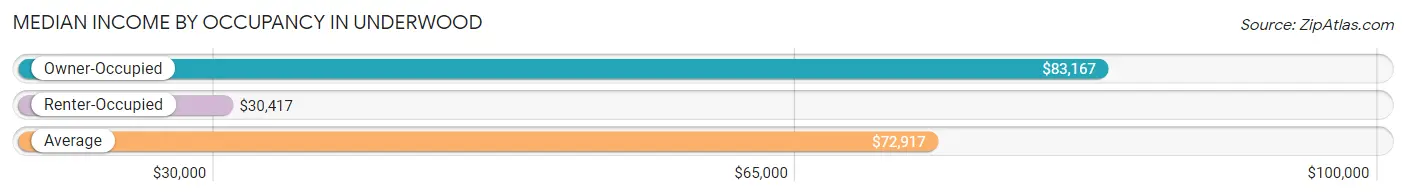
| Occupancy Type | # Households | Median Income |
| Owner-Occupied | 276 (80.5%) | $83,167 |
| Renter-Occupied | 67 (19.5%) | $30,417 |
| Average | 343 (100.0%) | $72,917 |
Occupancy by Householder Income Bracket in Underwood
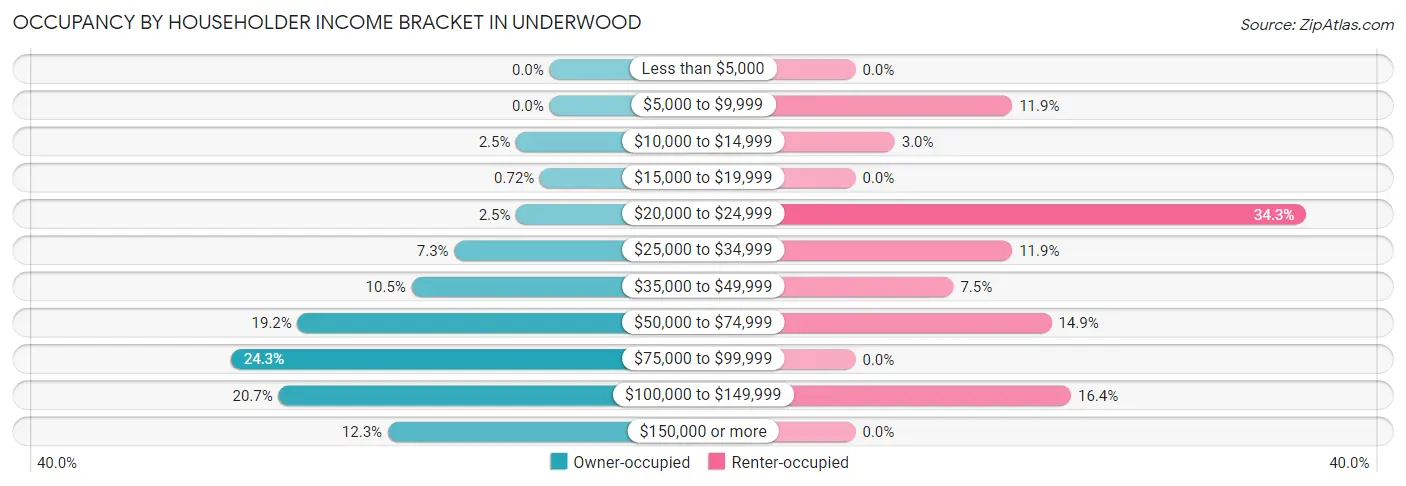
| Income Bracket | Owner-occupied | Renter-occupied |
| Less than $5,000 | 0 (0.0%) | 0 (0.0%) |
| $5,000 to $9,999 | 0 (0.0%) | 8 (11.9%) |
| $10,000 to $14,999 | 7 (2.5%) | 2 (3.0%) |
| $15,000 to $19,999 | 2 (0.7%) | 0 (0.0%) |
| $20,000 to $24,999 | 7 (2.5%) | 23 (34.3%) |
| $25,000 to $34,999 | 20 (7.2%) | 8 (11.9%) |
| $35,000 to $49,999 | 29 (10.5%) | 5 (7.5%) |
| $50,000 to $74,999 | 53 (19.2%) | 10 (14.9%) |
| $75,000 to $99,999 | 67 (24.3%) | 0 (0.0%) |
| $100,000 to $149,999 | 57 (20.6%) | 11 (16.4%) |
| $150,000 or more | 34 (12.3%) | 0 (0.0%) |
| Total | 276 (100.0%) | 67 (100.0%) |
Monthly Housing Cost Tiers in Underwood
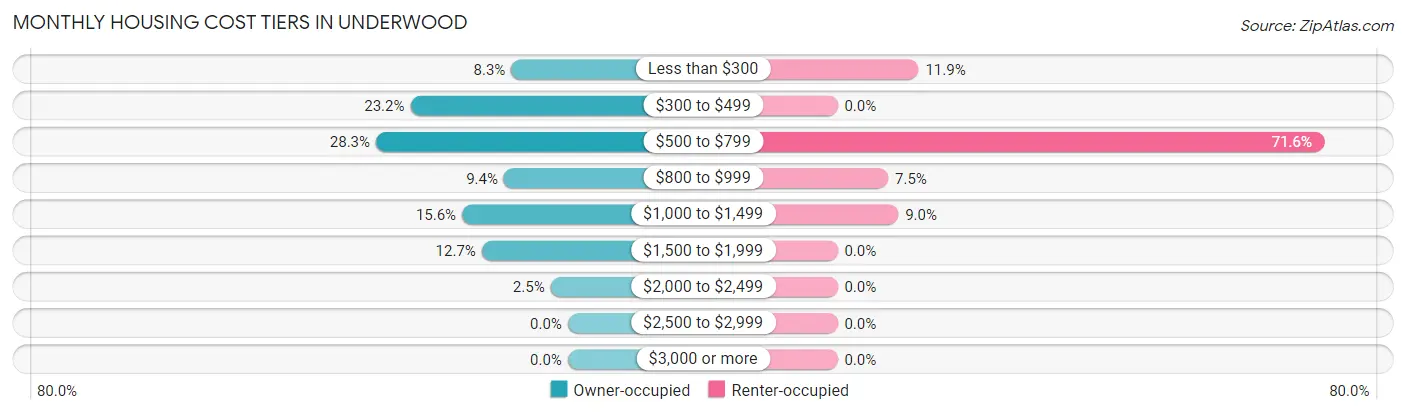
| Monthly Cost | Owner-occupied | Renter-occupied |
| Less than $300 | 23 (8.3%) | 8 (11.9%) |
| $300 to $499 | 64 (23.2%) | 0 (0.0%) |
| $500 to $799 | 78 (28.3%) | 48 (71.6%) |
| $800 to $999 | 26 (9.4%) | 5 (7.5%) |
| $1,000 to $1,499 | 43 (15.6%) | 6 (9.0%) |
| $1,500 to $1,999 | 35 (12.7%) | 0 (0.0%) |
| $2,000 to $2,499 | 7 (2.5%) | 0 (0.0%) |
| $2,500 to $2,999 | 0 (0.0%) | 0 (0.0%) |
| $3,000 or more | 0 (0.0%) | 0 (0.0%) |
| Total | 276 (100.0%) | 67 (100.0%) |
Physical Housing Characteristics in Underwood
Housing Structures in Underwood
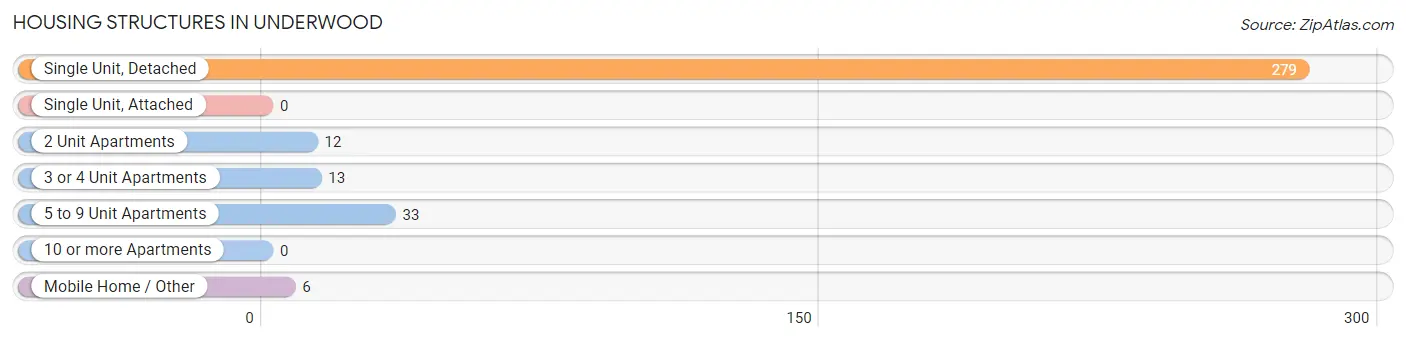
| Structure Type | # Housing Units | % Housing Units |
| Single Unit, Detached | 279 | 81.3% |
| Single Unit, Attached | 0 | 0.0% |
| 2 Unit Apartments | 12 | 3.5% |
| 3 or 4 Unit Apartments | 13 | 3.8% |
| 5 to 9 Unit Apartments | 33 | 9.6% |
| 10 or more Apartments | 0 | 0.0% |
| Mobile Home / Other | 6 | 1.8% |
| Total | 343 | 100.0% |
Housing Structures by Occupancy in Underwood
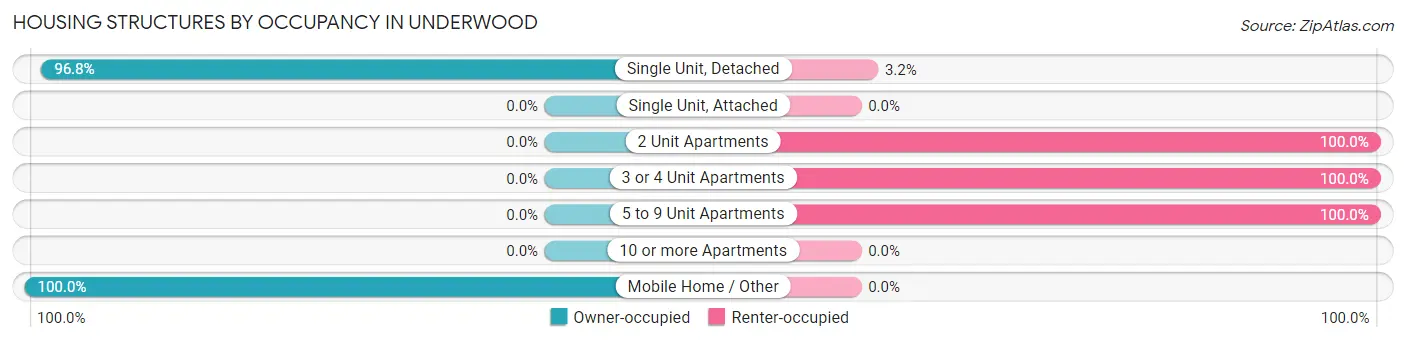
| Structure Type | Owner-occupied | Renter-occupied |
| Single Unit, Detached | 270 (96.8%) | 9 (3.2%) |
| Single Unit, Attached | 0 (0.0%) | 0 (0.0%) |
| 2 Unit Apartments | 0 (0.0%) | 12 (100.0%) |
| 3 or 4 Unit Apartments | 0 (0.0%) | 13 (100.0%) |
| 5 to 9 Unit Apartments | 0 (0.0%) | 33 (100.0%) |
| 10 or more Apartments | 0 (0.0%) | 0 (0.0%) |
| Mobile Home / Other | 6 (100.0%) | 0 (0.0%) |
| Total | 276 (80.5%) | 67 (19.5%) |
Housing Structures by Number of Rooms in Underwood
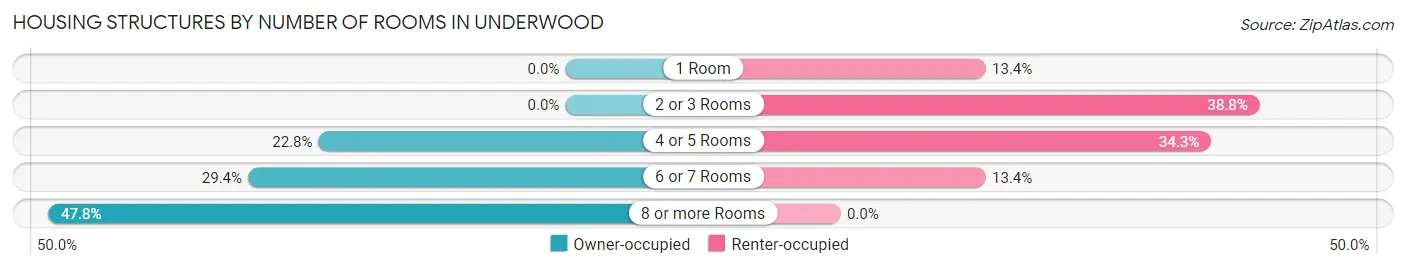
| Number of Rooms | Owner-occupied | Renter-occupied |
| 1 Room | 0 (0.0%) | 9 (13.4%) |
| 2 or 3 Rooms | 0 (0.0%) | 26 (38.8%) |
| 4 or 5 Rooms | 63 (22.8%) | 23 (34.3%) |
| 6 or 7 Rooms | 81 (29.3%) | 9 (13.4%) |
| 8 or more Rooms | 132 (47.8%) | 0 (0.0%) |
| Total | 276 (100.0%) | 67 (100.0%) |
Housing Structure by Heating Type in Underwood
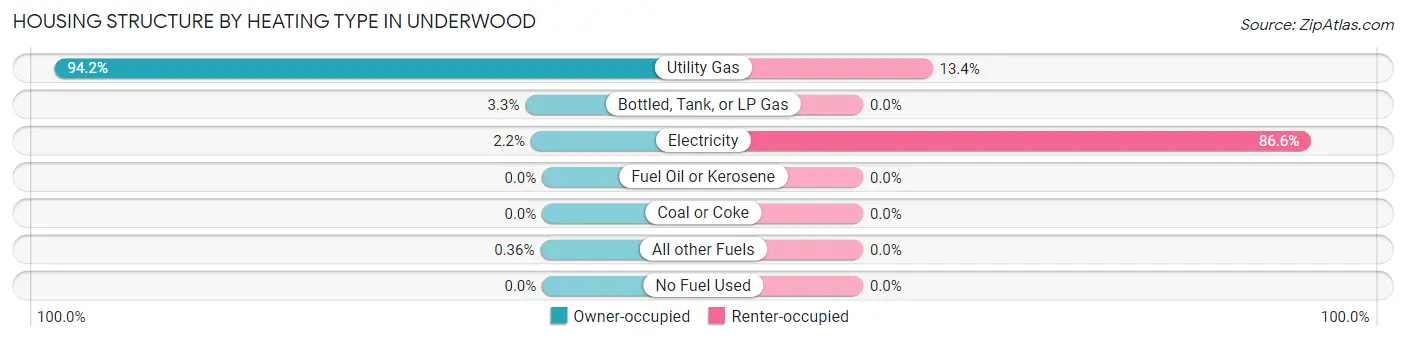
| Heating Type | Owner-occupied | Renter-occupied |
| Utility Gas | 260 (94.2%) | 9 (13.4%) |
| Bottled, Tank, or LP Gas | 9 (3.3%) | 0 (0.0%) |
| Electricity | 6 (2.2%) | 58 (86.6%) |
| Fuel Oil or Kerosene | 0 (0.0%) | 0 (0.0%) |
| Coal or Coke | 0 (0.0%) | 0 (0.0%) |
| All other Fuels | 1 (0.4%) | 0 (0.0%) |
| No Fuel Used | 0 (0.0%) | 0 (0.0%) |
| Total | 276 (100.0%) | 67 (100.0%) |
Household Vehicle Usage in Underwood
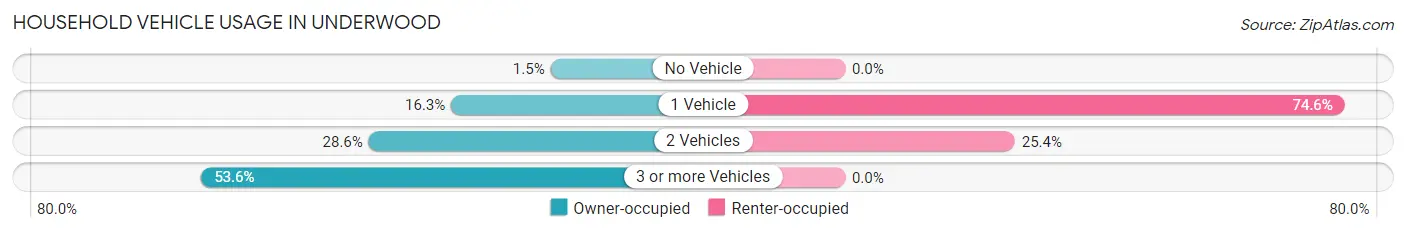
| Vehicles per Household | Owner-occupied | Renter-occupied |
| No Vehicle | 4 (1.5%) | 0 (0.0%) |
| 1 Vehicle | 45 (16.3%) | 50 (74.6%) |
| 2 Vehicles | 79 (28.6%) | 17 (25.4%) |
| 3 or more Vehicles | 148 (53.6%) | 0 (0.0%) |
| Total | 276 (100.0%) | 67 (100.0%) |
Real Estate & Mortgages in Underwood
Real Estate and Mortgage Overview in Underwood
| Characteristic | Without Mortgage | With Mortgage |
| Housing Units | 154 | 122 |
| Median Property Value | $177,600 | $201,700 |
| Median Household Income | $80,625 | $20 |
| Monthly Housing Costs | $480 | $0 |
| Real Estate Taxes | $1,610 | $0 |
Property Value by Mortgage Status in Underwood
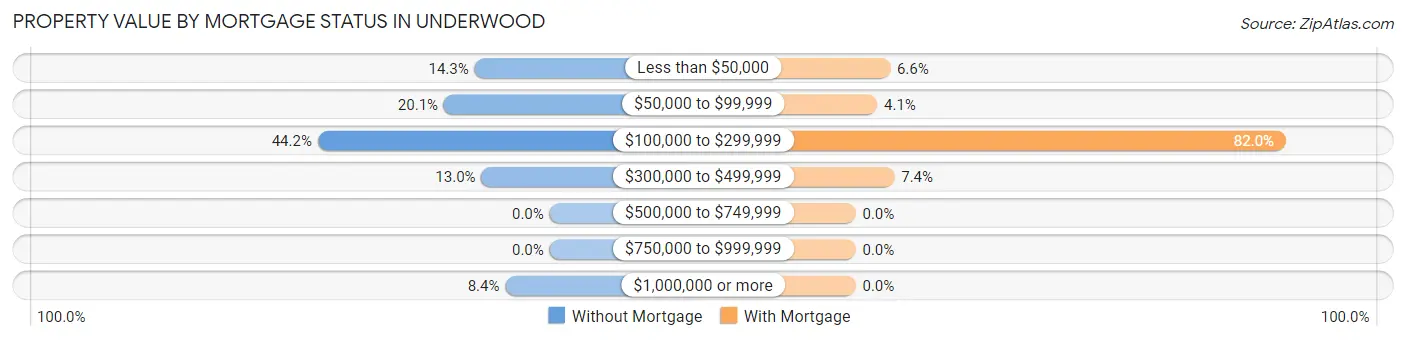
| Property Value | Without Mortgage | With Mortgage |
| Less than $50,000 | 22 (14.3%) | 8 (6.6%) |
| $50,000 to $99,999 | 31 (20.1%) | 5 (4.1%) |
| $100,000 to $299,999 | 68 (44.2%) | 100 (82.0%) |
| $300,000 to $499,999 | 20 (13.0%) | 9 (7.4%) |
| $500,000 to $749,999 | 0 (0.0%) | 0 (0.0%) |
| $750,000 to $999,999 | 0 (0.0%) | 0 (0.0%) |
| $1,000,000 or more | 13 (8.4%) | 0 (0.0%) |
| Total | 154 (100.0%) | 122 (100.0%) |
Household Income by Mortgage Status in Underwood
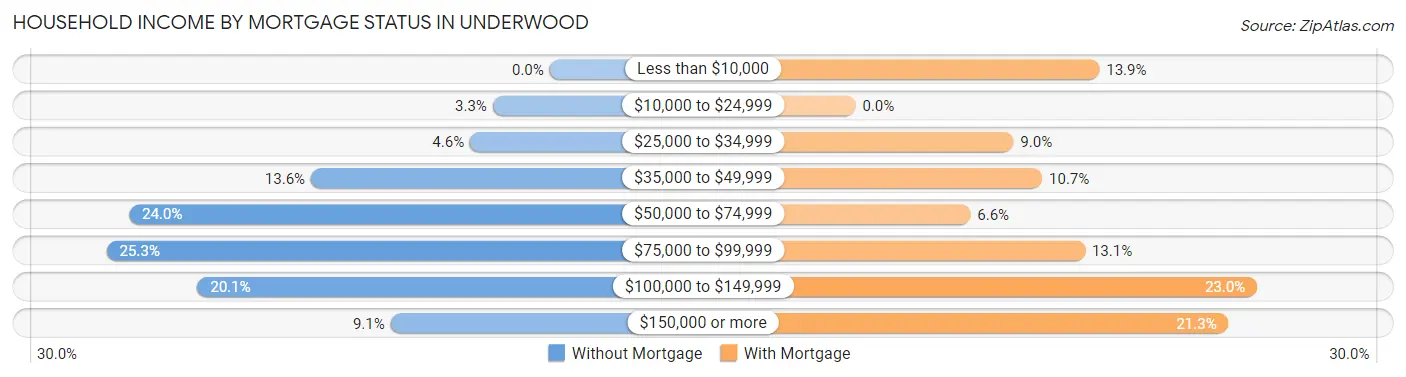
| Household Income | Without Mortgage | With Mortgage |
| Less than $10,000 | 0 (0.0%) | 17 (13.9%) |
| $10,000 to $24,999 | 5 (3.3%) | 0 (0.0%) |
| $25,000 to $34,999 | 7 (4.5%) | 11 (9.0%) |
| $35,000 to $49,999 | 21 (13.6%) | 13 (10.7%) |
| $50,000 to $74,999 | 37 (24.0%) | 8 (6.6%) |
| $75,000 to $99,999 | 39 (25.3%) | 16 (13.1%) |
| $100,000 to $149,999 | 31 (20.1%) | 28 (23.0%) |
| $150,000 or more | 14 (9.1%) | 26 (21.3%) |
| Total | 154 (100.0%) | 122 (100.0%) |
Property Value to Household Income Ratio in Underwood
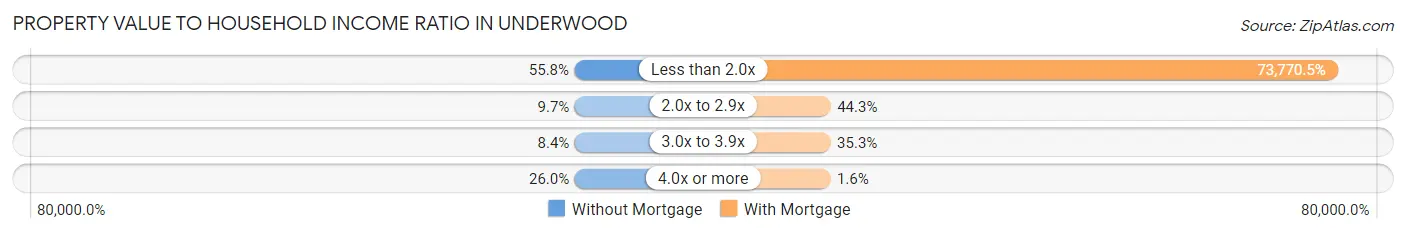
| Value-to-Income Ratio | Without Mortgage | With Mortgage |
| Less than 2.0x | 86 (55.8%) | 90,000 (73,770.5%) |
| 2.0x to 2.9x | 15 (9.7%) | 54 (44.3%) |
| 3.0x to 3.9x | 13 (8.4%) | 43 (35.2%) |
| 4.0x or more | 40 (26.0%) | 2 (1.6%) |
| Total | 154 (100.0%) | 122 (100.0%) |
Real Estate Taxes by Mortgage Status in Underwood
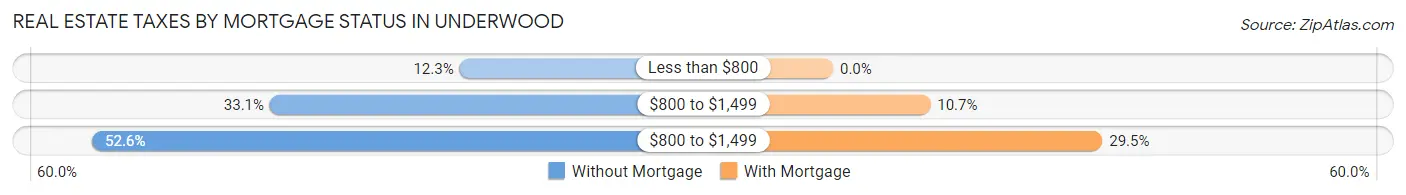
| Property Taxes | Without Mortgage | With Mortgage |
| Less than $800 | 19 (12.3%) | 0 (0.0%) |
| $800 to $1,499 | 51 (33.1%) | 13 (10.7%) |
| $800 to $1,499 | 81 (52.6%) | 36 (29.5%) |
| Total | 154 (100.0%) | 122 (100.0%) |
Health & Disability in Underwood
Health Insurance Coverage by Age in Underwood
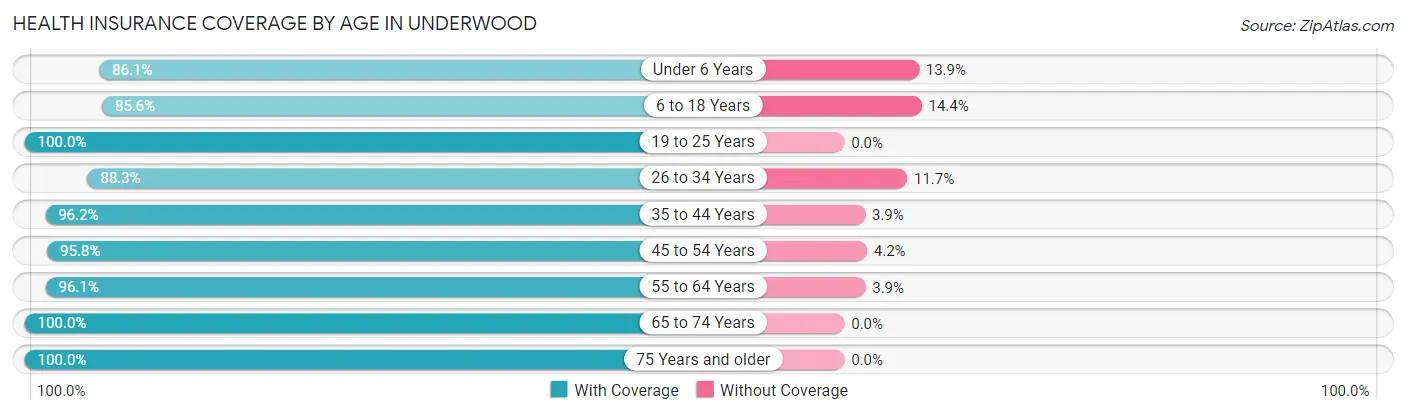
| Age Bracket | With Coverage | Without Coverage |
| Under 6 Years | 31 (86.1%) | 5 (13.9%) |
| 6 to 18 Years | 101 (85.6%) | 17 (14.4%) |
| 19 to 25 Years | 37 (100.0%) | 0 (0.0%) |
| 26 to 34 Years | 83 (88.3%) | 11 (11.7%) |
| 35 to 44 Years | 50 (96.2%) | 2 (3.8%) |
| 45 to 54 Years | 91 (95.8%) | 4 (4.2%) |
| 55 to 64 Years | 123 (96.1%) | 5 (3.9%) |
| 65 to 74 Years | 128 (100.0%) | 0 (0.0%) |
| 75 Years and older | 44 (100.0%) | 0 (0.0%) |
| Total | 688 (94.0%) | 44 (6.0%) |
Health Insurance Coverage by Citizenship Status in Underwood
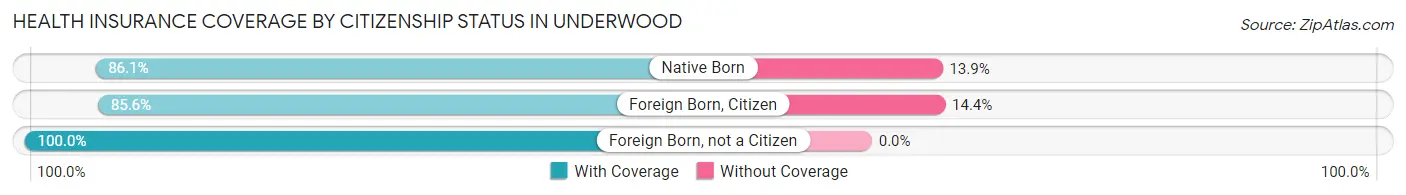
| Citizenship Status | With Coverage | Without Coverage |
| Native Born | 31 (86.1%) | 5 (13.9%) |
| Foreign Born, Citizen | 101 (85.6%) | 17 (14.4%) |
| Foreign Born, not a Citizen | 37 (100.0%) | 0 (0.0%) |
Health Insurance Coverage by Household Income in Underwood
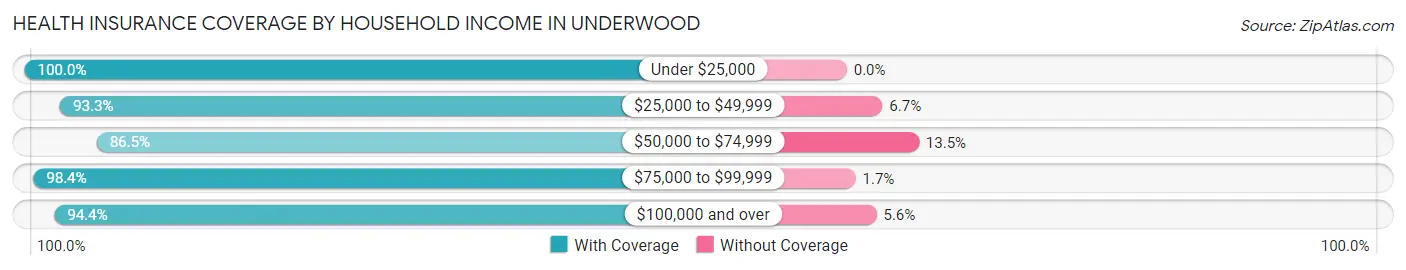
| Household Income | With Coverage | Without Coverage |
| Under $25,000 | 86 (100.0%) | 0 (0.0%) |
| $25,000 to $49,999 | 84 (93.3%) | 6 (6.7%) |
| $50,000 to $74,999 | 128 (86.5%) | 20 (13.5%) |
| $75,000 to $99,999 | 119 (98.4%) | 2 (1.7%) |
| $100,000 and over | 271 (94.4%) | 16 (5.6%) |
Public vs Private Health Insurance Coverage by Age in Underwood
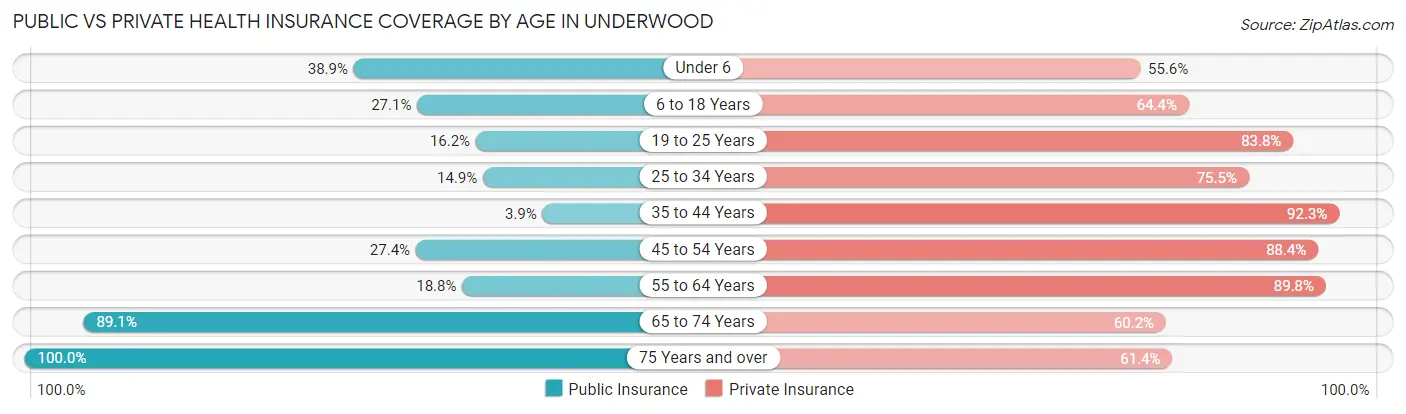
| Age Bracket | Public Insurance | Private Insurance |
| Under 6 | 14 (38.9%) | 20 (55.6%) |
| 6 to 18 Years | 32 (27.1%) | 76 (64.4%) |
| 19 to 25 Years | 6 (16.2%) | 31 (83.8%) |
| 25 to 34 Years | 14 (14.9%) | 71 (75.5%) |
| 35 to 44 Years | 2 (3.8%) | 48 (92.3%) |
| 45 to 54 Years | 26 (27.4%) | 84 (88.4%) |
| 55 to 64 Years | 24 (18.8%) | 115 (89.8%) |
| 65 to 74 Years | 114 (89.1%) | 77 (60.2%) |
| 75 Years and over | 44 (100.0%) | 27 (61.4%) |
| Total | 276 (37.7%) | 549 (75.0%) |
Disability Status by Sex by Age in Underwood
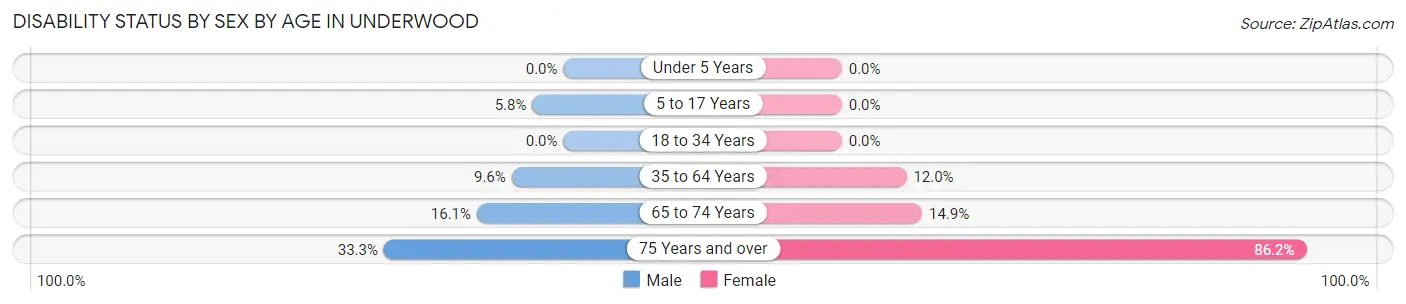
| Age Bracket | Male | Female |
| Under 5 Years | 0 (0.0%) | 0 (0.0%) |
| 5 to 17 Years | 3 (5.8%) | 0 (0.0%) |
| 18 to 34 Years | 0 (0.0%) | 0 (0.0%) |
| 35 to 64 Years | 12 (9.6%) | 18 (12.0%) |
| 65 to 74 Years | 13 (16.1%) | 7 (14.9%) |
| 75 Years and over | 5 (33.3%) | 25 (86.2%) |
Disability Class by Sex by Age in Underwood
Disability Class: Hearing Difficulty
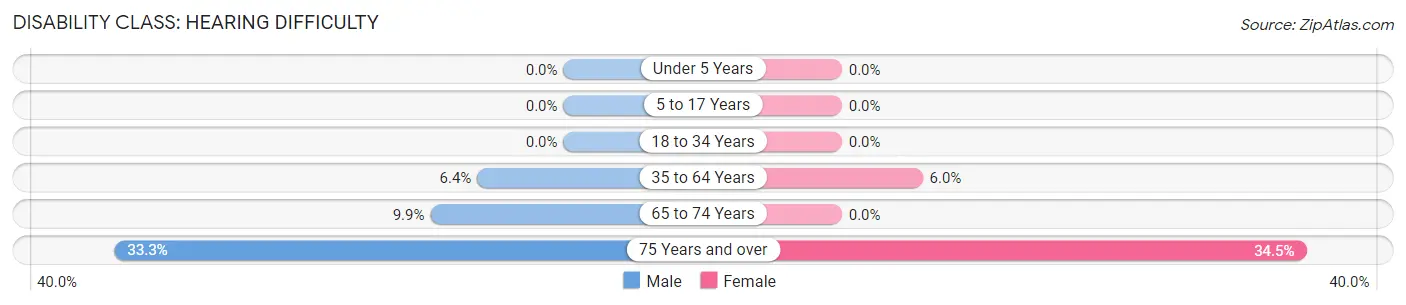
| Age Bracket | Male | Female |
| Under 5 Years | 0 (0.0%) | 0 (0.0%) |
| 5 to 17 Years | 0 (0.0%) | 0 (0.0%) |
| 18 to 34 Years | 0 (0.0%) | 0 (0.0%) |
| 35 to 64 Years | 8 (6.4%) | 9 (6.0%) |
| 65 to 74 Years | 8 (9.9%) | 0 (0.0%) |
| 75 Years and over | 5 (33.3%) | 10 (34.5%) |
Disability Class: Vision Difficulty
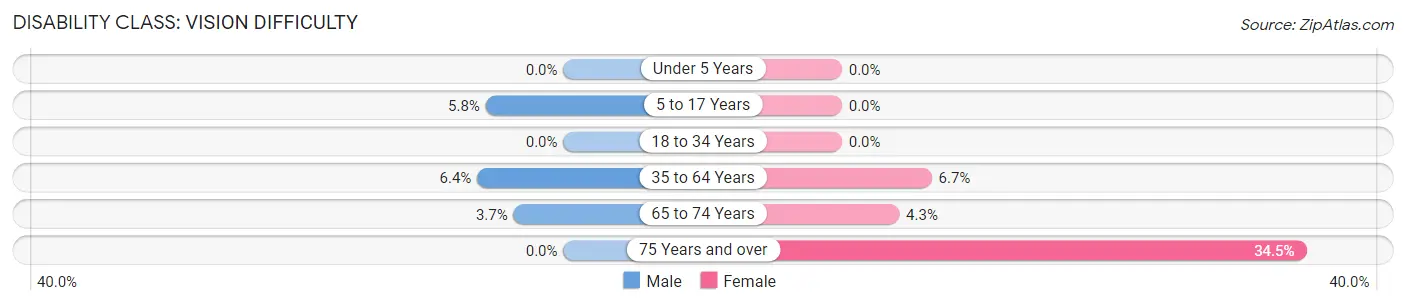
| Age Bracket | Male | Female |
| Under 5 Years | 0 (0.0%) | 0 (0.0%) |
| 5 to 17 Years | 3 (5.8%) | 0 (0.0%) |
| 18 to 34 Years | 0 (0.0%) | 0 (0.0%) |
| 35 to 64 Years | 8 (6.4%) | 10 (6.7%) |
| 65 to 74 Years | 3 (3.7%) | 2 (4.3%) |
| 75 Years and over | 0 (0.0%) | 10 (34.5%) |
Disability Class: Cognitive Difficulty
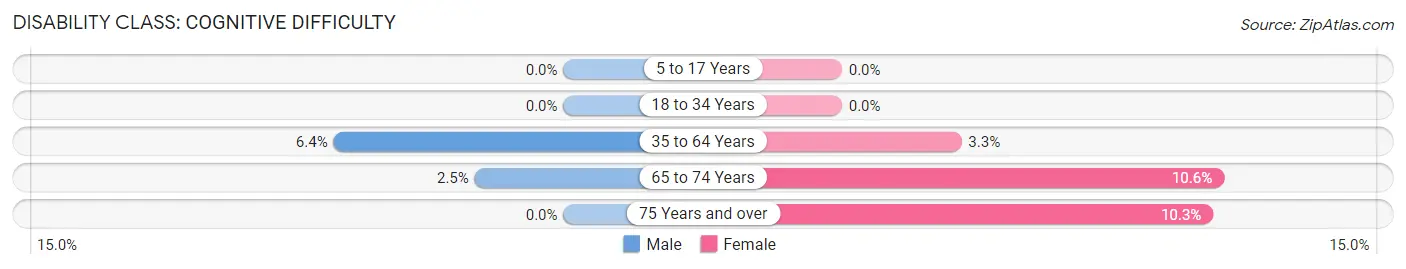
| Age Bracket | Male | Female |
| 5 to 17 Years | 0 (0.0%) | 0 (0.0%) |
| 18 to 34 Years | 0 (0.0%) | 0 (0.0%) |
| 35 to 64 Years | 8 (6.4%) | 5 (3.3%) |
| 65 to 74 Years | 2 (2.5%) | 5 (10.6%) |
| 75 Years and over | 0 (0.0%) | 3 (10.3%) |
Disability Class: Ambulatory Difficulty
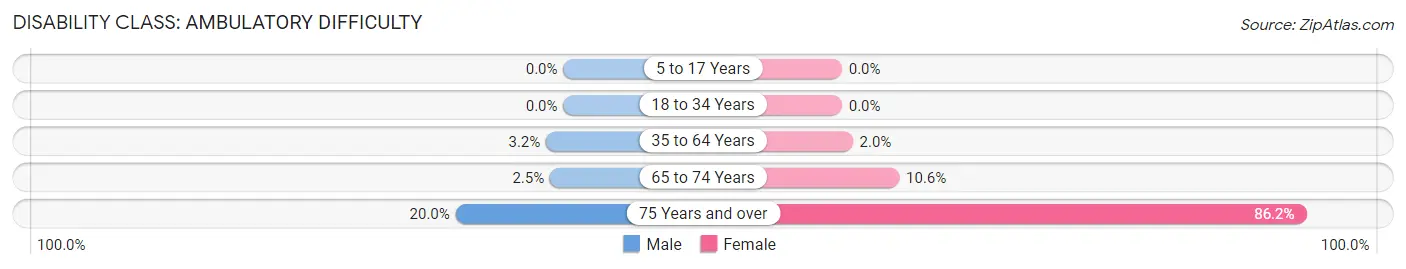
| Age Bracket | Male | Female |
| 5 to 17 Years | 0 (0.0%) | 0 (0.0%) |
| 18 to 34 Years | 0 (0.0%) | 0 (0.0%) |
| 35 to 64 Years | 4 (3.2%) | 3 (2.0%) |
| 65 to 74 Years | 2 (2.5%) | 5 (10.6%) |
| 75 Years and over | 3 (20.0%) | 25 (86.2%) |
Disability Class: Self-Care Difficulty
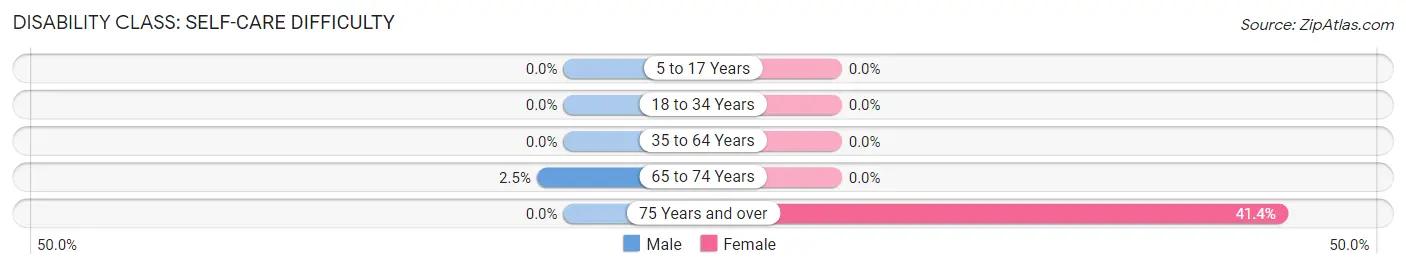
| Age Bracket | Male | Female |
| 5 to 17 Years | 0 (0.0%) | 0 (0.0%) |
| 18 to 34 Years | 0 (0.0%) | 0 (0.0%) |
| 35 to 64 Years | 0 (0.0%) | 0 (0.0%) |
| 65 to 74 Years | 2 (2.5%) | 0 (0.0%) |
| 75 Years and over | 0 (0.0%) | 12 (41.4%) |
Technology Access in Underwood
Computing Device Access in Underwood
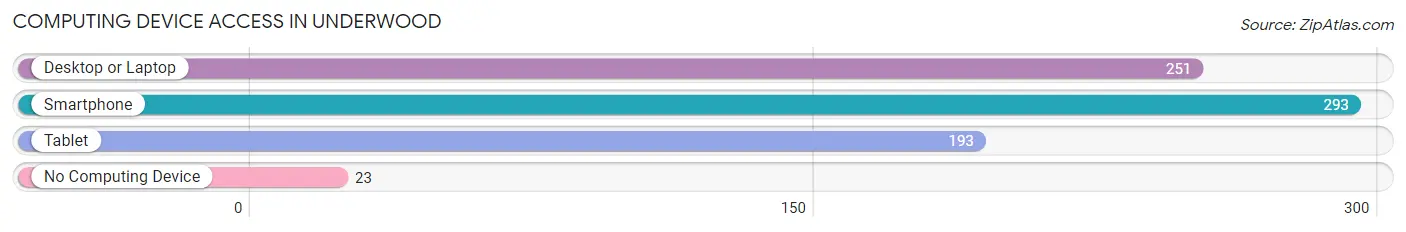
| Device Type | # Households | % Households |
| Desktop or Laptop | 251 | 73.2% |
| Smartphone | 293 | 85.4% |
| Tablet | 193 | 56.3% |
| No Computing Device | 23 | 6.7% |
| Total | 343 | 100.0% |
Internet Access in Underwood
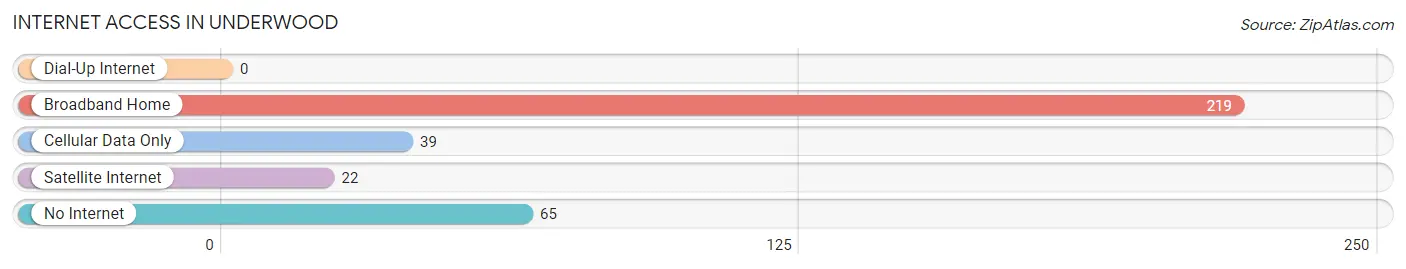
| Internet Type | # Households | % Households |
| Dial-Up Internet | 0 | 0.0% |
| Broadband Home | 219 | 63.8% |
| Cellular Data Only | 39 | 11.4% |
| Satellite Internet | 22 | 6.4% |
| No Internet | 65 | 19.0% |
| Total | 343 | 100.0% |
Underwood Summary
Underwood is a small city located in the state of North Dakota, United States. It is situated in the southwestern part of the state, in the county of McLean. The city has a population of approximately 1,000 people, and is part of the Minot Metropolitan Statistical Area.
History
Underwood was founded in 1883 by a group of settlers from Wisconsin. The city was named after the Underwood family, who were among the first settlers in the area. The city was incorporated in 1887, and the first post office was established in 1888.
In the early 1900s, Underwood was a thriving agricultural community. The city was home to several grain elevators, a creamery, a flour mill, and a lumber yard. The city also had a hotel, a bank, and a newspaper.
In the 1950s, Underwood began to experience a decline in population. This was due to the decline of the agricultural industry in the area, as well as the increasing popularity of larger cities. The population of Underwood has remained relatively stable since then, and the city has become a bedroom community for the larger cities in the area.
Geography
Underwood is located in the southwestern part of North Dakota, in the county of McLean. The city is situated on the banks of the Souris River, and is surrounded by rolling hills and prairies. The city has a total area of 1.2 square miles, all of which is land.
The climate in Underwood is classified as humid continental, with cold winters and hot summers. The average temperature in the winter is around 10°F, and the average temperature in the summer is around 80°F. The average annual precipitation is around 20 inches.
Economy
The economy of Underwood is largely based on agriculture. The city is home to several grain elevators, and the surrounding area is used for growing wheat, corn, and other crops. The city also has a few small businesses, including a grocery store, a hardware store, and a few restaurants.
The city is also home to a few manufacturing companies, including a furniture factory and a plastics factory. The city is also home to a few small technology companies, which provide services to the surrounding area.
Demographics
As of the 2010 census, the population of Underwood was 1,000 people. The racial makeup of the city was 97.2% White, 0.7% Native American, 0.3% Asian, 0.2% from other races, and 1.6% from two or more races. The median household income was $41,250, and the median family income was $48,750.
The population of Underwood is largely made up of people of German and Norwegian descent. The city is also home to a small population of Native Americans, mostly from the Sioux tribe. The city is also home to a small population of immigrants from Mexico and other Latin American countries.
Conclusion
Underwood is a small city located in the southwestern part of North Dakota. The city has a population of approximately 1,000 people, and is part of the Minot Metropolitan Statistical Area. The economy of Underwood is largely based on agriculture, and the city is home to several small businesses. The population of Underwood is largely made up of people of German and Norwegian descent, as well as a small population of Native Americans and immigrants from Mexico and other Latin American countries.
Common Questions
What is Per Capita Income in Underwood?
Per Capita income in Underwood is $40,760.
What is the Median Family Income in Underwood?
Median Family Income in Underwood is $85,938.
What is the Median Household income in Underwood?
Median Household Income in Underwood is $72,917.
What is Income or Wage Gap in Underwood?
Income or Wage Gap in Underwood is 50.2%.
Women in Underwood earn 49.8 cents for every dollar earned by a man.
What is Inequality or Gini Index in Underwood?
Inequality or Gini Index in Underwood is 0.37.
What is the Total Population of Underwood?
Total Population of Underwood is 732.
What is the Total Male Population of Underwood?
Total Male Population of Underwood is 360.
What is the Total Female Population of Underwood?
Total Female Population of Underwood is 372.
What is the Ratio of Males per 100 Females in Underwood?
There are 96.77 Males per 100 Females in Underwood.
What is the Ratio of Females per 100 Males in Underwood?
There are 103.33 Females per 100 Males in Underwood.
What is the Median Population Age in Underwood?
Median Population Age in Underwood is 47.3 Years.
What is the Average Family Size in Underwood
Average Family Size in Underwood is 2.7 People.
What is the Average Household Size in Underwood
Average Household Size in Underwood is 2.1 People.
How Large is the Labor Force in Underwood?
There are 377 People in the Labor Forcein in Underwood.
What is the Percentage of People in the Labor Force in Underwood?
62.1% of People are in the Labor Force in Underwood.
What is the Unemployment Rate in Underwood?
Unemployment Rate in Underwood is 6.9%.