Bowbells, ND Map & Demographics
Bowbells Map
Bowbells Overview
$57,716
PER CAPITA INCOME
$153,194
AVG FAMILY INCOME
$86,875
AVG HOUSEHOLD INCOME
38.6%
WAGE / INCOME GAP [ % ]
61.4¢/ $1
WAGE / INCOME GAP [ $ ]
0.46
INEQUALITY / GINI INDEX
285
TOTAL POPULATION
151
MALE POPULATION
134
FEMALE POPULATION
112.69
MALES / 100 FEMALES
88.74
FEMALES / 100 MALES
49.9
MEDIAN AGE
2.6
AVG FAMILY SIZE
1.9
AVG HOUSEHOLD SIZE
187
LABOR FORCE [ PEOPLE ]
77.6%
PERCENT IN LABOR FORCE
Bowbells Zip Codes
Bowbells Area Codes
Income in Bowbells
Income Overview in Bowbells
Per Capita Income in Bowbells is $57,716, while median incomes of families and households are $153,194 and $86,875 respectively.
| Characteristic | Number | Measure |
| Per Capita Income | 285 | $57,716 |
| Median Family Income | 81 | $153,194 |
| Mean Family Income | 81 | $160,936 |
| Median Household Income | 150 | $86,875 |
| Mean Household Income | 150 | $110,623 |
| Income Deficit | 81 | $0 |
| Wage / Income Gap (%) | 285 | 38.61% |
| Wage / Income Gap ($) | 285 | 61.39¢ per $1 |
| Gini / Inequality Index | 285 | 0.46 |
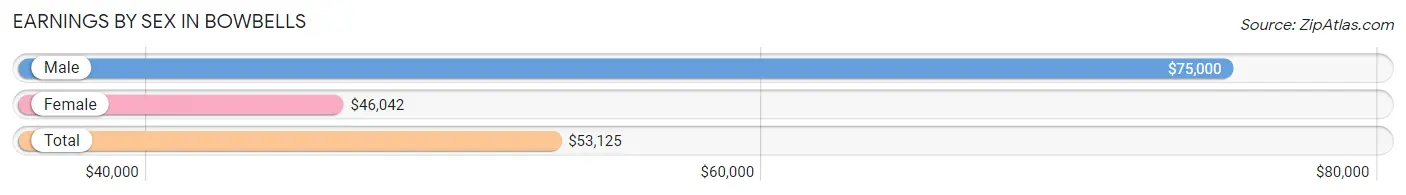
Earnings by Sex in Bowbells
Average Earnings in Bowbells are $53,125, $75,000 for men and $46,042 for women, a difference of 38.6%.
| Sex | Number | Average Earnings |
| Male | 108 (54.0%) | $75,000 |
| Female | 92 (46.0%) | $46,042 |
| Total | 200 (100.0%) | $53,125 |
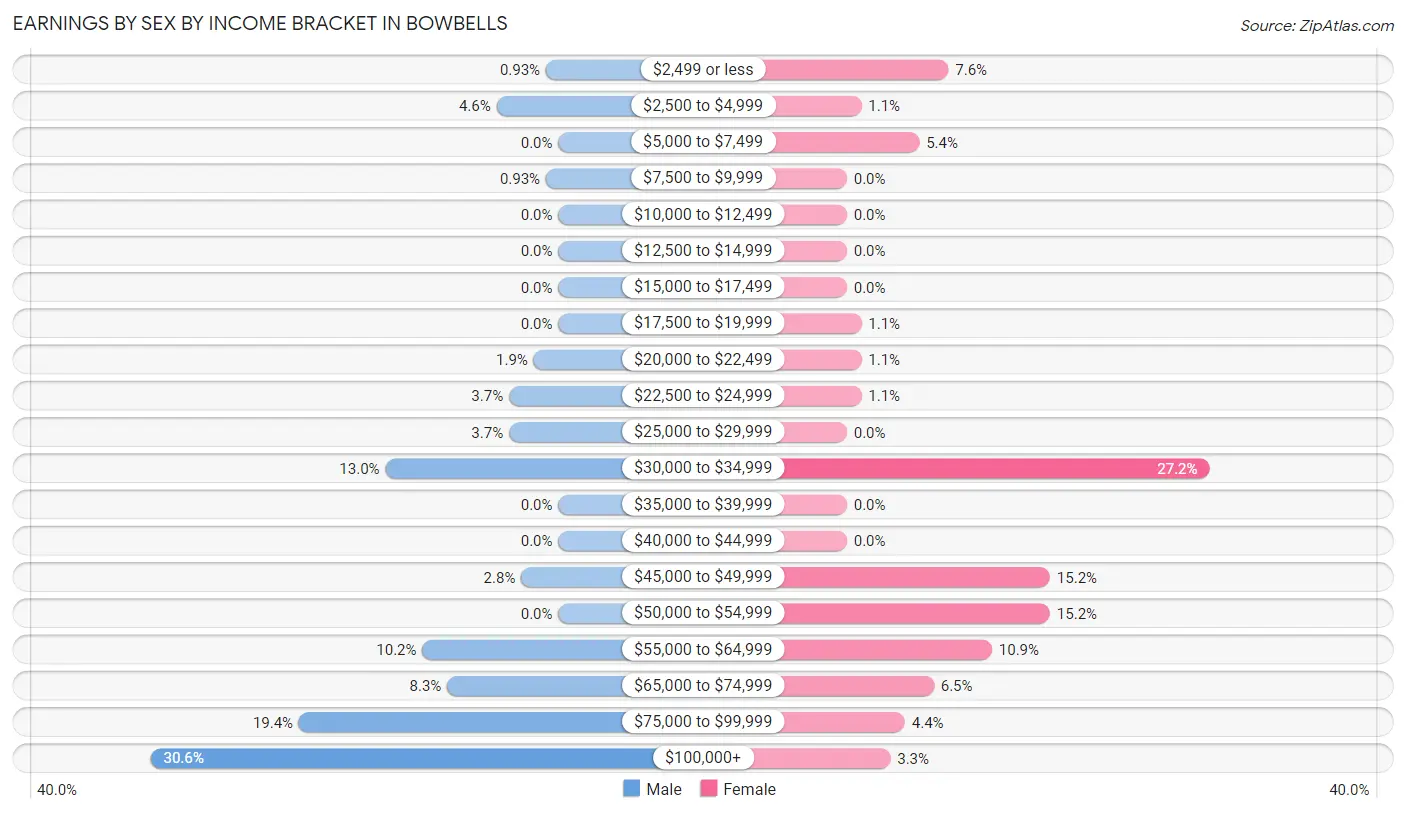
Earnings by Sex by Income Bracket in Bowbells
The most common earnings brackets in Bowbells are $100,000+ for men (33 | 30.6%) and $30,000 to $34,999 for women (25 | 27.2%).
| Income | Male | Female |
| $2,499 or less | 1 (0.9%) | 7 (7.6%) |
| $2,500 to $4,999 | 5 (4.6%) | 1 (1.1%) |
| $5,000 to $7,499 | 0 (0.0%) | 5 (5.4%) |
| $7,500 to $9,999 | 1 (0.9%) | 0 (0.0%) |
| $10,000 to $12,499 | 0 (0.0%) | 0 (0.0%) |
| $12,500 to $14,999 | 0 (0.0%) | 0 (0.0%) |
| $15,000 to $17,499 | 0 (0.0%) | 0 (0.0%) |
| $17,500 to $19,999 | 0 (0.0%) | 1 (1.1%) |
| $20,000 to $22,499 | 2 (1.8%) | 1 (1.1%) |
| $22,500 to $24,999 | 4 (3.7%) | 1 (1.1%) |
| $25,000 to $29,999 | 4 (3.7%) | 0 (0.0%) |
| $30,000 to $34,999 | 14 (13.0%) | 25 (27.2%) |
| $35,000 to $39,999 | 0 (0.0%) | 0 (0.0%) |
| $40,000 to $44,999 | 0 (0.0%) | 0 (0.0%) |
| $45,000 to $49,999 | 3 (2.8%) | 14 (15.2%) |
| $50,000 to $54,999 | 0 (0.0%) | 14 (15.2%) |
| $55,000 to $64,999 | 11 (10.2%) | 10 (10.9%) |
| $65,000 to $74,999 | 9 (8.3%) | 6 (6.5%) |
| $75,000 to $99,999 | 21 (19.4%) | 4 (4.3%) |
| $100,000+ | 33 (30.6%) | 3 (3.3%) |
| Total | 108 (100.0%) | 92 (100.0%) |
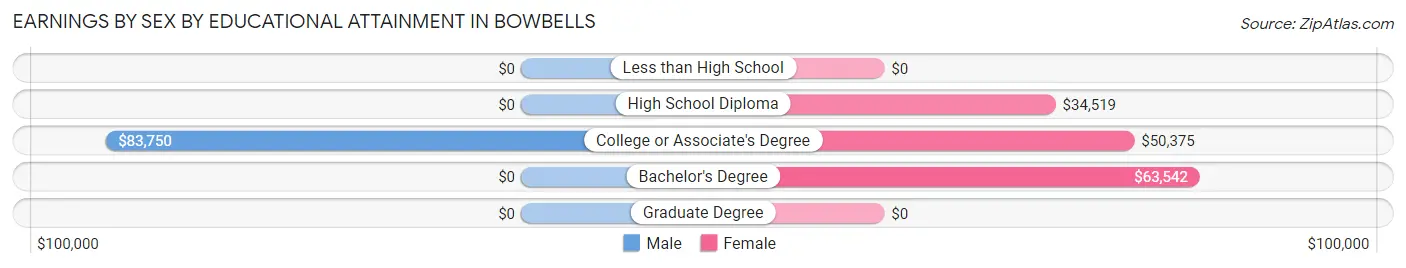
Earnings by Sex by Educational Attainment in Bowbells
Average earnings in Bowbells are $75,625 for men and $46,042 for women, a difference of 39.1%. Men with an educational attainment of college or associate's degree enjoy the highest average annual earnings of $83,750, while those with college or associate's degree education earn the least with $83,750. Women with an educational attainment of bachelor's degree earn the most with the average annual earnings of $63,542, while those with high school diploma education have the smallest earnings of $34,519.
| Educational Attainment | Male Income | Female Income |
| Less than High School | - | - |
| High School Diploma | - | - |
| College or Associate's Degree | $83,750 | $50,375 |
| Bachelor's Degree | - | - |
| Graduate Degree | - | - |
| Total | $75,625 | $46,042 |
Family Income in Bowbells
Family Income Brackets in Bowbells
According to the Bowbells family income data, there are 26 families falling into the $200,000+ income range, which is the most common income bracket and makes up 32.1% of all families.
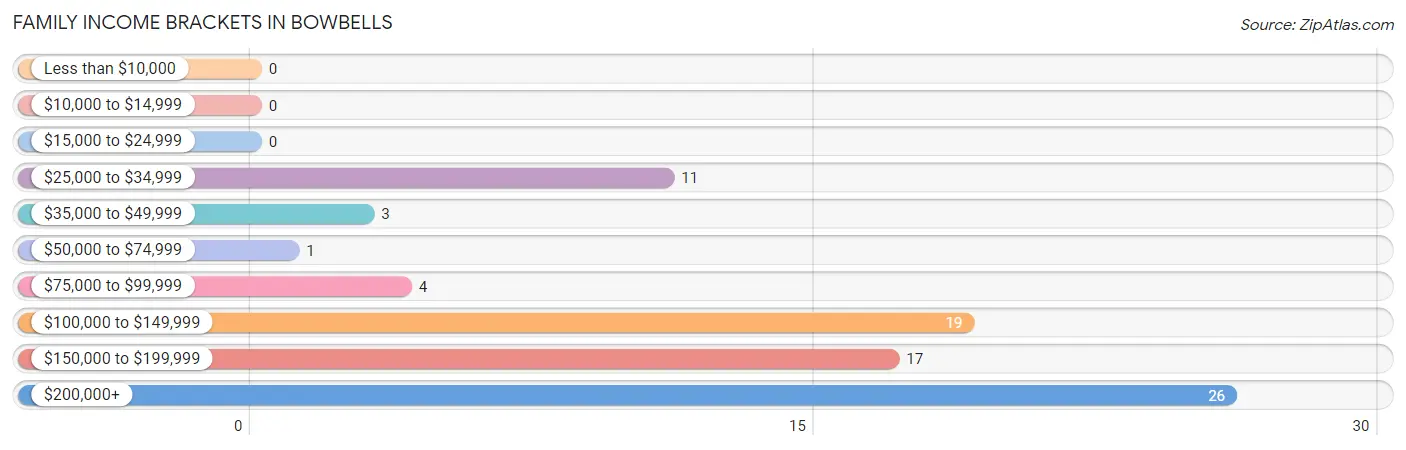
| Income Bracket | # Families | % Families |
| Less than $10,000 | 0 | 0.0% |
| $10,000 to $14,999 | 0 | 0.0% |
| $15,000 to $24,999 | 0 | 0.0% |
| $25,000 to $34,999 | 11 | 13.6% |
| $35,000 to $49,999 | 3 | 3.7% |
| $50,000 to $74,999 | 1 | 1.2% |
| $75,000 to $99,999 | 4 | 4.9% |
| $100,000 to $149,999 | 19 | 23.5% |
| $150,000 to $199,999 | 17 | 21.0% |
| $200,000+ | 26 | 32.1% |
Family Income by Famaliy Size in Bowbells
4-person families (16 | 19.8%) account for the highest median family income in Bowbells with $228,182 per family, while 2-person families (47 | 58.0%) have the highest median income of $70,625 per family member.
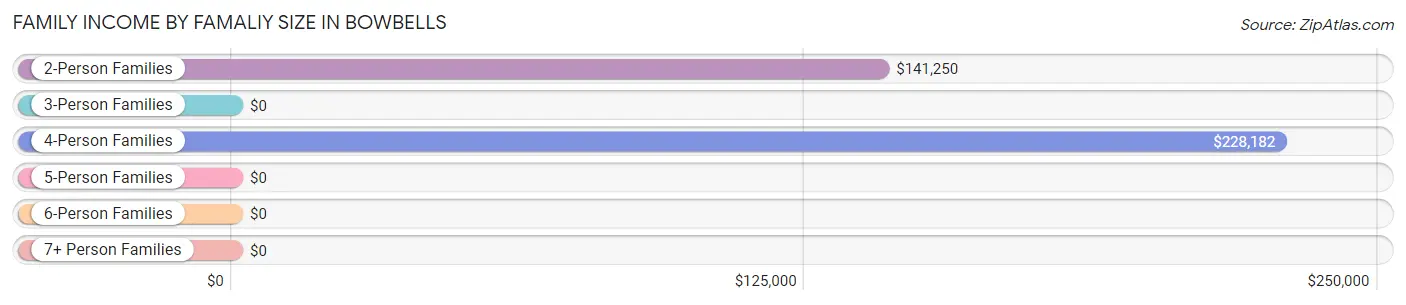
| Income Bracket | # Families | Median Income |
| 2-Person Families | 47 (58.0%) | $141,250 |
| 3-Person Families | 16 (19.8%) | $0 |
| 4-Person Families | 16 (19.8%) | $228,182 |
| 5-Person Families | 2 (2.5%) | $0 |
| 6-Person Families | 0 (0.0%) | $0 |
| 7+ Person Families | 0 (0.0%) | $0 |
| Total | 81 (100.0%) | $153,194 |
Family Income by Number of Earners in Bowbells
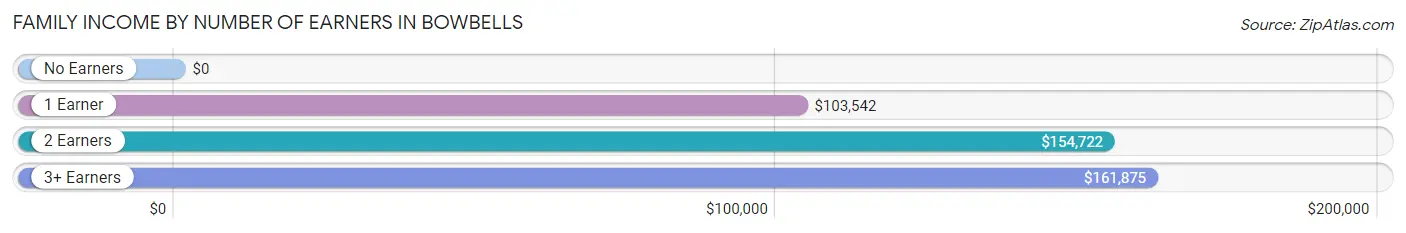
| Number of Earners | # Families | Median Income |
| No Earners | 0 (0.0%) | $0 |
| 1 Earner | 34 (42.0%) | $103,542 |
| 2 Earners | 42 (51.8%) | $154,722 |
| 3+ Earners | 5 (6.2%) | $161,875 |
| Total | 81 (100.0%) | $153,194 |
Household Income in Bowbells
Household Income Brackets in Bowbells
With 32 households falling in the category, the $25,000 to $34,999 income range is the most frequent in Bowbells, accounting for 21.3% of all households. In contrast, only 3 households (2.0%) fall into the $10,000 to $14,999 income bracket, making it the least populous group.
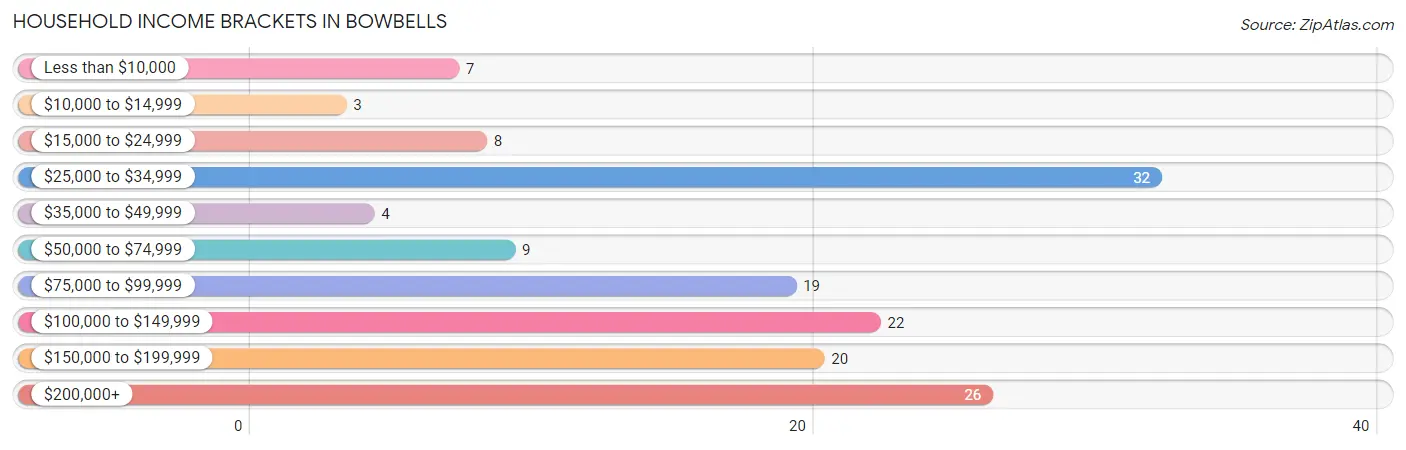
| Income Bracket | # Households | % Households |
| Less than $10,000 | 7 | 4.7% |
| $10,000 to $14,999 | 3 | 2.0% |
| $15,000 to $24,999 | 8 | 5.3% |
| $25,000 to $34,999 | 32 | 21.3% |
| $35,000 to $49,999 | 4 | 2.7% |
| $50,000 to $74,999 | 9 | 6.0% |
| $75,000 to $99,999 | 19 | 12.7% |
| $100,000 to $149,999 | 22 | 14.7% |
| $150,000 to $199,999 | 20 | 13.3% |
| $200,000+ | 26 | 17.3% |
Household Income by Householder Age in Bowbells
The median household income in Bowbells is $86,875, with the highest median household income of $135,000 found in the 45 to 64 years age bracket for the primary householder. A total of 72 households (48.0%) fall into this category. Meanwhile, the 15 to 24 years age bracket for the primary householder has the lowest median household income of $0, with 3 households (2.0%) in this group.
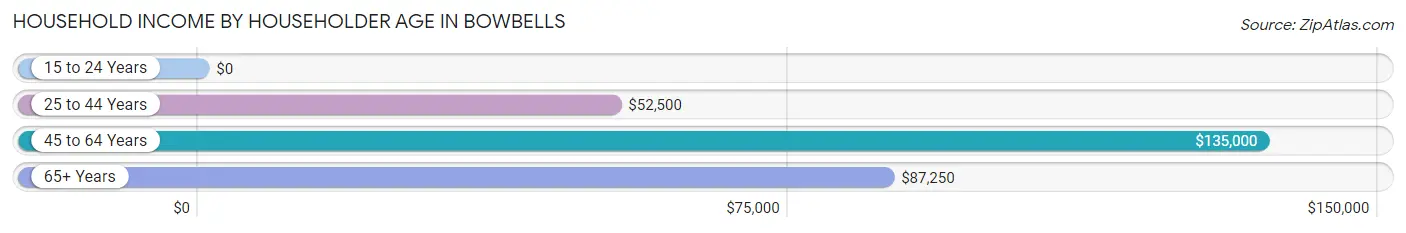
| Income Bracket | # Households | Median Income |
| 15 to 24 Years | 3 (2.0%) | $0 |
| 25 to 44 Years | 34 (22.7%) | $52,500 |
| 45 to 64 Years | 72 (48.0%) | $135,000 |
| 65+ Years | 41 (27.3%) | $87,250 |
| Total | 150 (100.0%) | $86,875 |
Poverty in Bowbells
Income Below Poverty by Sex and Age in Bowbells
With 2.0% poverty level for males and 5.2% for females among the residents of Bowbells, 75 year old and over males and 65 to 74 year old females are the most vulnerable to poverty, with 2 males (20.0%) and 2 females (16.7%) in their respective age groups living below the poverty level.
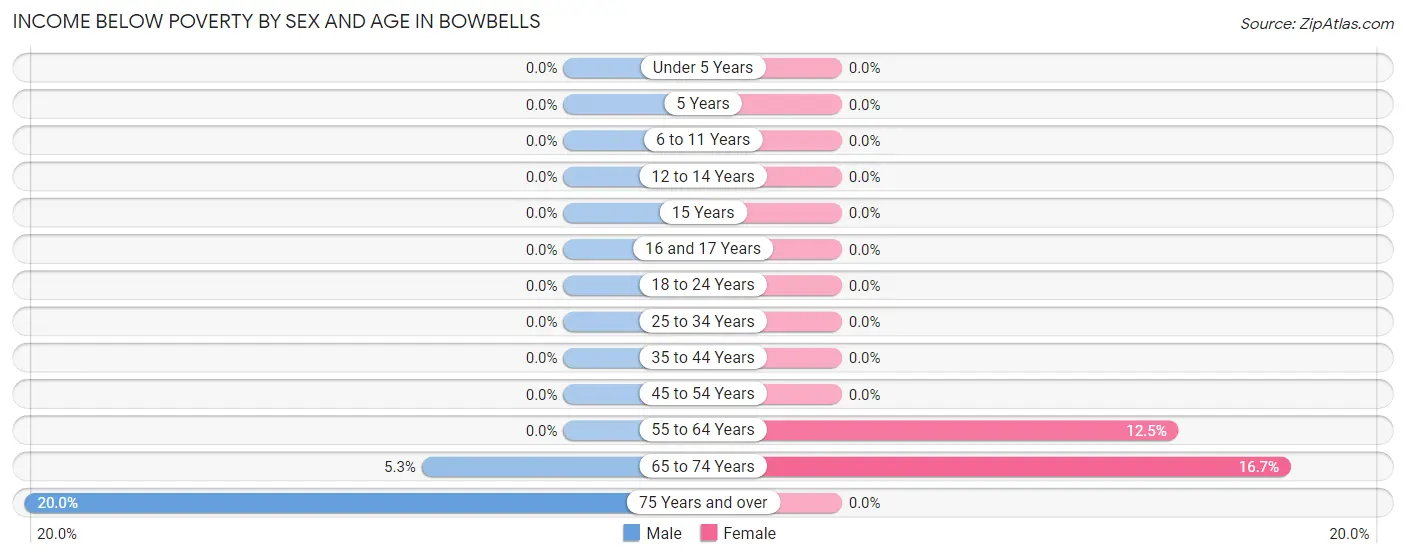
| Age Bracket | Male | Female |
| Under 5 Years | 0 (0.0%) | 0 (0.0%) |
| 5 Years | 0 (0.0%) | 0 (0.0%) |
| 6 to 11 Years | 0 (0.0%) | 0 (0.0%) |
| 12 to 14 Years | 0 (0.0%) | 0 (0.0%) |
| 15 Years | 0 (0.0%) | 0 (0.0%) |
| 16 and 17 Years | 0 (0.0%) | 0 (0.0%) |
| 18 to 24 Years | 0 (0.0%) | 0 (0.0%) |
| 25 to 34 Years | 0 (0.0%) | 0 (0.0%) |
| 35 to 44 Years | 0 (0.0%) | 0 (0.0%) |
| 45 to 54 Years | 0 (0.0%) | 0 (0.0%) |
| 55 to 64 Years | 0 (0.0%) | 5 (12.5%) |
| 65 to 74 Years | 1 (5.3%) | 2 (16.7%) |
| 75 Years and over | 2 (20.0%) | 0 (0.0%) |
| Total | 3 (2.0%) | 7 (5.2%) |
Income Above Poverty by Sex and Age in Bowbells
According to the poverty statistics in Bowbells, males aged under 5 years and females aged 5 years are the age groups that are most secure financially, with 100.0% of males and 100.0% of females in these age groups living above the poverty line.
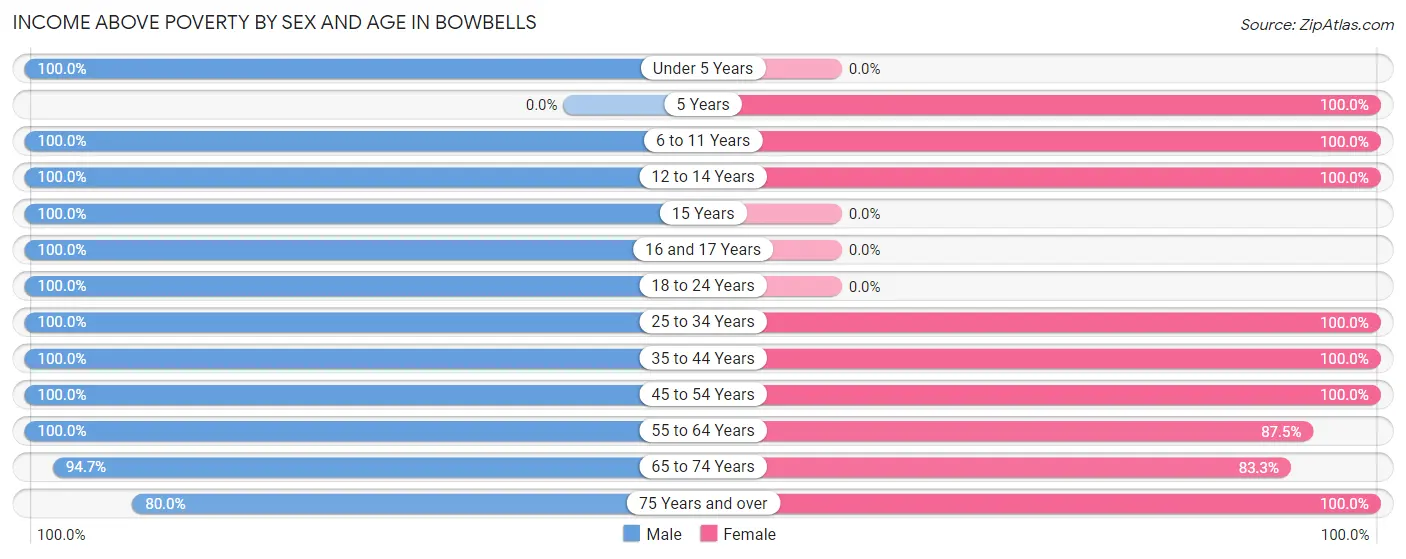
| Age Bracket | Male | Female |
| Under 5 Years | 10 (100.0%) | 0 (0.0%) |
| 5 Years | 0 (0.0%) | 2 (100.0%) |
| 6 to 11 Years | 12 (100.0%) | 6 (100.0%) |
| 12 to 14 Years | 2 (100.0%) | 6 (100.0%) |
| 15 Years | 6 (100.0%) | 0 (0.0%) |
| 16 and 17 Years | 1 (100.0%) | 0 (0.0%) |
| 18 to 24 Years | 6 (100.0%) | 0 (0.0%) |
| 25 to 34 Years | 29 (100.0%) | 19 (100.0%) |
| 35 to 44 Years | 6 (100.0%) | 7 (100.0%) |
| 45 to 54 Years | 19 (100.0%) | 24 (100.0%) |
| 55 to 64 Years | 31 (100.0%) | 35 (87.5%) |
| 65 to 74 Years | 18 (94.7%) | 10 (83.3%) |
| 75 Years and over | 8 (80.0%) | 18 (100.0%) |
| Total | 148 (98.0%) | 127 (94.8%) |
Income Below Poverty Among Married-Couple Families in Bowbells
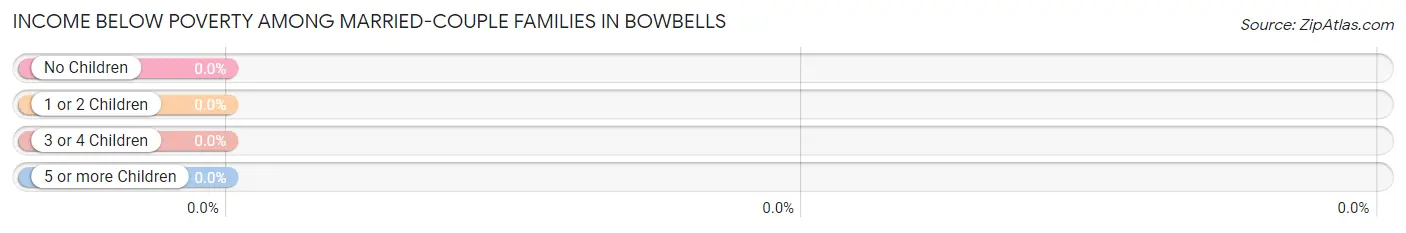
| Children | Above Poverty | Below Poverty |
| No Children | 49 (100.0%) | 0 (0.0%) |
| 1 or 2 Children | 26 (100.0%) | 0 (0.0%) |
| 3 or 4 Children | 2 (100.0%) | 0 (0.0%) |
| 5 or more Children | 0 (0.0%) | 0 (0.0%) |
| Total | 77 (100.0%) | 0 (0.0%) |
Income Below Poverty Among Single-Parent Households in Bowbells
| Children | Single Father | Single Mother |
| No Children | 0 (0.0%) | 0 (0.0%) |
| 1 or 2 Children | 0 (0.0%) | 0 (0.0%) |
| 3 or 4 Children | 0 (0.0%) | 0 (0.0%) |
| 5 or more Children | 0 (0.0%) | 0 (0.0%) |
| Total | 0 (0.0%) | 0 (0.0%) |
Income Below Poverty Among Married-Couple vs Single-Parent Households in Bowbells
| Children | Married-Couple Families | Single-Parent Households |
| No Children | 0 (0.0%) | 0 (0.0%) |
| 1 or 2 Children | 0 (0.0%) | 0 (0.0%) |
| 3 or 4 Children | 0 (0.0%) | 0 (0.0%) |
| 5 or more Children | 0 (0.0%) | 0 (0.0%) |
| Total | 0 (0.0%) | 0 (0.0%) |
Race in Bowbells
The most populous races in Bowbells are White / Caucasian (266 | 93.3%), Asian (12 | 4.2%), and Two or more Races (7 | 2.5%).
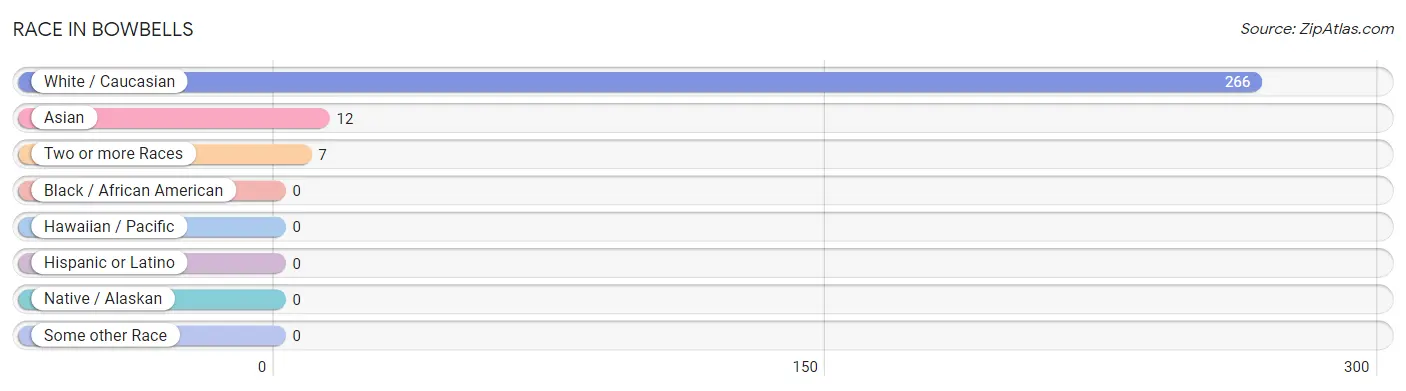
| Race | # Population | % Population |
| Asian | 12 | 4.2% |
| Black / African American | 0 | 0.0% |
| Hawaiian / Pacific | 0 | 0.0% |
| Hispanic or Latino | 0 | 0.0% |
| Native / Alaskan | 0 | 0.0% |
| White / Caucasian | 266 | 93.3% |
| Two or more Races | 7 | 2.5% |
| Some other Race | 0 | 0.0% |
| Total | 285 | 100.0% |
Ancestry in Bowbells
The most populous ancestries reported in Bowbells are Norwegian (103 | 36.1%), German (78 | 27.4%), Swedish (33 | 11.6%), Irish (26 | 9.1%), and Danish (24 | 8.4%), together accounting for 92.6% of all Bowbells residents.
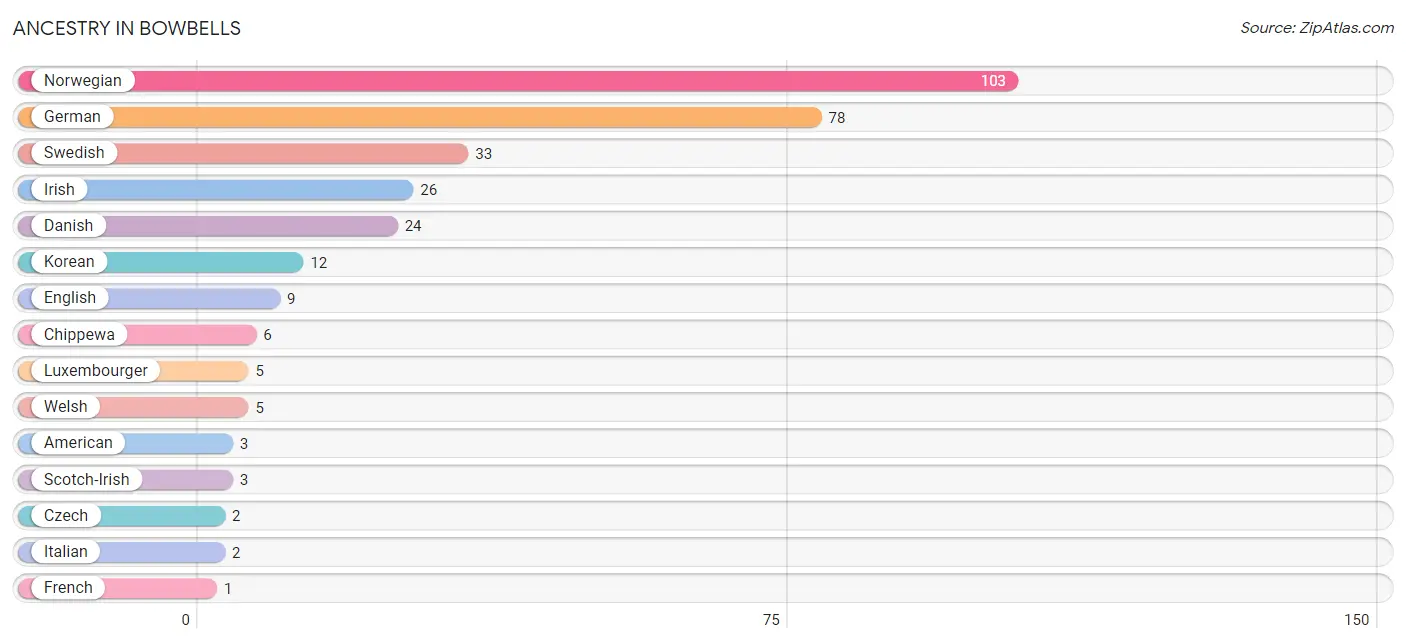
| Ancestry | # Population | % Population |
| American | 3 | 1.1% |
| Chippewa | 6 | 2.1% |
| Czech | 2 | 0.7% |
| Danish | 24 | 8.4% |
| English | 9 | 3.2% |
| French | 1 | 0.4% |
| French Canadian | 1 | 0.4% |
| German | 78 | 27.4% |
| Hungarian | 1 | 0.4% |
| Irish | 26 | 9.1% |
| Italian | 2 | 0.7% |
| Korean | 12 | 4.2% |
| Luxembourger | 5 | 1.8% |
| Norwegian | 103 | 36.1% |
| Scandinavian | 1 | 0.4% |
| Scotch-Irish | 3 | 1.1% |
| Swedish | 33 | 11.6% |
| Welsh | 5 | 1.8% | View All 18 Rows |
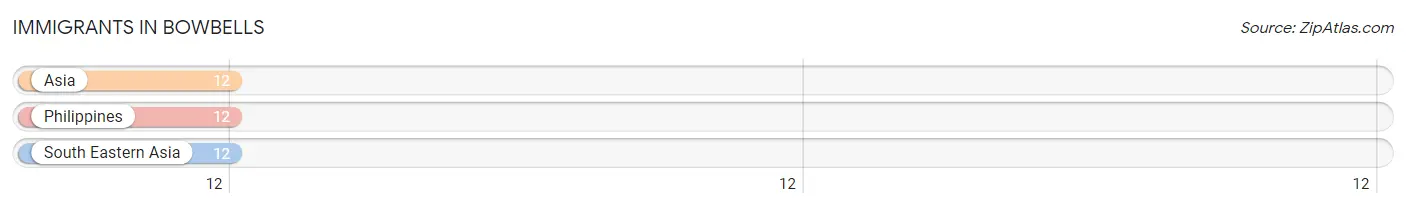
Immigrants in Bowbells
The most numerous immigrant groups reported in Bowbells came from Asia (12 | 4.2%), Philippines (12 | 4.2%), and South Eastern Asia (12 | 4.2%), together accounting for 12.6% of all Bowbells residents.
| Immigration Origin | # Population | % Population |
| Asia | 12 | 4.2% |
| Philippines | 12 | 4.2% |
| South Eastern Asia | 12 | 4.2% | View All 3 Rows |
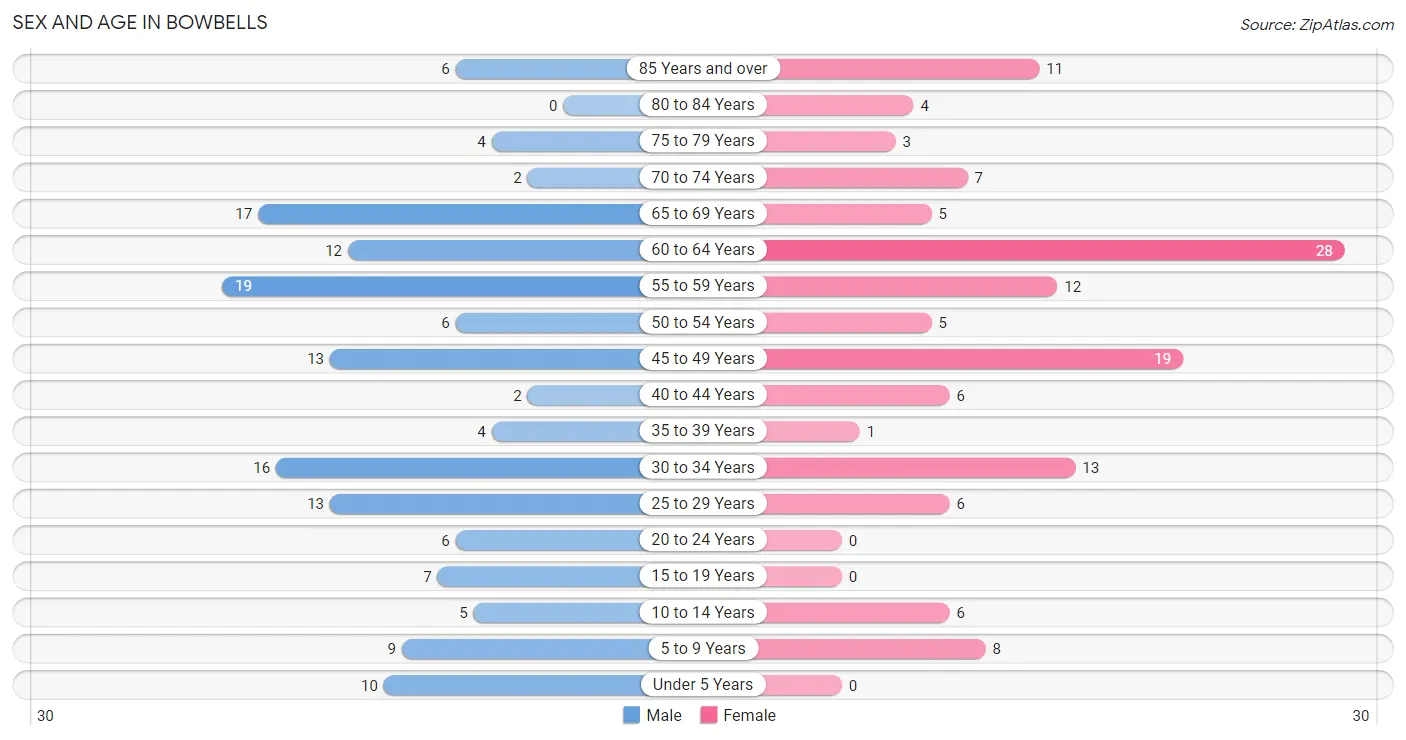
Sex and Age in Bowbells
Sex and Age in Bowbells
The most populous age groups in Bowbells are 55 to 59 Years (19 | 12.6%) for men and 60 to 64 Years (28 | 20.9%) for women.
| Age Bracket | Male | Female |
| Under 5 Years | 10 (6.6%) | 0 (0.0%) |
| 5 to 9 Years | 9 (6.0%) | 8 (6.0%) |
| 10 to 14 Years | 5 (3.3%) | 6 (4.5%) |
| 15 to 19 Years | 7 (4.6%) | 0 (0.0%) |
| 20 to 24 Years | 6 (4.0%) | 0 (0.0%) |
| 25 to 29 Years | 13 (8.6%) | 6 (4.5%) |
| 30 to 34 Years | 16 (10.6%) | 13 (9.7%) |
| 35 to 39 Years | 4 (2.6%) | 1 (0.7%) |
| 40 to 44 Years | 2 (1.3%) | 6 (4.5%) |
| 45 to 49 Years | 13 (8.6%) | 19 (14.2%) |
| 50 to 54 Years | 6 (4.0%) | 5 (3.7%) |
| 55 to 59 Years | 19 (12.6%) | 12 (9.0%) |
| 60 to 64 Years | 12 (8.0%) | 28 (20.9%) |
| 65 to 69 Years | 17 (11.3%) | 5 (3.7%) |
| 70 to 74 Years | 2 (1.3%) | 7 (5.2%) |
| 75 to 79 Years | 4 (2.6%) | 3 (2.2%) |
| 80 to 84 Years | 0 (0.0%) | 4 (3.0%) |
| 85 Years and over | 6 (4.0%) | 11 (8.2%) |
| Total | 151 (100.0%) | 134 (100.0%) |
Families and Households in Bowbells
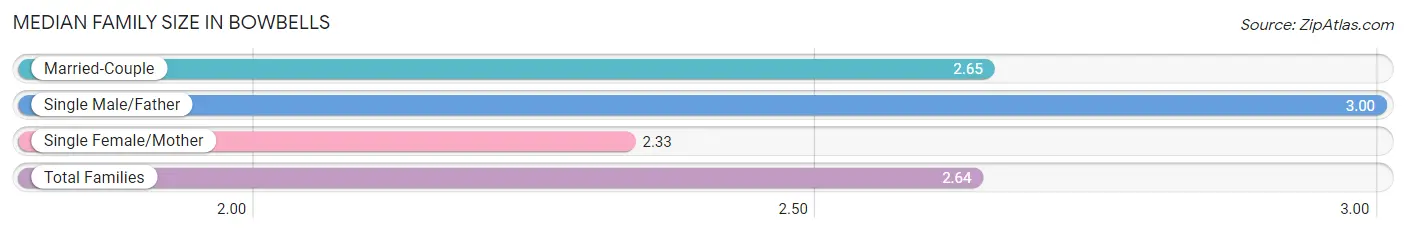
Median Family Size in Bowbells
The median family size in Bowbells is 2.64 persons per family, with single male/father families (1 | 1.2%) accounting for the largest median family size of 3 persons per family. On the other hand, single female/mother families (3 | 3.7%) represent the smallest median family size with 2.33 persons per family.
| Family Type | # Families | Family Size |
| Married-Couple | 77 (95.1%) | 2.65 |
| Single Male/Father | 1 (1.2%) | 3.00 |
| Single Female/Mother | 3 (3.7%) | 2.33 |
| Total Families | 81 (100.0%) | 2.64 |
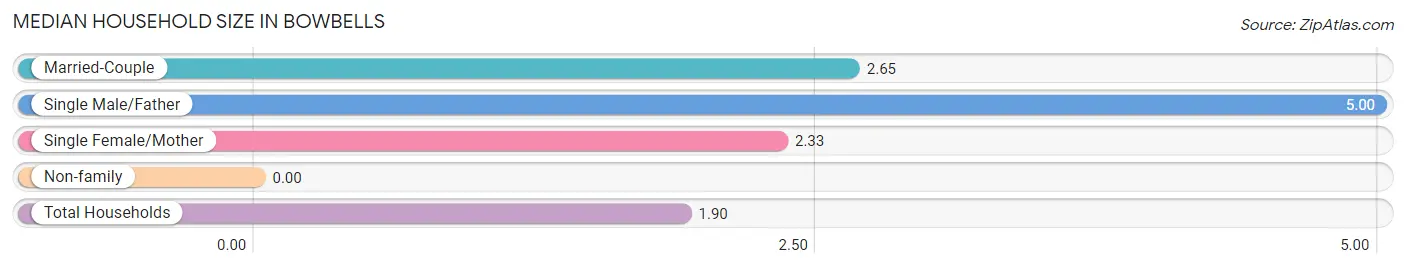
Median Household Size in Bowbells
| Household Type | # Households | Household Size |
| Married-Couple | 77 (51.3%) | 2.65 |
| Single Male/Father | 1 (0.7%) | 5.00 |
| Single Female/Mother | 3 (2.0%) | 2.33 |
| Non-family | 69 (46.0%) | - |
| Total Households | 150 (100.0%) | 1.90 |
Household Size by Marriage Status in Bowbells
Out of a total of 150 households in Bowbells, 81 (54.0%) are family households, while 69 (46.0%) are nonfamily households. The most numerous type of family households are 2-person households, comprising 46, and the most common type of nonfamily households are 1-person households, comprising 69.
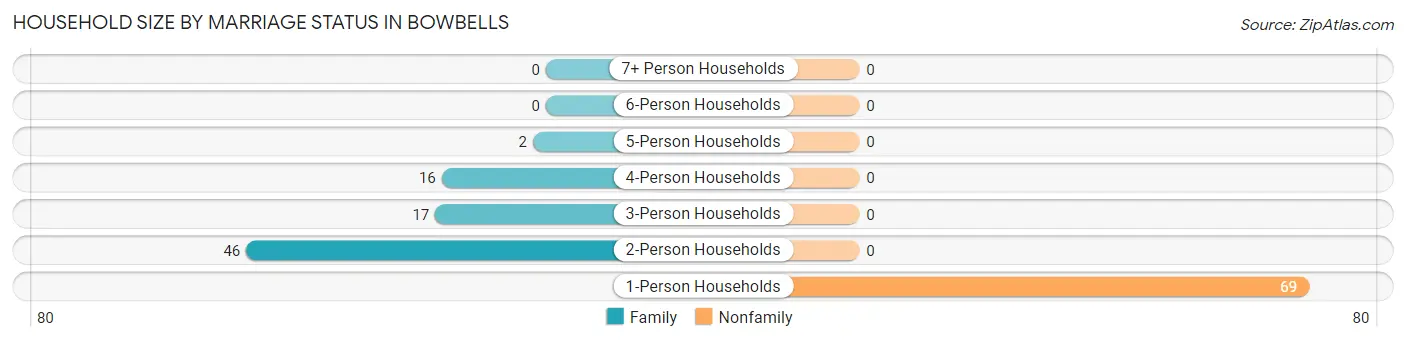
| Household Size | Family Households | Nonfamily Households |
| 1-Person Households | - | 69 (46.0%) |
| 2-Person Households | 46 (30.7%) | 0 (0.0%) |
| 3-Person Households | 17 (11.3%) | 0 (0.0%) |
| 4-Person Households | 16 (10.7%) | 0 (0.0%) |
| 5-Person Households | 2 (1.3%) | 0 (0.0%) |
| 6-Person Households | 0 (0.0%) | 0 (0.0%) |
| 7+ Person Households | 0 (0.0%) | 0 (0.0%) |
| Total | 81 (54.0%) | 69 (46.0%) |
Female Fertility in Bowbells
Fertility by Age in Bowbells
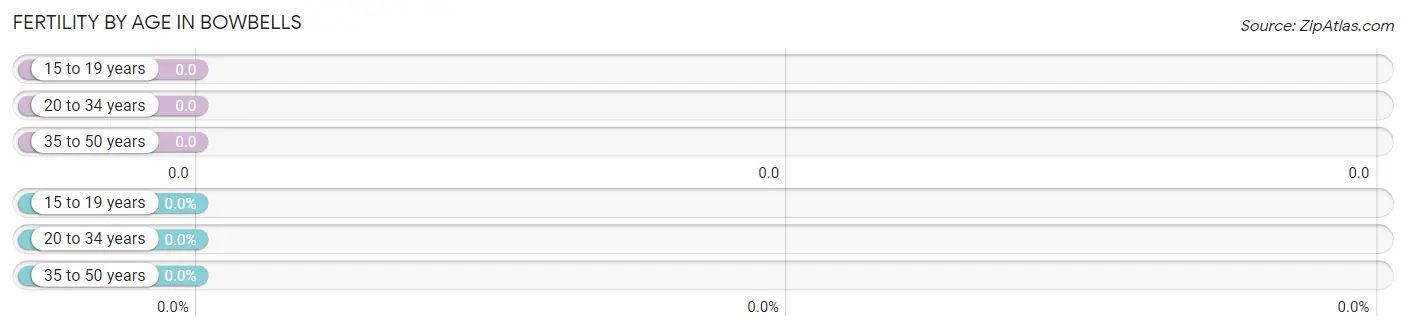
| Age Bracket | Women with Births | Births / 1,000 Women |
| 15 to 19 years | 0 (0.0%) | 0.0 |
| 20 to 34 years | 0 (0.0%) | 0.0 |
| 35 to 50 years | 0 (0.0%) | 0.0 |
| Total | 0 (0.0%) | 0.0 |
Fertility by Age by Marriage Status in Bowbells
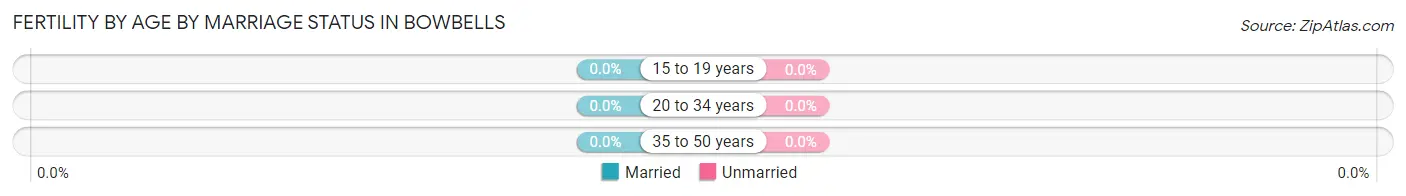
| Age Bracket | Married | Unmarried |
| 15 to 19 years | 0 (0.0%) | 0 (0.0%) |
| 20 to 34 years | 0 (0.0%) | 0 (0.0%) |
| 35 to 50 years | 0 (0.0%) | 0 (0.0%) |
| Total | 0 (0.0%) | 0 (0.0%) |
Fertility by Education in Bowbells
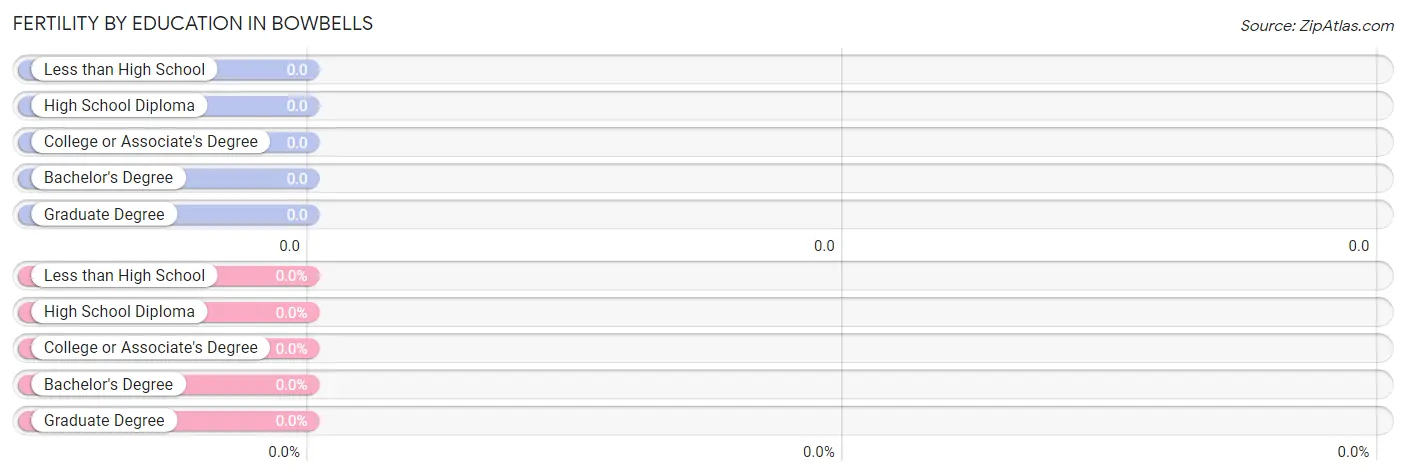
| Educational Attainment | Women with Births | Births / 1,000 Women |
| Less than High School | 0 (0.0%) | 0.0 |
| High School Diploma | 0 (0.0%) | 0.0 |
| College or Associate's Degree | 0 (0.0%) | 0.0 |
| Bachelor's Degree | 0 (0.0%) | 0.0 |
| Graduate Degree | 0 (0.0%) | 0.0 |
| Total | 0 (0.0%) | 0.0 |
Fertility by Education by Marriage Status in Bowbells
| Educational Attainment | Married | Unmarried |
| Less than High School | 0 (0.0%) | 0 (0.0%) |
| High School Diploma | 0 (0.0%) | 0 (0.0%) |
| College or Associate's Degree | 0 (0.0%) | 0 (0.0%) |
| Bachelor's Degree | 0 (0.0%) | 0 (0.0%) |
| Graduate Degree | 0 (0.0%) | 0 (0.0%) |
| Total | 0 (0.0%) | 0 (0.0%) |
Employment Characteristics in Bowbells
Employment by Class of Employer in Bowbells
Among the 184 employed individuals in Bowbells, private company employees (103 | 56.0%), local government employees (41 | 22.3%), and self-employed (not incorporated) (17 | 9.2%) make up the most common classes of employment.
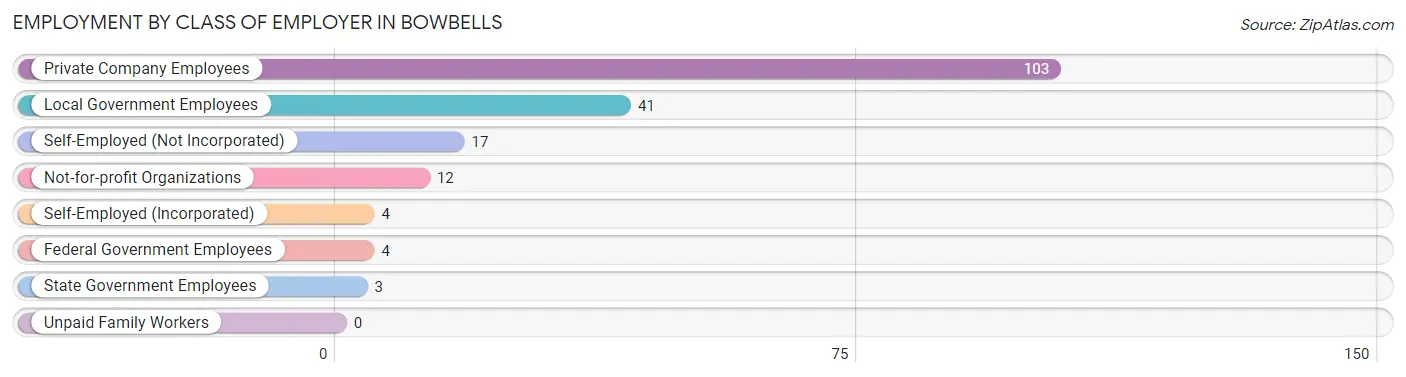
| Employer Class | # Employees | % Employees |
| Private Company Employees | 103 | 56.0% |
| Self-Employed (Incorporated) | 4 | 2.2% |
| Self-Employed (Not Incorporated) | 17 | 9.2% |
| Not-for-profit Organizations | 12 | 6.5% |
| Local Government Employees | 41 | 22.3% |
| State Government Employees | 3 | 1.6% |
| Federal Government Employees | 4 | 2.2% |
| Unpaid Family Workers | 0 | 0.0% |
| Total | 184 | 100.0% |
Employment Status by Age in Bowbells
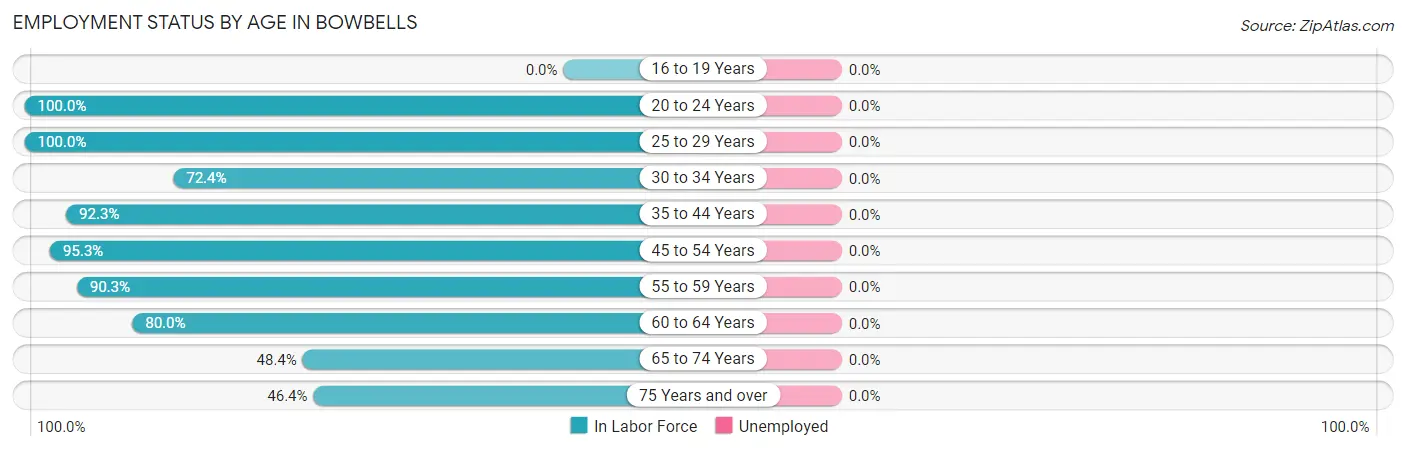
| Age Bracket | In Labor Force | Unemployed |
| 16 to 19 Years | 0 (0.0%) | 0 (0.0%) |
| 20 to 24 Years | 6 (100.0%) | 0 (0.0%) |
| 25 to 29 Years | 19 (100.0%) | 0 (0.0%) |
| 30 to 34 Years | 21 (72.4%) | 0 (0.0%) |
| 35 to 44 Years | 12 (92.3%) | 0 (0.0%) |
| 45 to 54 Years | 41 (95.3%) | 0 (0.0%) |
| 55 to 59 Years | 28 (90.3%) | 0 (0.0%) |
| 60 to 64 Years | 32 (80.0%) | 0 (0.0%) |
| 65 to 74 Years | 15 (48.4%) | 0 (0.0%) |
| 75 Years and over | 13 (46.4%) | 0 (0.0%) |
| Total | 187 (77.6%) | 0 (0.0%) |
Employment Status by Educational Attainment in Bowbells
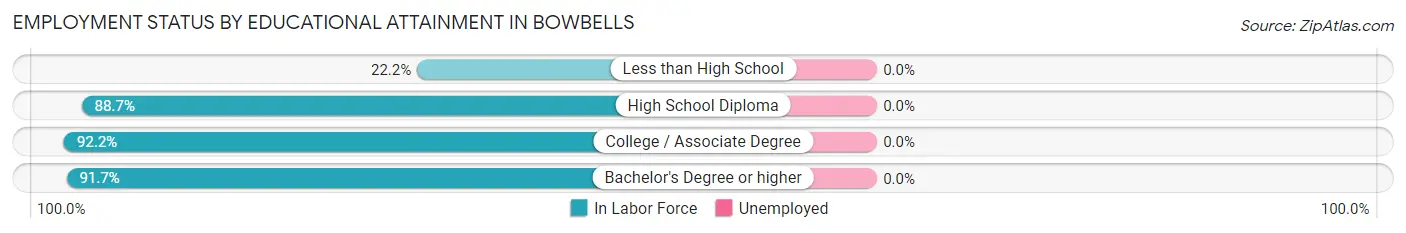
| Educational Attainment | In Labor Force | Unemployed |
| Less than High School | 2 (22.2%) | 0 (0.0%) |
| High School Diploma | 47 (88.7%) | 0 (0.0%) |
| College / Associate Degree | 71 (92.2%) | 0 (0.0%) |
| Bachelor's Degree or higher | 33 (91.7%) | 0 (0.0%) |
| Total | 153 (87.4%) | 0 (0.0%) |
Employment Occupations by Sex in Bowbells
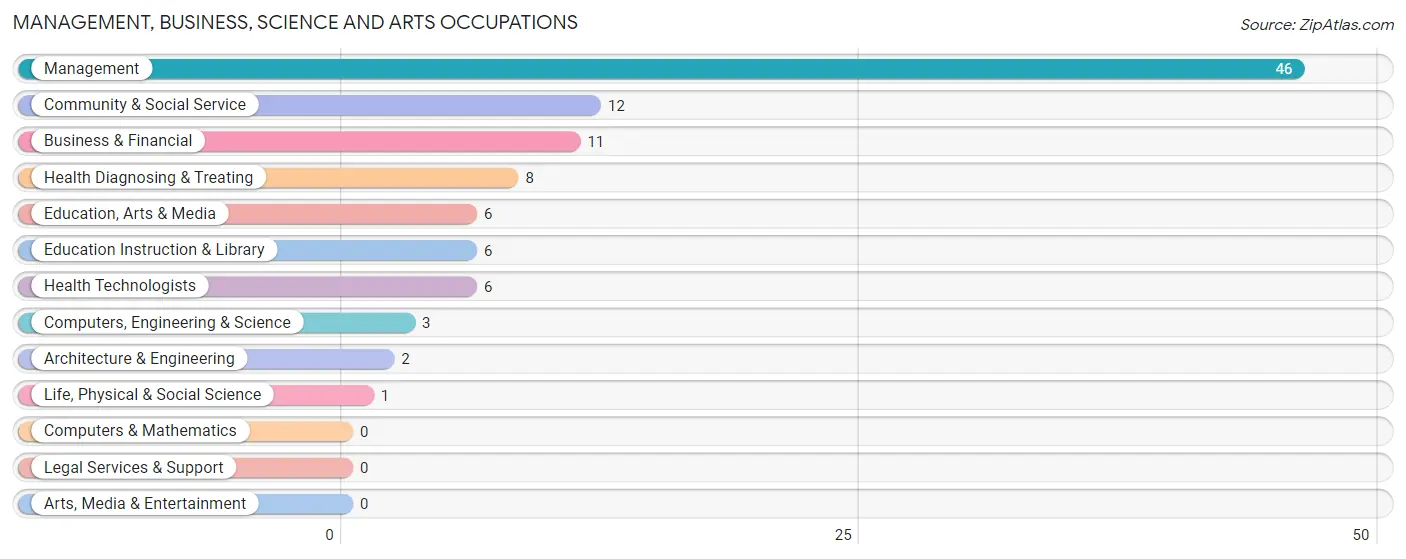
Management, Business, Science and Arts Occupations
The most common Management, Business, Science and Arts occupations in Bowbells are Management (46 | 24.6%), Community & Social Service (12 | 6.4%), Business & Financial (11 | 5.9%), Health Diagnosing & Treating (8 | 4.3%), and Education, Arts & Media (6 | 3.2%).
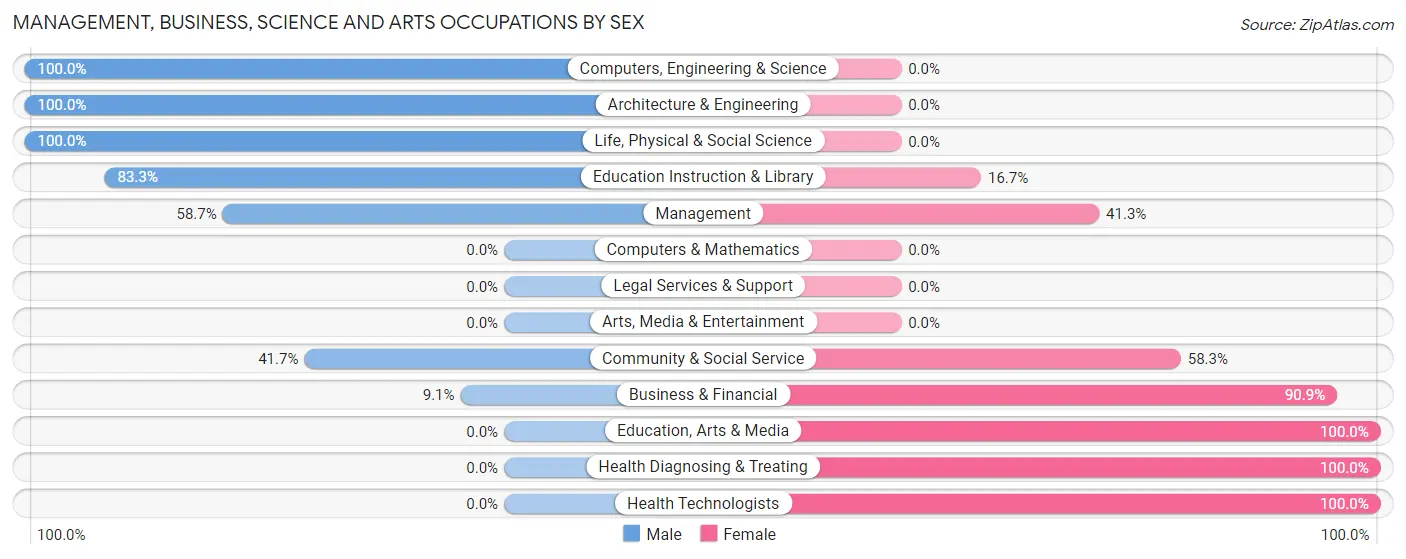
Management, Business, Science and Arts Occupations by Sex
Within the Management, Business, Science and Arts occupations in Bowbells, the most male-oriented occupations are Computers, Engineering & Science (100.0%), Architecture & Engineering (100.0%), and Life, Physical & Social Science (100.0%), while the most female-oriented occupations are Education, Arts & Media (100.0%), Health Diagnosing & Treating (100.0%), and Health Technologists (100.0%).
| Occupation | Male | Female |
| Management | 27 (58.7%) | 19 (41.3%) |
| Business & Financial | 1 (9.1%) | 10 (90.9%) |
| Computers, Engineering & Science | 3 (100.0%) | 0 (0.0%) |
| Computers & Mathematics | 0 (0.0%) | 0 (0.0%) |
| Architecture & Engineering | 2 (100.0%) | 0 (0.0%) |
| Life, Physical & Social Science | 1 (100.0%) | 0 (0.0%) |
| Community & Social Service | 5 (41.7%) | 7 (58.3%) |
| Education, Arts & Media | 0 (0.0%) | 6 (100.0%) |
| Legal Services & Support | 0 (0.0%) | 0 (0.0%) |
| Education Instruction & Library | 5 (83.3%) | 1 (16.7%) |
| Arts, Media & Entertainment | 0 (0.0%) | 0 (0.0%) |
| Health Diagnosing & Treating | 0 (0.0%) | 8 (100.0%) |
| Health Technologists | 0 (0.0%) | 6 (100.0%) |
| Total (Category) | 36 (45.0%) | 44 (55.0%) |
| Total (Overall) | 99 (52.9%) | 88 (47.1%) |
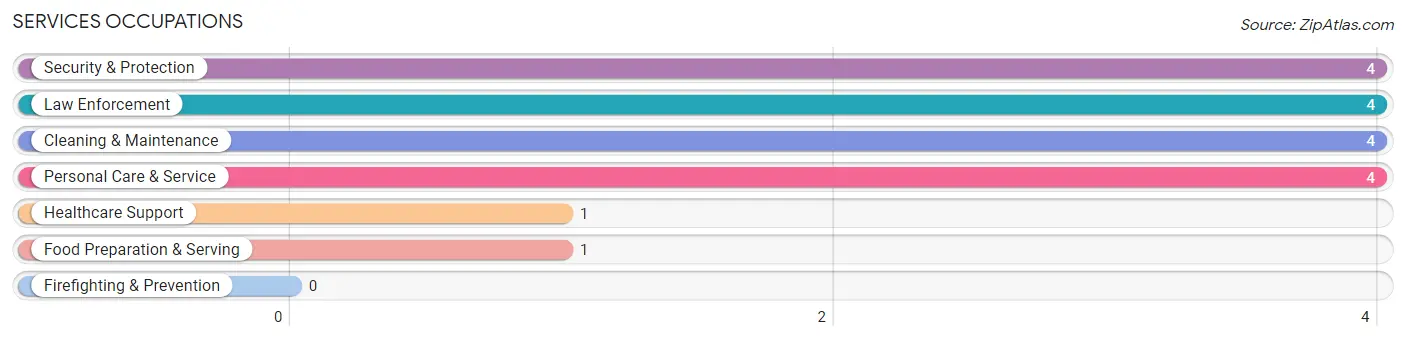
Services Occupations
The most common Services occupations in Bowbells are Security & Protection (4 | 2.1%), Law Enforcement (4 | 2.1%), Cleaning & Maintenance (4 | 2.1%), Personal Care & Service (4 | 2.1%), and Healthcare Support (1 | 0.5%).
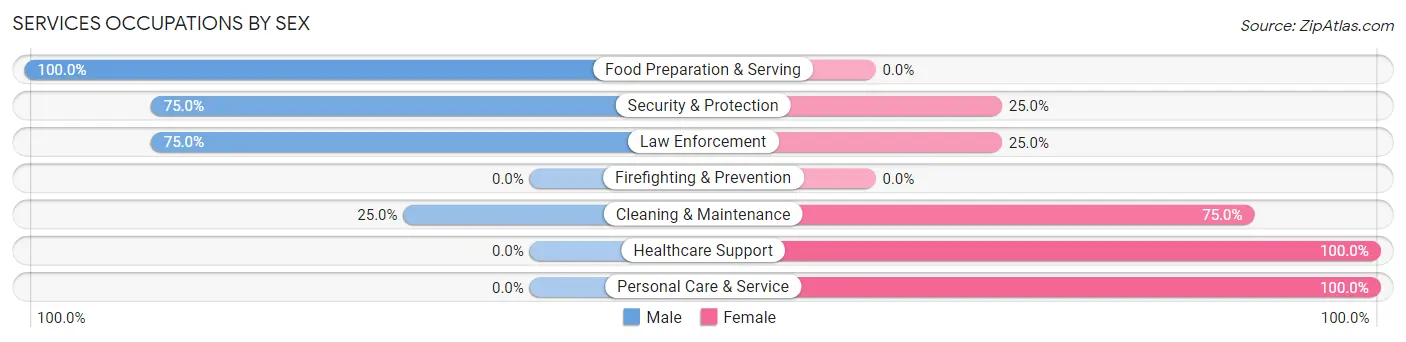
Services Occupations by Sex
Within the Services occupations in Bowbells, the most male-oriented occupations are Food Preparation & Serving (100.0%), Security & Protection (75.0%), and Law Enforcement (75.0%), while the most female-oriented occupations are Healthcare Support (100.0%), Personal Care & Service (100.0%), and Cleaning & Maintenance (75.0%).
| Occupation | Male | Female |
| Healthcare Support | 0 (0.0%) | 1 (100.0%) |
| Security & Protection | 3 (75.0%) | 1 (25.0%) |
| Firefighting & Prevention | 0 (0.0%) | 0 (0.0%) |
| Law Enforcement | 3 (75.0%) | 1 (25.0%) |
| Food Preparation & Serving | 1 (100.0%) | 0 (0.0%) |
| Cleaning & Maintenance | 1 (25.0%) | 3 (75.0%) |
| Personal Care & Service | 0 (0.0%) | 4 (100.0%) |
| Total (Category) | 5 (35.7%) | 9 (64.3%) |
| Total (Overall) | 99 (52.9%) | 88 (47.1%) |
Sales and Office Occupations
The most common Sales and Office occupations in Bowbells are Office & Administration (21 | 11.2%), and Sales & Related (18 | 9.6%).
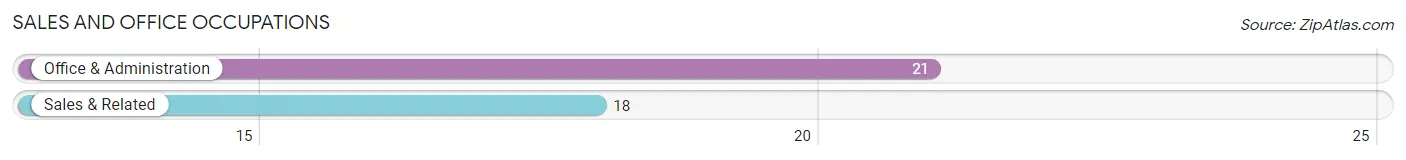
Sales and Office Occupations by Sex
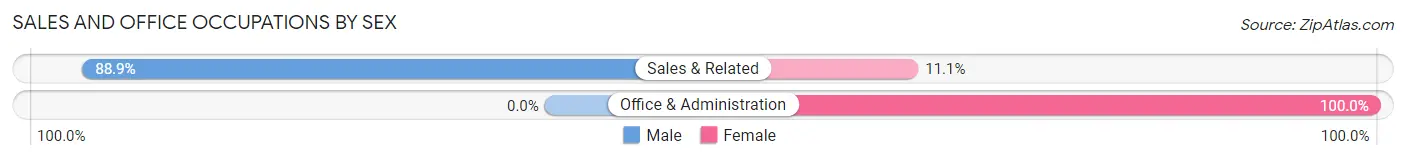
| Occupation | Male | Female |
| Sales & Related | 16 (88.9%) | 2 (11.1%) |
| Office & Administration | 0 (0.0%) | 21 (100.0%) |
| Total (Category) | 16 (41.0%) | 23 (59.0%) |
| Total (Overall) | 99 (52.9%) | 88 (47.1%) |
Natural Resources, Construction and Maintenance Occupations
The most common Natural Resources, Construction and Maintenance occupations in Bowbells are Construction & Extraction (15 | 8.0%), Installation, Maintenance & Repair (6 | 3.2%), and Farming, Fishing & Forestry (5 | 2.7%).
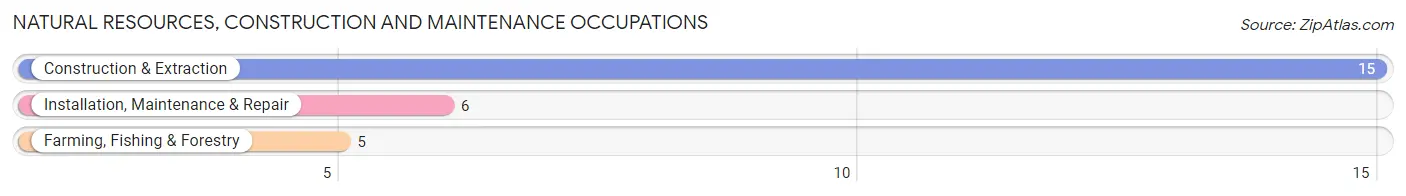
Natural Resources, Construction and Maintenance Occupations by Sex
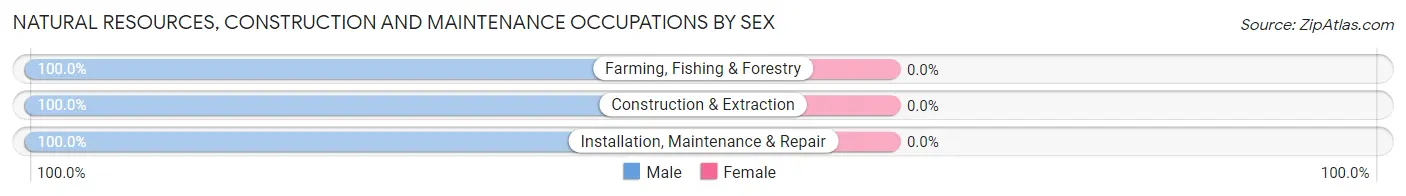
| Occupation | Male | Female |
| Farming, Fishing & Forestry | 5 (100.0%) | 0 (0.0%) |
| Construction & Extraction | 15 (100.0%) | 0 (0.0%) |
| Installation, Maintenance & Repair | 6 (100.0%) | 0 (0.0%) |
| Total (Category) | 26 (100.0%) | 0 (0.0%) |
| Total (Overall) | 99 (52.9%) | 88 (47.1%) |
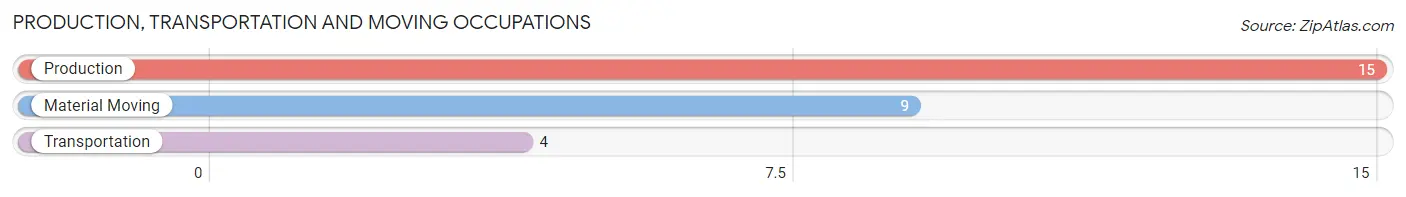
Production, Transportation and Moving Occupations
The most common Production, Transportation and Moving occupations in Bowbells are Production (15 | 8.0%), Material Moving (9 | 4.8%), and Transportation (4 | 2.1%).
Production, Transportation and Moving Occupations by Sex
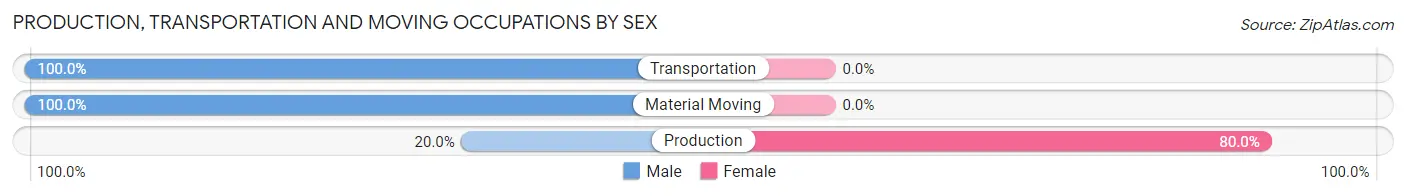
| Occupation | Male | Female |
| Production | 3 (20.0%) | 12 (80.0%) |
| Transportation | 4 (100.0%) | 0 (0.0%) |
| Material Moving | 9 (100.0%) | 0 (0.0%) |
| Total (Category) | 16 (57.1%) | 12 (42.9%) |
| Total (Overall) | 99 (52.9%) | 88 (47.1%) |
Employment Industries by Sex in Bowbells
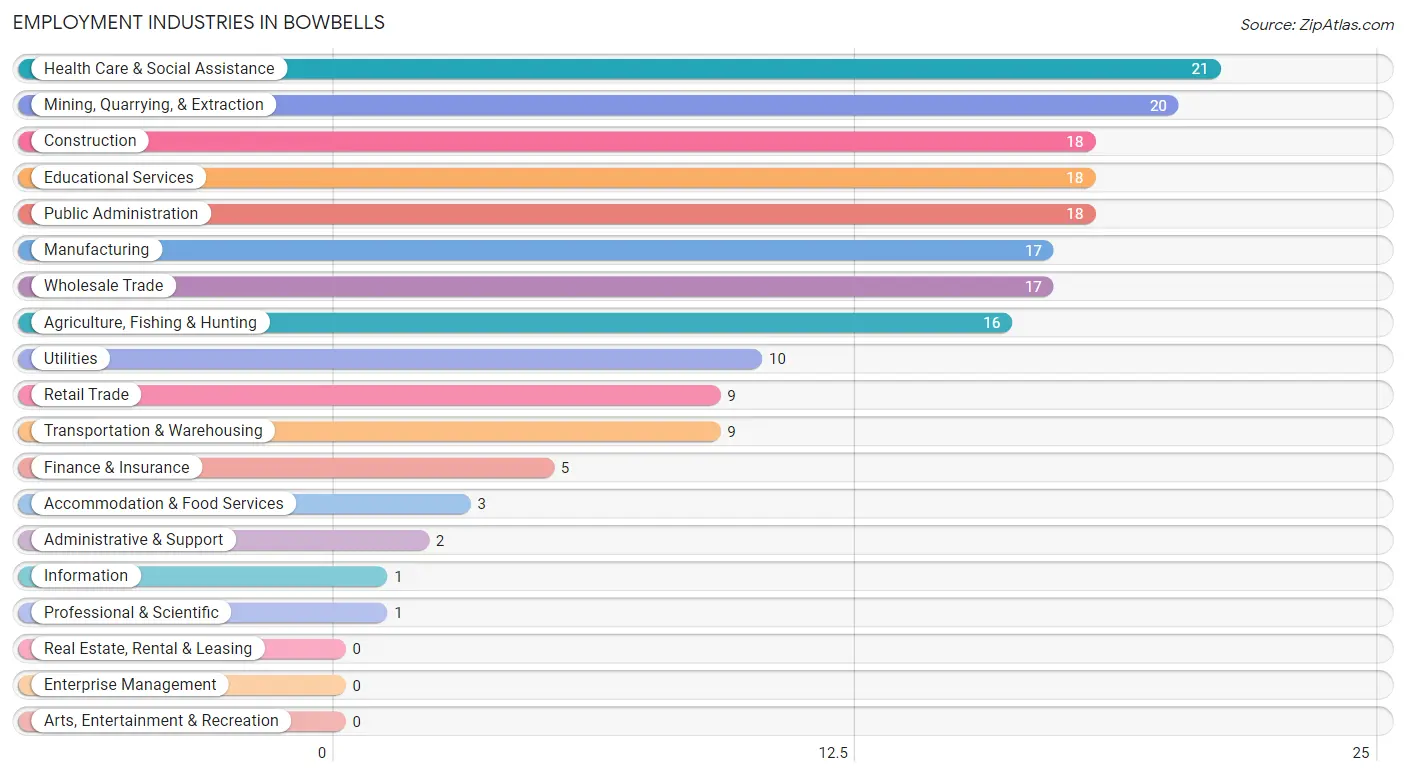
Employment Industries in Bowbells
The major employment industries in Bowbells include Health Care & Social Assistance (21 | 11.2%), Mining, Quarrying, & Extraction (20 | 10.7%), Construction (18 | 9.6%), Educational Services (18 | 9.6%), and Public Administration (18 | 9.6%).
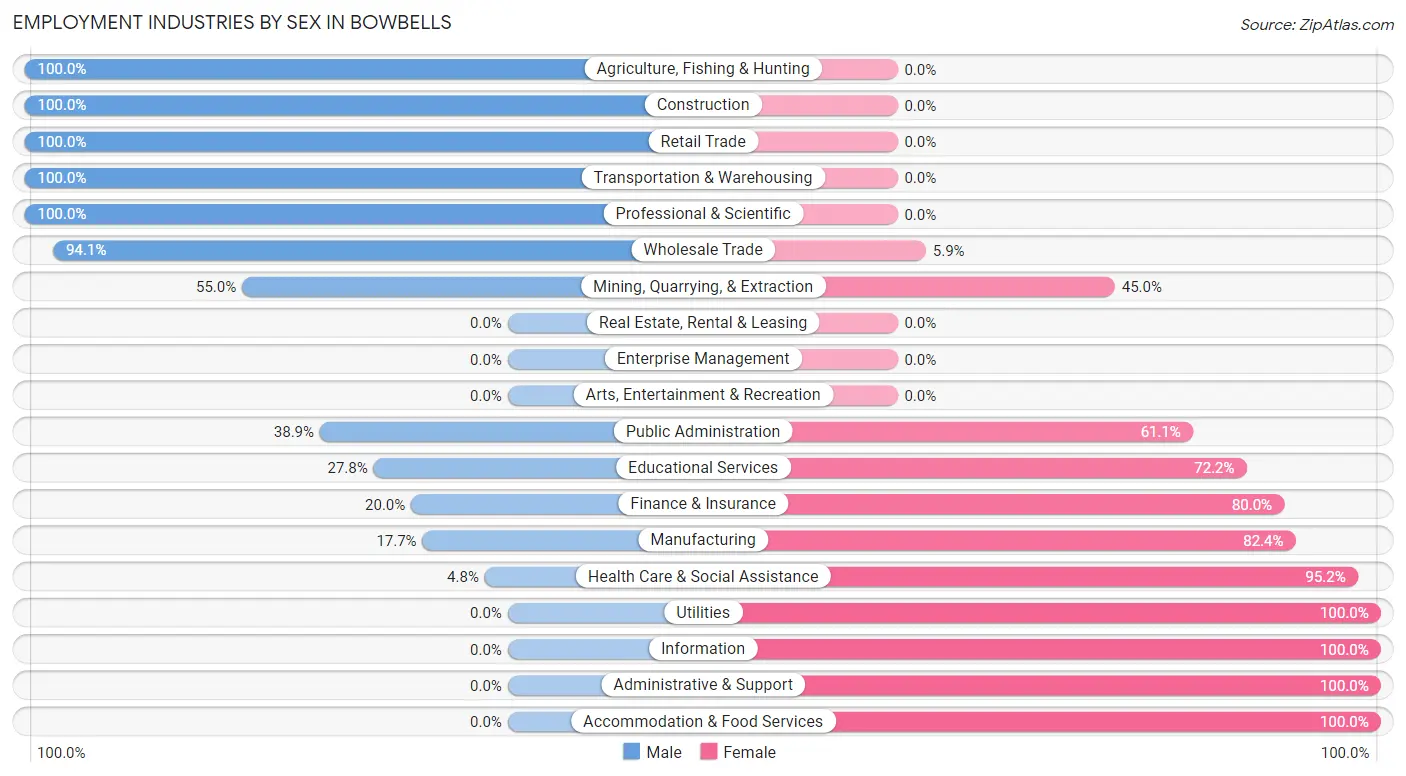
Employment Industries by Sex in Bowbells
The Bowbells industries that see more men than women are Agriculture, Fishing & Hunting (100.0%), Construction (100.0%), and Retail Trade (100.0%), whereas the industries that tend to have a higher number of women are Utilities (100.0%), Information (100.0%), and Administrative & Support (100.0%).
| Industry | Male | Female |
| Agriculture, Fishing & Hunting | 16 (100.0%) | 0 (0.0%) |
| Mining, Quarrying, & Extraction | 11 (55.0%) | 9 (45.0%) |
| Construction | 18 (100.0%) | 0 (0.0%) |
| Manufacturing | 3 (17.6%) | 14 (82.4%) |
| Wholesale Trade | 16 (94.1%) | 1 (5.9%) |
| Retail Trade | 9 (100.0%) | 0 (0.0%) |
| Transportation & Warehousing | 9 (100.0%) | 0 (0.0%) |
| Utilities | 0 (0.0%) | 10 (100.0%) |
| Information | 0 (0.0%) | 1 (100.0%) |
| Finance & Insurance | 1 (20.0%) | 4 (80.0%) |
| Real Estate, Rental & Leasing | 0 (0.0%) | 0 (0.0%) |
| Professional & Scientific | 1 (100.0%) | 0 (0.0%) |
| Enterprise Management | 0 (0.0%) | 0 (0.0%) |
| Administrative & Support | 0 (0.0%) | 2 (100.0%) |
| Educational Services | 5 (27.8%) | 13 (72.2%) |
| Health Care & Social Assistance | 1 (4.8%) | 20 (95.2%) |
| Arts, Entertainment & Recreation | 0 (0.0%) | 0 (0.0%) |
| Accommodation & Food Services | 0 (0.0%) | 3 (100.0%) |
| Public Administration | 7 (38.9%) | 11 (61.1%) |
| Total | 99 (52.9%) | 88 (47.1%) |
Education in Bowbells
School Enrollment in Bowbells
The most common levels of schooling among the 35 students in Bowbells are elementary school (12 | 34.3%), middle school (11 | 31.4%), and high school (7 | 20.0%).
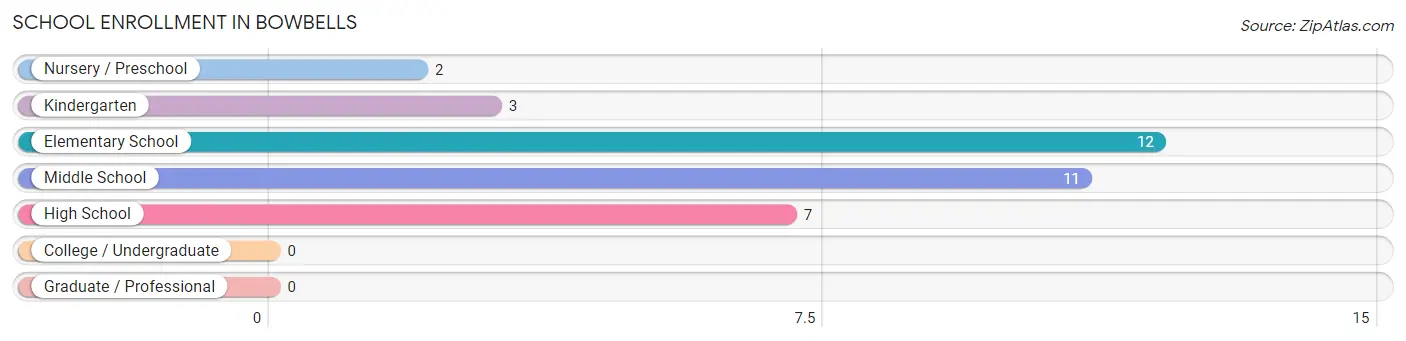
| School Level | # Students | % Students |
| Nursery / Preschool | 2 | 5.7% |
| Kindergarten | 3 | 8.6% |
| Elementary School | 12 | 34.3% |
| Middle School | 11 | 31.4% |
| High School | 7 | 20.0% |
| College / Undergraduate | 0 | 0.0% |
| Graduate / Professional | 0 | 0.0% |
| Total | 35 | 100.0% |
School Enrollment by Age by Funding Source in Bowbells
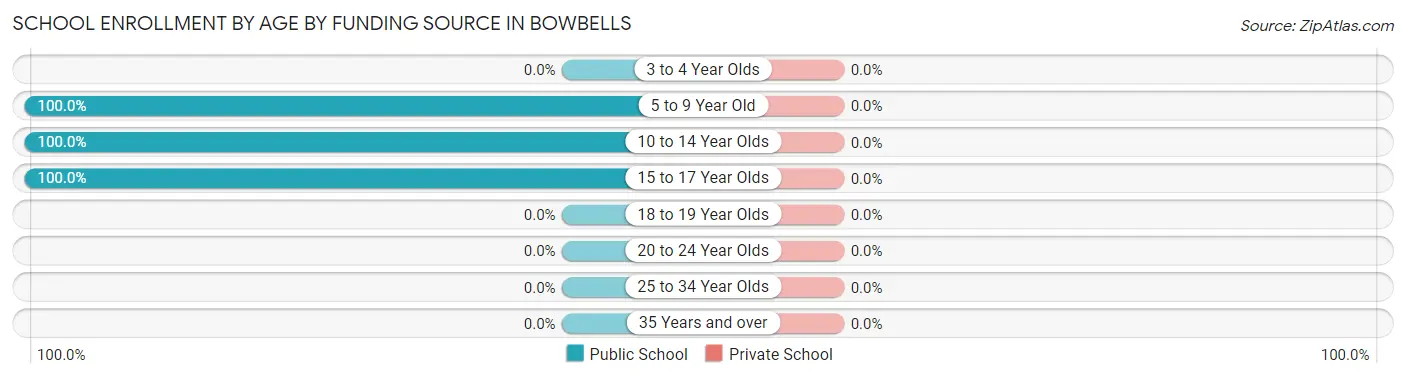
| Age Bracket | Public School | Private School |
| 3 to 4 Year Olds | 0 (0.0%) | 0 (0.0%) |
| 5 to 9 Year Old | 17 (100.0%) | 0 (0.0%) |
| 10 to 14 Year Olds | 11 (100.0%) | 0 (0.0%) |
| 15 to 17 Year Olds | 7 (100.0%) | 0 (0.0%) |
| 18 to 19 Year Olds | 0 (0.0%) | 0 (0.0%) |
| 20 to 24 Year Olds | 0 (0.0%) | 0 (0.0%) |
| 25 to 34 Year Olds | 0 (0.0%) | 0 (0.0%) |
| 35 Years and over | 0 (0.0%) | 0 (0.0%) |
| Total | 35 (100.0%) | 0 (0.0%) |
Educational Attainment by Field of Study in Bowbells
Arts & humanities (16 | 29.1%), education (14 | 25.5%), bio, nature & agricultural (11 | 20.0%), science & technology (5 | 9.1%), and business (5 | 9.1%) are the most common fields of study among 55 individuals in Bowbells who have obtained a bachelor's degree or higher.
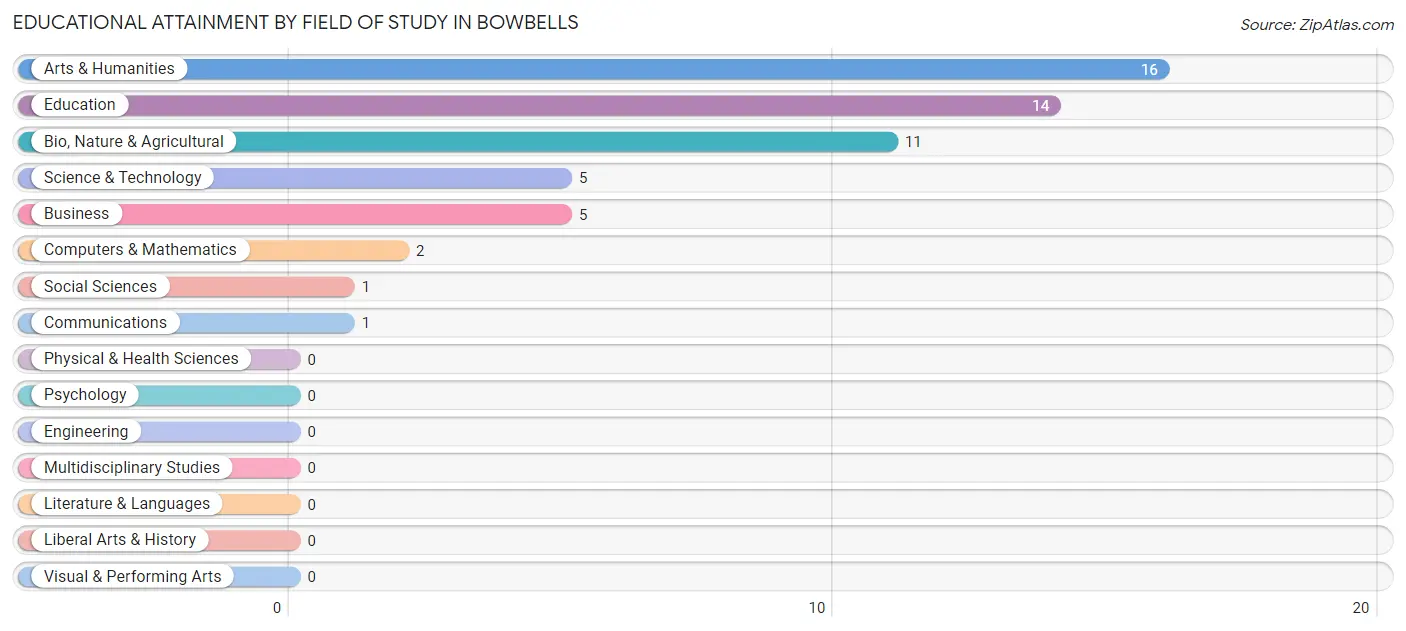
| Field of Study | # Graduates | % Graduates |
| Computers & Mathematics | 2 | 3.6% |
| Bio, Nature & Agricultural | 11 | 20.0% |
| Physical & Health Sciences | 0 | 0.0% |
| Psychology | 0 | 0.0% |
| Social Sciences | 1 | 1.8% |
| Engineering | 0 | 0.0% |
| Multidisciplinary Studies | 0 | 0.0% |
| Science & Technology | 5 | 9.1% |
| Business | 5 | 9.1% |
| Education | 14 | 25.5% |
| Literature & Languages | 0 | 0.0% |
| Liberal Arts & History | 0 | 0.0% |
| Visual & Performing Arts | 0 | 0.0% |
| Communications | 1 | 1.8% |
| Arts & Humanities | 16 | 29.1% |
| Total | 55 | 100.0% |
Transportation & Commute in Bowbells
Vehicle Availability by Sex in Bowbells
The most prevalent vehicle ownership categories in Bowbells are males with 1 vehicle (23, accounting for 24.0%) and females with 1 vehicle (18, making up 26.1%).
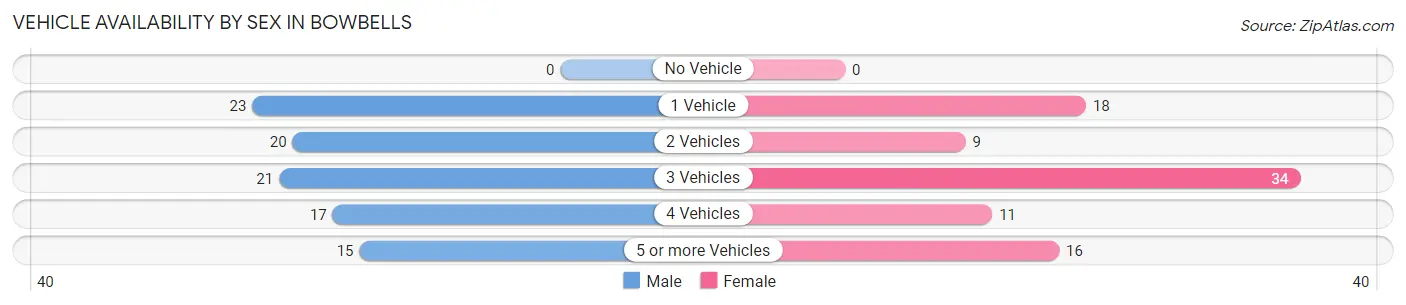
| Vehicles Available | Male | Female |
| No Vehicle | 0 (0.0%) | 0 (0.0%) |
| 1 Vehicle | 23 (24.0%) | 18 (20.4%) |
| 2 Vehicles | 20 (20.8%) | 9 (10.2%) |
| 3 Vehicles | 21 (21.9%) | 34 (38.6%) |
| 4 Vehicles | 17 (17.7%) | 11 (12.5%) |
| 5 or more Vehicles | 15 (15.6%) | 16 (18.2%) |
| Total | 96 (100.0%) | 88 (100.0%) |
Commute Time in Bowbells
The most frequently occuring commute durations in Bowbells are less than 5 minutes (48 commuters, 26.7%), 5 to 9 minutes (43 commuters, 23.9%), and 90 or more minutes (24 commuters, 13.3%).
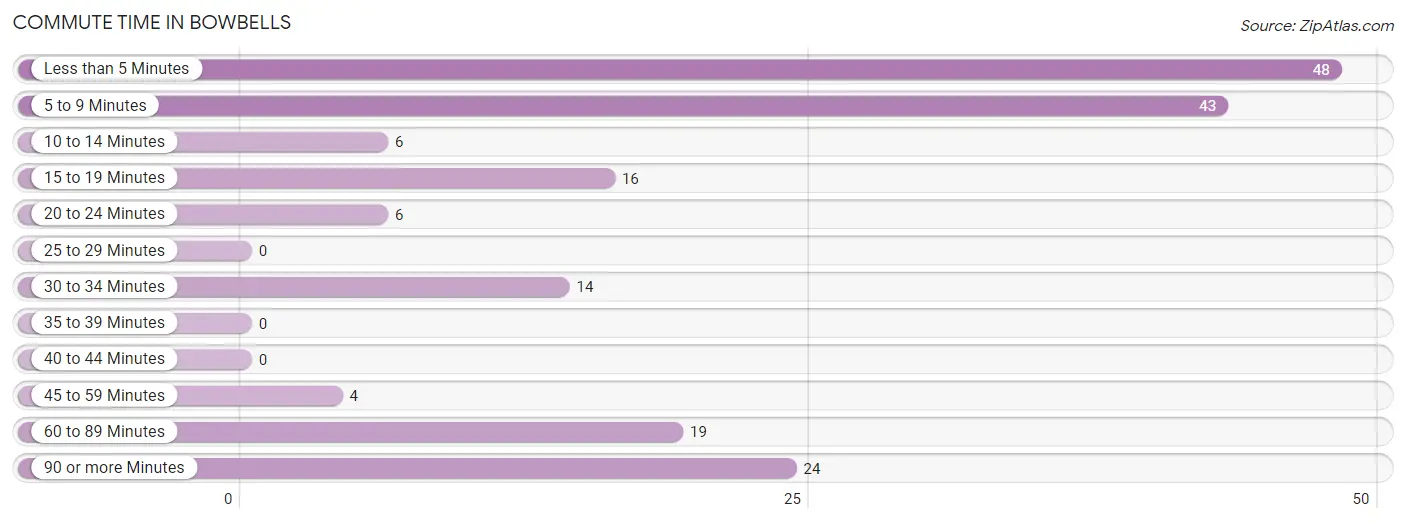
| Commute Time | # Commuters | % Commuters |
| Less than 5 Minutes | 48 | 26.7% |
| 5 to 9 Minutes | 43 | 23.9% |
| 10 to 14 Minutes | 6 | 3.3% |
| 15 to 19 Minutes | 16 | 8.9% |
| 20 to 24 Minutes | 6 | 3.3% |
| 25 to 29 Minutes | 0 | 0.0% |
| 30 to 34 Minutes | 14 | 7.8% |
| 35 to 39 Minutes | 0 | 0.0% |
| 40 to 44 Minutes | 0 | 0.0% |
| 45 to 59 Minutes | 4 | 2.2% |
| 60 to 89 Minutes | 19 | 10.6% |
| 90 or more Minutes | 24 | 13.3% |
Commute Time by Sex in Bowbells
The most common commute times in Bowbells are less than 5 minutes (29 commuters, 31.2%) for males and 5 to 9 minutes (23 commuters, 26.4%) for females.
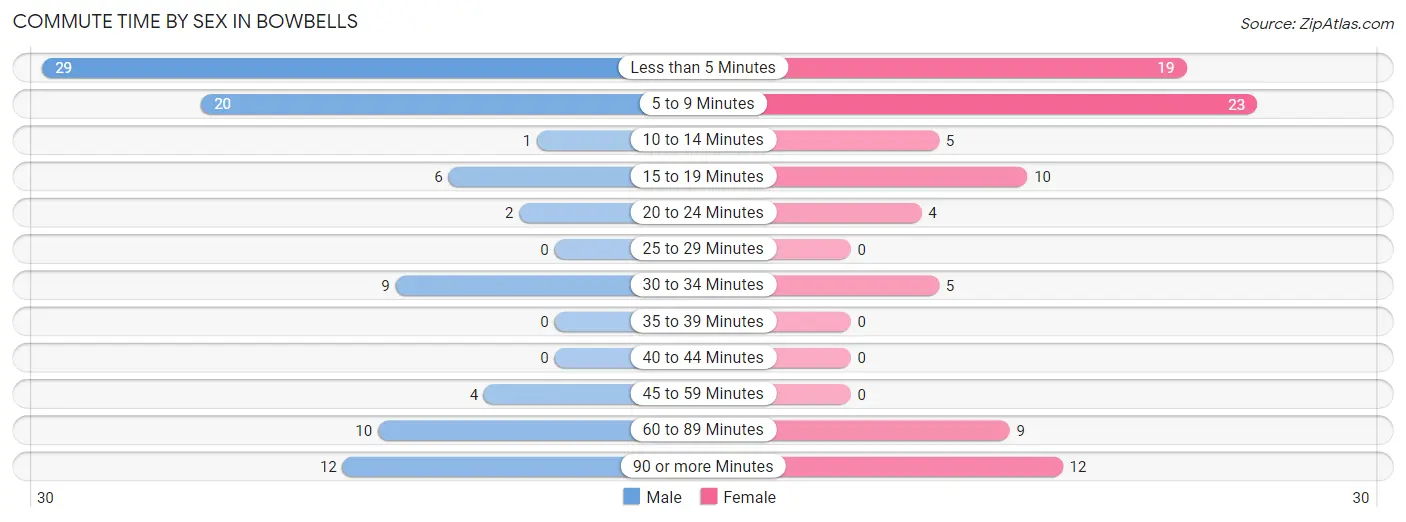
| Commute Time | Male | Female |
| Less than 5 Minutes | 29 (31.2%) | 19 (21.8%) |
| 5 to 9 Minutes | 20 (21.5%) | 23 (26.4%) |
| 10 to 14 Minutes | 1 (1.1%) | 5 (5.8%) |
| 15 to 19 Minutes | 6 (6.5%) | 10 (11.5%) |
| 20 to 24 Minutes | 2 (2.1%) | 4 (4.6%) |
| 25 to 29 Minutes | 0 (0.0%) | 0 (0.0%) |
| 30 to 34 Minutes | 9 (9.7%) | 5 (5.8%) |
| 35 to 39 Minutes | 0 (0.0%) | 0 (0.0%) |
| 40 to 44 Minutes | 0 (0.0%) | 0 (0.0%) |
| 45 to 59 Minutes | 4 (4.3%) | 0 (0.0%) |
| 60 to 89 Minutes | 10 (10.7%) | 9 (10.3%) |
| 90 or more Minutes | 12 (12.9%) | 12 (13.8%) |
Time of Departure to Work by Sex in Bowbells
The most frequent times of departure to work in Bowbells are 6:30 AM to 6:59 AM (18, 19.4%) for males and 7:30 AM to 7:59 AM (32, 36.8%) for females.
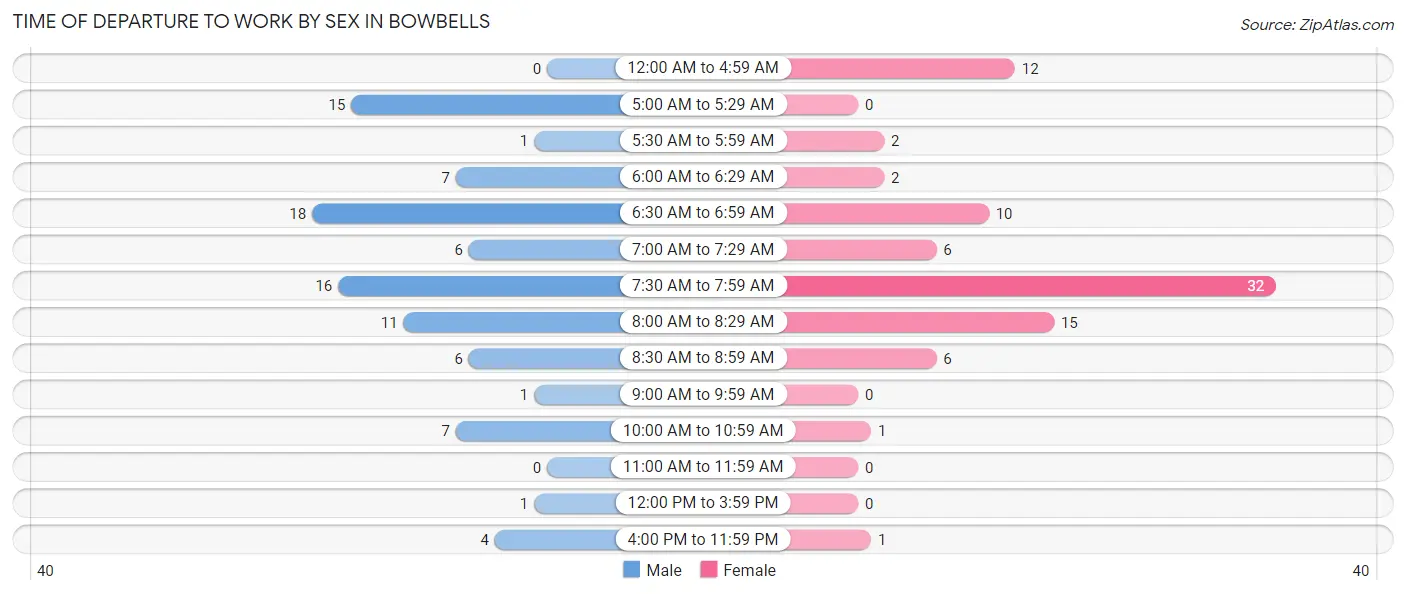
| Time of Departure | Male | Female |
| 12:00 AM to 4:59 AM | 0 (0.0%) | 12 (13.8%) |
| 5:00 AM to 5:29 AM | 15 (16.1%) | 0 (0.0%) |
| 5:30 AM to 5:59 AM | 1 (1.1%) | 2 (2.3%) |
| 6:00 AM to 6:29 AM | 7 (7.5%) | 2 (2.3%) |
| 6:30 AM to 6:59 AM | 18 (19.4%) | 10 (11.5%) |
| 7:00 AM to 7:29 AM | 6 (6.5%) | 6 (6.9%) |
| 7:30 AM to 7:59 AM | 16 (17.2%) | 32 (36.8%) |
| 8:00 AM to 8:29 AM | 11 (11.8%) | 15 (17.2%) |
| 8:30 AM to 8:59 AM | 6 (6.5%) | 6 (6.9%) |
| 9:00 AM to 9:59 AM | 1 (1.1%) | 0 (0.0%) |
| 10:00 AM to 10:59 AM | 7 (7.5%) | 1 (1.1%) |
| 11:00 AM to 11:59 AM | 0 (0.0%) | 0 (0.0%) |
| 12:00 PM to 3:59 PM | 1 (1.1%) | 0 (0.0%) |
| 4:00 PM to 11:59 PM | 4 (4.3%) | 1 (1.1%) |
| Total | 93 (100.0%) | 87 (100.0%) |
Housing Occupancy in Bowbells
Occupancy by Ownership in Bowbells
Of the total 150 dwellings in Bowbells, owner-occupied units account for 121 (80.7%), while renter-occupied units make up 29 (19.3%).
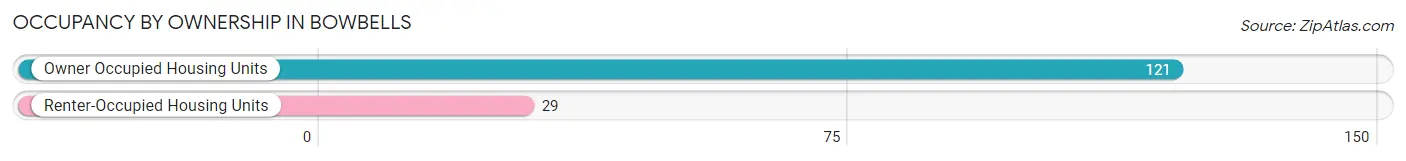
| Occupancy | # Housing Units | % Housing Units |
| Owner Occupied Housing Units | 121 | 80.7% |
| Renter-Occupied Housing Units | 29 | 19.3% |
| Total Occupied Housing Units | 150 | 100.0% |
Occupancy by Household Size in Bowbells
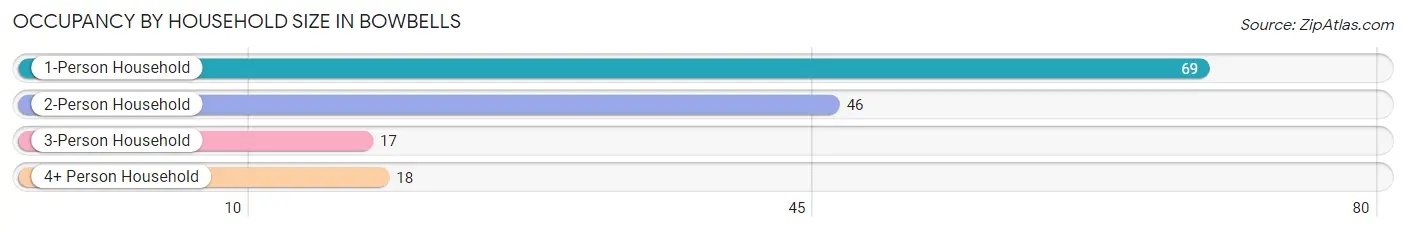
| Household Size | # Housing Units | % Housing Units |
| 1-Person Household | 69 | 46.0% |
| 2-Person Household | 46 | 30.7% |
| 3-Person Household | 17 | 11.3% |
| 4+ Person Household | 18 | 12.0% |
| Total Housing Units | 150 | 100.0% |
Occupancy by Ownership by Household Size in Bowbells
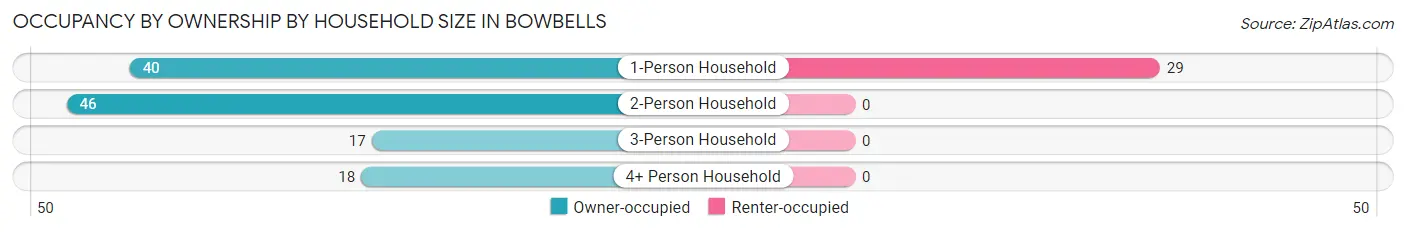
| Household Size | Owner-occupied | Renter-occupied |
| 1-Person Household | 40 (58.0%) | 29 (42.0%) |
| 2-Person Household | 46 (100.0%) | 0 (0.0%) |
| 3-Person Household | 17 (100.0%) | 0 (0.0%) |
| 4+ Person Household | 18 (100.0%) | 0 (0.0%) |
| Total Housing Units | 121 (80.7%) | 29 (19.3%) |
Occupancy by Educational Attainment in Bowbells
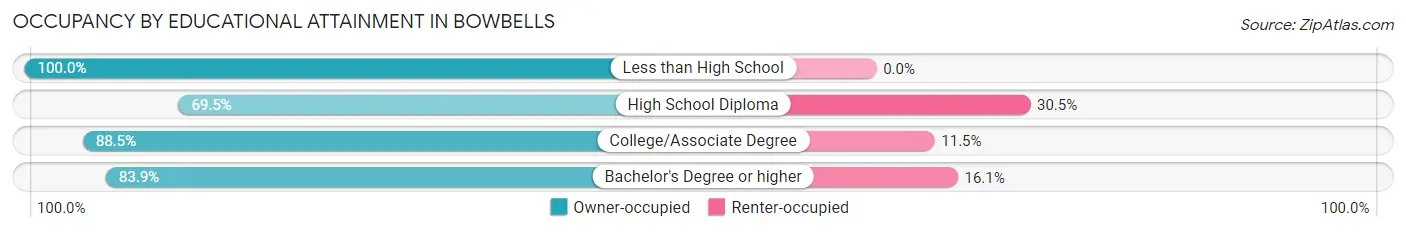
| Household Size | Owner-occupied | Renter-occupied |
| Less than High School | 8 (100.0%) | 0 (0.0%) |
| High School Diploma | 41 (69.5%) | 18 (30.5%) |
| College/Associate Degree | 46 (88.5%) | 6 (11.5%) |
| Bachelor's Degree or higher | 26 (83.9%) | 5 (16.1%) |
Occupancy by Age of Householder in Bowbells
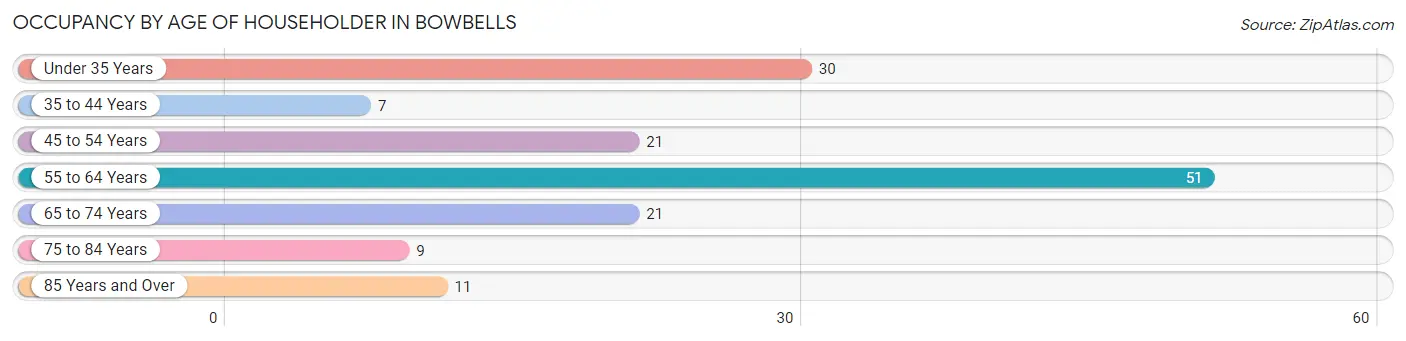
| Age Bracket | # Households | % Households |
| Under 35 Years | 30 | 20.0% |
| 35 to 44 Years | 7 | 4.7% |
| 45 to 54 Years | 21 | 14.0% |
| 55 to 64 Years | 51 | 34.0% |
| 65 to 74 Years | 21 | 14.0% |
| 75 to 84 Years | 9 | 6.0% |
| 85 Years and Over | 11 | 7.3% |
| Total | 150 | 100.0% |
Housing Finances in Bowbells
Median Income by Occupancy in Bowbells
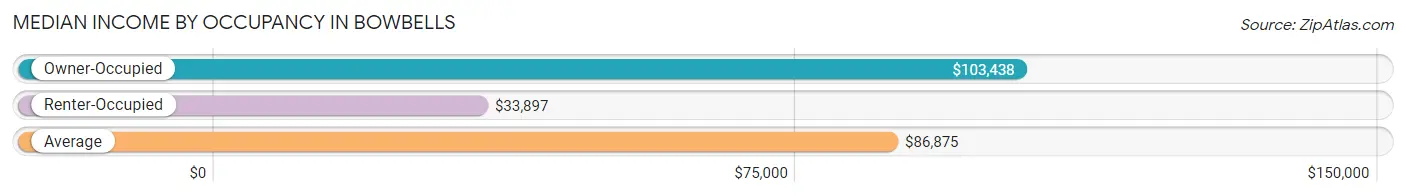
| Occupancy Type | # Households | Median Income |
| Owner-Occupied | 121 (80.7%) | $103,438 |
| Renter-Occupied | 29 (19.3%) | $33,897 |
| Average | 150 (100.0%) | $86,875 |
Occupancy by Householder Income Bracket in Bowbells
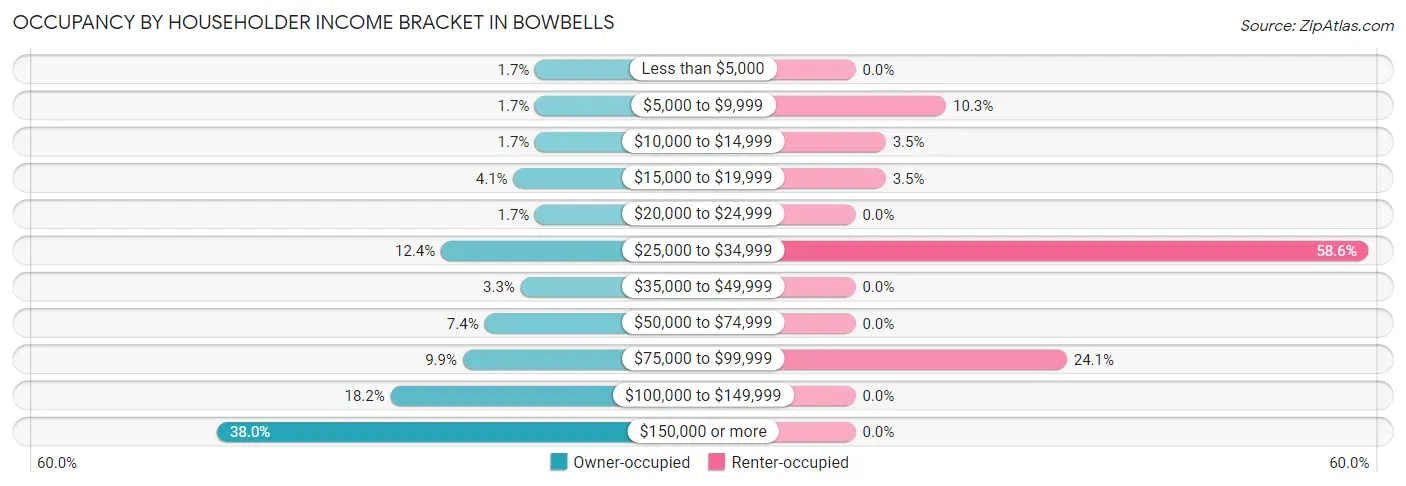
| Income Bracket | Owner-occupied | Renter-occupied |
| Less than $5,000 | 2 (1.7%) | 0 (0.0%) |
| $5,000 to $9,999 | 2 (1.7%) | 3 (10.3%) |
| $10,000 to $14,999 | 2 (1.7%) | 1 (3.5%) |
| $15,000 to $19,999 | 5 (4.1%) | 1 (3.5%) |
| $20,000 to $24,999 | 2 (1.7%) | 0 (0.0%) |
| $25,000 to $34,999 | 15 (12.4%) | 17 (58.6%) |
| $35,000 to $49,999 | 4 (3.3%) | 0 (0.0%) |
| $50,000 to $74,999 | 9 (7.4%) | 0 (0.0%) |
| $75,000 to $99,999 | 12 (9.9%) | 7 (24.1%) |
| $100,000 to $149,999 | 22 (18.2%) | 0 (0.0%) |
| $150,000 or more | 46 (38.0%) | 0 (0.0%) |
| Total | 121 (100.0%) | 29 (100.0%) |
Monthly Housing Cost Tiers in Bowbells
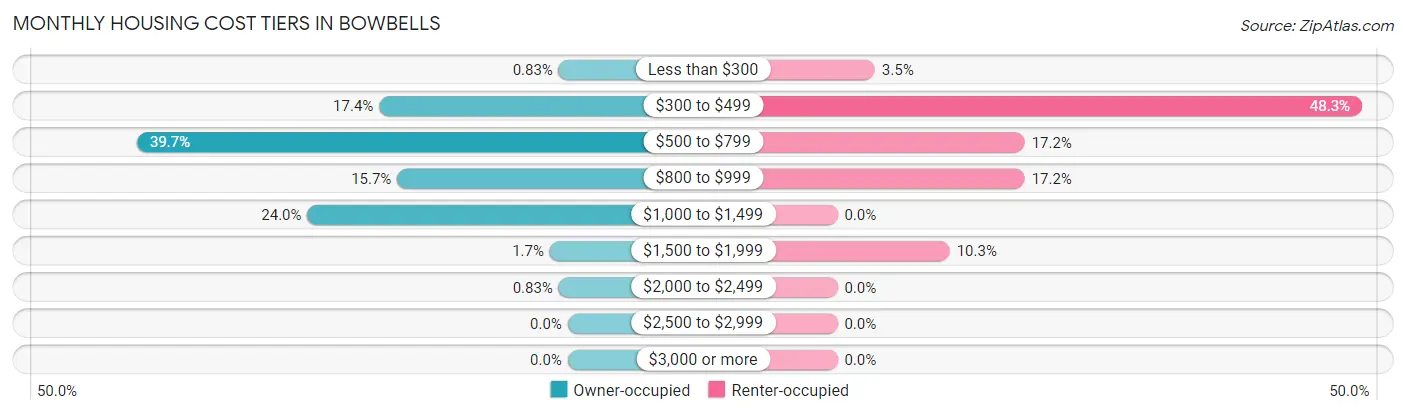
| Monthly Cost | Owner-occupied | Renter-occupied |
| Less than $300 | 1 (0.8%) | 1 (3.5%) |
| $300 to $499 | 21 (17.4%) | 14 (48.3%) |
| $500 to $799 | 48 (39.7%) | 5 (17.2%) |
| $800 to $999 | 19 (15.7%) | 5 (17.2%) |
| $1,000 to $1,499 | 29 (24.0%) | 0 (0.0%) |
| $1,500 to $1,999 | 2 (1.7%) | 3 (10.3%) |
| $2,000 to $2,499 | 1 (0.8%) | 0 (0.0%) |
| $2,500 to $2,999 | 0 (0.0%) | 0 (0.0%) |
| $3,000 or more | 0 (0.0%) | 0 (0.0%) |
| Total | 121 (100.0%) | 29 (100.0%) |
Physical Housing Characteristics in Bowbells
Housing Structures in Bowbells
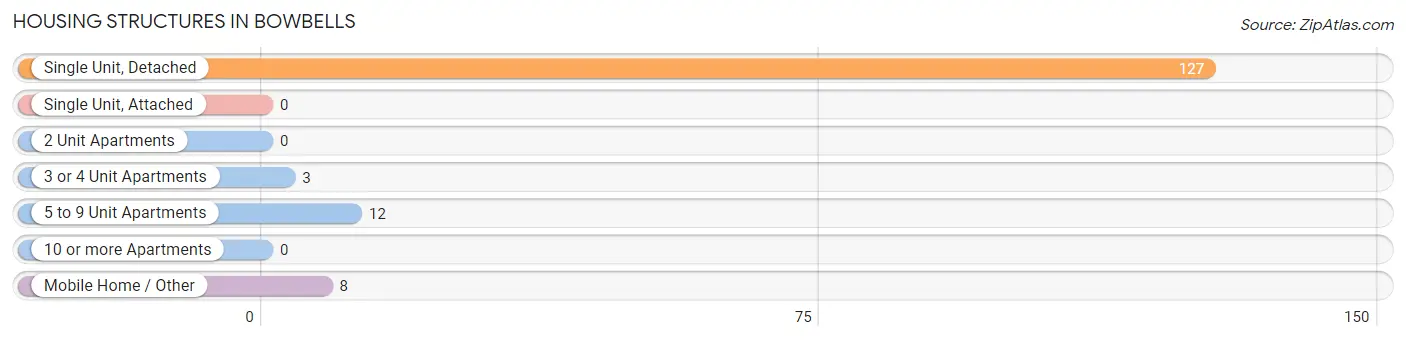
| Structure Type | # Housing Units | % Housing Units |
| Single Unit, Detached | 127 | 84.7% |
| Single Unit, Attached | 0 | 0.0% |
| 2 Unit Apartments | 0 | 0.0% |
| 3 or 4 Unit Apartments | 3 | 2.0% |
| 5 to 9 Unit Apartments | 12 | 8.0% |
| 10 or more Apartments | 0 | 0.0% |
| Mobile Home / Other | 8 | 5.3% |
| Total | 150 | 100.0% |
Housing Structures by Occupancy in Bowbells
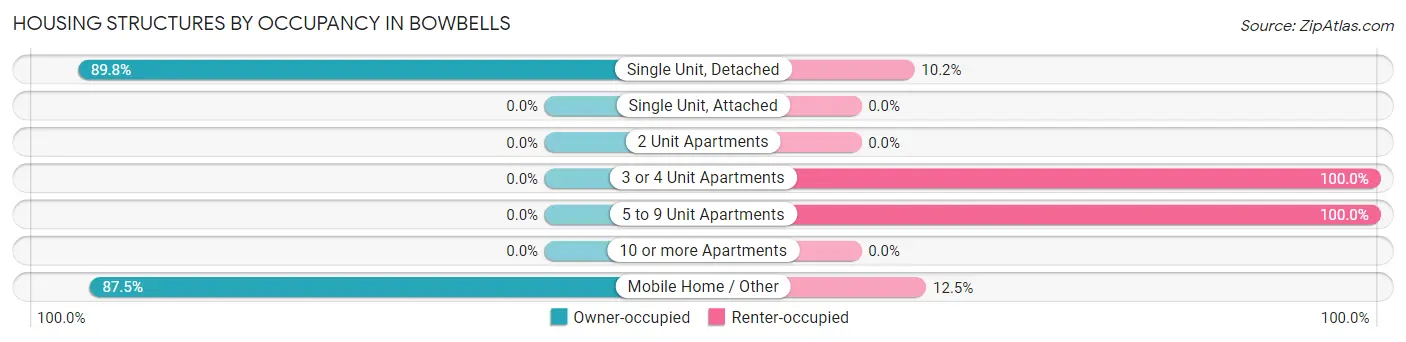
| Structure Type | Owner-occupied | Renter-occupied |
| Single Unit, Detached | 114 (89.8%) | 13 (10.2%) |
| Single Unit, Attached | 0 (0.0%) | 0 (0.0%) |
| 2 Unit Apartments | 0 (0.0%) | 0 (0.0%) |
| 3 or 4 Unit Apartments | 0 (0.0%) | 3 (100.0%) |
| 5 to 9 Unit Apartments | 0 (0.0%) | 12 (100.0%) |
| 10 or more Apartments | 0 (0.0%) | 0 (0.0%) |
| Mobile Home / Other | 7 (87.5%) | 1 (12.5%) |
| Total | 121 (80.7%) | 29 (19.3%) |
Housing Structures by Number of Rooms in Bowbells
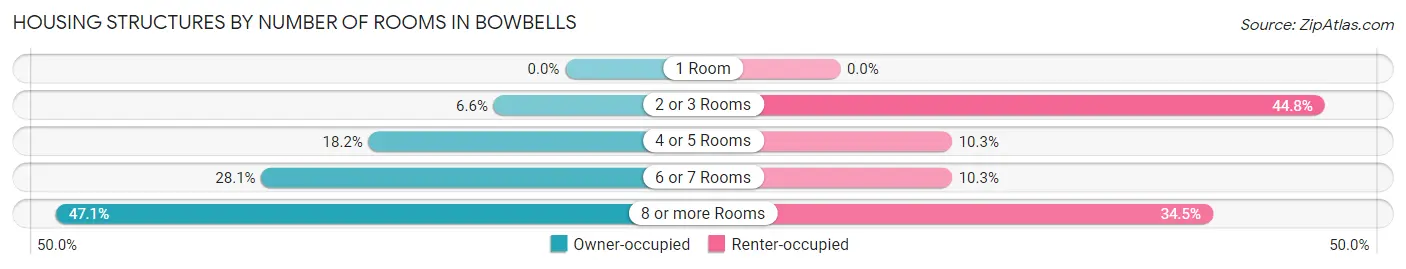
| Number of Rooms | Owner-occupied | Renter-occupied |
| 1 Room | 0 (0.0%) | 0 (0.0%) |
| 2 or 3 Rooms | 8 (6.6%) | 13 (44.8%) |
| 4 or 5 Rooms | 22 (18.2%) | 3 (10.3%) |
| 6 or 7 Rooms | 34 (28.1%) | 3 (10.3%) |
| 8 or more Rooms | 57 (47.1%) | 10 (34.5%) |
| Total | 121 (100.0%) | 29 (100.0%) |
Housing Structure by Heating Type in Bowbells
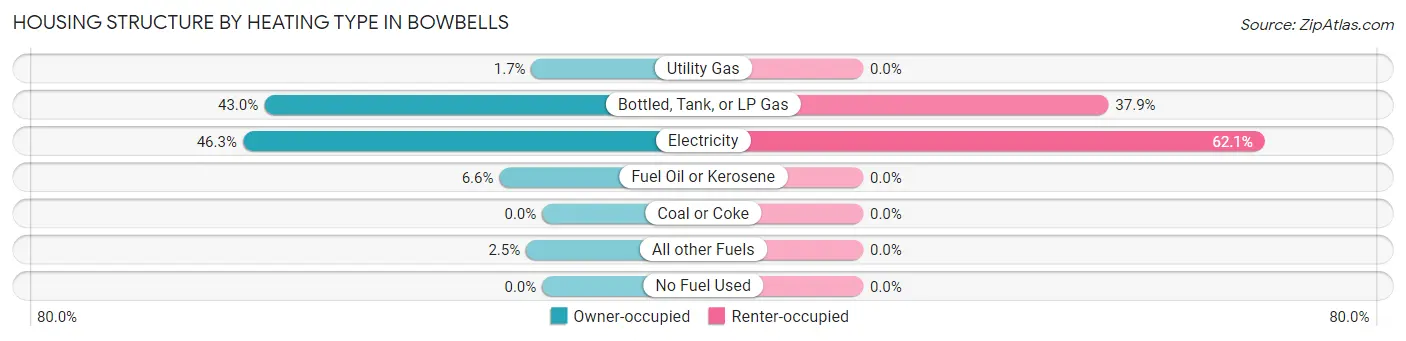
| Heating Type | Owner-occupied | Renter-occupied |
| Utility Gas | 2 (1.7%) | 0 (0.0%) |
| Bottled, Tank, or LP Gas | 52 (43.0%) | 11 (37.9%) |
| Electricity | 56 (46.3%) | 18 (62.1%) |
| Fuel Oil or Kerosene | 8 (6.6%) | 0 (0.0%) |
| Coal or Coke | 0 (0.0%) | 0 (0.0%) |
| All other Fuels | 3 (2.5%) | 0 (0.0%) |
| No Fuel Used | 0 (0.0%) | 0 (0.0%) |
| Total | 121 (100.0%) | 29 (100.0%) |
Household Vehicle Usage in Bowbells
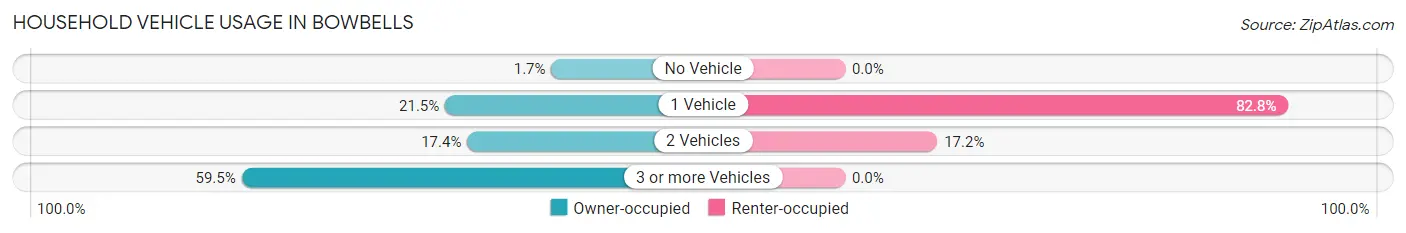
| Vehicles per Household | Owner-occupied | Renter-occupied |
| No Vehicle | 2 (1.7%) | 0 (0.0%) |
| 1 Vehicle | 26 (21.5%) | 24 (82.8%) |
| 2 Vehicles | 21 (17.4%) | 5 (17.2%) |
| 3 or more Vehicles | 72 (59.5%) | 0 (0.0%) |
| Total | 121 (100.0%) | 29 (100.0%) |
Real Estate & Mortgages in Bowbells
Real Estate and Mortgage Overview in Bowbells
| Characteristic | Without Mortgage | With Mortgage |
| Housing Units | 75 | 46 |
| Median Property Value | $136,000 | $93,000 |
| Median Household Income | $103,438 | $19 |
| Monthly Housing Costs | $563 | $0 |
| Real Estate Taxes | $1,080 | $0 |
Property Value by Mortgage Status in Bowbells
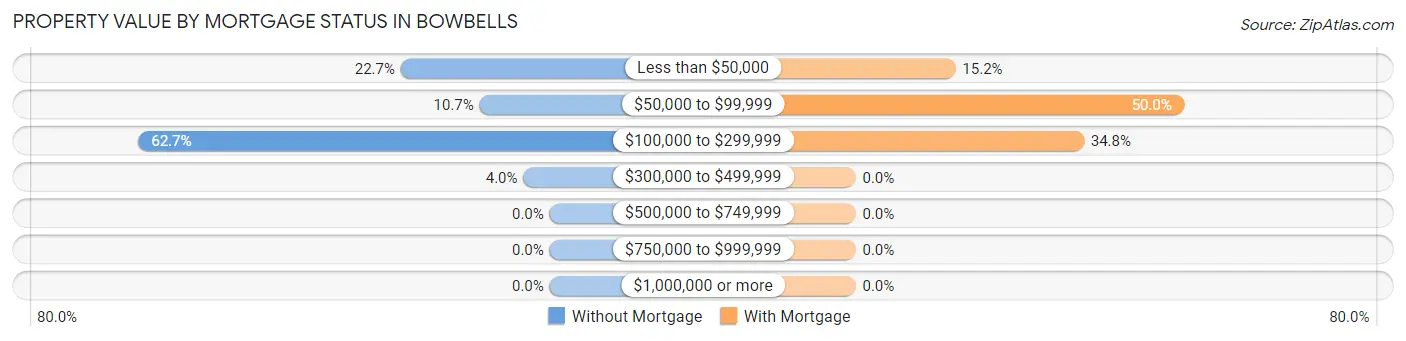
| Property Value | Without Mortgage | With Mortgage |
| Less than $50,000 | 17 (22.7%) | 7 (15.2%) |
| $50,000 to $99,999 | 8 (10.7%) | 23 (50.0%) |
| $100,000 to $299,999 | 47 (62.7%) | 16 (34.8%) |
| $300,000 to $499,999 | 3 (4.0%) | 0 (0.0%) |
| $500,000 to $749,999 | 0 (0.0%) | 0 (0.0%) |
| $750,000 to $999,999 | 0 (0.0%) | 0 (0.0%) |
| $1,000,000 or more | 0 (0.0%) | 0 (0.0%) |
| Total | 75 (100.0%) | 46 (100.0%) |
Household Income by Mortgage Status in Bowbells
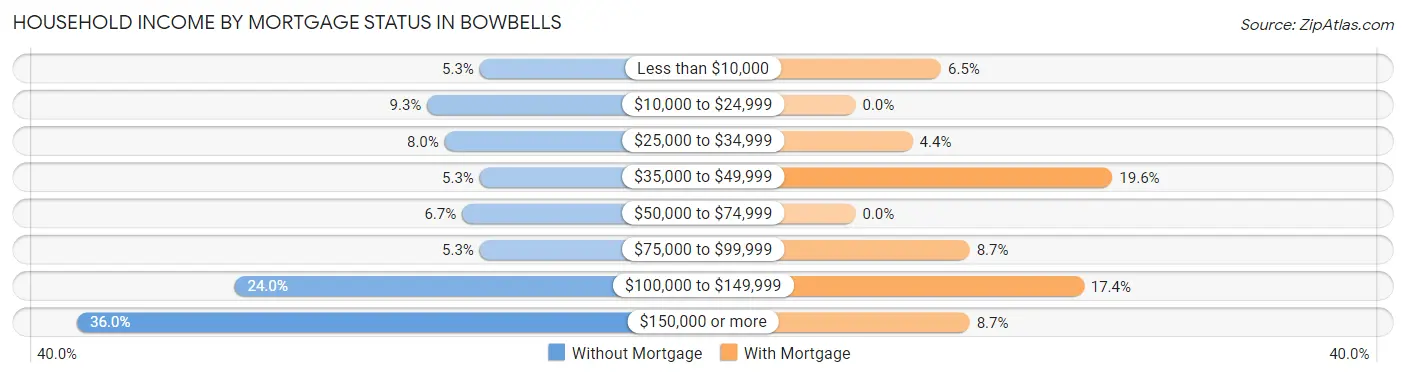
| Household Income | Without Mortgage | With Mortgage |
| Less than $10,000 | 4 (5.3%) | 3 (6.5%) |
| $10,000 to $24,999 | 7 (9.3%) | 0 (0.0%) |
| $25,000 to $34,999 | 6 (8.0%) | 2 (4.3%) |
| $35,000 to $49,999 | 4 (5.3%) | 9 (19.6%) |
| $50,000 to $74,999 | 5 (6.7%) | 0 (0.0%) |
| $75,000 to $99,999 | 4 (5.3%) | 4 (8.7%) |
| $100,000 to $149,999 | 18 (24.0%) | 8 (17.4%) |
| $150,000 or more | 27 (36.0%) | 4 (8.7%) |
| Total | 75 (100.0%) | 46 (100.0%) |
Property Value to Household Income Ratio in Bowbells
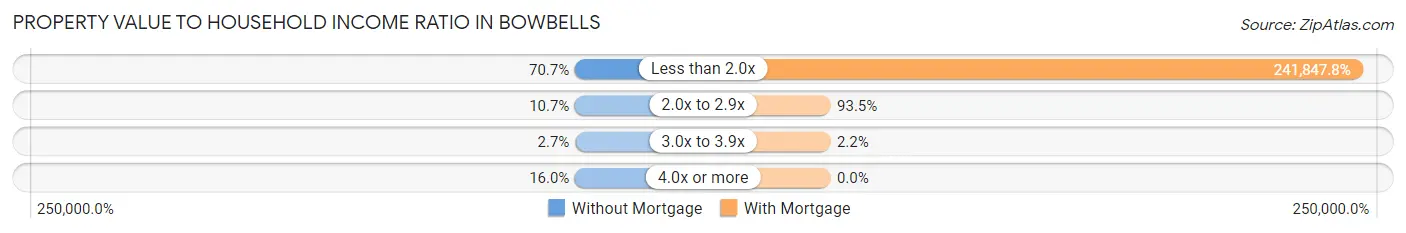
| Value-to-Income Ratio | Without Mortgage | With Mortgage |
| Less than 2.0x | 53 (70.7%) | 111,250 (241,847.8%) |
| 2.0x to 2.9x | 8 (10.7%) | 43 (93.5%) |
| 3.0x to 3.9x | 2 (2.7%) | 1 (2.2%) |
| 4.0x or more | 12 (16.0%) | 0 (0.0%) |
| Total | 75 (100.0%) | 46 (100.0%) |
Real Estate Taxes by Mortgage Status in Bowbells
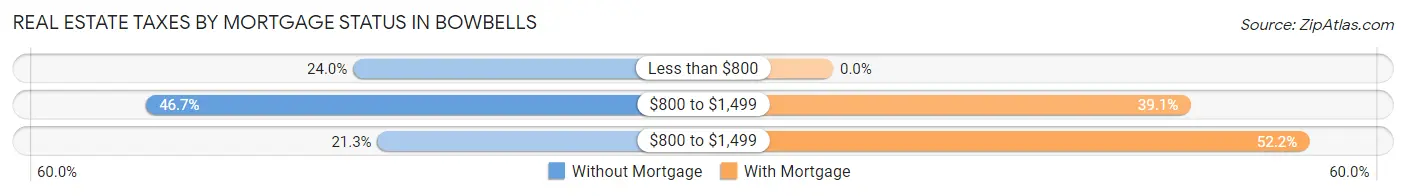
| Property Taxes | Without Mortgage | With Mortgage |
| Less than $800 | 18 (24.0%) | 0 (0.0%) |
| $800 to $1,499 | 35 (46.7%) | 18 (39.1%) |
| $800 to $1,499 | 16 (21.3%) | 24 (52.2%) |
| Total | 75 (100.0%) | 46 (100.0%) |
Health & Disability in Bowbells
Health Insurance Coverage by Age in Bowbells
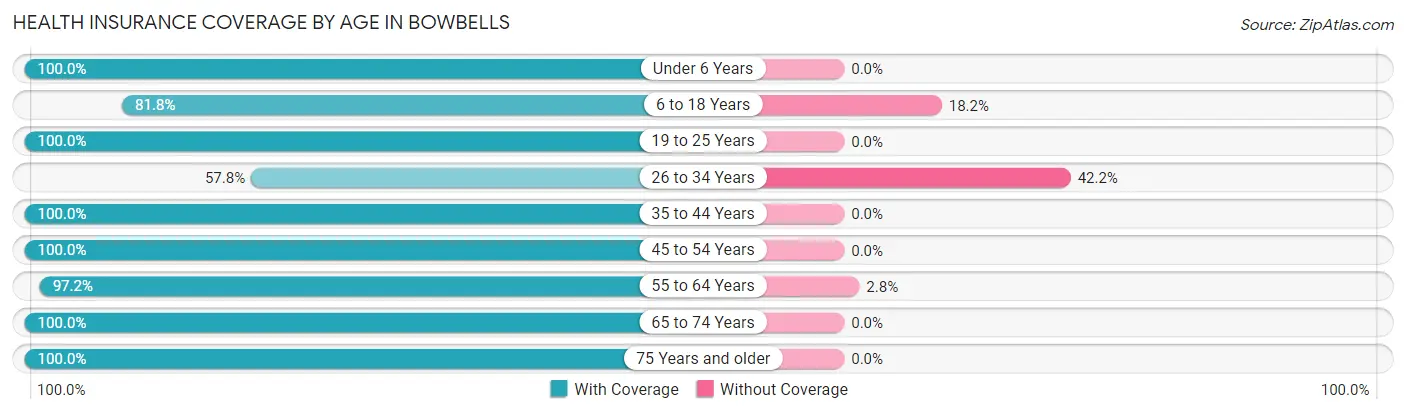
| Age Bracket | With Coverage | Without Coverage |
| Under 6 Years | 12 (100.0%) | 0 (0.0%) |
| 6 to 18 Years | 27 (81.8%) | 6 (18.2%) |
| 19 to 25 Years | 9 (100.0%) | 0 (0.0%) |
| 26 to 34 Years | 26 (57.8%) | 19 (42.2%) |
| 35 to 44 Years | 13 (100.0%) | 0 (0.0%) |
| 45 to 54 Years | 43 (100.0%) | 0 (0.0%) |
| 55 to 64 Years | 69 (97.2%) | 2 (2.8%) |
| 65 to 74 Years | 31 (100.0%) | 0 (0.0%) |
| 75 Years and older | 28 (100.0%) | 0 (0.0%) |
| Total | 258 (90.5%) | 27 (9.5%) |
Health Insurance Coverage by Citizenship Status in Bowbells
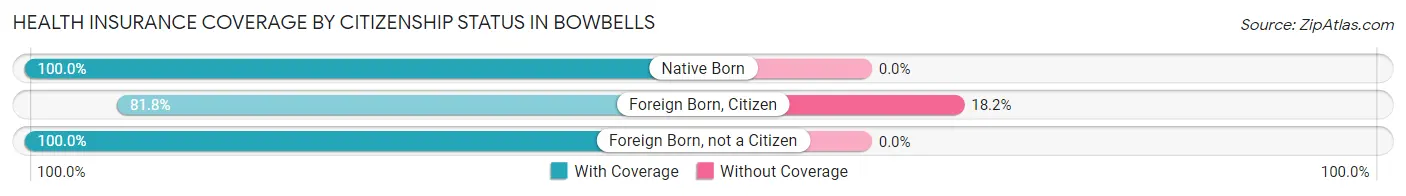
| Citizenship Status | With Coverage | Without Coverage |
| Native Born | 12 (100.0%) | 0 (0.0%) |
| Foreign Born, Citizen | 27 (81.8%) | 6 (18.2%) |
| Foreign Born, not a Citizen | 9 (100.0%) | 0 (0.0%) |
Health Insurance Coverage by Household Income in Bowbells
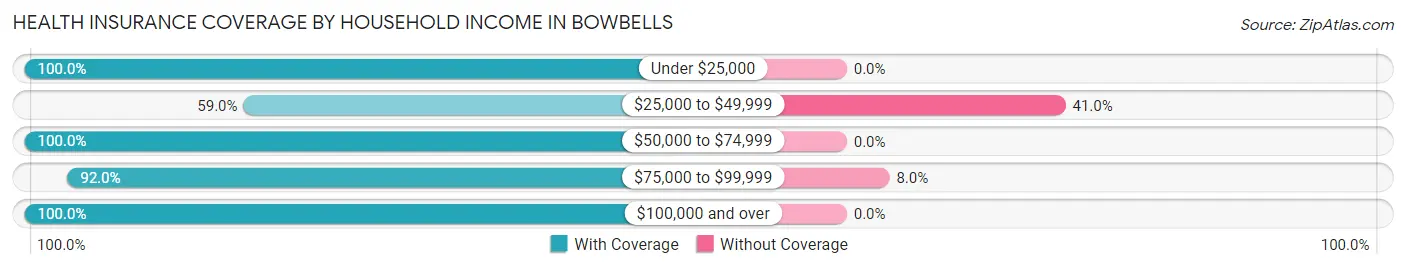
| Household Income | With Coverage | Without Coverage |
| Under $25,000 | 18 (100.0%) | 0 (0.0%) |
| $25,000 to $49,999 | 36 (59.0%) | 25 (41.0%) |
| $50,000 to $74,999 | 11 (100.0%) | 0 (0.0%) |
| $75,000 to $99,999 | 23 (92.0%) | 2 (8.0%) |
| $100,000 and over | 170 (100.0%) | 0 (0.0%) |
Public vs Private Health Insurance Coverage by Age in Bowbells
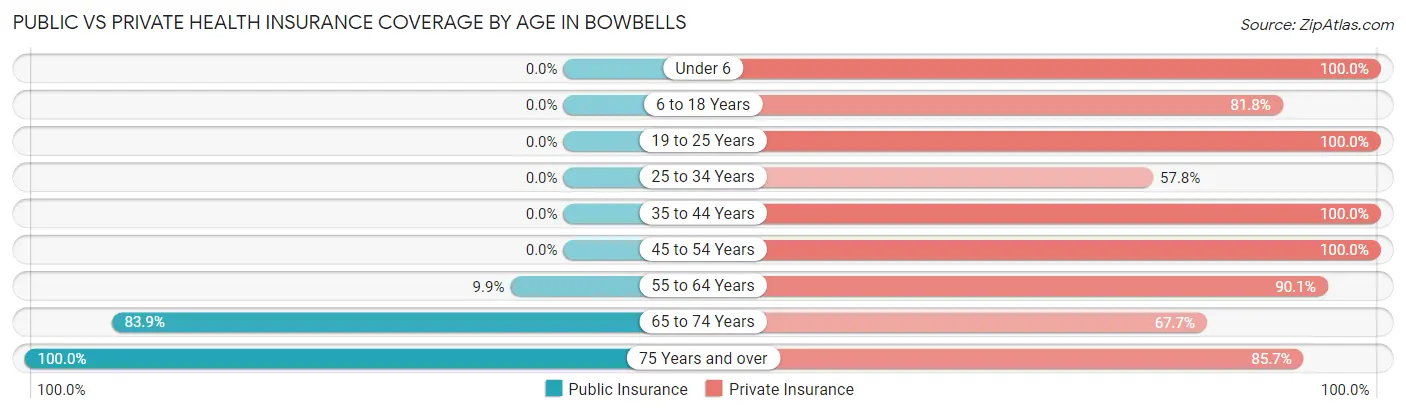
| Age Bracket | Public Insurance | Private Insurance |
| Under 6 | 0 (0.0%) | 12 (100.0%) |
| 6 to 18 Years | 0 (0.0%) | 27 (81.8%) |
| 19 to 25 Years | 0 (0.0%) | 9 (100.0%) |
| 25 to 34 Years | 0 (0.0%) | 26 (57.8%) |
| 35 to 44 Years | 0 (0.0%) | 13 (100.0%) |
| 45 to 54 Years | 0 (0.0%) | 43 (100.0%) |
| 55 to 64 Years | 7 (9.9%) | 64 (90.1%) |
| 65 to 74 Years | 26 (83.9%) | 21 (67.7%) |
| 75 Years and over | 28 (100.0%) | 24 (85.7%) |
| Total | 61 (21.4%) | 239 (83.9%) |
Disability Status by Sex by Age in Bowbells
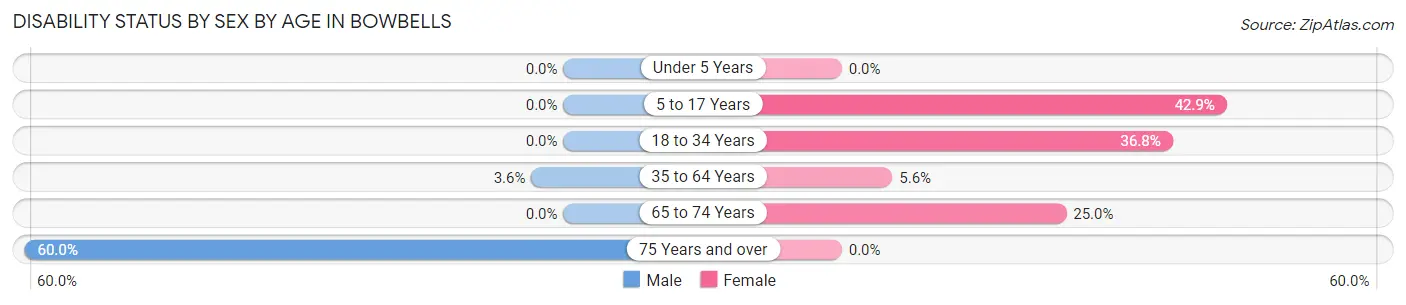
| Age Bracket | Male | Female |
| Under 5 Years | 0 (0.0%) | 0 (0.0%) |
| 5 to 17 Years | 0 (0.0%) | 6 (42.9%) |
| 18 to 34 Years | 0 (0.0%) | 7 (36.8%) |
| 35 to 64 Years | 2 (3.6%) | 4 (5.6%) |
| 65 to 74 Years | 0 (0.0%) | 3 (25.0%) |
| 75 Years and over | 6 (60.0%) | 0 (0.0%) |
Disability Class by Sex by Age in Bowbells
Disability Class: Hearing Difficulty
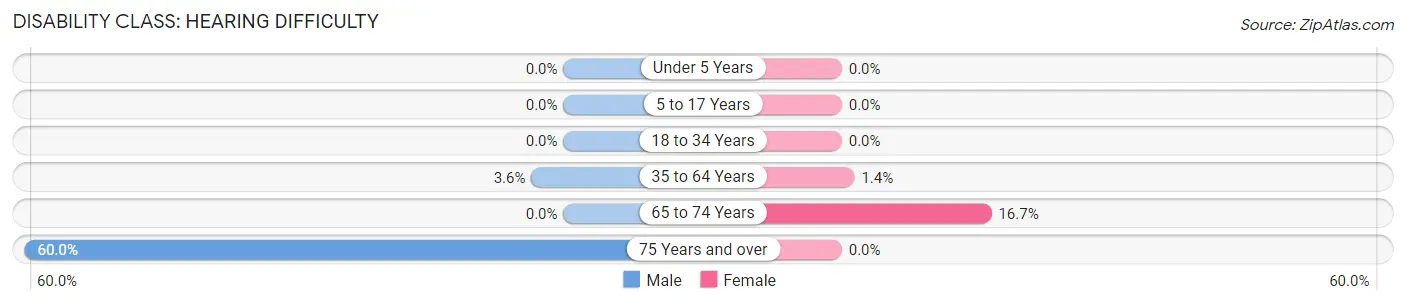
| Age Bracket | Male | Female |
| Under 5 Years | 0 (0.0%) | 0 (0.0%) |
| 5 to 17 Years | 0 (0.0%) | 0 (0.0%) |
| 18 to 34 Years | 0 (0.0%) | 0 (0.0%) |
| 35 to 64 Years | 2 (3.6%) | 1 (1.4%) |
| 65 to 74 Years | 0 (0.0%) | 2 (16.7%) |
| 75 Years and over | 6 (60.0%) | 0 (0.0%) |
Disability Class: Vision Difficulty
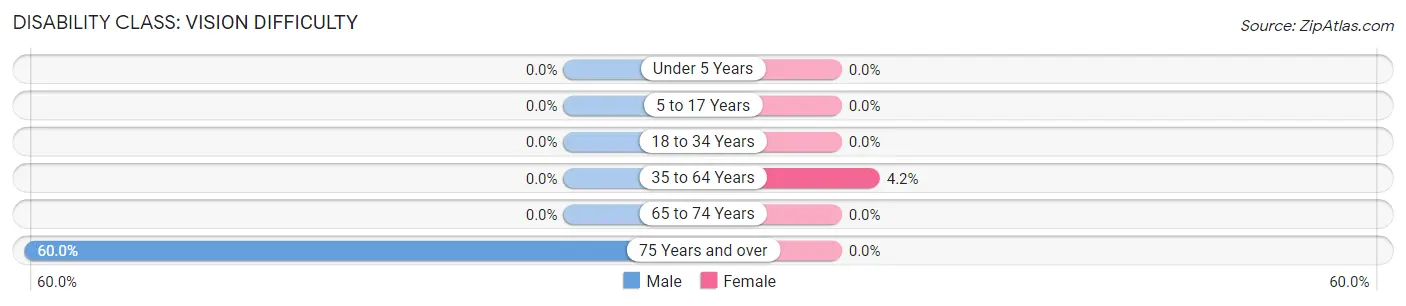
| Age Bracket | Male | Female |
| Under 5 Years | 0 (0.0%) | 0 (0.0%) |
| 5 to 17 Years | 0 (0.0%) | 0 (0.0%) |
| 18 to 34 Years | 0 (0.0%) | 0 (0.0%) |
| 35 to 64 Years | 0 (0.0%) | 3 (4.2%) |
| 65 to 74 Years | 0 (0.0%) | 0 (0.0%) |
| 75 Years and over | 6 (60.0%) | 0 (0.0%) |
Disability Class: Cognitive Difficulty
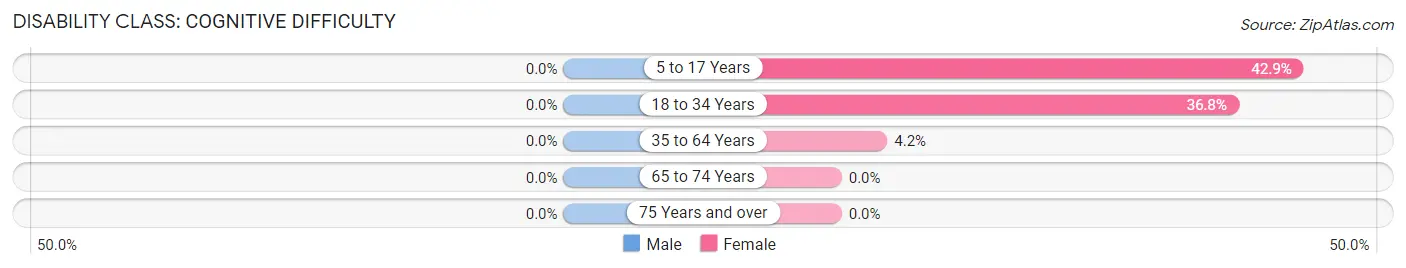
| Age Bracket | Male | Female |
| 5 to 17 Years | 0 (0.0%) | 6 (42.9%) |
| 18 to 34 Years | 0 (0.0%) | 7 (36.8%) |
| 35 to 64 Years | 0 (0.0%) | 3 (4.2%) |
| 65 to 74 Years | 0 (0.0%) | 0 (0.0%) |
| 75 Years and over | 0 (0.0%) | 0 (0.0%) |
Disability Class: Ambulatory Difficulty
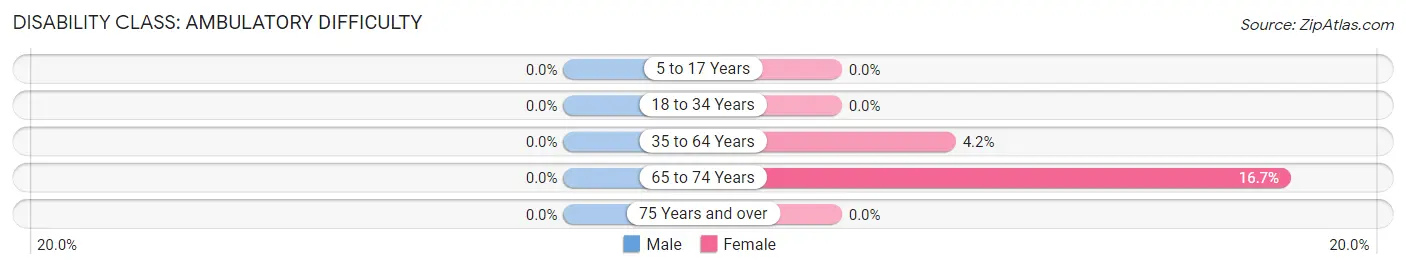
| Age Bracket | Male | Female |
| 5 to 17 Years | 0 (0.0%) | 0 (0.0%) |
| 18 to 34 Years | 0 (0.0%) | 0 (0.0%) |
| 35 to 64 Years | 0 (0.0%) | 3 (4.2%) |
| 65 to 74 Years | 0 (0.0%) | 2 (16.7%) |
| 75 Years and over | 0 (0.0%) | 0 (0.0%) |
Disability Class: Self-Care Difficulty
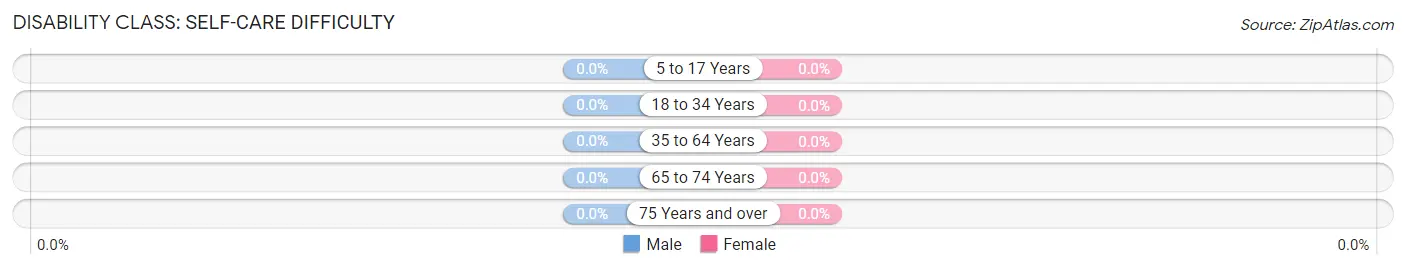
| Age Bracket | Male | Female |
| 5 to 17 Years | 0 (0.0%) | 0 (0.0%) |
| 18 to 34 Years | 0 (0.0%) | 0 (0.0%) |
| 35 to 64 Years | 0 (0.0%) | 0 (0.0%) |
| 65 to 74 Years | 0 (0.0%) | 0 (0.0%) |
| 75 Years and over | 0 (0.0%) | 0 (0.0%) |
Technology Access in Bowbells
Computing Device Access in Bowbells
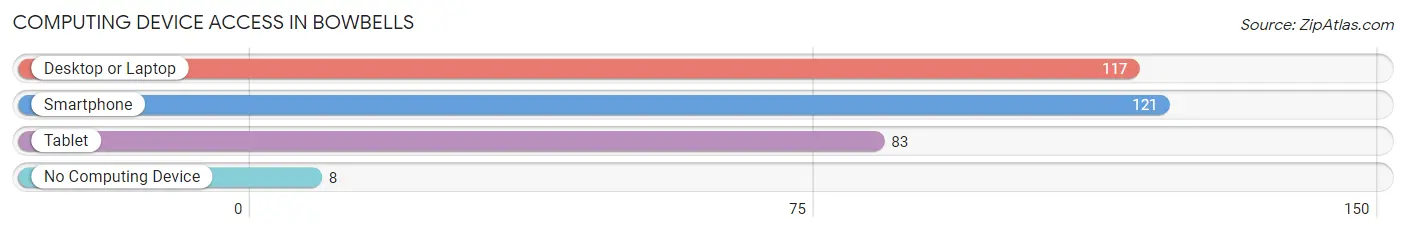
| Device Type | # Households | % Households |
| Desktop or Laptop | 117 | 78.0% |
| Smartphone | 121 | 80.7% |
| Tablet | 83 | 55.3% |
| No Computing Device | 8 | 5.3% |
| Total | 150 | 100.0% |
Internet Access in Bowbells
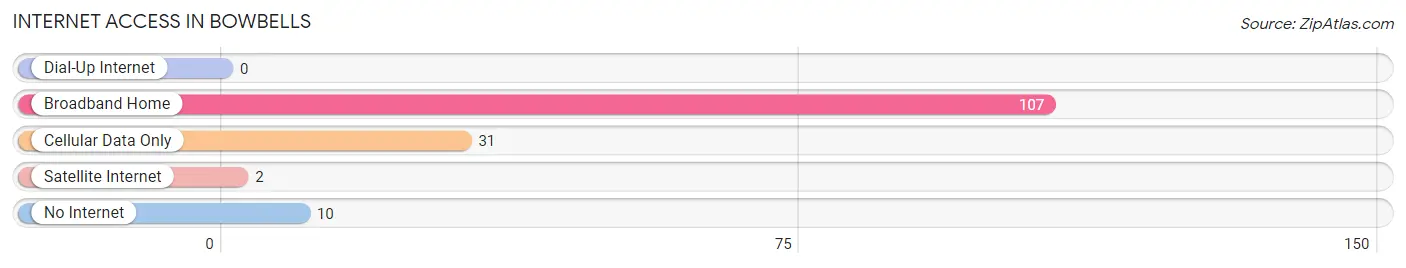
| Internet Type | # Households | % Households |
| Dial-Up Internet | 0 | 0.0% |
| Broadband Home | 107 | 71.3% |
| Cellular Data Only | 31 | 20.7% |
| Satellite Internet | 2 | 1.3% |
| No Internet | 10 | 6.7% |
| Total | 150 | 100.0% |
Bowbells Summary
Bellows, North Dakota is a small town located in the northeastern corner of the state. It is situated in the Red River Valley, which is part of the Great Plains region of the United States. The town is located in Walsh County, and is the county seat. The population of Bellows was estimated to be 1,072 in 2019.
History
Bellows was founded in 1882 by the Northern Pacific Railroad. The town was named after the bellows used by blacksmiths, which were used to fan the flames of the forge. The town was originally known as Bellows Station, and was the first stop on the Northern Pacific Railroad in North Dakota.
The town was incorporated in 1883, and the first mayor was elected in 1884. The town quickly grew, and by 1890, it had a population of 1,000. The town was a major hub for the railroad, and it was also a center for agriculture and commerce.
Geography
Bellows is located in the Red River Valley, which is part of the Great Plains region of the United States. The town is situated in the northeastern corner of North Dakota, and is bordered by Minnesota to the east and Canada to the north. The town is located in Walsh County, and is the county seat.
The town is situated on the banks of the Red River, which is a major tributary of the Mississippi River. The town is located at an elevation of 1,072 feet above sea level. The town is located in a semi-arid climate, with hot summers and cold winters.
Economy
The economy of Bellows is largely based on agriculture and tourism. The town is home to several farms, which produce a variety of crops, including wheat, corn, soybeans, and sunflowers. The town is also home to several businesses, including restaurants, retail stores, and a hotel.
The town is also a popular tourist destination, as it is located near several lakes and rivers. The town is home to several parks, including the Bellows State Park, which offers camping, fishing, and hiking opportunities. The town is also home to several festivals, including the Bellows County Fair, which is held every summer.
Demographics
The population of Bellows was estimated to be 1,072 in 2019. The town has a population that is predominantly white, with a small percentage of African Americans, Native Americans, and other races. The median household income in the town is $45,000, and the median home value is $125,000. The town has a high rate of homeownership, with over 70% of the population owning their own homes.
The town is served by the Bellows Public School District, which includes one elementary school, one middle school, and one high school. The town is also home to several churches, including the Bellows United Methodist Church, the Bellows Lutheran Church, and the Bellows Baptist Church.
Conclusion
Bellows, North Dakota is a small town located in the northeastern corner of the state. It is situated in the Red River Valley, which is part of the Great Plains region of the United States. The town is located in Walsh County, and is the county seat. The population of Bellows was estimated to be 1,072 in 2019. The town has a largely agricultural economy, and is also a popular tourist destination. The town is predominantly white, with a small percentage of African Americans, Native Americans, and other races. The town is served by the Bellows Public School District, and is home to several churches.
Common Questions
What is Per Capita Income in Bowbells?
Per Capita income in Bowbells is $57,716.
What is the Median Family Income in Bowbells?
Median Family Income in Bowbells is $153,194.
What is the Median Household income in Bowbells?
Median Household Income in Bowbells is $86,875.
What is Income or Wage Gap in Bowbells?
Income or Wage Gap in Bowbells is 38.6%.
Women in Bowbells earn 61.4 cents for every dollar earned by a man.
What is Inequality or Gini Index in Bowbells?
Inequality or Gini Index in Bowbells is 0.46.
What is the Total Population of Bowbells?
Total Population of Bowbells is 285.
What is the Total Male Population of Bowbells?
Total Male Population of Bowbells is 151.
What is the Total Female Population of Bowbells?
Total Female Population of Bowbells is 134.
What is the Ratio of Males per 100 Females in Bowbells?
There are 112.69 Males per 100 Females in Bowbells.
What is the Ratio of Females per 100 Males in Bowbells?
There are 88.74 Females per 100 Males in Bowbells.
What is the Median Population Age in Bowbells?
Median Population Age in Bowbells is 49.9 Years.
What is the Average Family Size in Bowbells
Average Family Size in Bowbells is 2.6 People.
What is the Average Household Size in Bowbells
Average Household Size in Bowbells is 1.9 People.
How Large is the Labor Force in Bowbells?
There are 187 People in the Labor Forcein in Bowbells.
What is the Percentage of People in the Labor Force in Bowbells?
77.6% of People are in the Labor Force in Bowbells.