Surrey, ND Map & Demographics
Surrey Map
Surrey Overview
$38,357
PER CAPITA INCOME
$107,448
AVG FAMILY INCOME
$100,104
AVG HOUSEHOLD INCOME
29.1%
WAGE / INCOME GAP [ % ]
70.9¢/ $1
WAGE / INCOME GAP [ $ ]
0.38
INEQUALITY / GINI INDEX
1,583
TOTAL POPULATION
803
MALE POPULATION
780
FEMALE POPULATION
102.95
MALES / 100 FEMALES
97.14
FEMALES / 100 MALES
36.1
MEDIAN AGE
3.1
AVG FAMILY SIZE
2.8
AVG HOUSEHOLD SIZE
771
LABOR FORCE [ PEOPLE ]
72.8%
PERCENT IN LABOR FORCE
3.8%
UNEMPLOYMENT RATE
Surrey Zip Codes
Surrey Area Codes
Income in Surrey
Income Overview in Surrey
Per Capita Income in Surrey is $38,357, while median incomes of families and households are $107,448 and $100,104 respectively.
| Characteristic | Number | Measure |
| Per Capita Income | 1,583 | $38,357 |
| Median Family Income | 457 | $107,448 |
| Mean Family Income | 457 | $121,236 |
| Median Household Income | 567 | $100,104 |
| Mean Household Income | 567 | $107,405 |
| Income Deficit | 457 | $0 |
| Wage / Income Gap (%) | 1,583 | 29.06% |
| Wage / Income Gap ($) | 1,583 | 70.94¢ per $1 |
| Gini / Inequality Index | 1,583 | 0.38 |
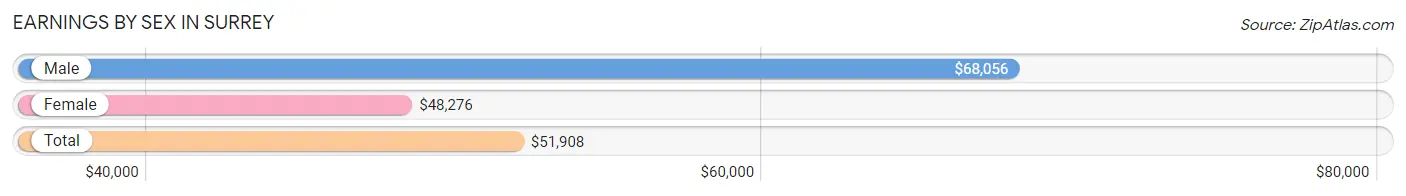
Earnings by Sex in Surrey
Average Earnings in Surrey are $51,908, $68,056 for men and $48,276 for women, a difference of 29.1%.
| Sex | Number | Average Earnings |
| Male | 370 (46.6%) | $68,056 |
| Female | 424 (53.4%) | $48,276 |
| Total | 794 (100.0%) | $51,908 |
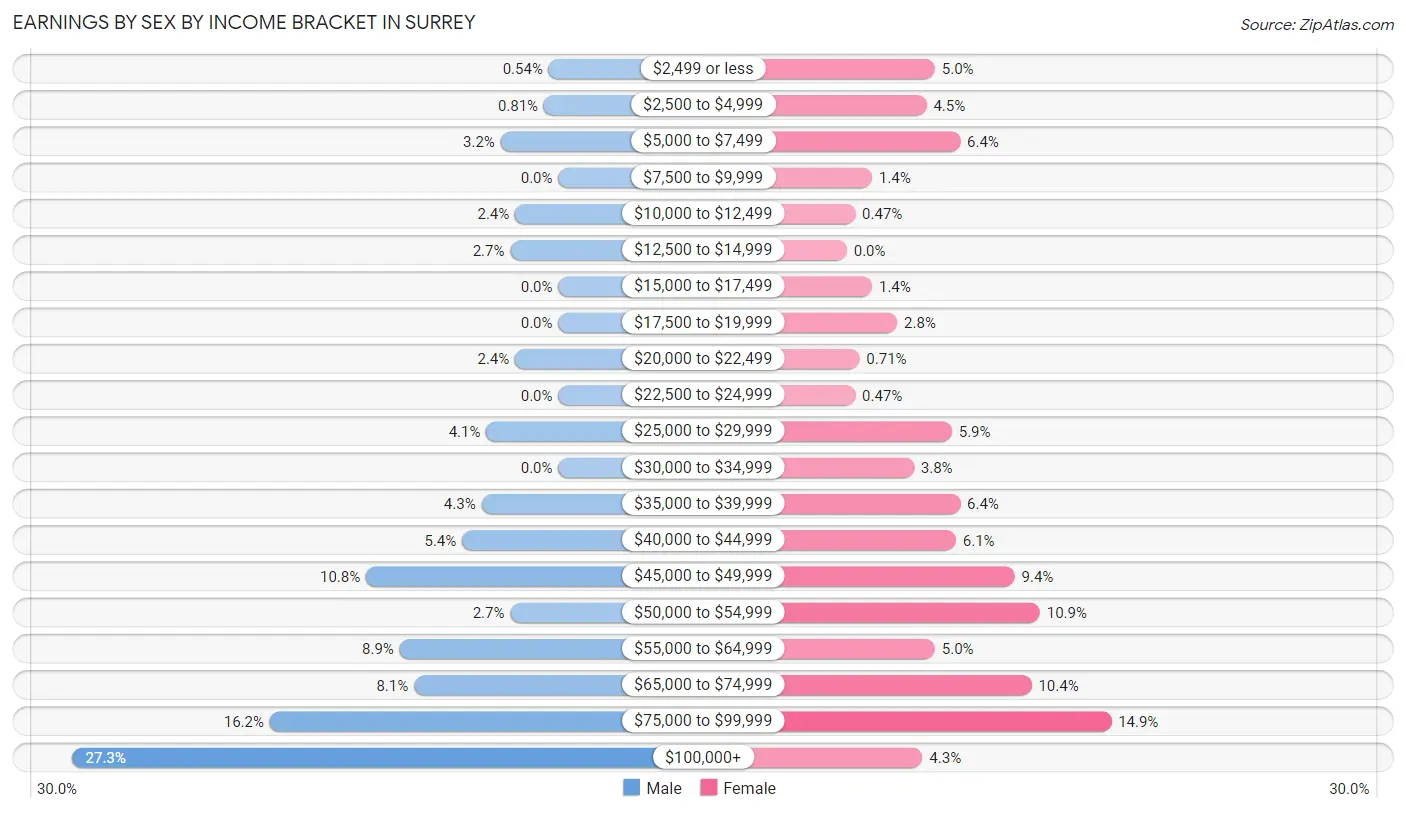
Earnings by Sex by Income Bracket in Surrey
The most common earnings brackets in Surrey are $100,000+ for men (101 | 27.3%) and $75,000 to $99,999 for women (63 | 14.9%).
| Income | Male | Female |
| $2,499 or less | 2 (0.5%) | 21 (5.0%) |
| $2,500 to $4,999 | 3 (0.8%) | 19 (4.5%) |
| $5,000 to $7,499 | 12 (3.2%) | 27 (6.4%) |
| $7,500 to $9,999 | 0 (0.0%) | 6 (1.4%) |
| $10,000 to $12,499 | 9 (2.4%) | 2 (0.5%) |
| $12,500 to $14,999 | 10 (2.7%) | 0 (0.0%) |
| $15,000 to $17,499 | 0 (0.0%) | 6 (1.4%) |
| $17,500 to $19,999 | 0 (0.0%) | 12 (2.8%) |
| $20,000 to $22,499 | 9 (2.4%) | 3 (0.7%) |
| $22,500 to $24,999 | 0 (0.0%) | 2 (0.5%) |
| $25,000 to $29,999 | 15 (4.1%) | 25 (5.9%) |
| $30,000 to $34,999 | 0 (0.0%) | 16 (3.8%) |
| $35,000 to $39,999 | 16 (4.3%) | 27 (6.4%) |
| $40,000 to $44,999 | 20 (5.4%) | 26 (6.1%) |
| $45,000 to $49,999 | 40 (10.8%) | 40 (9.4%) |
| $50,000 to $54,999 | 10 (2.7%) | 46 (10.8%) |
| $55,000 to $64,999 | 33 (8.9%) | 21 (5.0%) |
| $65,000 to $74,999 | 30 (8.1%) | 44 (10.4%) |
| $75,000 to $99,999 | 60 (16.2%) | 63 (14.9%) |
| $100,000+ | 101 (27.3%) | 18 (4.3%) |
| Total | 370 (100.0%) | 424 (100.0%) |
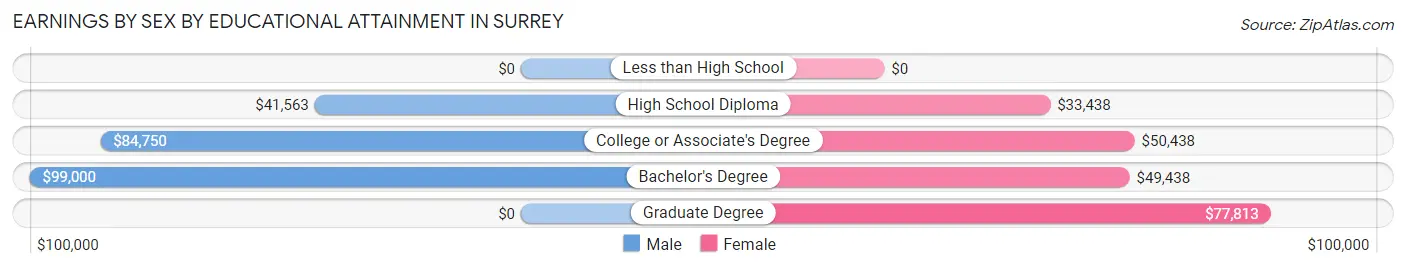
Earnings by Sex by Educational Attainment in Surrey
Average earnings in Surrey are $68,194 for men and $49,773 for women, a difference of 27.0%. Men with an educational attainment of bachelor's degree enjoy the highest average annual earnings of $99,000, while those with high school diploma education earn the least with $41,563. Women with an educational attainment of graduate degree earn the most with the average annual earnings of $77,813, while those with high school diploma education have the smallest earnings of $33,438.
| Educational Attainment | Male Income | Female Income |
| Less than High School | - | - |
| High School Diploma | $41,563 | $33,438 |
| College or Associate's Degree | $84,750 | $50,438 |
| Bachelor's Degree | $99,000 | $49,438 |
| Graduate Degree | - | - |
| Total | $68,194 | $49,773 |
Family Income in Surrey
Family Income Brackets in Surrey
According to the Surrey family income data, there are 175 families falling into the $100,000 to $149,999 income range, which is the most common income bracket and makes up 38.3% of all families.
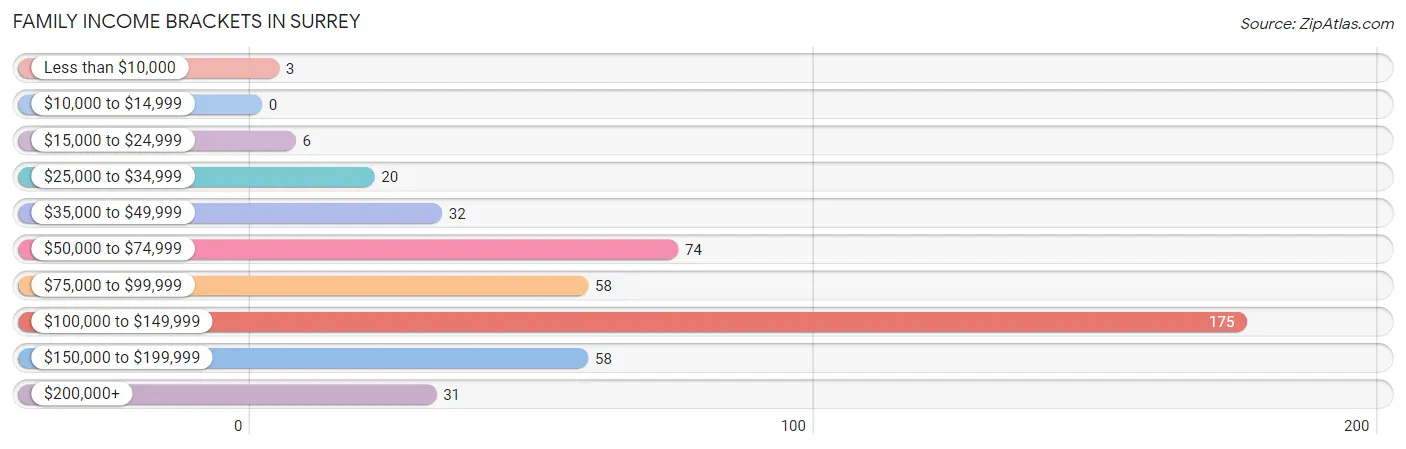
| Income Bracket | # Families | % Families |
| Less than $10,000 | 3 | 0.7% |
| $10,000 to $14,999 | 0 | 0.0% |
| $15,000 to $24,999 | 6 | 1.3% |
| $25,000 to $34,999 | 20 | 4.4% |
| $35,000 to $49,999 | 32 | 7.0% |
| $50,000 to $74,999 | 74 | 16.2% |
| $75,000 to $99,999 | 58 | 12.7% |
| $100,000 to $149,999 | 175 | 38.3% |
| $150,000 to $199,999 | 58 | 12.7% |
| $200,000+ | 31 | 6.8% |
Family Income by Famaliy Size in Surrey
2-person families (253 | 55.4%) account for the highest median family income in Surrey with $109,659 per family, while 2-person families (253 | 55.4%) have the highest median income of $54,830 per family member.
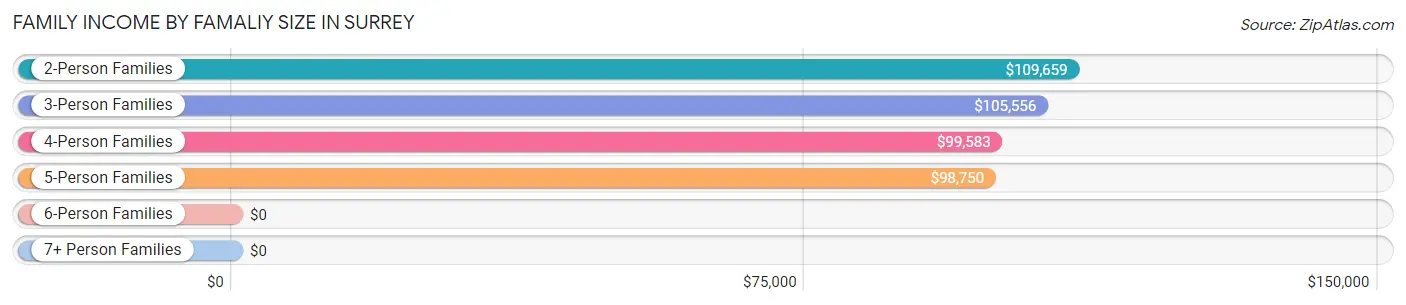
| Income Bracket | # Families | Median Income |
| 2-Person Families | 253 (55.4%) | $109,659 |
| 3-Person Families | 74 (16.2%) | $105,556 |
| 4-Person Families | 86 (18.8%) | $99,583 |
| 5-Person Families | 28 (6.1%) | $98,750 |
| 6-Person Families | 6 (1.3%) | $0 |
| 7+ Person Families | 10 (2.2%) | $0 |
| Total | 457 (100.0%) | $107,448 |
Family Income by Number of Earners in Surrey
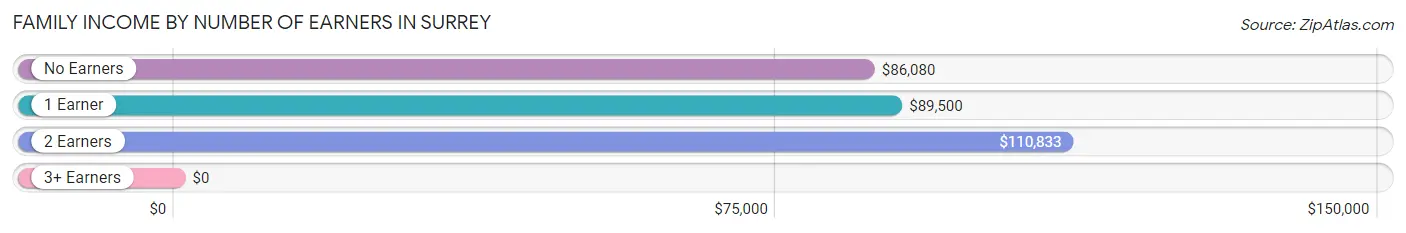
| Number of Earners | # Families | Median Income |
| No Earners | 39 (8.5%) | $86,080 |
| 1 Earner | 136 (29.8%) | $89,500 |
| 2 Earners | 276 (60.4%) | $110,833 |
| 3+ Earners | 6 (1.3%) | $0 |
| Total | 457 (100.0%) | $107,448 |
Household Income in Surrey
Household Income Brackets in Surrey
With 193 households falling in the category, the $100,000 to $149,999 income range is the most frequent in Surrey, accounting for 34.0% of all households.
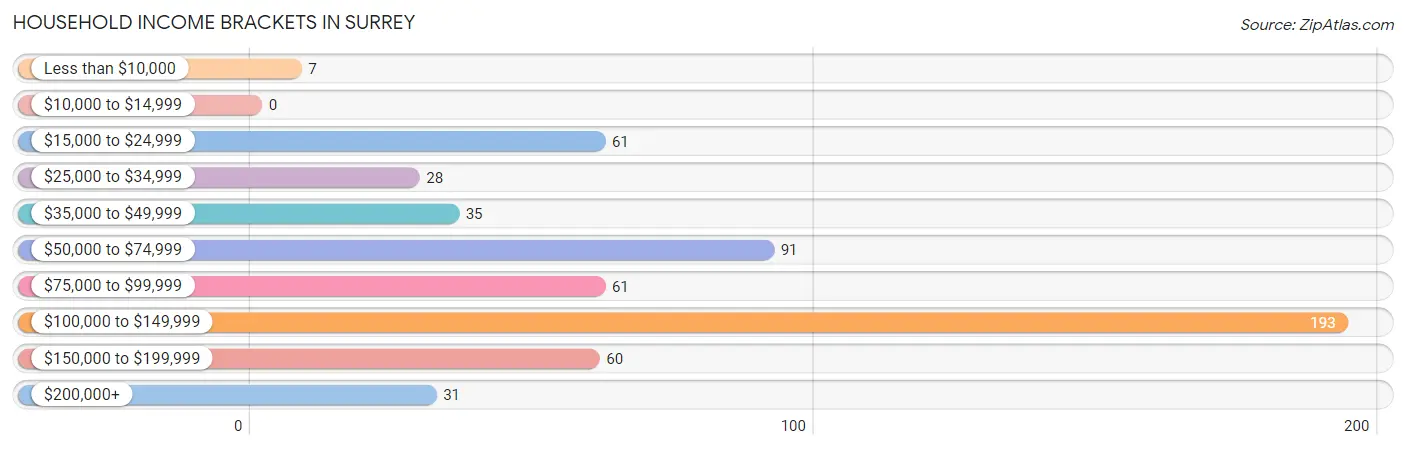
| Income Bracket | # Households | % Households |
| Less than $10,000 | 7 | 1.2% |
| $10,000 to $14,999 | 0 | 0.0% |
| $15,000 to $24,999 | 61 | 10.8% |
| $25,000 to $34,999 | 28 | 4.9% |
| $35,000 to $49,999 | 35 | 6.2% |
| $50,000 to $74,999 | 91 | 16.0% |
| $75,000 to $99,999 | 61 | 10.8% |
| $100,000 to $149,999 | 193 | 34.0% |
| $150,000 to $199,999 | 60 | 10.6% |
| $200,000+ | 31 | 5.5% |
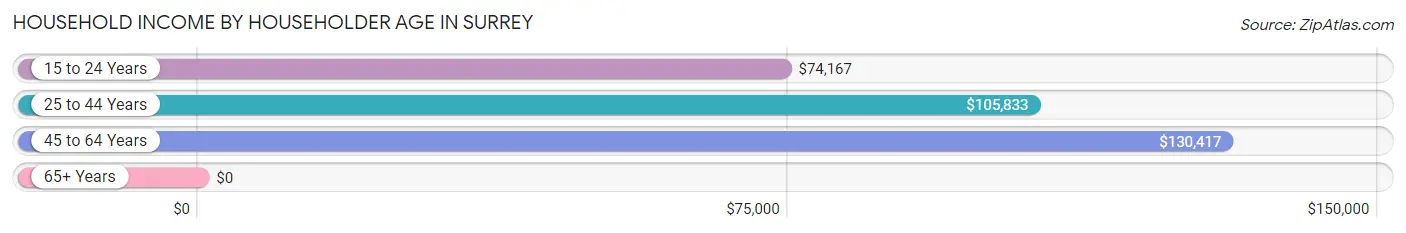
Household Income by Householder Age in Surrey
The median household income in Surrey is $100,104, with the highest median household income of $130,417 found in the 45 to 64 years age bracket for the primary householder. A total of 177 households (31.2%) fall into this category. Meanwhile, the 65+ years age bracket for the primary householder has the lowest median household income of $0, with 176 households (31.0%) in this group.
| Income Bracket | # Households | Median Income |
| 15 to 24 Years | 12 (2.1%) | $74,167 |
| 25 to 44 Years | 202 (35.6%) | $105,833 |
| 45 to 64 Years | 177 (31.2%) | $130,417 |
| 65+ Years | 176 (31.0%) | $0 |
| Total | 567 (100.0%) | $100,104 |
Poverty in Surrey
Income Below Poverty by Sex and Age in Surrey
With 1.8% poverty level for males and 3.3% for females among the residents of Surrey, 12 to 14 year old males and 12 to 14 year old females are the most vulnerable to poverty, with 9 males (18.4%) and 6 females (50.0%) in their respective age groups living below the poverty level.
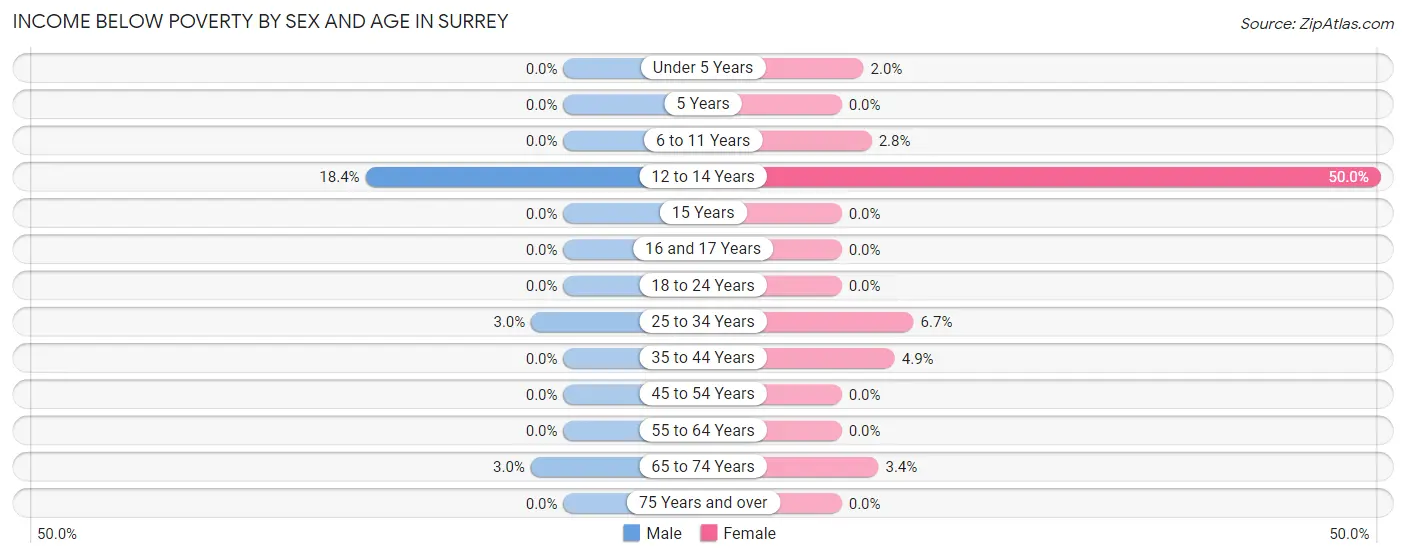
| Age Bracket | Male | Female |
| Under 5 Years | 0 (0.0%) | 2 (2.0%) |
| 5 Years | 0 (0.0%) | 0 (0.0%) |
| 6 to 11 Years | 0 (0.0%) | 2 (2.8%) |
| 12 to 14 Years | 9 (18.4%) | 6 (50.0%) |
| 15 Years | 0 (0.0%) | 0 (0.0%) |
| 16 and 17 Years | 0 (0.0%) | 0 (0.0%) |
| 18 to 24 Years | 0 (0.0%) | 0 (0.0%) |
| 25 to 34 Years | 2 (3.0%) | 6 (6.7%) |
| 35 to 44 Years | 0 (0.0%) | 6 (4.9%) |
| 45 to 54 Years | 0 (0.0%) | 0 (0.0%) |
| 55 to 64 Years | 0 (0.0%) | 0 (0.0%) |
| 65 to 74 Years | 3 (3.0%) | 3 (3.4%) |
| 75 Years and over | 0 (0.0%) | 0 (0.0%) |
| Total | 14 (1.8%) | 25 (3.3%) |
Income Above Poverty by Sex and Age in Surrey
According to the poverty statistics in Surrey, males aged under 5 years and females aged 5 years are the age groups that are most secure financially, with 100.0% of males and 100.0% of females in these age groups living above the poverty line.
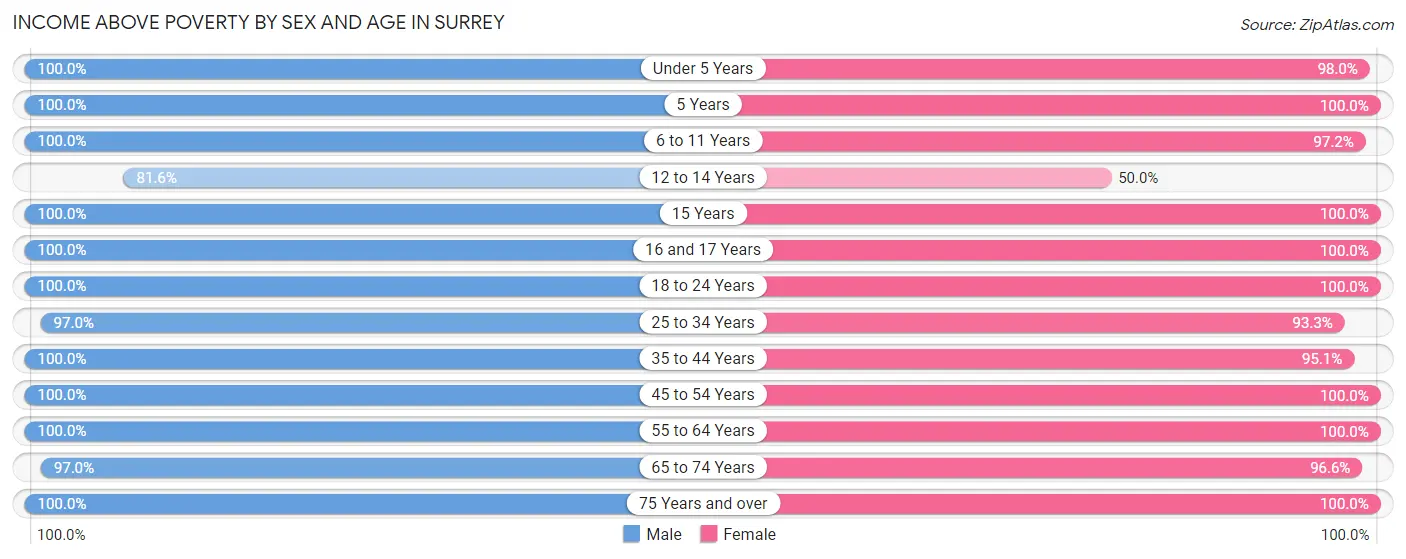
| Age Bracket | Male | Female |
| Under 5 Years | 141 (100.0%) | 97 (98.0%) |
| 5 Years | 41 (100.0%) | 5 (100.0%) |
| 6 to 11 Years | 69 (100.0%) | 70 (97.2%) |
| 12 to 14 Years | 40 (81.6%) | 6 (50.0%) |
| 15 Years | 1 (100.0%) | 12 (100.0%) |
| 16 and 17 Years | 14 (100.0%) | 14 (100.0%) |
| 18 to 24 Years | 20 (100.0%) | 22 (100.0%) |
| 25 to 34 Years | 65 (97.0%) | 84 (93.3%) |
| 35 to 44 Years | 123 (100.0%) | 116 (95.1%) |
| 45 to 54 Years | 61 (100.0%) | 100 (100.0%) |
| 55 to 64 Years | 88 (100.0%) | 113 (100.0%) |
| 65 to 74 Years | 96 (97.0%) | 85 (96.6%) |
| 75 Years and over | 17 (100.0%) | 21 (100.0%) |
| Total | 776 (98.2%) | 745 (96.8%) |
Income Below Poverty Among Married-Couple Families in Surrey
The poverty statistics for married-couple families in Surrey show that 1.3% or 5 of the total 374 families live below the poverty line. Families with 1 or 2 children have the highest poverty rate of 1.8%, comprising of 2 families. On the other hand, families with 3 or 4 children have the lowest poverty rate of 0.0%, which includes 0 families.
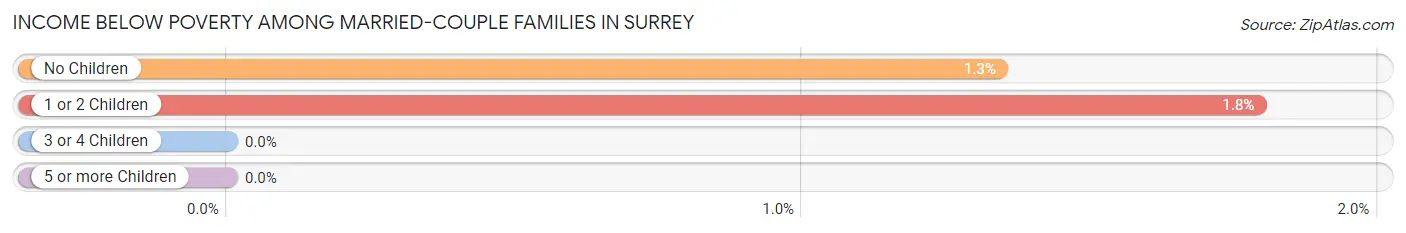
| Children | Above Poverty | Below Poverty |
| No Children | 221 (98.7%) | 3 (1.3%) |
| 1 or 2 Children | 110 (98.2%) | 2 (1.8%) |
| 3 or 4 Children | 28 (100.0%) | 0 (0.0%) |
| 5 or more Children | 10 (100.0%) | 0 (0.0%) |
| Total | 369 (98.7%) | 5 (1.3%) |
Income Below Poverty Among Single-Parent Households in Surrey
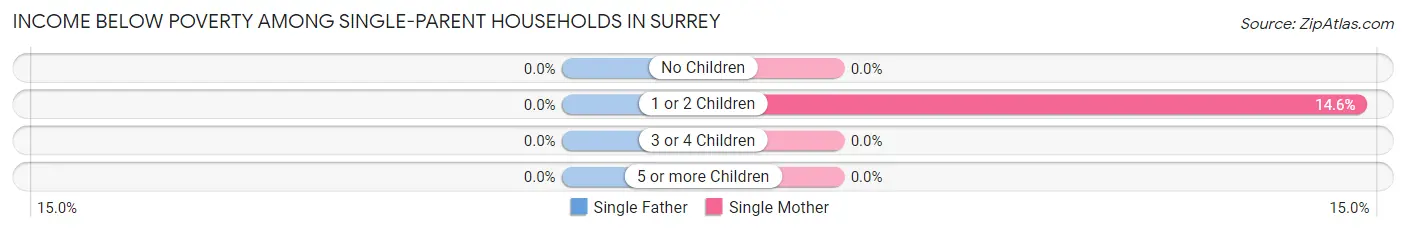
| Children | Single Father | Single Mother |
| No Children | 0 (0.0%) | 0 (0.0%) |
| 1 or 2 Children | 0 (0.0%) | 6 (14.6%) |
| 3 or 4 Children | 0 (0.0%) | 0 (0.0%) |
| 5 or more Children | 0 (0.0%) | 0 (0.0%) |
| Total | 0 (0.0%) | 6 (9.8%) |
Income Below Poverty Among Married-Couple vs Single-Parent Households in Surrey
The poverty data for Surrey shows that 5 of the married-couple family households (1.3%) and 6 of the single-parent households (7.2%) are living below the poverty level. Within the married-couple family households, those with 1 or 2 children have the highest poverty rate, with 2 households (1.8%) falling below the poverty line. Among the single-parent households, those with 1 or 2 children have the highest poverty rate, with 6 household (11.3%) living below poverty.
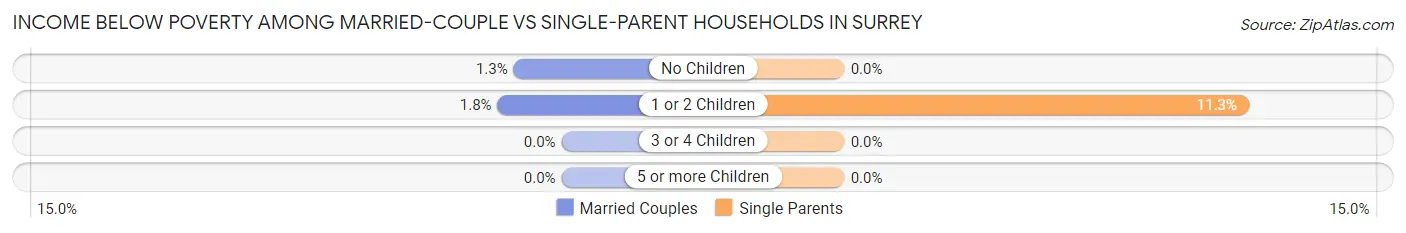
| Children | Married-Couple Families | Single-Parent Households |
| No Children | 3 (1.3%) | 0 (0.0%) |
| 1 or 2 Children | 2 (1.8%) | 6 (11.3%) |
| 3 or 4 Children | 0 (0.0%) | 0 (0.0%) |
| 5 or more Children | 0 (0.0%) | 0 (0.0%) |
| Total | 5 (1.3%) | 6 (7.2%) |
Race in Surrey
The most populous races in Surrey are White / Caucasian (1,485 | 93.8%), Two or more Races (60 | 3.8%), and Hispanic or Latino (47 | 3.0%).
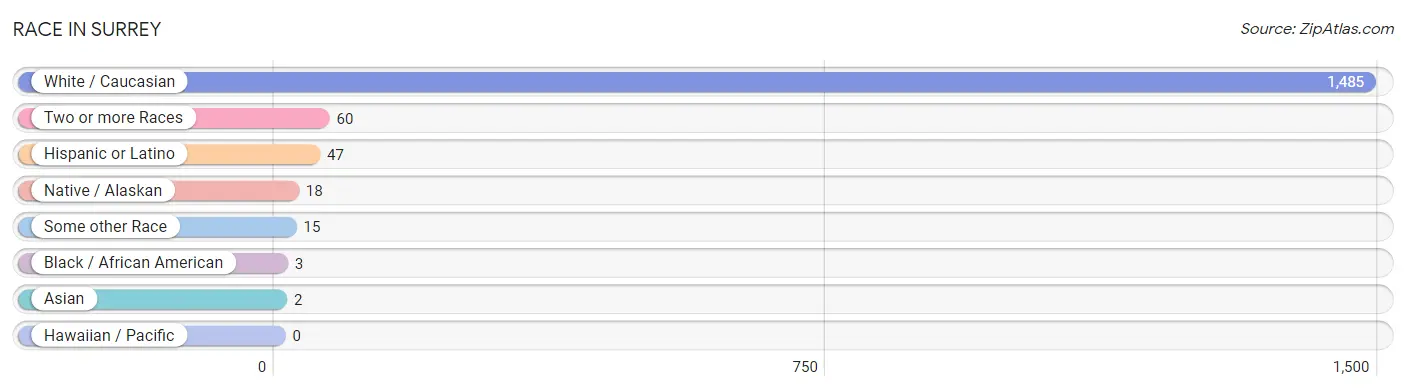
| Race | # Population | % Population |
| Asian | 2 | 0.1% |
| Black / African American | 3 | 0.2% |
| Hawaiian / Pacific | 0 | 0.0% |
| Hispanic or Latino | 47 | 3.0% |
| Native / Alaskan | 18 | 1.1% |
| White / Caucasian | 1,485 | 93.8% |
| Two or more Races | 60 | 3.8% |
| Some other Race | 15 | 0.9% |
| Total | 1,583 | 100.0% |
Ancestry in Surrey
The most populous ancestries reported in Surrey are German (638 | 40.3%), Norwegian (386 | 24.4%), Italian (136 | 8.6%), Irish (134 | 8.5%), and French (106 | 6.7%), together accounting for 88.4% of all Surrey residents.
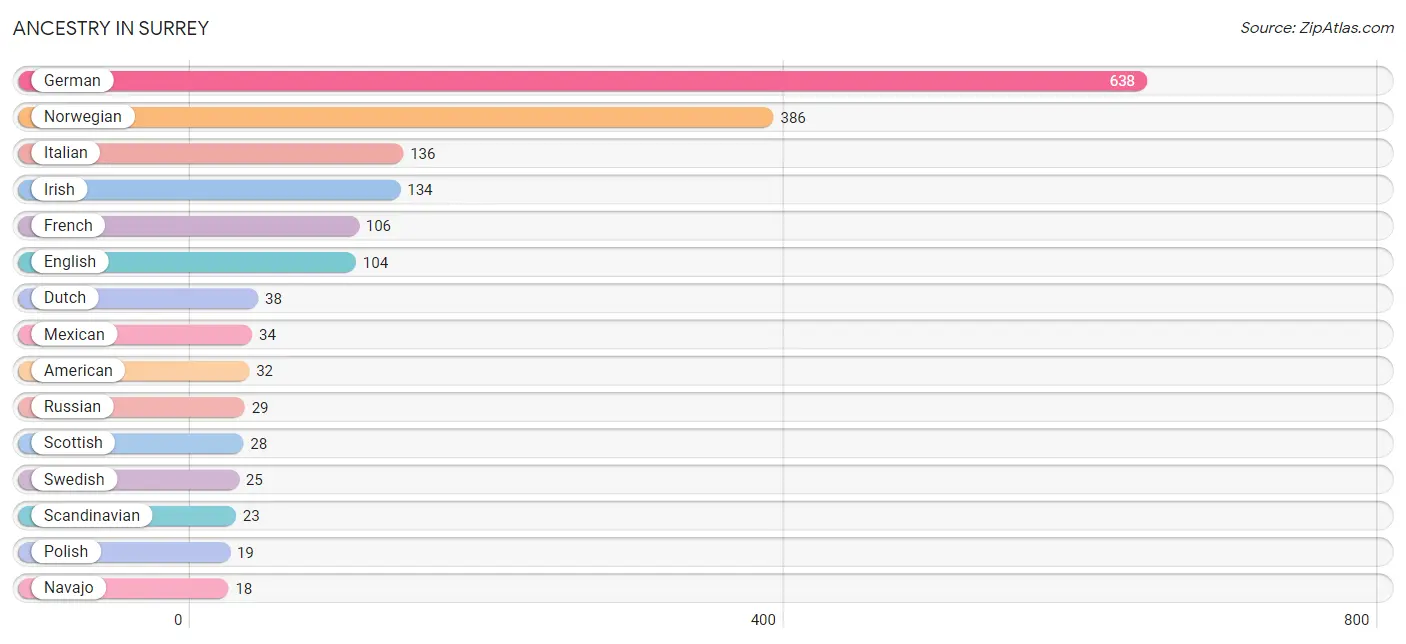
| Ancestry | # Population | % Population |
| Aleut | 10 | 0.6% |
| American | 32 | 2.0% |
| Arab | 7 | 0.4% |
| Austrian | 3 | 0.2% |
| Belgian | 3 | 0.2% |
| Burmese | 8 | 0.5% |
| Canadian | 11 | 0.7% |
| Central American | 11 | 0.7% |
| Danish | 2 | 0.1% |
| Dutch | 38 | 2.4% |
| English | 104 | 6.6% |
| Finnish | 3 | 0.2% |
| French | 106 | 6.7% |
| French Canadian | 5 | 0.3% |
| German | 638 | 40.3% |
| German Russian | 11 | 0.7% |
| Irish | 134 | 8.5% |
| Italian | 136 | 8.6% |
| Korean | 6 | 0.4% |
| Lebanese | 7 | 0.4% |
| Mexican | 34 | 2.1% |
| Navajo | 18 | 1.1% |
| Norwegian | 386 | 24.4% |
| Panamanian | 11 | 0.7% |
| Pennsylvania German | 7 | 0.4% |
| Polish | 19 | 1.2% |
| Puerto Rican | 2 | 0.1% |
| Russian | 29 | 1.8% |
| Scandinavian | 23 | 1.5% |
| Scottish | 28 | 1.8% |
| Swedish | 25 | 1.6% |
| Ukrainian | 15 | 0.9% |
| Welsh | 3 | 0.2% | View All 33 Rows |
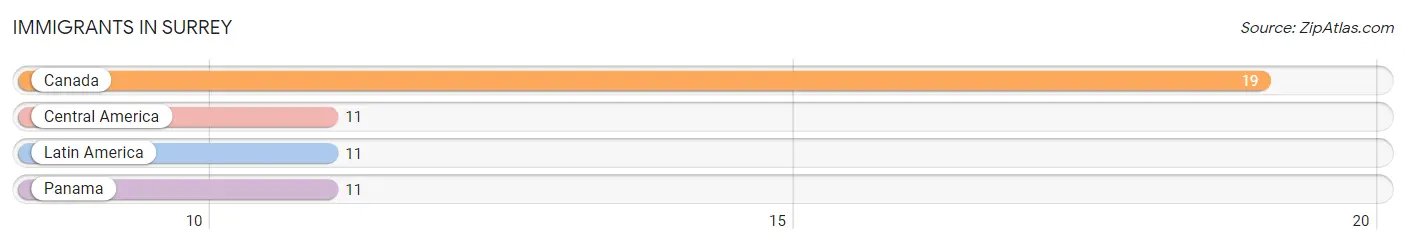
Immigrants in Surrey
The most numerous immigrant groups reported in Surrey came from Canada (19 | 1.2%), Central America (11 | 0.7%), Latin America (11 | 0.7%), and Panama (11 | 0.7%), together accounting for 3.3% of all Surrey residents.
| Immigration Origin | # Population | % Population |
| Canada | 19 | 1.2% |
| Central America | 11 | 0.7% |
| Latin America | 11 | 0.7% |
| Panama | 11 | 0.7% | View All 4 Rows |
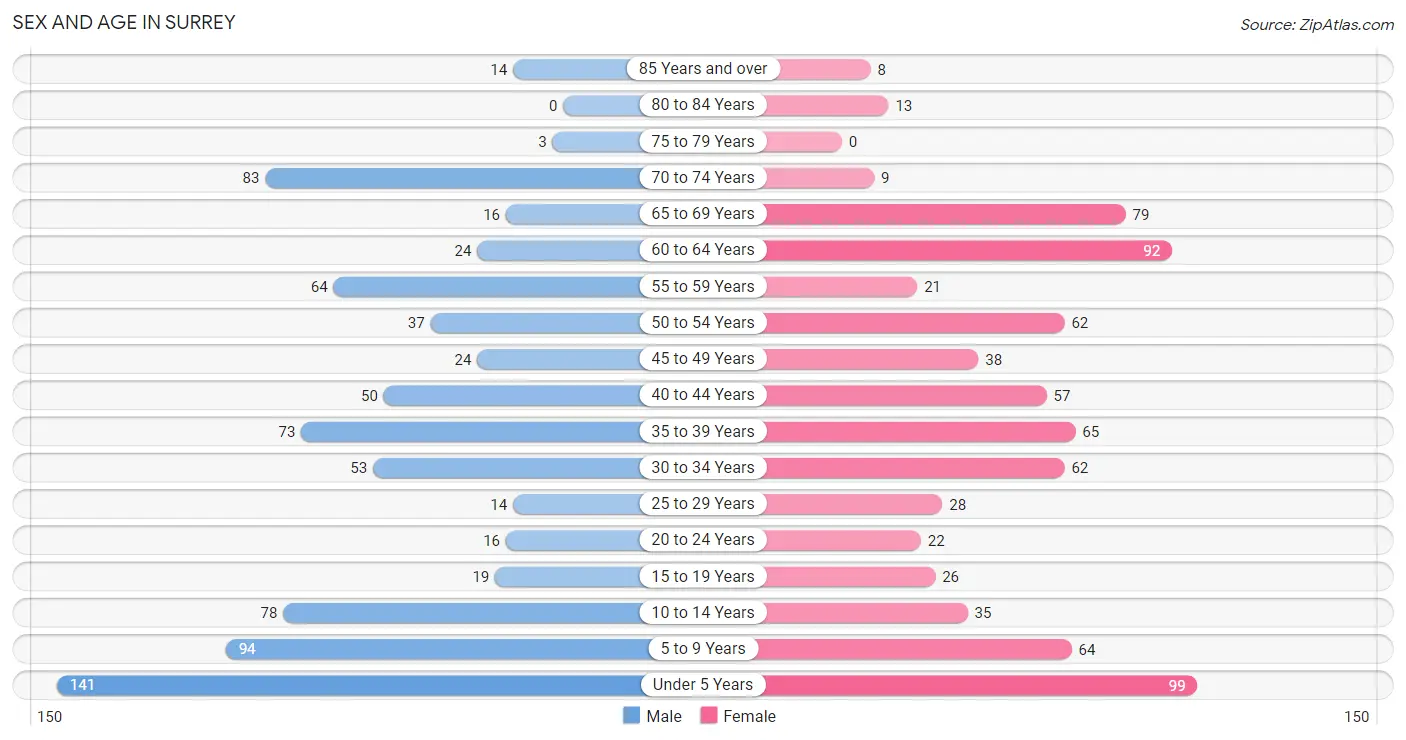
Sex and Age in Surrey
Sex and Age in Surrey
The most populous age groups in Surrey are Under 5 Years (141 | 17.6%) for men and Under 5 Years (99 | 12.7%) for women.
| Age Bracket | Male | Female |
| Under 5 Years | 141 (17.6%) | 99 (12.7%) |
| 5 to 9 Years | 94 (11.7%) | 64 (8.2%) |
| 10 to 14 Years | 78 (9.7%) | 35 (4.5%) |
| 15 to 19 Years | 19 (2.4%) | 26 (3.3%) |
| 20 to 24 Years | 16 (2.0%) | 22 (2.8%) |
| 25 to 29 Years | 14 (1.7%) | 28 (3.6%) |
| 30 to 34 Years | 53 (6.6%) | 62 (8.0%) |
| 35 to 39 Years | 73 (9.1%) | 65 (8.3%) |
| 40 to 44 Years | 50 (6.2%) | 57 (7.3%) |
| 45 to 49 Years | 24 (3.0%) | 38 (4.9%) |
| 50 to 54 Years | 37 (4.6%) | 62 (8.0%) |
| 55 to 59 Years | 64 (8.0%) | 21 (2.7%) |
| 60 to 64 Years | 24 (3.0%) | 92 (11.8%) |
| 65 to 69 Years | 16 (2.0%) | 79 (10.1%) |
| 70 to 74 Years | 83 (10.3%) | 9 (1.1%) |
| 75 to 79 Years | 3 (0.4%) | 0 (0.0%) |
| 80 to 84 Years | 0 (0.0%) | 13 (1.7%) |
| 85 Years and over | 14 (1.7%) | 8 (1.0%) |
| Total | 803 (100.0%) | 780 (100.0%) |
Families and Households in Surrey
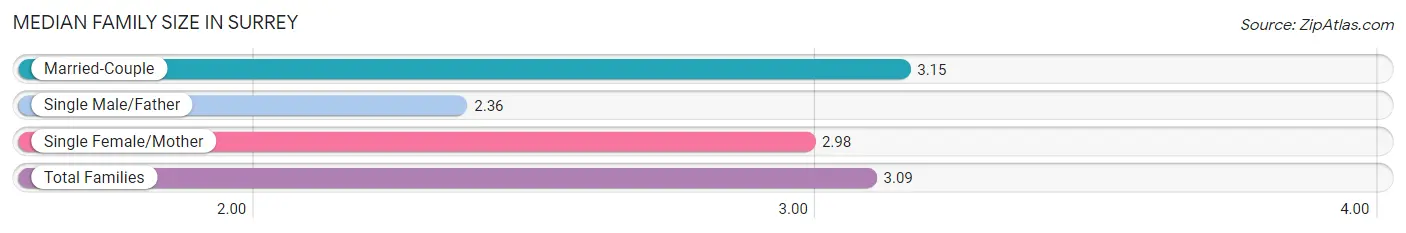
Median Family Size in Surrey
The median family size in Surrey is 3.09 persons per family, with married-couple families (374 | 81.8%) accounting for the largest median family size of 3.15 persons per family. On the other hand, single male/father families (22 | 4.8%) represent the smallest median family size with 2.36 persons per family.
| Family Type | # Families | Family Size |
| Married-Couple | 374 (81.8%) | 3.15 |
| Single Male/Father | 22 (4.8%) | 2.36 |
| Single Female/Mother | 61 (13.4%) | 2.98 |
| Total Families | 457 (100.0%) | 3.09 |
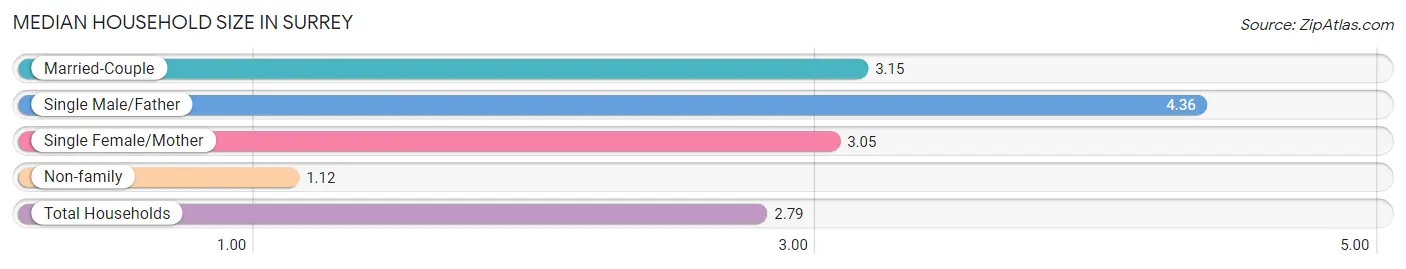
Median Household Size in Surrey
The median household size in Surrey is 2.79 persons per household, with single male/father households (22 | 3.9%) accounting for the largest median household size of 4.36 persons per household. non-family households (110 | 19.4%) represent the smallest median household size with 1.12 persons per household.
| Household Type | # Households | Household Size |
| Married-Couple | 374 (66.0%) | 3.15 |
| Single Male/Father | 22 (3.9%) | 4.36 |
| Single Female/Mother | 61 (10.8%) | 3.05 |
| Non-family | 110 (19.4%) | 1.12 |
| Total Households | 567 (100.0%) | 2.79 |
Household Size by Marriage Status in Surrey
Out of a total of 567 households in Surrey, 457 (80.6%) are family households, while 110 (19.4%) are nonfamily households. The most numerous type of family households are 2-person households, comprising 228, and the most common type of nonfamily households are 1-person households, comprising 105.
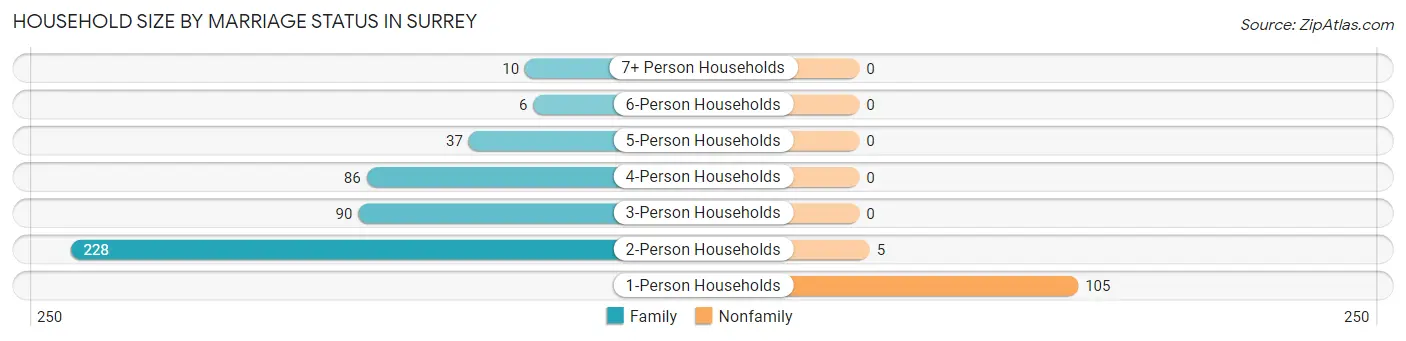
| Household Size | Family Households | Nonfamily Households |
| 1-Person Households | - | 105 (18.5%) |
| 2-Person Households | 228 (40.2%) | 5 (0.9%) |
| 3-Person Households | 90 (15.9%) | 0 (0.0%) |
| 4-Person Households | 86 (15.2%) | 0 (0.0%) |
| 5-Person Households | 37 (6.5%) | 0 (0.0%) |
| 6-Person Households | 6 (1.1%) | 0 (0.0%) |
| 7+ Person Households | 10 (1.8%) | 0 (0.0%) |
| Total | 457 (80.6%) | 110 (19.4%) |
Female Fertility in Surrey
Fertility by Age in Surrey
Average fertility rate in Surrey is 161.0 births per 1,000 women. Women in the age bracket of 20 to 34 years have the highest fertility rate with 268.0 births per 1,000 women. Women in the age bracket of 20 to 34 years acount for 60.0% of all women with births.
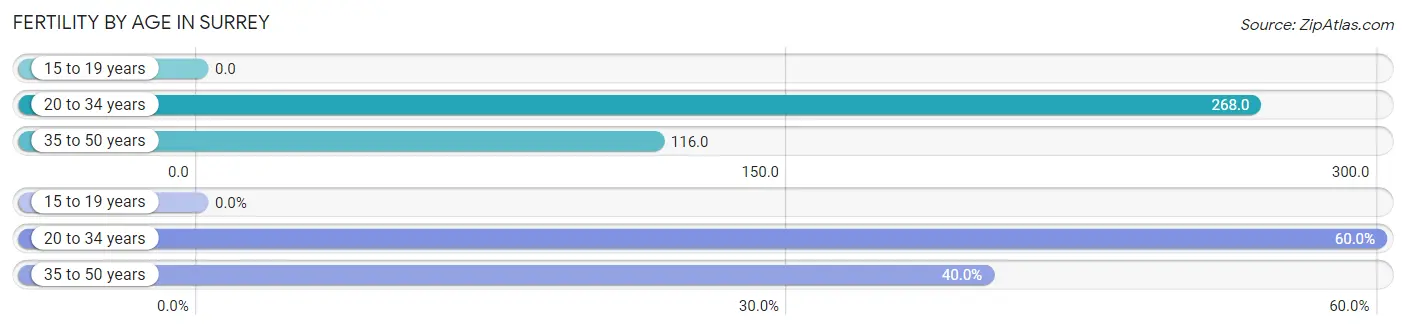
| Age Bracket | Women with Births | Births / 1,000 Women |
| 15 to 19 years | 0 (0.0%) | 0.0 |
| 20 to 34 years | 30 (60.0%) | 268.0 |
| 35 to 50 years | 20 (40.0%) | 116.0 |
| Total | 50 (100.0%) | 161.0 |
Fertility by Age by Marriage Status in Surrey
92.0% of women with births (50) in Surrey are married. The highest percentage of unmarried women with births falls into 20 to 34 years age bracket with 13.3% of them unmarried at the time of birth, while the lowest percentage of unmarried women with births belong to 35 to 50 years age bracket with 0.0% of them unmarried.
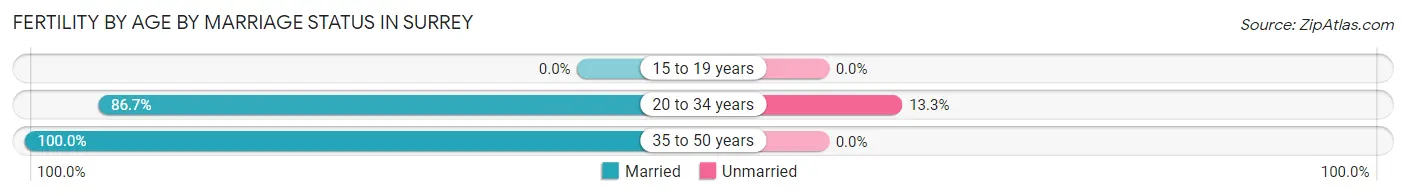
| Age Bracket | Married | Unmarried |
| 15 to 19 years | 0 (0.0%) | 0 (0.0%) |
| 20 to 34 years | 26 (86.7%) | 4 (13.3%) |
| 35 to 50 years | 20 (100.0%) | 0 (0.0%) |
| Total | 46 (92.0%) | 4 (8.0%) |
Fertility by Education in Surrey
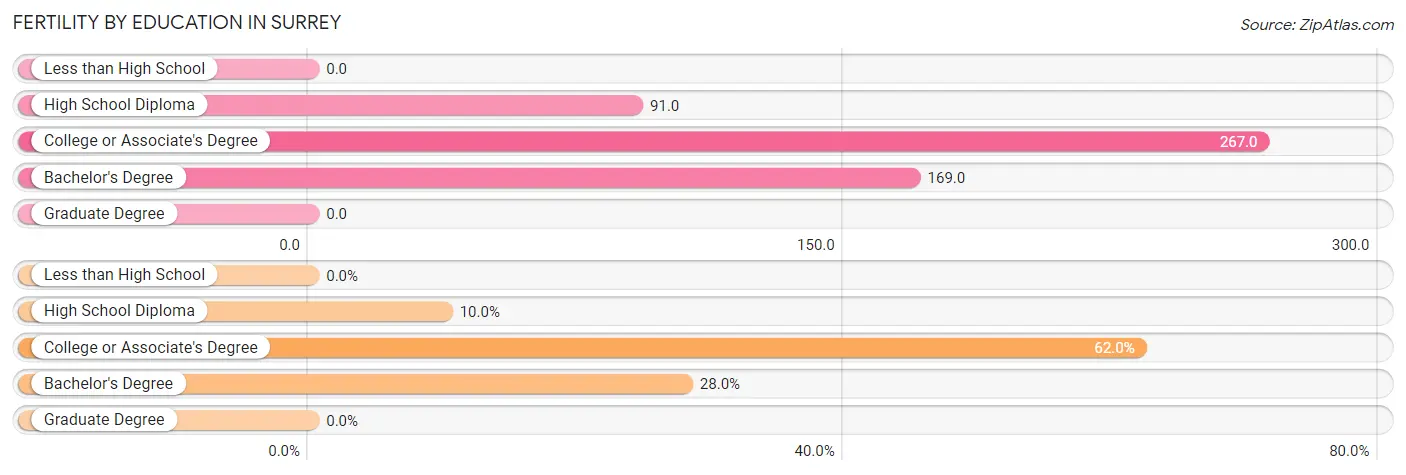
| Educational Attainment | Women with Births | Births / 1,000 Women |
| Less than High School | 0 (0.0%) | 0.0 |
| High School Diploma | 5 (10.0%) | 91.0 |
| College or Associate's Degree | 31 (62.0%) | 267.0 |
| Bachelor's Degree | 14 (28.0%) | 169.0 |
| Graduate Degree | 0 (0.0%) | 0.0 |
| Total | 50 (100.0%) | 161.0 |
Fertility by Education by Marriage Status in Surrey
8.0% of women with births in Surrey are unmarried. Women with the educational attainment of high school diploma are most likely to be married with 100.0% of them married at childbirth, while women with the educational attainment of bachelor's degree are least likely to be married with 28.6% of them unmarried at childbirth.
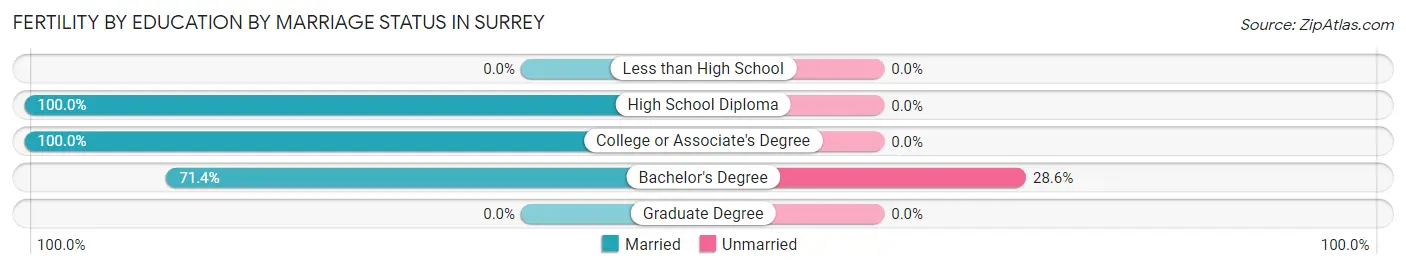
| Educational Attainment | Married | Unmarried |
| Less than High School | 0 (0.0%) | 0 (0.0%) |
| High School Diploma | 5 (100.0%) | 0 (0.0%) |
| College or Associate's Degree | 31 (100.0%) | 0 (0.0%) |
| Bachelor's Degree | 10 (71.4%) | 4 (28.6%) |
| Graduate Degree | 0 (0.0%) | 0 (0.0%) |
| Total | 46 (92.0%) | 4 (8.0%) |
Employment Characteristics in Surrey
Employment by Class of Employer in Surrey
Among the 716 employed individuals in Surrey, private company employees (404 | 56.4%), not-for-profit organizations (81 | 11.3%), and local government employees (71 | 9.9%) make up the most common classes of employment.
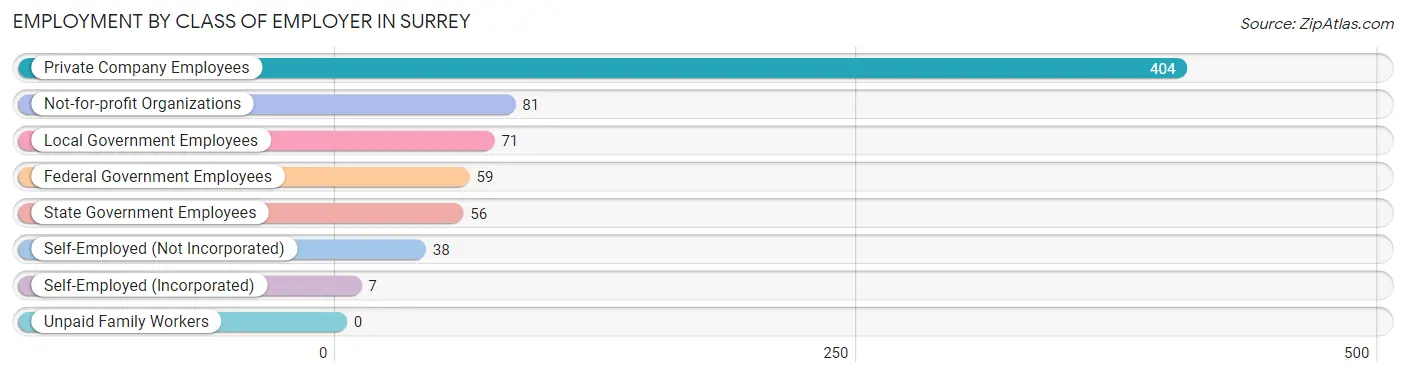
| Employer Class | # Employees | % Employees |
| Private Company Employees | 404 | 56.4% |
| Self-Employed (Incorporated) | 7 | 1.0% |
| Self-Employed (Not Incorporated) | 38 | 5.3% |
| Not-for-profit Organizations | 81 | 11.3% |
| Local Government Employees | 71 | 9.9% |
| State Government Employees | 56 | 7.8% |
| Federal Government Employees | 59 | 8.2% |
| Unpaid Family Workers | 0 | 0.0% |
| Total | 716 | 100.0% |
Employment Status by Age in Surrey
According to the labor force statistics for Surrey, out of the total population over 16 years of age (1,059), 72.8% or 771 individuals are in the labor force, with 3.8% or 29 of them unemployed. The age group with the highest labor force participation rate is 30 to 34 years, with 100.0% or 115 individuals in the labor force. Within the labor force, the 16 to 19 years age range has the highest percentage of unemployed individuals, with 22.2% or 4 of them being unemployed.
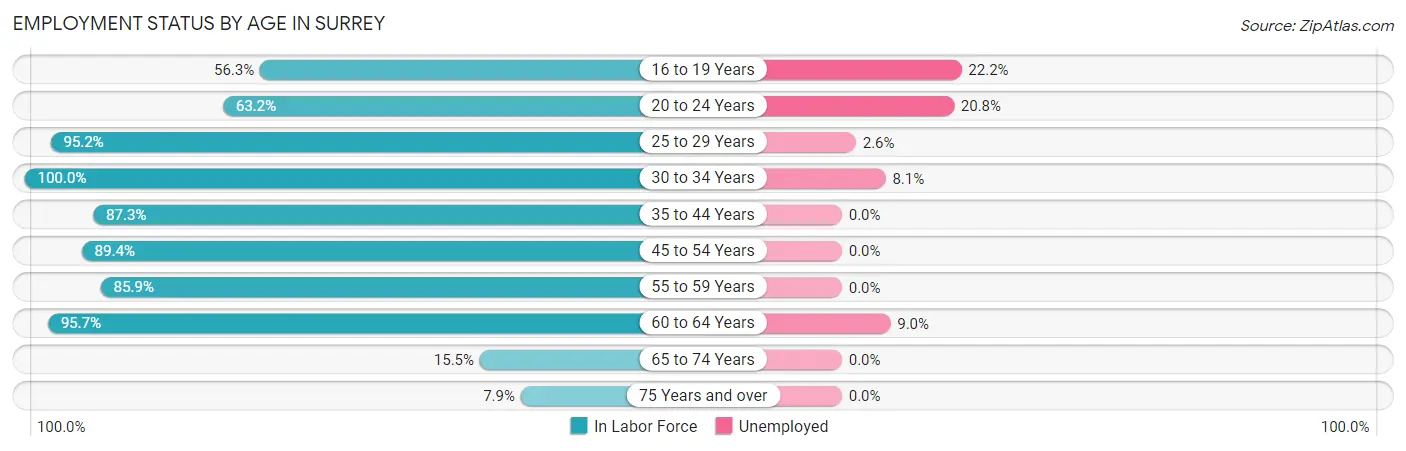
| Age Bracket | In Labor Force | Unemployed |
| 16 to 19 Years | 18 (56.3%) | 4 (22.2%) |
| 20 to 24 Years | 24 (63.2%) | 5 (20.8%) |
| 25 to 29 Years | 40 (95.2%) | 1 (2.6%) |
| 30 to 34 Years | 115 (100.0%) | 9 (8.1%) |
| 35 to 44 Years | 214 (87.3%) | 0 (0.0%) |
| 45 to 54 Years | 144 (89.4%) | 0 (0.0%) |
| 55 to 59 Years | 73 (85.9%) | 0 (0.0%) |
| 60 to 64 Years | 111 (95.7%) | 10 (9.0%) |
| 65 to 74 Years | 29 (15.5%) | 0 (0.0%) |
| 75 Years and over | 3 (7.9%) | 0 (0.0%) |
| Total | 771 (72.8%) | 29 (3.8%) |
Employment Status by Educational Attainment in Surrey
According to labor force statistics for Surrey, 91.2% of individuals (697) out of the total population between 25 and 64 years of age (764) are in the labor force, with 2.9% or 20 of them being unemployed. The group with the highest labor force participation rate are those with the educational attainment of less than high school, with 100.0% or 2 individuals in the labor force. Within the labor force, individuals with high school diploma education have the highest percentage of unemployment, with 13.6% or 19 of them being unemployed.
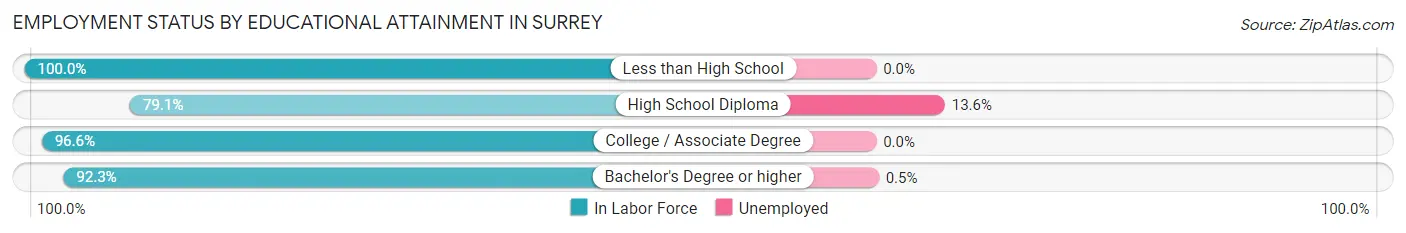
| Educational Attainment | In Labor Force | Unemployed |
| Less than High School | 2 (100.0%) | 0 (0.0%) |
| High School Diploma | 140 (79.1%) | 24 (13.6%) |
| College / Associate Degree | 338 (96.6%) | 0 (0.0%) |
| Bachelor's Degree or higher | 217 (92.3%) | 1 (0.5%) |
| Total | 697 (91.2%) | 22 (2.9%) |
Employment Occupations by Sex in Surrey
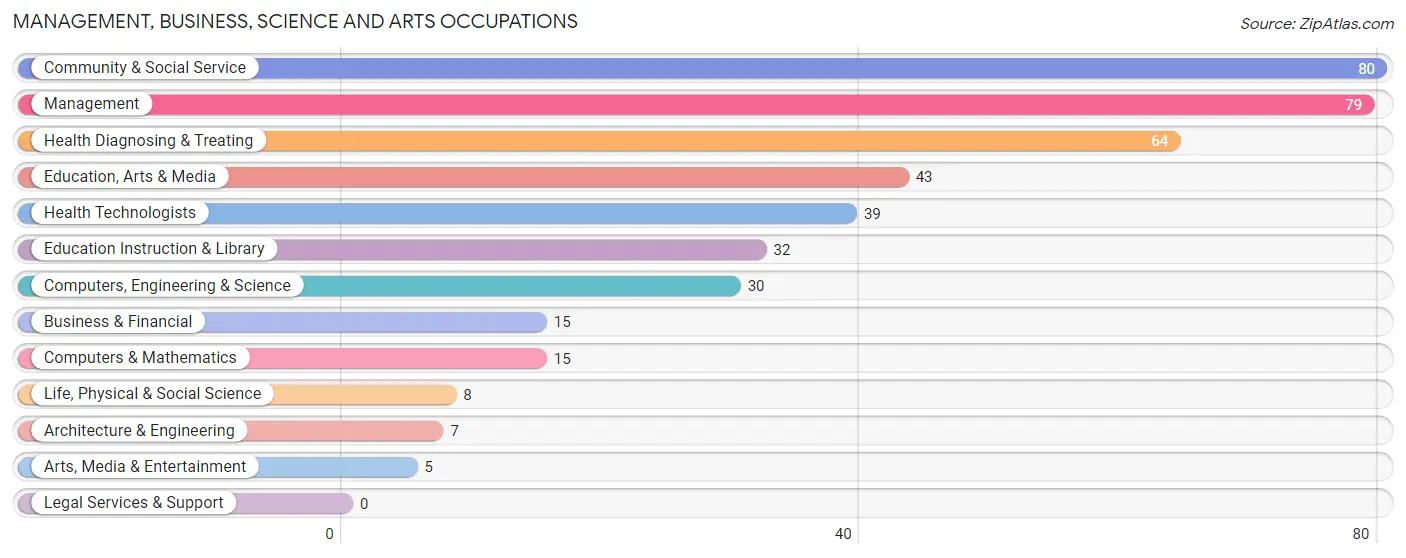
Management, Business, Science and Arts Occupations
The most common Management, Business, Science and Arts occupations in Surrey are Community & Social Service (80 | 11.0%), Management (79 | 10.8%), Health Diagnosing & Treating (64 | 8.8%), Education, Arts & Media (43 | 5.9%), and Health Technologists (39 | 5.3%).
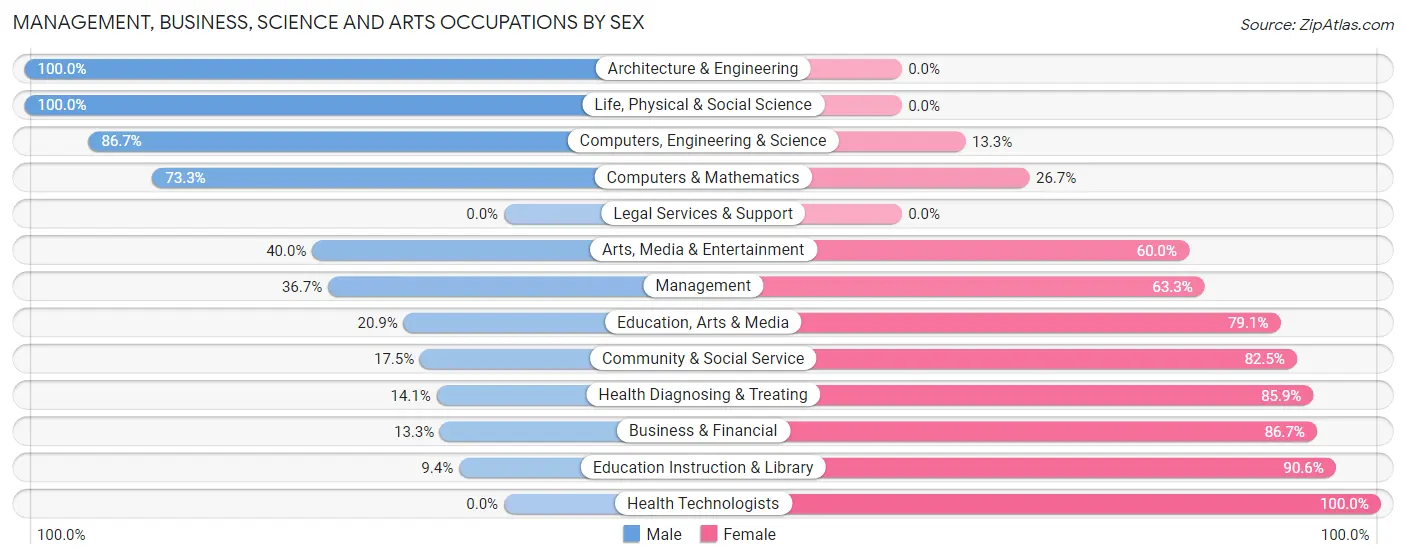
Management, Business, Science and Arts Occupations by Sex
Within the Management, Business, Science and Arts occupations in Surrey, the most male-oriented occupations are Architecture & Engineering (100.0%), Life, Physical & Social Science (100.0%), and Computers, Engineering & Science (86.7%), while the most female-oriented occupations are Health Technologists (100.0%), Education Instruction & Library (90.6%), and Business & Financial (86.7%).
| Occupation | Male | Female |
| Management | 29 (36.7%) | 50 (63.3%) |
| Business & Financial | 2 (13.3%) | 13 (86.7%) |
| Computers, Engineering & Science | 26 (86.7%) | 4 (13.3%) |
| Computers & Mathematics | 11 (73.3%) | 4 (26.7%) |
| Architecture & Engineering | 7 (100.0%) | 0 (0.0%) |
| Life, Physical & Social Science | 8 (100.0%) | 0 (0.0%) |
| Community & Social Service | 14 (17.5%) | 66 (82.5%) |
| Education, Arts & Media | 9 (20.9%) | 34 (79.1%) |
| Legal Services & Support | 0 (0.0%) | 0 (0.0%) |
| Education Instruction & Library | 3 (9.4%) | 29 (90.6%) |
| Arts, Media & Entertainment | 2 (40.0%) | 3 (60.0%) |
| Health Diagnosing & Treating | 9 (14.1%) | 55 (85.9%) |
| Health Technologists | 0 (0.0%) | 39 (100.0%) |
| Total (Category) | 80 (29.8%) | 188 (70.2%) |
| Total (Overall) | 327 (44.9%) | 402 (55.1%) |
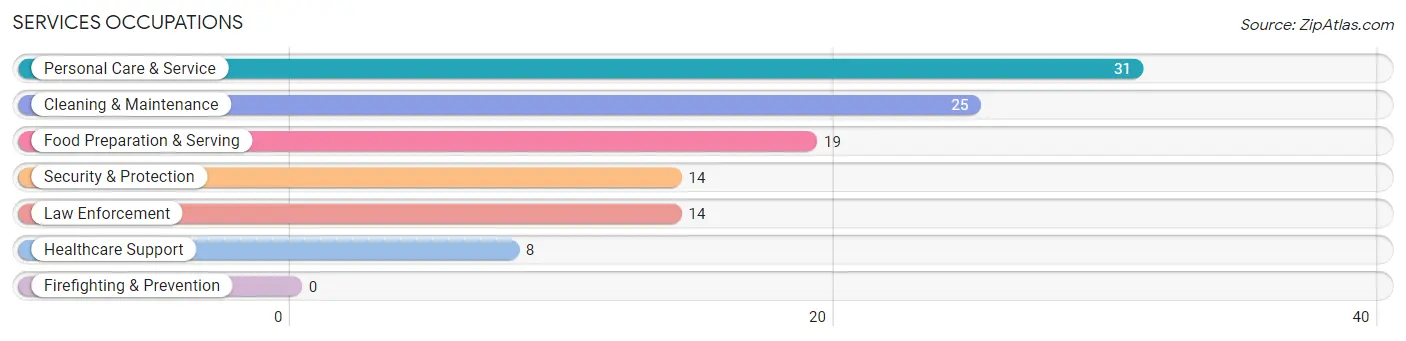
Services Occupations
The most common Services occupations in Surrey are Personal Care & Service (31 | 4.3%), Cleaning & Maintenance (25 | 3.4%), Food Preparation & Serving (19 | 2.6%), Security & Protection (14 | 1.9%), and Law Enforcement (14 | 1.9%).
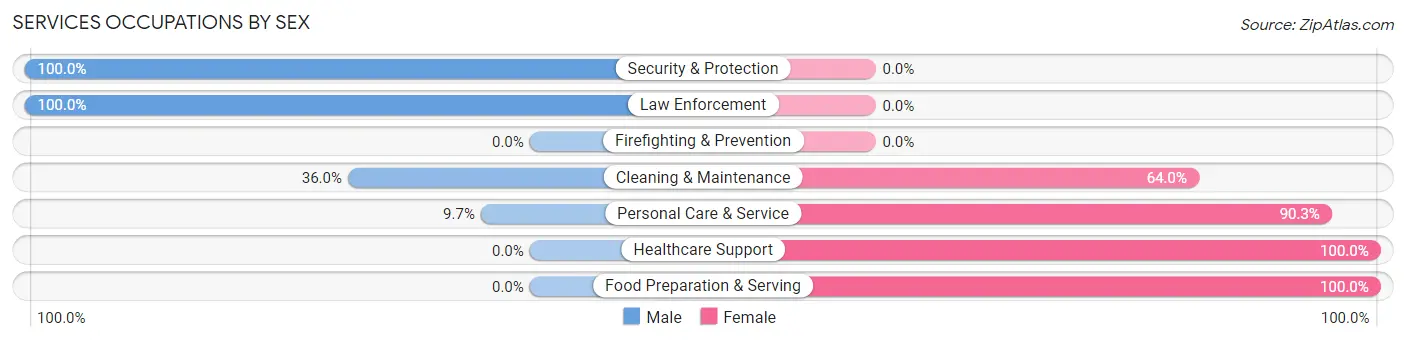
Services Occupations by Sex
Within the Services occupations in Surrey, the most male-oriented occupations are Security & Protection (100.0%), Law Enforcement (100.0%), and Cleaning & Maintenance (36.0%), while the most female-oriented occupations are Healthcare Support (100.0%), Food Preparation & Serving (100.0%), and Personal Care & Service (90.3%).
| Occupation | Male | Female |
| Healthcare Support | 0 (0.0%) | 8 (100.0%) |
| Security & Protection | 14 (100.0%) | 0 (0.0%) |
| Firefighting & Prevention | 0 (0.0%) | 0 (0.0%) |
| Law Enforcement | 14 (100.0%) | 0 (0.0%) |
| Food Preparation & Serving | 0 (0.0%) | 19 (100.0%) |
| Cleaning & Maintenance | 9 (36.0%) | 16 (64.0%) |
| Personal Care & Service | 3 (9.7%) | 28 (90.3%) |
| Total (Category) | 26 (26.8%) | 71 (73.2%) |
| Total (Overall) | 327 (44.9%) | 402 (55.1%) |
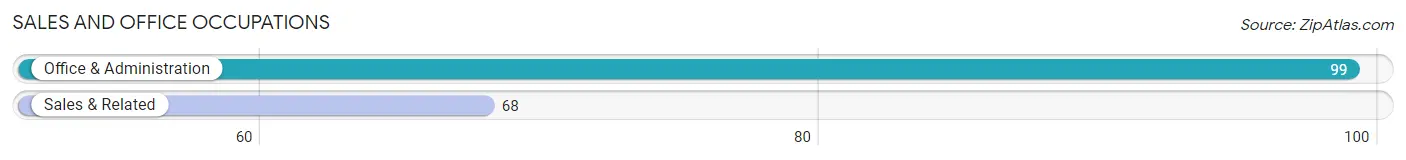
Sales and Office Occupations
The most common Sales and Office occupations in Surrey are Office & Administration (99 | 13.6%), and Sales & Related (68 | 9.3%).
Sales and Office Occupations by Sex
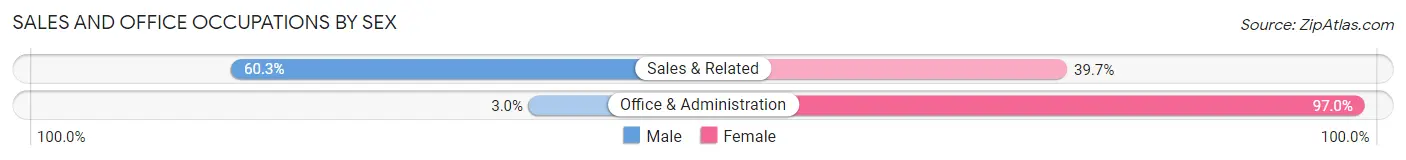
| Occupation | Male | Female |
| Sales & Related | 41 (60.3%) | 27 (39.7%) |
| Office & Administration | 3 (3.0%) | 96 (97.0%) |
| Total (Category) | 44 (26.4%) | 123 (73.7%) |
| Total (Overall) | 327 (44.9%) | 402 (55.1%) |
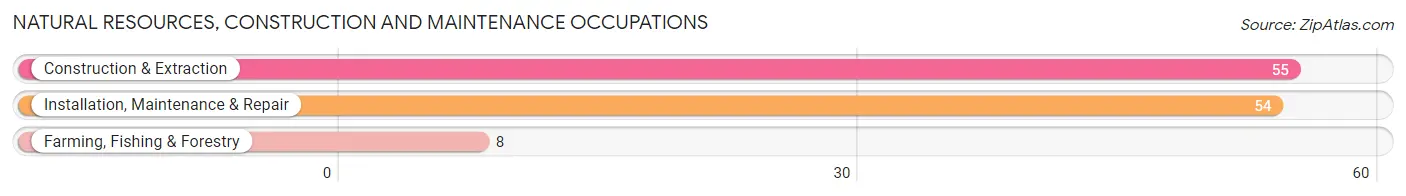
Natural Resources, Construction and Maintenance Occupations
The most common Natural Resources, Construction and Maintenance occupations in Surrey are Construction & Extraction (55 | 7.5%), Installation, Maintenance & Repair (54 | 7.4%), and Farming, Fishing & Forestry (8 | 1.1%).
Natural Resources, Construction and Maintenance Occupations by Sex
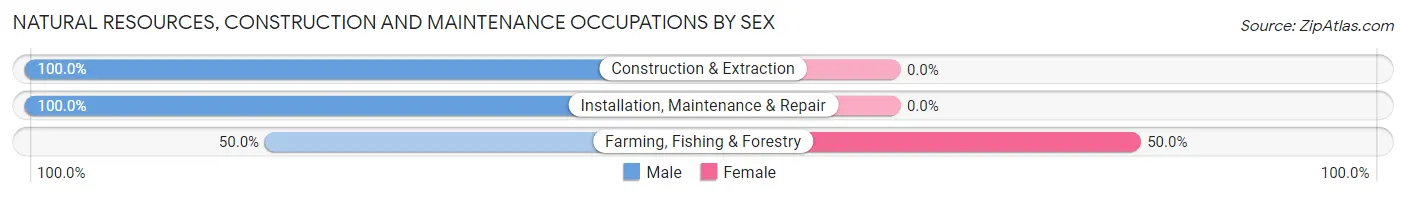
| Occupation | Male | Female |
| Farming, Fishing & Forestry | 4 (50.0%) | 4 (50.0%) |
| Construction & Extraction | 55 (100.0%) | 0 (0.0%) |
| Installation, Maintenance & Repair | 54 (100.0%) | 0 (0.0%) |
| Total (Category) | 113 (96.6%) | 4 (3.4%) |
| Total (Overall) | 327 (44.9%) | 402 (55.1%) |
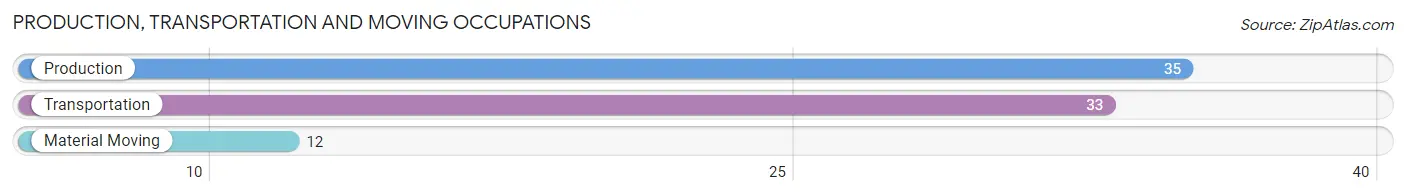
Production, Transportation and Moving Occupations
The most common Production, Transportation and Moving occupations in Surrey are Production (35 | 4.8%), Transportation (33 | 4.5%), and Material Moving (12 | 1.7%).
Production, Transportation and Moving Occupations by Sex
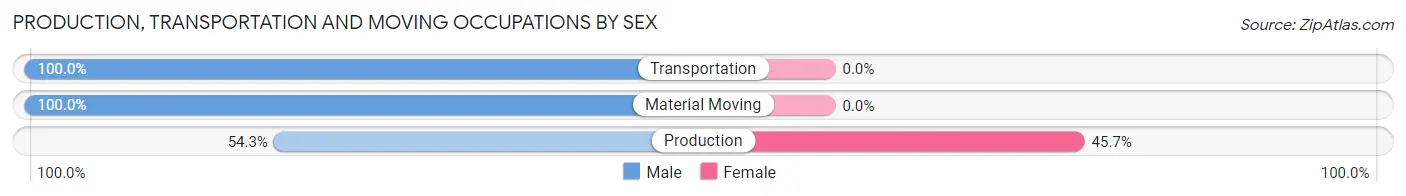
| Occupation | Male | Female |
| Production | 19 (54.3%) | 16 (45.7%) |
| Transportation | 33 (100.0%) | 0 (0.0%) |
| Material Moving | 12 (100.0%) | 0 (0.0%) |
| Total (Category) | 64 (80.0%) | 16 (20.0%) |
| Total (Overall) | 327 (44.9%) | 402 (55.1%) |
Employment Industries by Sex in Surrey
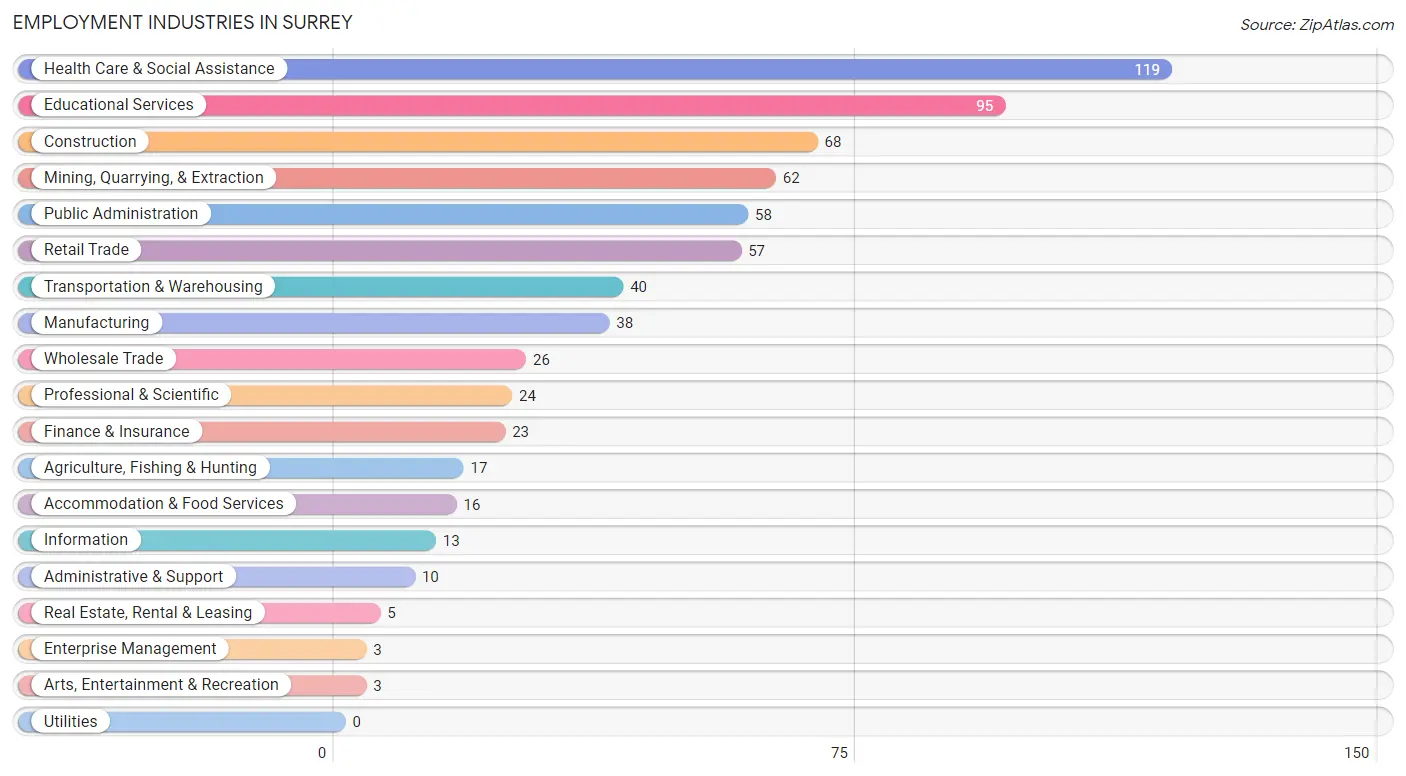
Employment Industries in Surrey
The major employment industries in Surrey include Health Care & Social Assistance (119 | 16.3%), Educational Services (95 | 13.0%), Construction (68 | 9.3%), Mining, Quarrying, & Extraction (62 | 8.5%), and Public Administration (58 | 8.0%).
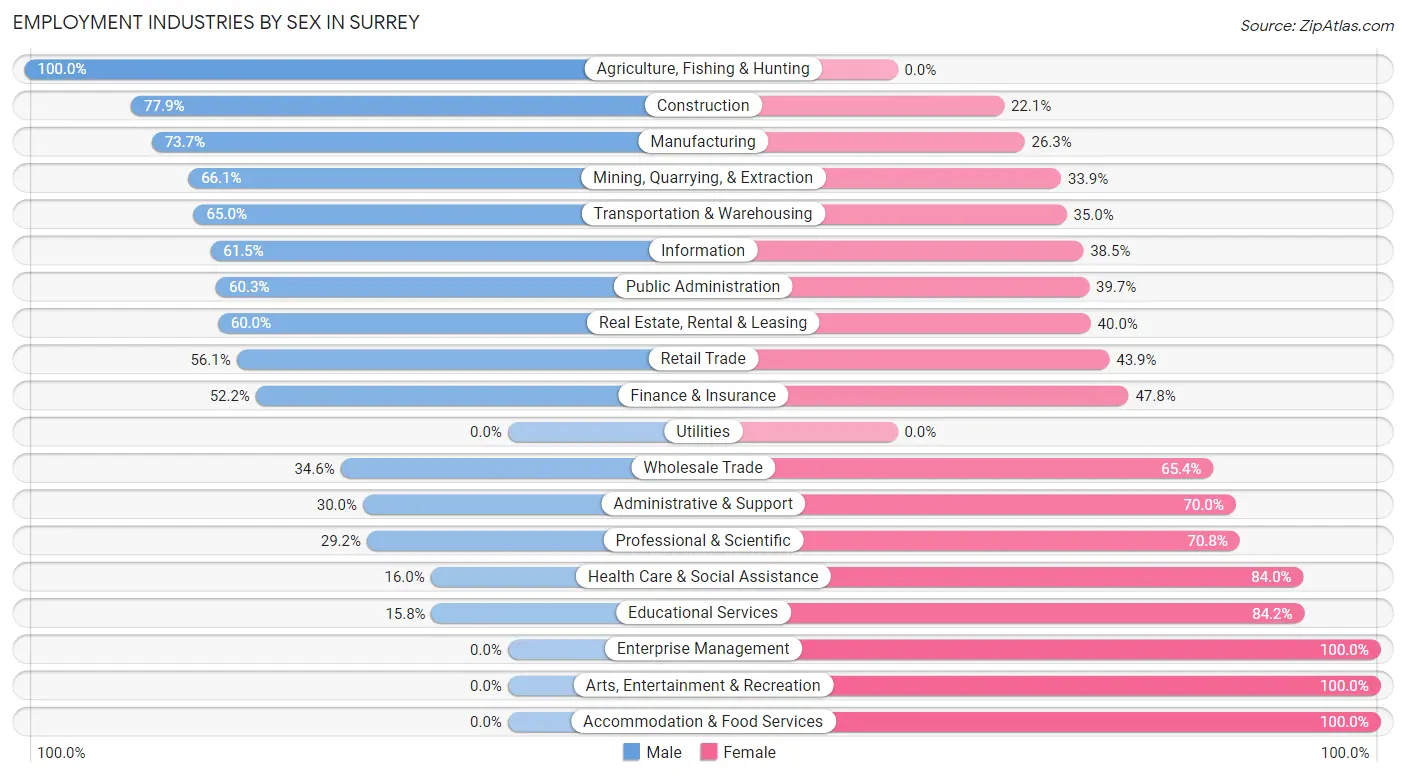
Employment Industries by Sex in Surrey
The Surrey industries that see more men than women are Agriculture, Fishing & Hunting (100.0%), Construction (77.9%), and Manufacturing (73.7%), whereas the industries that tend to have a higher number of women are Enterprise Management (100.0%), Arts, Entertainment & Recreation (100.0%), and Accommodation & Food Services (100.0%).
| Industry | Male | Female |
| Agriculture, Fishing & Hunting | 17 (100.0%) | 0 (0.0%) |
| Mining, Quarrying, & Extraction | 41 (66.1%) | 21 (33.9%) |
| Construction | 53 (77.9%) | 15 (22.1%) |
| Manufacturing | 28 (73.7%) | 10 (26.3%) |
| Wholesale Trade | 9 (34.6%) | 17 (65.4%) |
| Retail Trade | 32 (56.1%) | 25 (43.9%) |
| Transportation & Warehousing | 26 (65.0%) | 14 (35.0%) |
| Utilities | 0 (0.0%) | 0 (0.0%) |
| Information | 8 (61.5%) | 5 (38.5%) |
| Finance & Insurance | 12 (52.2%) | 11 (47.8%) |
| Real Estate, Rental & Leasing | 3 (60.0%) | 2 (40.0%) |
| Professional & Scientific | 7 (29.2%) | 17 (70.8%) |
| Enterprise Management | 0 (0.0%) | 3 (100.0%) |
| Administrative & Support | 3 (30.0%) | 7 (70.0%) |
| Educational Services | 15 (15.8%) | 80 (84.2%) |
| Health Care & Social Assistance | 19 (16.0%) | 100 (84.0%) |
| Arts, Entertainment & Recreation | 0 (0.0%) | 3 (100.0%) |
| Accommodation & Food Services | 0 (0.0%) | 16 (100.0%) |
| Public Administration | 35 (60.3%) | 23 (39.7%) |
| Total | 327 (44.9%) | 402 (55.1%) |
Education in Surrey
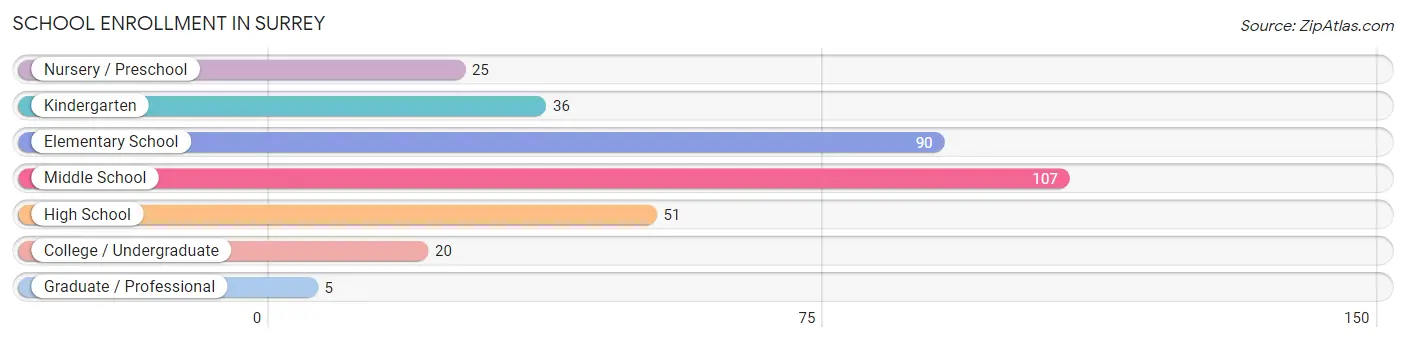
School Enrollment in Surrey
The most common levels of schooling among the 334 students in Surrey are middle school (107 | 32.0%), elementary school (90 | 27.0%), and high school (51 | 15.3%).
| School Level | # Students | % Students |
| Nursery / Preschool | 25 | 7.5% |
| Kindergarten | 36 | 10.8% |
| Elementary School | 90 | 27.0% |
| Middle School | 107 | 32.0% |
| High School | 51 | 15.3% |
| College / Undergraduate | 20 | 6.0% |
| Graduate / Professional | 5 | 1.5% |
| Total | 334 | 100.0% |
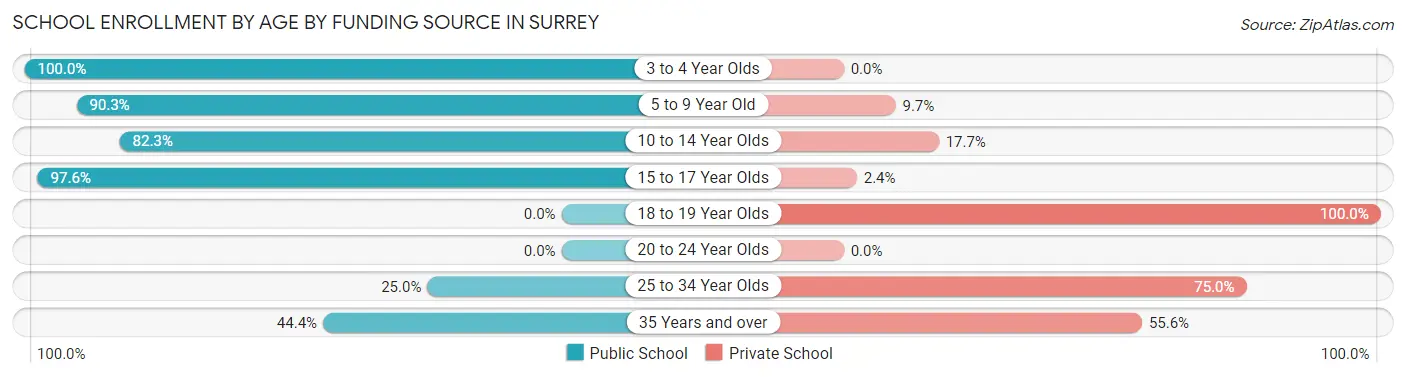
School Enrollment by Age by Funding Source in Surrey
Out of a total of 334 students who are enrolled in schools in Surrey, 56 (16.8%) attend a private institution, while the remaining 278 (83.2%) are enrolled in public schools. The age group of 18 to 19 year olds has the highest likelihood of being enrolled in private schools, with 4 (100.0% in the age bracket) enrolled. Conversely, the age group of 3 to 4 year olds has the lowest likelihood of being enrolled in a private school, with 6 (100.0% in the age bracket) attending a public institution.
| Age Bracket | Public School | Private School |
| 3 to 4 Year Olds | 6 (100.0%) | 0 (0.0%) |
| 5 to 9 Year Old | 131 (90.3%) | 14 (9.7%) |
| 10 to 14 Year Olds | 93 (82.3%) | 20 (17.7%) |
| 15 to 17 Year Olds | 40 (97.6%) | 1 (2.4%) |
| 18 to 19 Year Olds | 0 (0.0%) | 4 (100.0%) |
| 20 to 24 Year Olds | 0 (0.0%) | 0 (0.0%) |
| 25 to 34 Year Olds | 4 (25.0%) | 12 (75.0%) |
| 35 Years and over | 4 (44.4%) | 5 (55.6%) |
| Total | 278 (83.2%) | 56 (16.8%) |
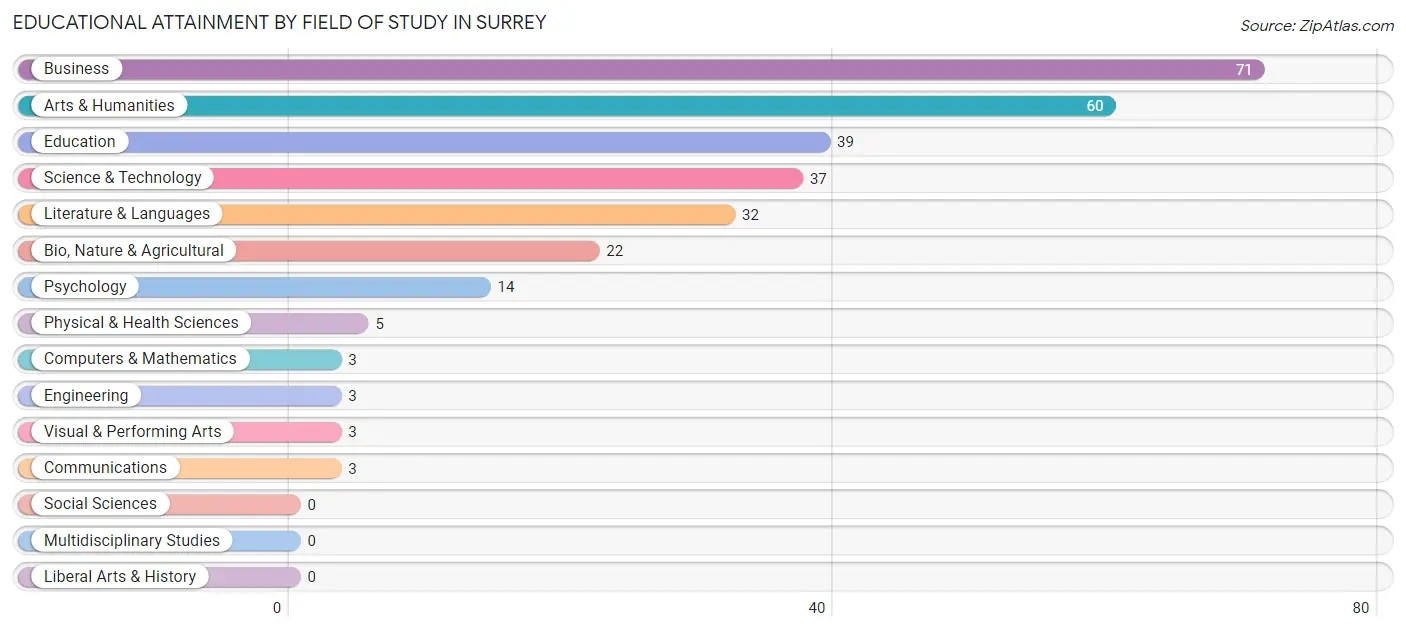
Educational Attainment by Field of Study in Surrey
Business (71 | 24.3%), arts & humanities (60 | 20.5%), education (39 | 13.4%), science & technology (37 | 12.7%), and literature & languages (32 | 11.0%) are the most common fields of study among 292 individuals in Surrey who have obtained a bachelor's degree or higher.
| Field of Study | # Graduates | % Graduates |
| Computers & Mathematics | 3 | 1.0% |
| Bio, Nature & Agricultural | 22 | 7.5% |
| Physical & Health Sciences | 5 | 1.7% |
| Psychology | 14 | 4.8% |
| Social Sciences | 0 | 0.0% |
| Engineering | 3 | 1.0% |
| Multidisciplinary Studies | 0 | 0.0% |
| Science & Technology | 37 | 12.7% |
| Business | 71 | 24.3% |
| Education | 39 | 13.4% |
| Literature & Languages | 32 | 11.0% |
| Liberal Arts & History | 0 | 0.0% |
| Visual & Performing Arts | 3 | 1.0% |
| Communications | 3 | 1.0% |
| Arts & Humanities | 60 | 20.5% |
| Total | 292 | 100.0% |
Transportation & Commute in Surrey
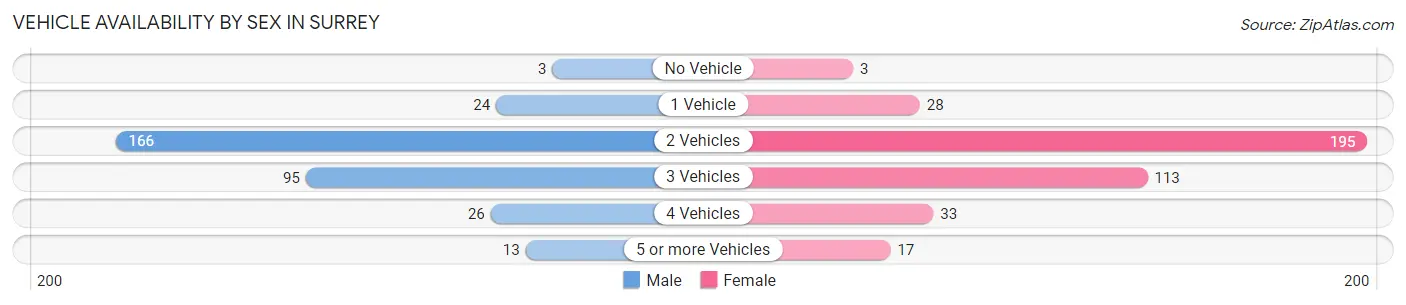
Vehicle Availability by Sex in Surrey
The most prevalent vehicle ownership categories in Surrey are males with 2 vehicles (166, accounting for 50.8%) and females with 2 vehicles (195, making up 42.7%).
| Vehicles Available | Male | Female |
| No Vehicle | 3 (0.9%) | 3 (0.8%) |
| 1 Vehicle | 24 (7.3%) | 28 (7.2%) |
| 2 Vehicles | 166 (50.8%) | 195 (50.1%) |
| 3 Vehicles | 95 (29.0%) | 113 (29.0%) |
| 4 Vehicles | 26 (8.0%) | 33 (8.5%) |
| 5 or more Vehicles | 13 (4.0%) | 17 (4.4%) |
| Total | 327 (100.0%) | 389 (100.0%) |
Commute Time in Surrey
The most frequently occuring commute durations in Surrey are 15 to 19 minutes (197 commuters, 28.2%), 20 to 24 minutes (167 commuters, 23.9%), and 10 to 14 minutes (126 commuters, 18.0%).
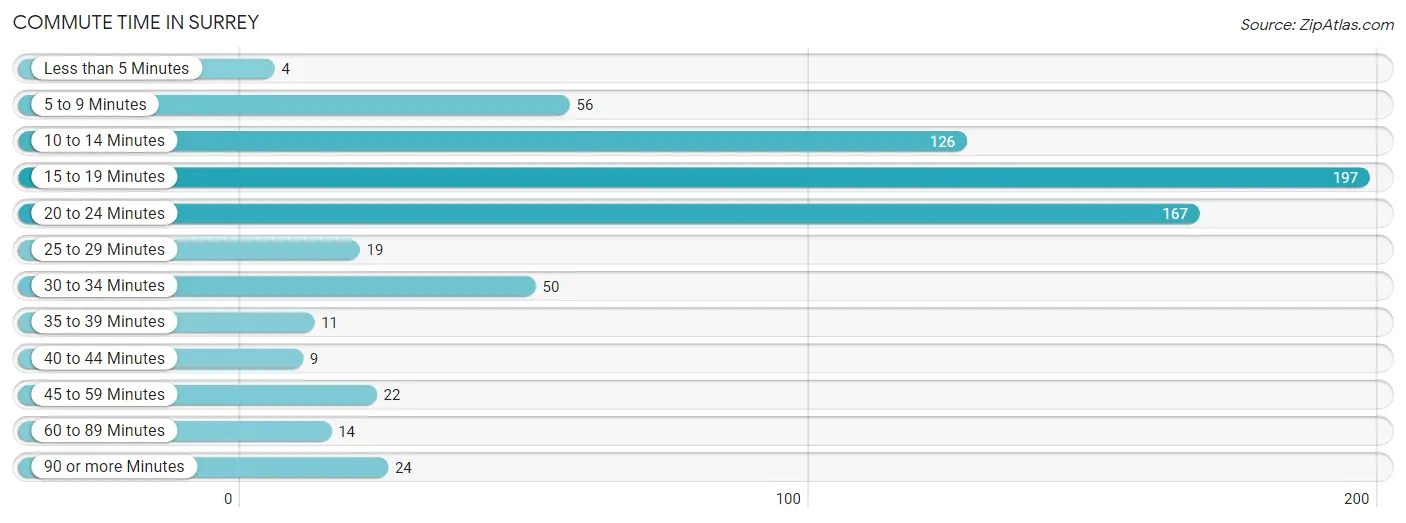
| Commute Time | # Commuters | % Commuters |
| Less than 5 Minutes | 4 | 0.6% |
| 5 to 9 Minutes | 56 | 8.0% |
| 10 to 14 Minutes | 126 | 18.0% |
| 15 to 19 Minutes | 197 | 28.2% |
| 20 to 24 Minutes | 167 | 23.9% |
| 25 to 29 Minutes | 19 | 2.7% |
| 30 to 34 Minutes | 50 | 7.1% |
| 35 to 39 Minutes | 11 | 1.6% |
| 40 to 44 Minutes | 9 | 1.3% |
| 45 to 59 Minutes | 22 | 3.2% |
| 60 to 89 Minutes | 14 | 2.0% |
| 90 or more Minutes | 24 | 3.4% |
Commute Time by Sex in Surrey
The most common commute times in Surrey are 15 to 19 minutes (87 commuters, 27.1%) for males and 15 to 19 minutes (110 commuters, 29.1%) for females.
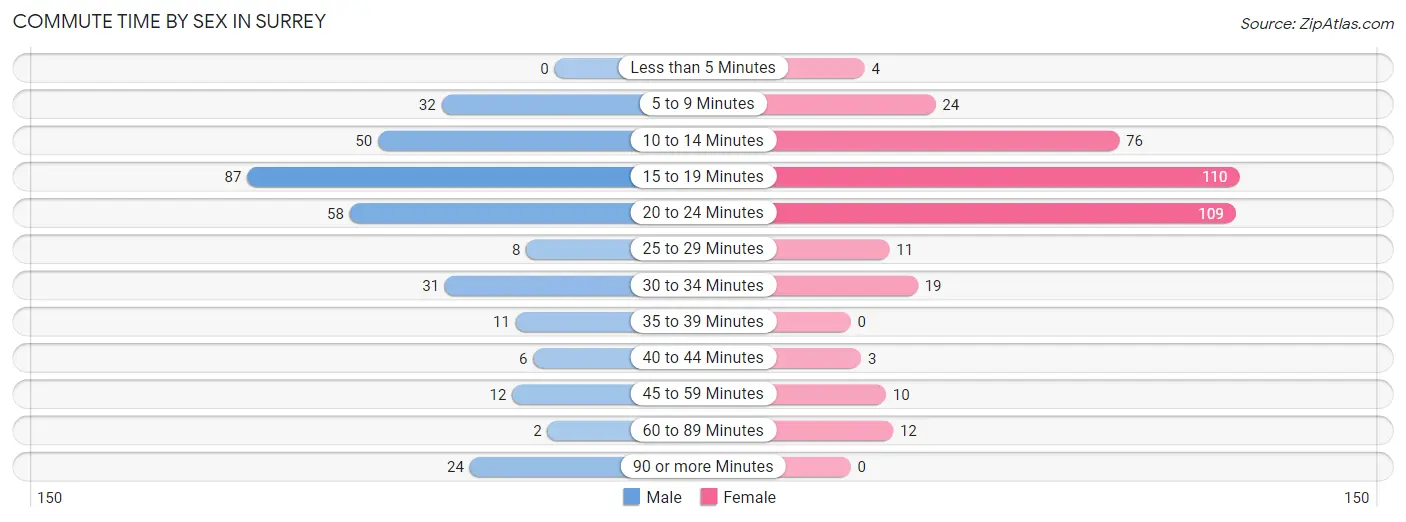
| Commute Time | Male | Female |
| Less than 5 Minutes | 0 (0.0%) | 4 (1.1%) |
| 5 to 9 Minutes | 32 (10.0%) | 24 (6.4%) |
| 10 to 14 Minutes | 50 (15.6%) | 76 (20.1%) |
| 15 to 19 Minutes | 87 (27.1%) | 110 (29.1%) |
| 20 to 24 Minutes | 58 (18.1%) | 109 (28.8%) |
| 25 to 29 Minutes | 8 (2.5%) | 11 (2.9%) |
| 30 to 34 Minutes | 31 (9.7%) | 19 (5.0%) |
| 35 to 39 Minutes | 11 (3.4%) | 0 (0.0%) |
| 40 to 44 Minutes | 6 (1.9%) | 3 (0.8%) |
| 45 to 59 Minutes | 12 (3.7%) | 10 (2.6%) |
| 60 to 89 Minutes | 2 (0.6%) | 12 (3.2%) |
| 90 or more Minutes | 24 (7.5%) | 0 (0.0%) |
Time of Departure to Work by Sex in Surrey
The most frequent times of departure to work in Surrey are 6:30 AM to 6:59 AM (89, 27.7%) for males and 7:00 AM to 7:29 AM (88, 23.3%) for females.
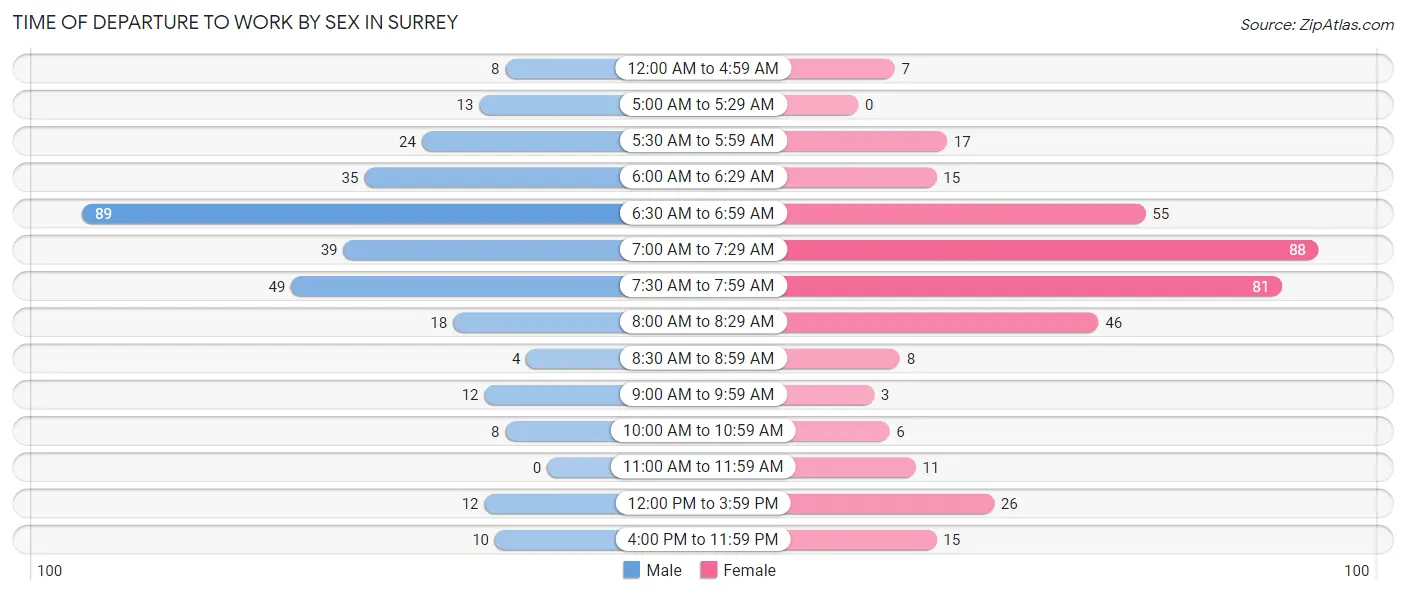
| Time of Departure | Male | Female |
| 12:00 AM to 4:59 AM | 8 (2.5%) | 7 (1.8%) |
| 5:00 AM to 5:29 AM | 13 (4.1%) | 0 (0.0%) |
| 5:30 AM to 5:59 AM | 24 (7.5%) | 17 (4.5%) |
| 6:00 AM to 6:29 AM | 35 (10.9%) | 15 (4.0%) |
| 6:30 AM to 6:59 AM | 89 (27.7%) | 55 (14.5%) |
| 7:00 AM to 7:29 AM | 39 (12.1%) | 88 (23.3%) |
| 7:30 AM to 7:59 AM | 49 (15.3%) | 81 (21.4%) |
| 8:00 AM to 8:29 AM | 18 (5.6%) | 46 (12.2%) |
| 8:30 AM to 8:59 AM | 4 (1.3%) | 8 (2.1%) |
| 9:00 AM to 9:59 AM | 12 (3.7%) | 3 (0.8%) |
| 10:00 AM to 10:59 AM | 8 (2.5%) | 6 (1.6%) |
| 11:00 AM to 11:59 AM | 0 (0.0%) | 11 (2.9%) |
| 12:00 PM to 3:59 PM | 12 (3.7%) | 26 (6.9%) |
| 4:00 PM to 11:59 PM | 10 (3.1%) | 15 (4.0%) |
| Total | 321 (100.0%) | 378 (100.0%) |
Housing Occupancy in Surrey
Occupancy by Ownership in Surrey
Of the total 567 dwellings in Surrey, owner-occupied units account for 548 (96.7%), while renter-occupied units make up 19 (3.4%).
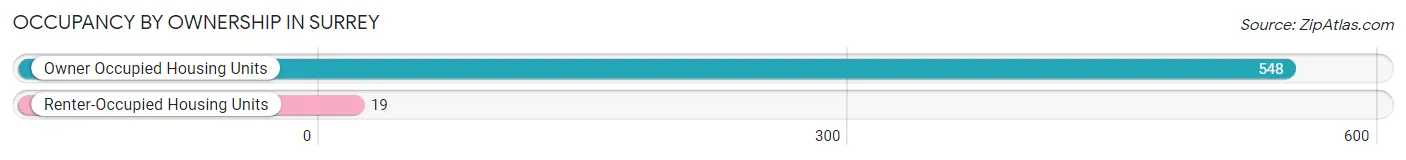
| Occupancy | # Housing Units | % Housing Units |
| Owner Occupied Housing Units | 548 | 96.7% |
| Renter-Occupied Housing Units | 19 | 3.4% |
| Total Occupied Housing Units | 567 | 100.0% |
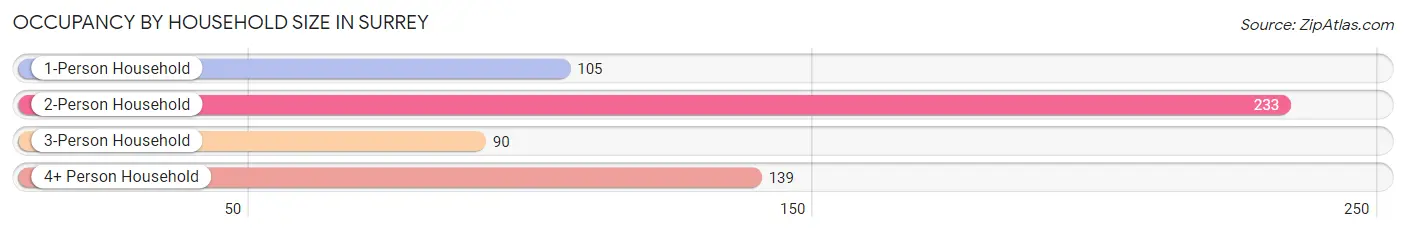
Occupancy by Household Size in Surrey
| Household Size | # Housing Units | % Housing Units |
| 1-Person Household | 105 | 18.5% |
| 2-Person Household | 233 | 41.1% |
| 3-Person Household | 90 | 15.9% |
| 4+ Person Household | 139 | 24.5% |
| Total Housing Units | 567 | 100.0% |
Occupancy by Ownership by Household Size in Surrey
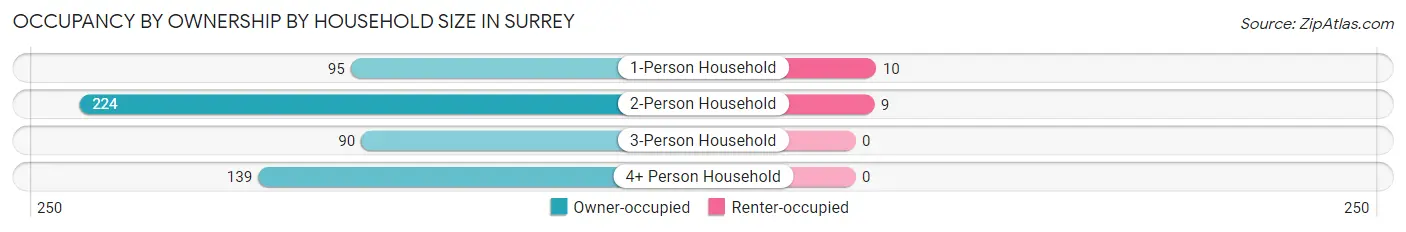
| Household Size | Owner-occupied | Renter-occupied |
| 1-Person Household | 95 (90.5%) | 10 (9.5%) |
| 2-Person Household | 224 (96.1%) | 9 (3.9%) |
| 3-Person Household | 90 (100.0%) | 0 (0.0%) |
| 4+ Person Household | 139 (100.0%) | 0 (0.0%) |
| Total Housing Units | 548 (96.7%) | 19 (3.4%) |
Occupancy by Educational Attainment in Surrey
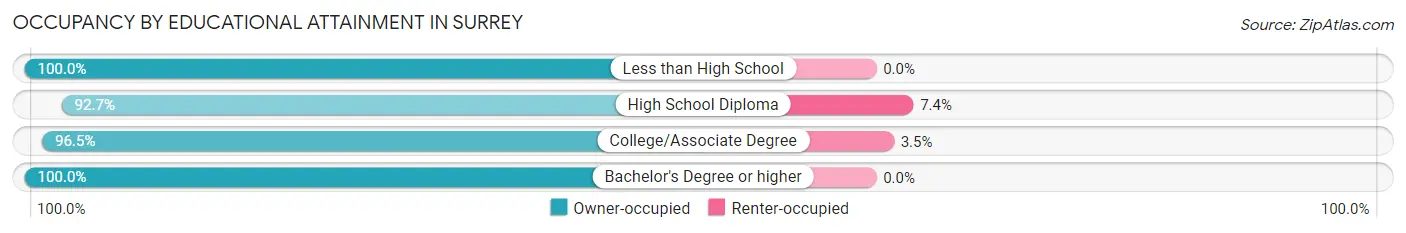
| Household Size | Owner-occupied | Renter-occupied |
| Less than High School | 9 (100.0%) | 0 (0.0%) |
| High School Diploma | 126 (92.6%) | 10 (7.3%) |
| College/Associate Degree | 250 (96.5%) | 9 (3.5%) |
| Bachelor's Degree or higher | 163 (100.0%) | 0 (0.0%) |
Occupancy by Age of Householder in Surrey
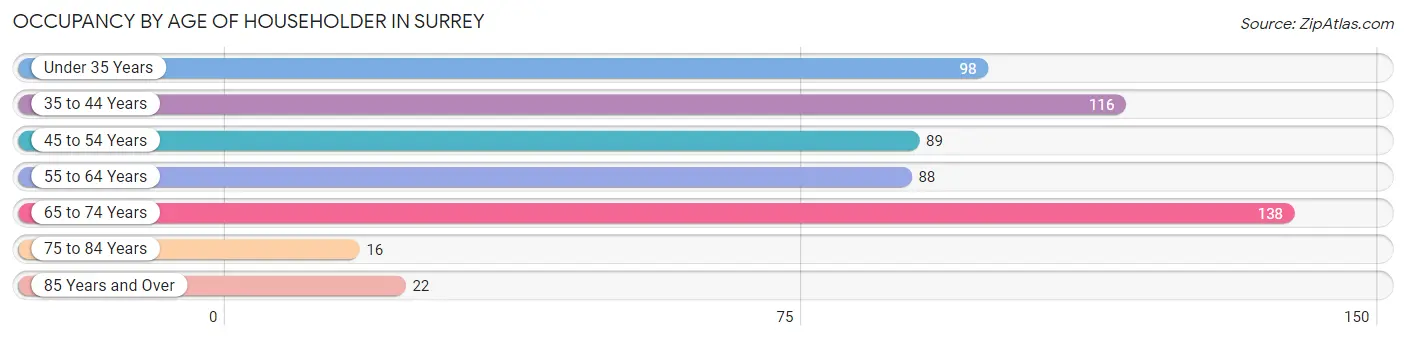
| Age Bracket | # Households | % Households |
| Under 35 Years | 98 | 17.3% |
| 35 to 44 Years | 116 | 20.5% |
| 45 to 54 Years | 89 | 15.7% |
| 55 to 64 Years | 88 | 15.5% |
| 65 to 74 Years | 138 | 24.3% |
| 75 to 84 Years | 16 | 2.8% |
| 85 Years and Over | 22 | 3.9% |
| Total | 567 | 100.0% |
Housing Finances in Surrey
Median Income by Occupancy in Surrey
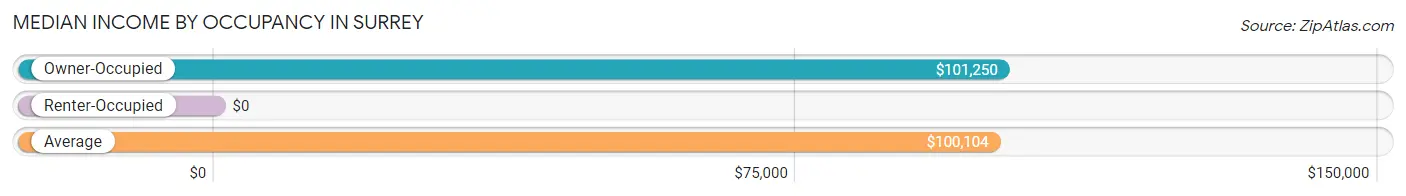
| Occupancy Type | # Households | Median Income |
| Owner-Occupied | 548 (96.7%) | $101,250 |
| Renter-Occupied | 19 (3.4%) | $0 |
| Average | 567 (100.0%) | $100,104 |
Occupancy by Householder Income Bracket in Surrey
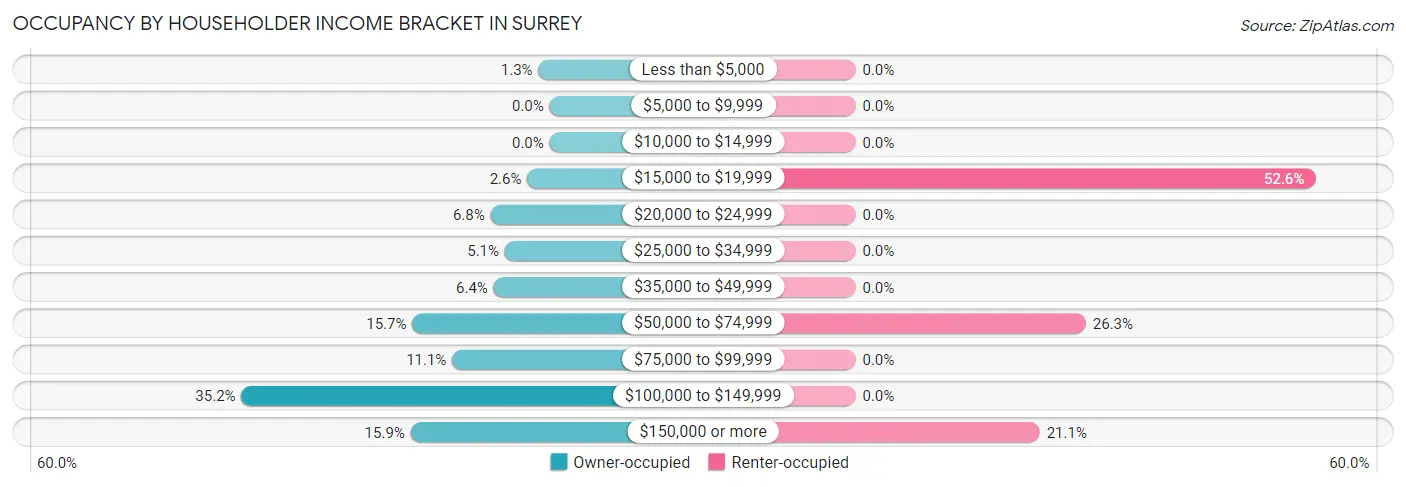
| Income Bracket | Owner-occupied | Renter-occupied |
| Less than $5,000 | 7 (1.3%) | 0 (0.0%) |
| $5,000 to $9,999 | 0 (0.0%) | 0 (0.0%) |
| $10,000 to $14,999 | 0 (0.0%) | 0 (0.0%) |
| $15,000 to $19,999 | 14 (2.5%) | 10 (52.6%) |
| $20,000 to $24,999 | 37 (6.8%) | 0 (0.0%) |
| $25,000 to $34,999 | 28 (5.1%) | 0 (0.0%) |
| $35,000 to $49,999 | 35 (6.4%) | 0 (0.0%) |
| $50,000 to $74,999 | 86 (15.7%) | 5 (26.3%) |
| $75,000 to $99,999 | 61 (11.1%) | 0 (0.0%) |
| $100,000 to $149,999 | 193 (35.2%) | 0 (0.0%) |
| $150,000 or more | 87 (15.9%) | 4 (21.0%) |
| Total | 548 (100.0%) | 19 (100.0%) |
Monthly Housing Cost Tiers in Surrey
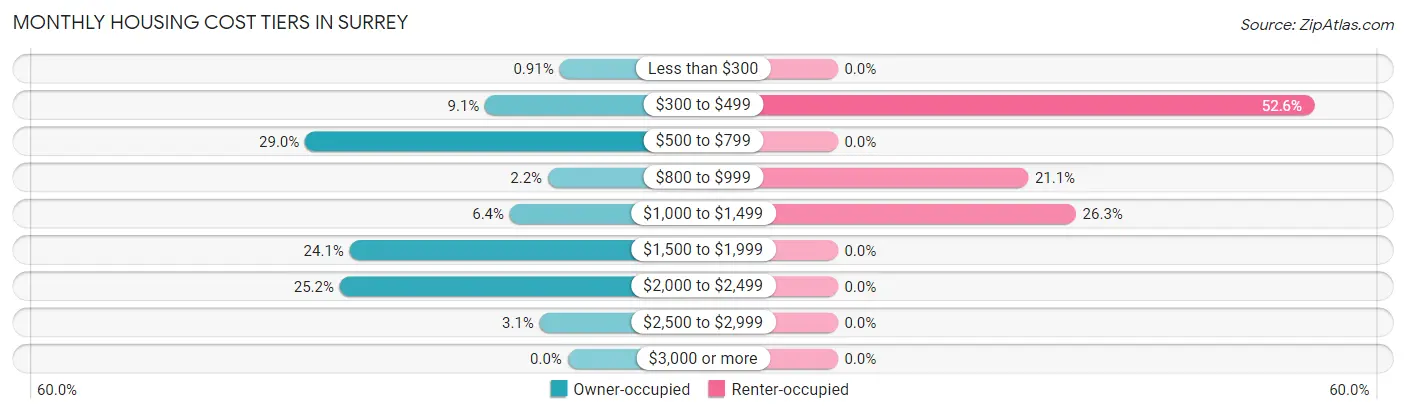
| Monthly Cost | Owner-occupied | Renter-occupied |
| Less than $300 | 5 (0.9%) | 0 (0.0%) |
| $300 to $499 | 50 (9.1%) | 10 (52.6%) |
| $500 to $799 | 159 (29.0%) | 0 (0.0%) |
| $800 to $999 | 12 (2.2%) | 4 (21.0%) |
| $1,000 to $1,499 | 35 (6.4%) | 5 (26.3%) |
| $1,500 to $1,999 | 132 (24.1%) | 0 (0.0%) |
| $2,000 to $2,499 | 138 (25.2%) | 0 (0.0%) |
| $2,500 to $2,999 | 17 (3.1%) | 0 (0.0%) |
| $3,000 or more | 0 (0.0%) | 0 (0.0%) |
| Total | 548 (100.0%) | 19 (100.0%) |
Physical Housing Characteristics in Surrey
Housing Structures in Surrey
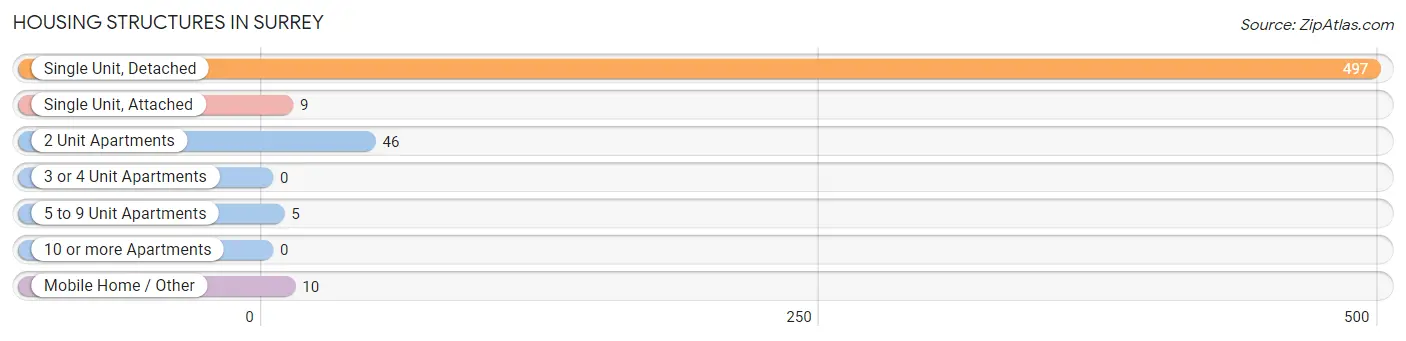
| Structure Type | # Housing Units | % Housing Units |
| Single Unit, Detached | 497 | 87.6% |
| Single Unit, Attached | 9 | 1.6% |
| 2 Unit Apartments | 46 | 8.1% |
| 3 or 4 Unit Apartments | 0 | 0.0% |
| 5 to 9 Unit Apartments | 5 | 0.9% |
| 10 or more Apartments | 0 | 0.0% |
| Mobile Home / Other | 10 | 1.8% |
| Total | 567 | 100.0% |
Housing Structures by Occupancy in Surrey
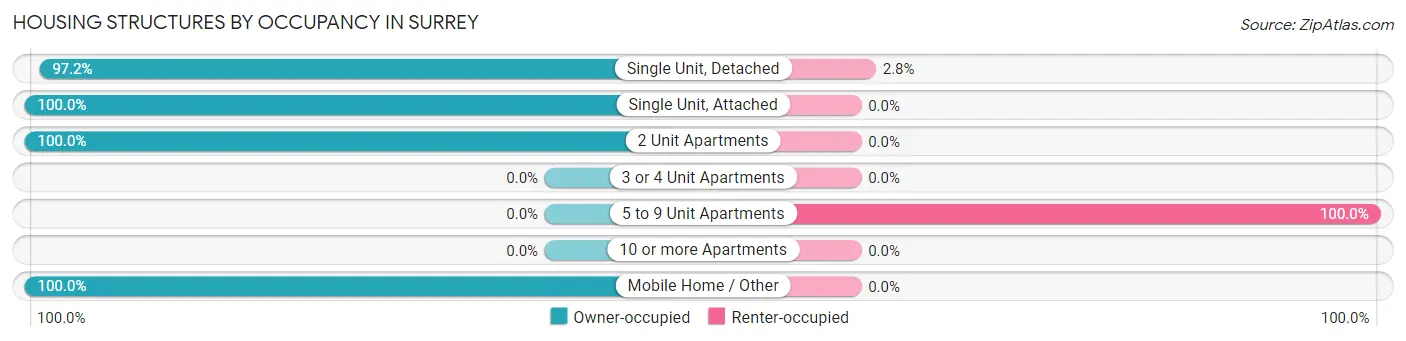
| Structure Type | Owner-occupied | Renter-occupied |
| Single Unit, Detached | 483 (97.2%) | 14 (2.8%) |
| Single Unit, Attached | 9 (100.0%) | 0 (0.0%) |
| 2 Unit Apartments | 46 (100.0%) | 0 (0.0%) |
| 3 or 4 Unit Apartments | 0 (0.0%) | 0 (0.0%) |
| 5 to 9 Unit Apartments | 0 (0.0%) | 5 (100.0%) |
| 10 or more Apartments | 0 (0.0%) | 0 (0.0%) |
| Mobile Home / Other | 10 (100.0%) | 0 (0.0%) |
| Total | 548 (96.7%) | 19 (3.4%) |
Housing Structures by Number of Rooms in Surrey
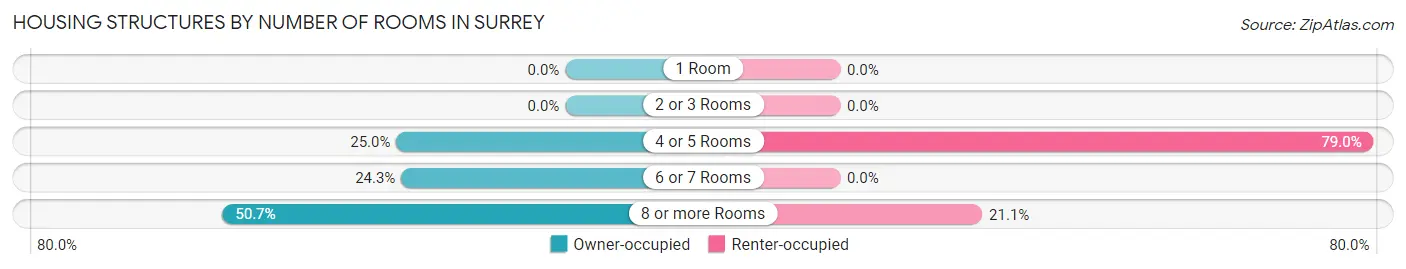
| Number of Rooms | Owner-occupied | Renter-occupied |
| 1 Room | 0 (0.0%) | 0 (0.0%) |
| 2 or 3 Rooms | 0 (0.0%) | 0 (0.0%) |
| 4 or 5 Rooms | 137 (25.0%) | 15 (78.9%) |
| 6 or 7 Rooms | 133 (24.3%) | 0 (0.0%) |
| 8 or more Rooms | 278 (50.7%) | 4 (21.0%) |
| Total | 548 (100.0%) | 19 (100.0%) |
Housing Structure by Heating Type in Surrey
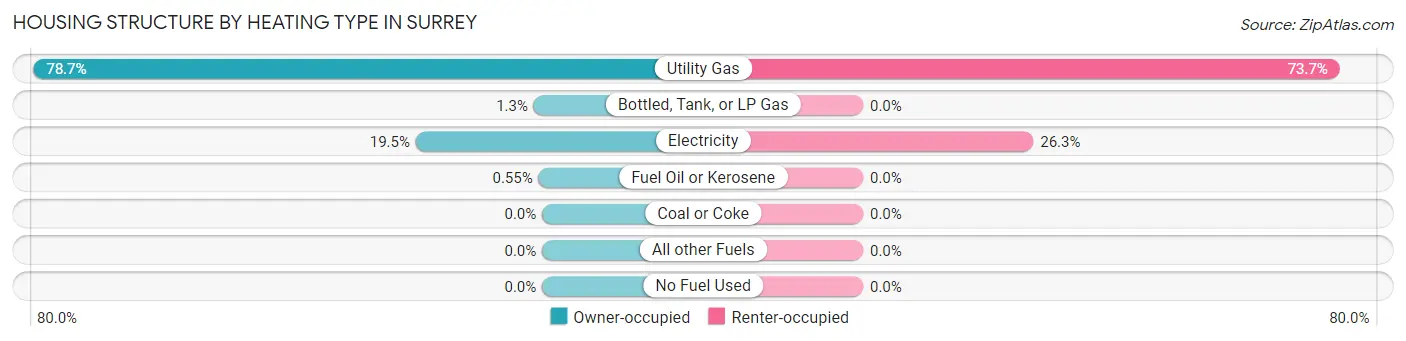
| Heating Type | Owner-occupied | Renter-occupied |
| Utility Gas | 431 (78.6%) | 14 (73.7%) |
| Bottled, Tank, or LP Gas | 7 (1.3%) | 0 (0.0%) |
| Electricity | 107 (19.5%) | 5 (26.3%) |
| Fuel Oil or Kerosene | 3 (0.5%) | 0 (0.0%) |
| Coal or Coke | 0 (0.0%) | 0 (0.0%) |
| All other Fuels | 0 (0.0%) | 0 (0.0%) |
| No Fuel Used | 0 (0.0%) | 0 (0.0%) |
| Total | 548 (100.0%) | 19 (100.0%) |
Household Vehicle Usage in Surrey
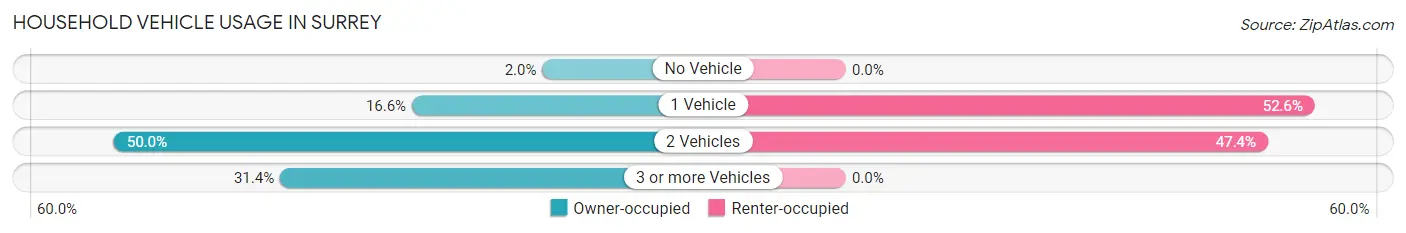
| Vehicles per Household | Owner-occupied | Renter-occupied |
| No Vehicle | 11 (2.0%) | 0 (0.0%) |
| 1 Vehicle | 91 (16.6%) | 10 (52.6%) |
| 2 Vehicles | 274 (50.0%) | 9 (47.4%) |
| 3 or more Vehicles | 172 (31.4%) | 0 (0.0%) |
| Total | 548 (100.0%) | 19 (100.0%) |
Real Estate & Mortgages in Surrey
Real Estate and Mortgage Overview in Surrey
| Characteristic | Without Mortgage | With Mortgage |
| Housing Units | 223 | 325 |
| Median Property Value | $254,600 | $306,200 |
| Median Household Income | $86,420 | $67 |
| Monthly Housing Costs | $581 | $0 |
| Real Estate Taxes | $2,767 | $9 |
Property Value by Mortgage Status in Surrey
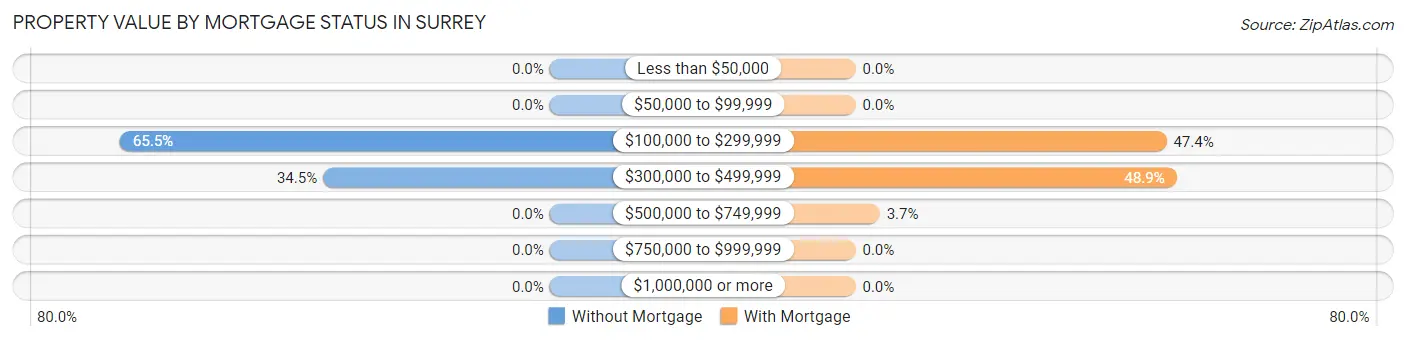
| Property Value | Without Mortgage | With Mortgage |
| Less than $50,000 | 0 (0.0%) | 0 (0.0%) |
| $50,000 to $99,999 | 0 (0.0%) | 0 (0.0%) |
| $100,000 to $299,999 | 146 (65.5%) | 154 (47.4%) |
| $300,000 to $499,999 | 77 (34.5%) | 159 (48.9%) |
| $500,000 to $749,999 | 0 (0.0%) | 12 (3.7%) |
| $750,000 to $999,999 | 0 (0.0%) | 0 (0.0%) |
| $1,000,000 or more | 0 (0.0%) | 0 (0.0%) |
| Total | 223 (100.0%) | 325 (100.0%) |
Household Income by Mortgage Status in Surrey
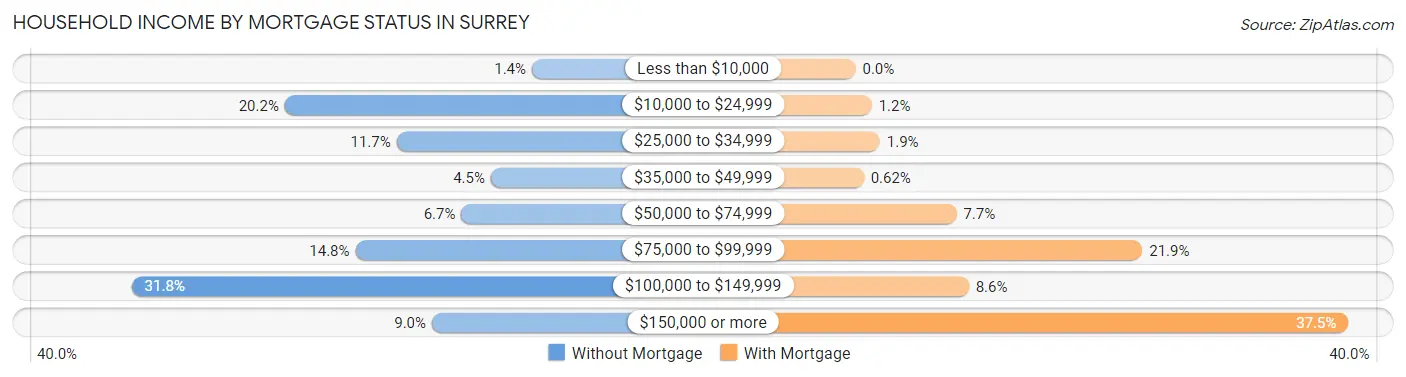
| Household Income | Without Mortgage | With Mortgage |
| Less than $10,000 | 3 (1.3%) | 0 (0.0%) |
| $10,000 to $24,999 | 45 (20.2%) | 4 (1.2%) |
| $25,000 to $34,999 | 26 (11.7%) | 6 (1.8%) |
| $35,000 to $49,999 | 10 (4.5%) | 2 (0.6%) |
| $50,000 to $74,999 | 15 (6.7%) | 25 (7.7%) |
| $75,000 to $99,999 | 33 (14.8%) | 71 (21.8%) |
| $100,000 to $149,999 | 71 (31.8%) | 28 (8.6%) |
| $150,000 or more | 20 (9.0%) | 122 (37.5%) |
| Total | 223 (100.0%) | 325 (100.0%) |
Property Value to Household Income Ratio in Surrey
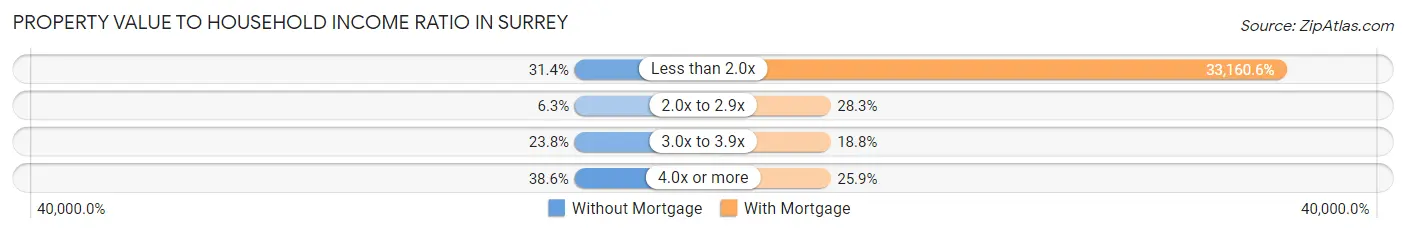
| Value-to-Income Ratio | Without Mortgage | With Mortgage |
| Less than 2.0x | 70 (31.4%) | 107,772 (33,160.6%) |
| 2.0x to 2.9x | 14 (6.3%) | 92 (28.3%) |
| 3.0x to 3.9x | 53 (23.8%) | 61 (18.8%) |
| 4.0x or more | 86 (38.6%) | 84 (25.9%) |
| Total | 223 (100.0%) | 325 (100.0%) |
Real Estate Taxes by Mortgage Status in Surrey
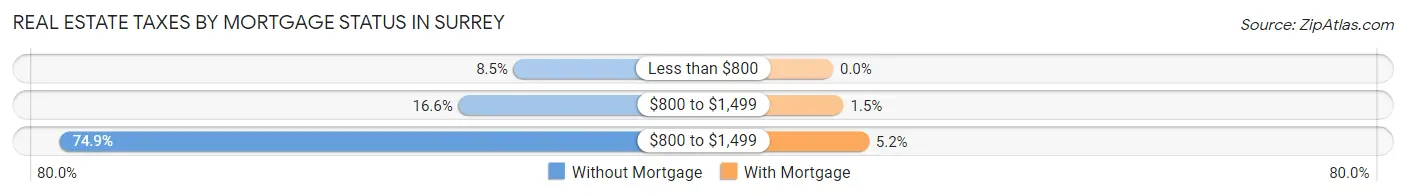
| Property Taxes | Without Mortgage | With Mortgage |
| Less than $800 | 19 (8.5%) | 0 (0.0%) |
| $800 to $1,499 | 37 (16.6%) | 5 (1.5%) |
| $800 to $1,499 | 167 (74.9%) | 17 (5.2%) |
| Total | 223 (100.0%) | 325 (100.0%) |
Health & Disability in Surrey
Health Insurance Coverage by Age in Surrey
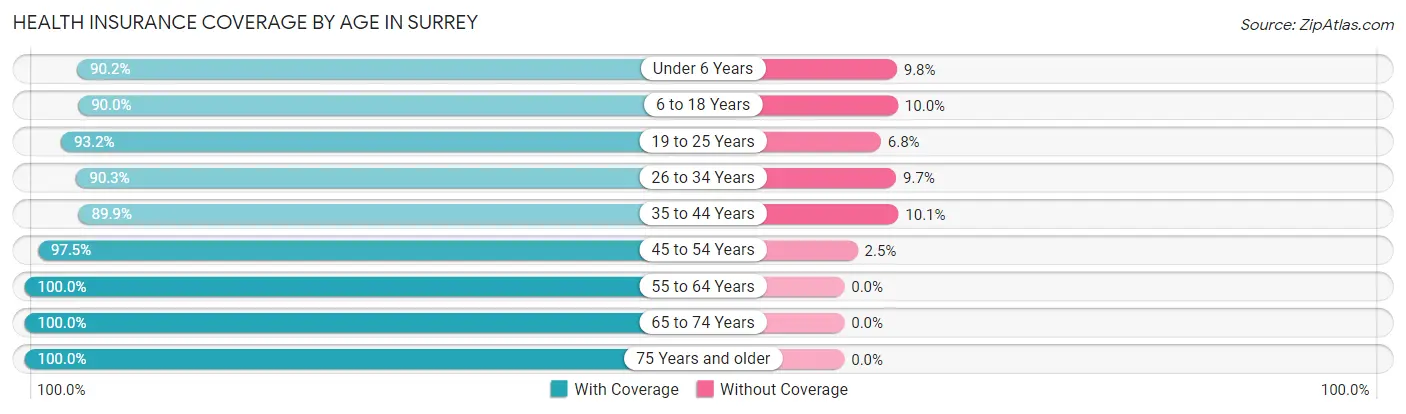
| Age Bracket | With Coverage | Without Coverage |
| Under 6 Years | 258 (90.2%) | 28 (9.8%) |
| 6 to 18 Years | 243 (90.0%) | 27 (10.0%) |
| 19 to 25 Years | 41 (93.2%) | 3 (6.8%) |
| 26 to 34 Years | 131 (90.3%) | 14 (9.7%) |
| 35 to 44 Years | 214 (89.9%) | 24 (10.1%) |
| 45 to 54 Years | 157 (97.5%) | 4 (2.5%) |
| 55 to 64 Years | 201 (100.0%) | 0 (0.0%) |
| 65 to 74 Years | 187 (100.0%) | 0 (0.0%) |
| 75 Years and older | 38 (100.0%) | 0 (0.0%) |
| Total | 1,470 (93.6%) | 100 (6.4%) |
Health Insurance Coverage by Citizenship Status in Surrey
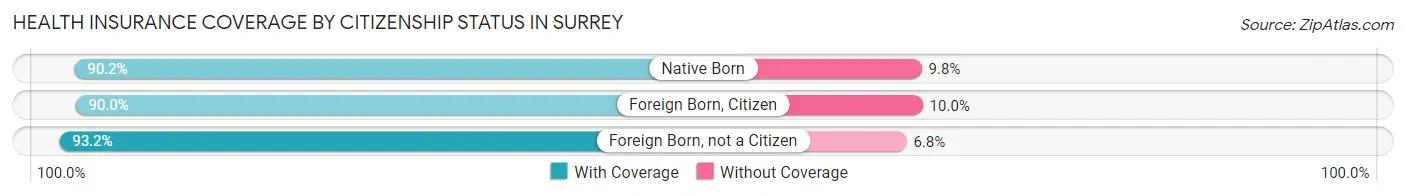
| Citizenship Status | With Coverage | Without Coverage |
| Native Born | 258 (90.2%) | 28 (9.8%) |
| Foreign Born, Citizen | 243 (90.0%) | 27 (10.0%) |
| Foreign Born, not a Citizen | 41 (93.2%) | 3 (6.8%) |
Health Insurance Coverage by Household Income in Surrey
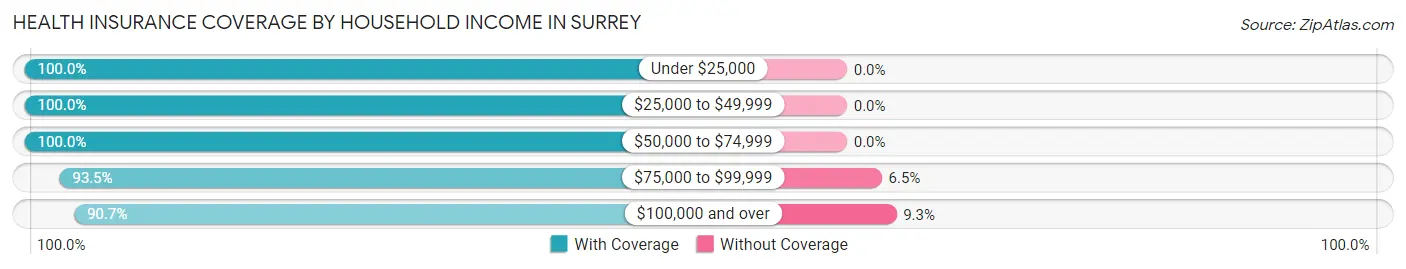
| Household Income | With Coverage | Without Coverage |
| Under $25,000 | 86 (100.0%) | 0 (0.0%) |
| $25,000 to $49,999 | 106 (100.0%) | 0 (0.0%) |
| $50,000 to $74,999 | 244 (100.0%) | 0 (0.0%) |
| $75,000 to $99,999 | 172 (93.5%) | 12 (6.5%) |
| $100,000 and over | 862 (90.7%) | 88 (9.3%) |
Public vs Private Health Insurance Coverage by Age in Surrey
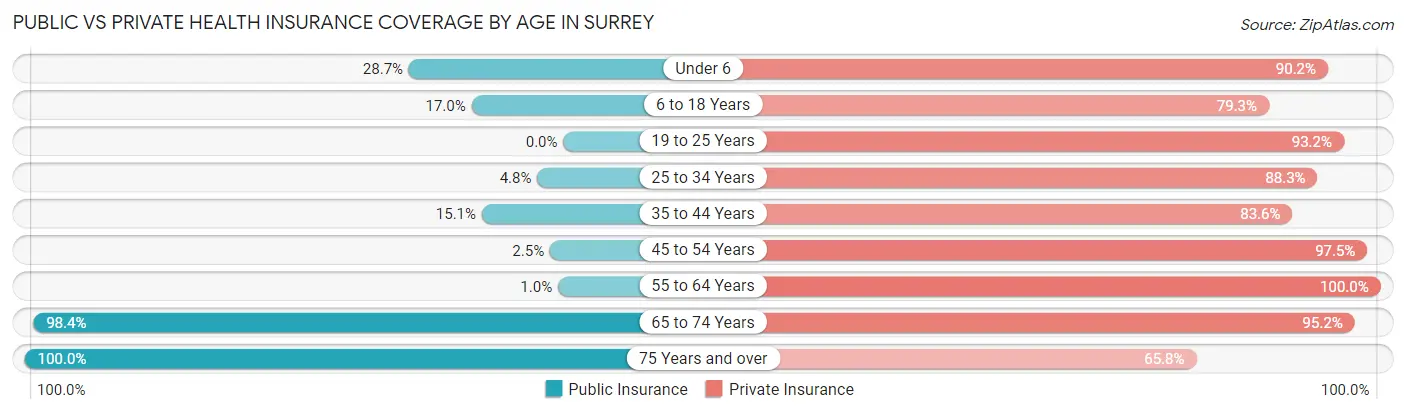
| Age Bracket | Public Insurance | Private Insurance |
| Under 6 | 82 (28.7%) | 258 (90.2%) |
| 6 to 18 Years | 46 (17.0%) | 214 (79.3%) |
| 19 to 25 Years | 0 (0.0%) | 41 (93.2%) |
| 25 to 34 Years | 7 (4.8%) | 128 (88.3%) |
| 35 to 44 Years | 36 (15.1%) | 199 (83.6%) |
| 45 to 54 Years | 4 (2.5%) | 157 (97.5%) |
| 55 to 64 Years | 2 (1.0%) | 201 (100.0%) |
| 65 to 74 Years | 184 (98.4%) | 178 (95.2%) |
| 75 Years and over | 38 (100.0%) | 25 (65.8%) |
| Total | 399 (25.4%) | 1,401 (89.2%) |
Disability Status by Sex by Age in Surrey
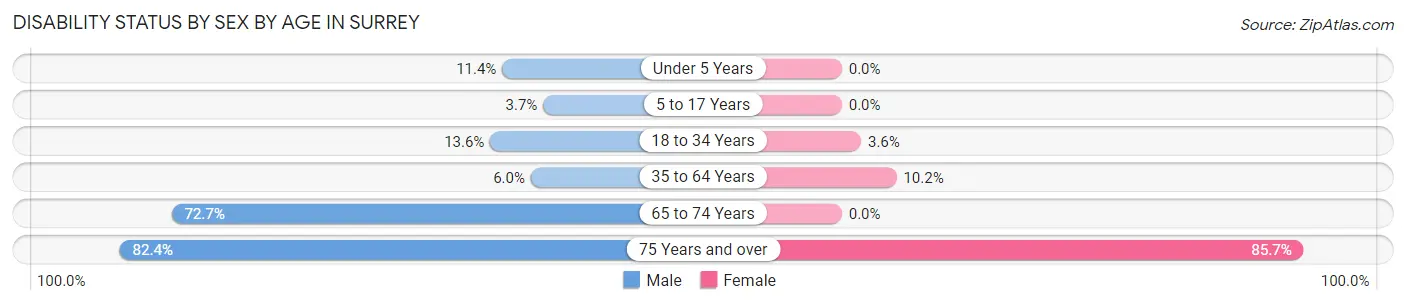
| Age Bracket | Male | Female |
| Under 5 Years | 16 (11.4%) | 0 (0.0%) |
| 5 to 17 Years | 7 (3.7%) | 0 (0.0%) |
| 18 to 34 Years | 11 (13.6%) | 4 (3.6%) |
| 35 to 64 Years | 16 (6.0%) | 34 (10.2%) |
| 65 to 74 Years | 72 (72.7%) | 0 (0.0%) |
| 75 Years and over | 14 (82.4%) | 18 (85.7%) |
Disability Class by Sex by Age in Surrey
Disability Class: Hearing Difficulty
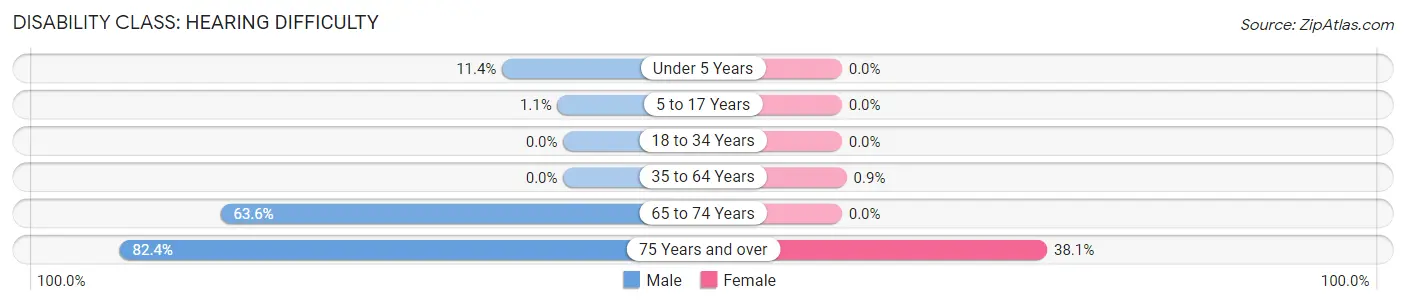
| Age Bracket | Male | Female |
| Under 5 Years | 16 (11.4%) | 0 (0.0%) |
| 5 to 17 Years | 2 (1.1%) | 0 (0.0%) |
| 18 to 34 Years | 0 (0.0%) | 0 (0.0%) |
| 35 to 64 Years | 0 (0.0%) | 3 (0.9%) |
| 65 to 74 Years | 63 (63.6%) | 0 (0.0%) |
| 75 Years and over | 14 (82.4%) | 8 (38.1%) |
Disability Class: Vision Difficulty
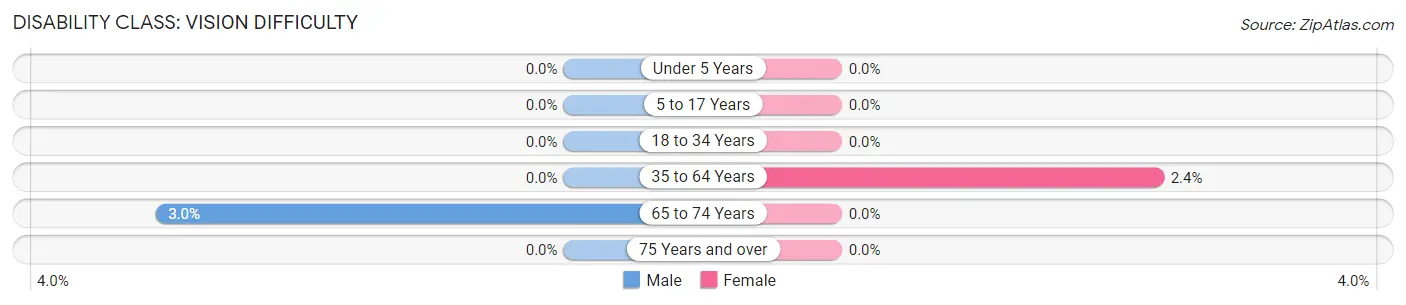
| Age Bracket | Male | Female |
| Under 5 Years | 0 (0.0%) | 0 (0.0%) |
| 5 to 17 Years | 0 (0.0%) | 0 (0.0%) |
| 18 to 34 Years | 0 (0.0%) | 0 (0.0%) |
| 35 to 64 Years | 0 (0.0%) | 8 (2.4%) |
| 65 to 74 Years | 3 (3.0%) | 0 (0.0%) |
| 75 Years and over | 0 (0.0%) | 0 (0.0%) |
Disability Class: Cognitive Difficulty
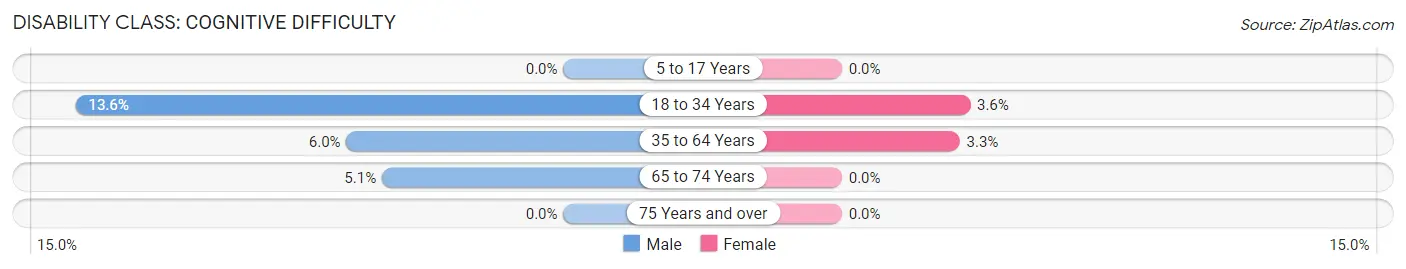
| Age Bracket | Male | Female |
| 5 to 17 Years | 0 (0.0%) | 0 (0.0%) |
| 18 to 34 Years | 11 (13.6%) | 4 (3.6%) |
| 35 to 64 Years | 16 (6.0%) | 11 (3.3%) |
| 65 to 74 Years | 5 (5.1%) | 0 (0.0%) |
| 75 Years and over | 0 (0.0%) | 0 (0.0%) |
Disability Class: Ambulatory Difficulty
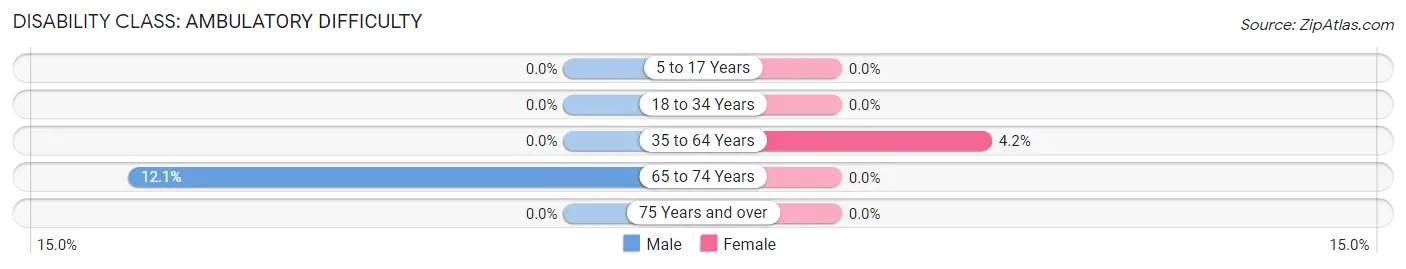
| Age Bracket | Male | Female |
| 5 to 17 Years | 0 (0.0%) | 0 (0.0%) |
| 18 to 34 Years | 0 (0.0%) | 0 (0.0%) |
| 35 to 64 Years | 0 (0.0%) | 14 (4.2%) |
| 65 to 74 Years | 12 (12.1%) | 0 (0.0%) |
| 75 Years and over | 0 (0.0%) | 0 (0.0%) |
Disability Class: Self-Care Difficulty
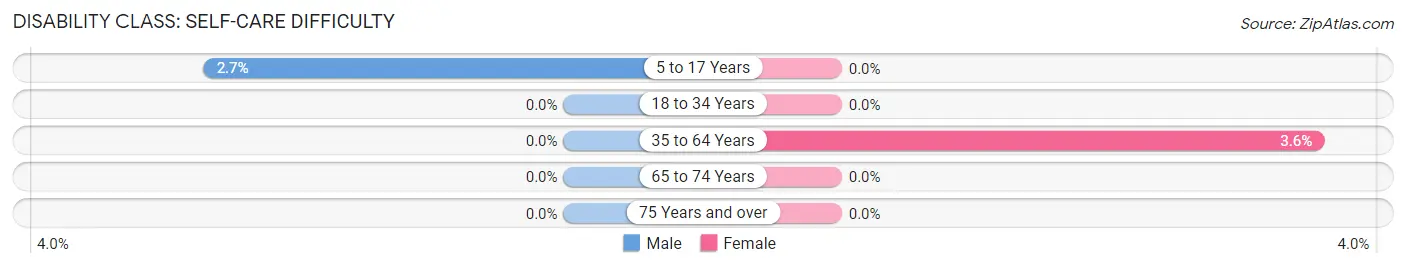
| Age Bracket | Male | Female |
| 5 to 17 Years | 5 (2.7%) | 0 (0.0%) |
| 18 to 34 Years | 0 (0.0%) | 0 (0.0%) |
| 35 to 64 Years | 0 (0.0%) | 12 (3.6%) |
| 65 to 74 Years | 0 (0.0%) | 0 (0.0%) |
| 75 Years and over | 0 (0.0%) | 0 (0.0%) |
Technology Access in Surrey
Computing Device Access in Surrey
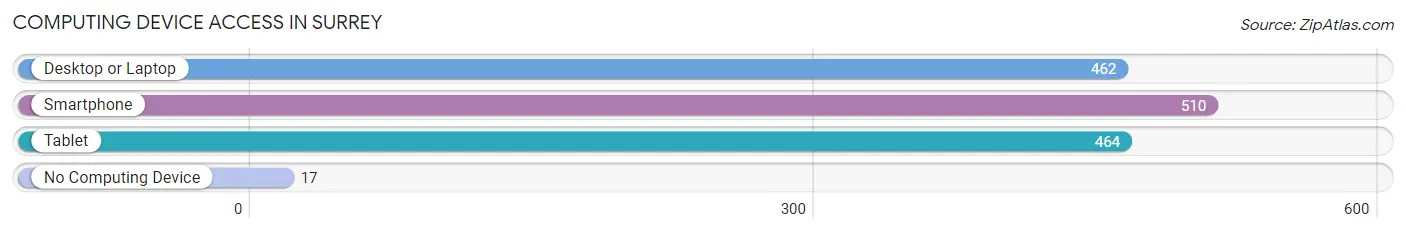
| Device Type | # Households | % Households |
| Desktop or Laptop | 462 | 81.5% |
| Smartphone | 510 | 89.9% |
| Tablet | 464 | 81.8% |
| No Computing Device | 17 | 3.0% |
| Total | 567 | 100.0% |
Internet Access in Surrey
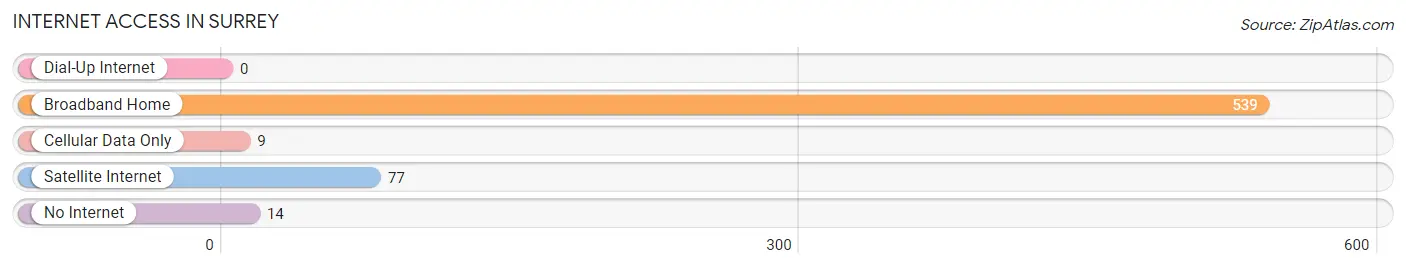
| Internet Type | # Households | % Households |
| Dial-Up Internet | 0 | 0.0% |
| Broadband Home | 539 | 95.1% |
| Cellular Data Only | 9 | 1.6% |
| Satellite Internet | 77 | 13.6% |
| No Internet | 14 | 2.5% |
| Total | 567 | 100.0% |
Surrey Summary
Surrey is a city located in the Canadian province of British Columbia. It is the second-largest city in the province and the largest suburb of Vancouver. It is located south of the Fraser River and is part of the Metro Vancouver area. The city has a population of approximately 517,887 as of the 2016 census, making it the 12th largest city in Canada.
Geography
Surrey is located in the southwestern corner of British Columbia, on the Fraser River delta. It is bordered by the cities of Langley to the east, Delta to the south, and White Rock to the west. The city is situated on a flat plain, with the North Shore Mountains to the north and the Coast Mountains to the south. The city is divided into six distinct neighbourhoods: Cloverdale, Fleetwood, Guildford, Newton, South Surrey, and Whalley.
Climate
Surrey has a temperate climate, with warm summers and mild winters. The average temperature in the summer is around 20°C (68°F), while in the winter it is around 4°C (39°F). The city receives an average of 1,200 mm (47 in) of precipitation annually, with most of it falling in the winter months.
Economy
Surrey is a major economic centre in the Lower Mainland region of British Columbia. The city is home to a number of large businesses, including the headquarters of Telus, Coast Capital Savings, and the Canadian headquarters of Walmart. The city is also home to a number of industrial parks, which are home to a variety of manufacturing and technology companies.
The city is also home to a number of shopping centres, including Guildford Town Centre, Central City Shopping Centre, and Surrey Place Mall. The city is also home to a number of cultural attractions, including the Surrey Art Gallery, the Surrey Museum, and the Surrey Arts Centre.
Demographics
As of the 2016 census, the population of Surrey was 517,887, making it the 12th largest city in Canada. The city has a diverse population, with the largest ethnic groups being South Asian (37.2%), Chinese (19.2%), and European (17.3%). The city also has a large immigrant population, with over 40% of the population being foreign-born.
The city has a median age of 37.7, with the largest age group being 25-44 (30.2%). The city also has a higher-than-average rate of post-secondary education, with over 40% of the population having a university degree or higher.
Conclusion
Surrey is a major economic centre in the Lower Mainland region of British Columbia. The city has a diverse population, with the largest ethnic groups being South Asian, Chinese, and European. The city also has a large immigrant population, with over 40% of the population being foreign-born. The city has a temperate climate, with warm summers and mild winters. The city is home to a number of large businesses, industrial parks, and shopping centres. It is also home to a number of cultural attractions, making it an attractive destination for tourists and residents alike.
Common Questions
What is Per Capita Income in Surrey?
Per Capita income in Surrey is $38,357.
What is the Median Family Income in Surrey?
Median Family Income in Surrey is $107,448.
What is the Median Household income in Surrey?
Median Household Income in Surrey is $100,104.
What is Income or Wage Gap in Surrey?
Income or Wage Gap in Surrey is 29.1%.
Women in Surrey earn 70.9 cents for every dollar earned by a man.
What is Inequality or Gini Index in Surrey?
Inequality or Gini Index in Surrey is 0.38.
What is the Total Population of Surrey?
Total Population of Surrey is 1,583.
What is the Total Male Population of Surrey?
Total Male Population of Surrey is 803.
What is the Total Female Population of Surrey?
Total Female Population of Surrey is 780.
What is the Ratio of Males per 100 Females in Surrey?
There are 102.95 Males per 100 Females in Surrey.
What is the Ratio of Females per 100 Males in Surrey?
There are 97.14 Females per 100 Males in Surrey.
What is the Median Population Age in Surrey?
Median Population Age in Surrey is 36.1 Years.
What is the Average Family Size in Surrey
Average Family Size in Surrey is 3.1 People.
What is the Average Household Size in Surrey
Average Household Size in Surrey is 2.8 People.
How Large is the Labor Force in Surrey?
There are 771 People in the Labor Forcein in Surrey.
What is the Percentage of People in the Labor Force in Surrey?
72.8% of People are in the Labor Force in Surrey.
What is the Unemployment Rate in Surrey?
Unemployment Rate in Surrey is 3.8%.