Pembina, ND Map & Demographics
Pembina Map
Pembina Overview
$37,716
PER CAPITA INCOME
$105,750
AVG FAMILY INCOME
$85,795
AVG HOUSEHOLD INCOME
58.8%
WAGE / INCOME GAP [ % ]
41.2¢/ $1
WAGE / INCOME GAP [ $ ]
0.39
INEQUALITY / GINI INDEX
552
TOTAL POPULATION
290
MALE POPULATION
262
FEMALE POPULATION
110.69
MALES / 100 FEMALES
90.34
FEMALES / 100 MALES
39.8
MEDIAN AGE
3.4
AVG FAMILY SIZE
2.6
AVG HOUSEHOLD SIZE
265
LABOR FORCE [ PEOPLE ]
60.8%
PERCENT IN LABOR FORCE
4.9%
UNEMPLOYMENT RATE
Pembina Zip Codes
Pembina Area Codes
Income in Pembina
Income Overview in Pembina
Per Capita Income in Pembina is $37,716, while median incomes of families and households are $105,750 and $85,795 respectively.
| Characteristic | Number | Measure |
| Per Capita Income | 552 | $37,716 |
| Median Family Income | 143 | $105,750 |
| Mean Family Income | 143 | $119,135 |
| Median Household Income | 209 | $85,795 |
| Mean Household Income | 209 | $97,042 |
| Income Deficit | 143 | $0 |
| Wage / Income Gap (%) | 552 | 58.79% |
| Wage / Income Gap ($) | 552 | 41.21¢ per $1 |
| Gini / Inequality Index | 552 | 0.39 |
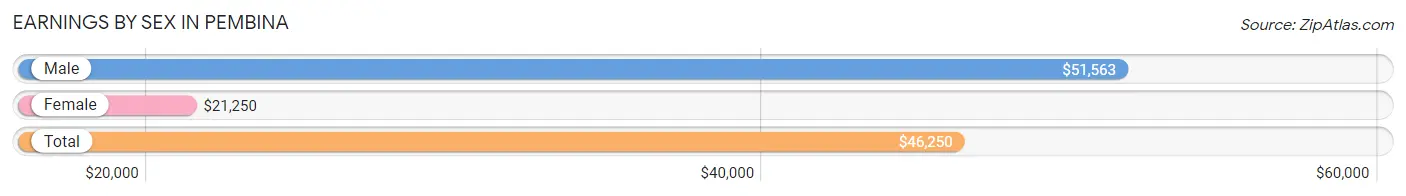
Earnings by Sex in Pembina
Average Earnings in Pembina are $46,250, $51,563 for men and $21,250 for women, a difference of 58.8%.
| Sex | Number | Average Earnings |
| Male | 193 (61.9%) | $51,563 |
| Female | 119 (38.1%) | $21,250 |
| Total | 312 (100.0%) | $46,250 |
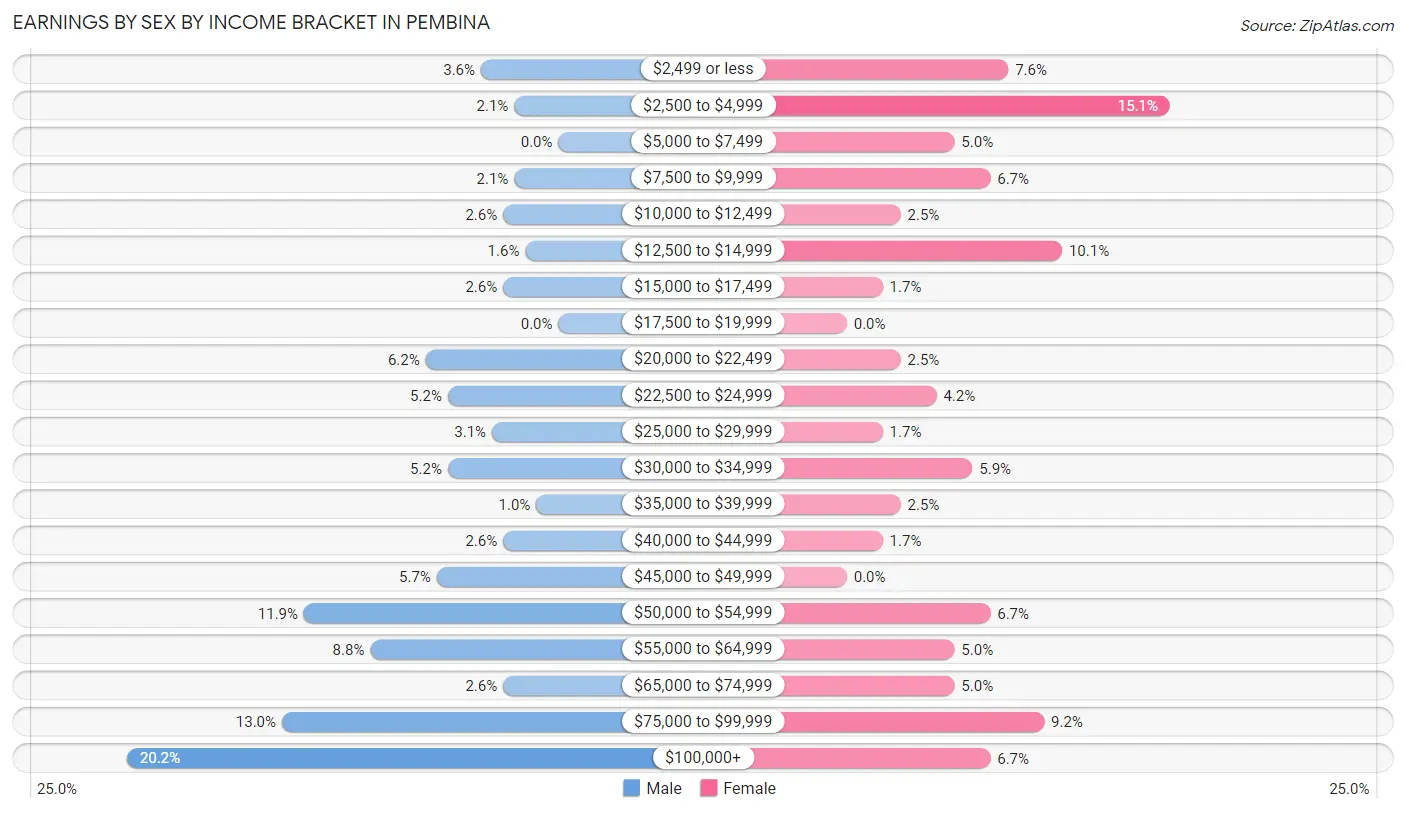
Earnings by Sex by Income Bracket in Pembina
The most common earnings brackets in Pembina are $100,000+ for men (39 | 20.2%) and $2,500 to $4,999 for women (18 | 15.1%).
| Income | Male | Female |
| $2,499 or less | 7 (3.6%) | 9 (7.6%) |
| $2,500 to $4,999 | 4 (2.1%) | 18 (15.1%) |
| $5,000 to $7,499 | 0 (0.0%) | 6 (5.0%) |
| $7,500 to $9,999 | 4 (2.1%) | 8 (6.7%) |
| $10,000 to $12,499 | 5 (2.6%) | 3 (2.5%) |
| $12,500 to $14,999 | 3 (1.5%) | 12 (10.1%) |
| $15,000 to $17,499 | 5 (2.6%) | 2 (1.7%) |
| $17,500 to $19,999 | 0 (0.0%) | 0 (0.0%) |
| $20,000 to $22,499 | 12 (6.2%) | 3 (2.5%) |
| $22,500 to $24,999 | 10 (5.2%) | 5 (4.2%) |
| $25,000 to $29,999 | 6 (3.1%) | 2 (1.7%) |
| $30,000 to $34,999 | 10 (5.2%) | 7 (5.9%) |
| $35,000 to $39,999 | 2 (1.0%) | 3 (2.5%) |
| $40,000 to $44,999 | 5 (2.6%) | 2 (1.7%) |
| $45,000 to $49,999 | 11 (5.7%) | 0 (0.0%) |
| $50,000 to $54,999 | 23 (11.9%) | 8 (6.7%) |
| $55,000 to $64,999 | 17 (8.8%) | 6 (5.0%) |
| $65,000 to $74,999 | 5 (2.6%) | 6 (5.0%) |
| $75,000 to $99,999 | 25 (13.0%) | 11 (9.2%) |
| $100,000+ | 39 (20.2%) | 8 (6.7%) |
| Total | 193 (100.0%) | 119 (100.0%) |
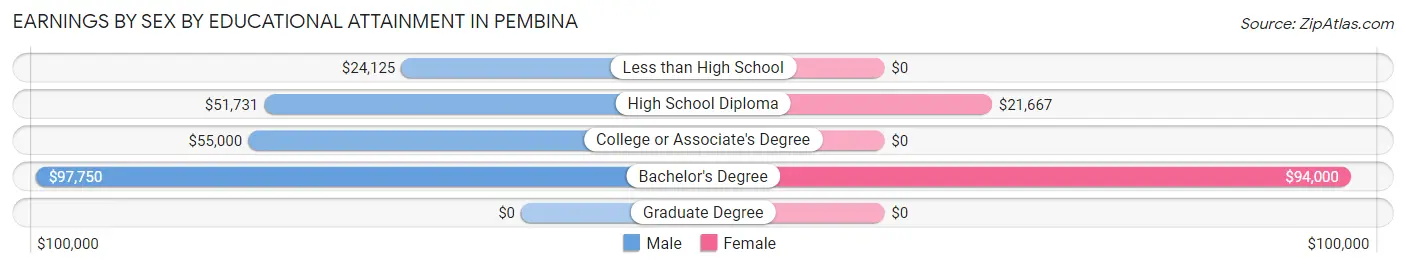
Earnings by Sex by Educational Attainment in Pembina
Average earnings in Pembina are $52,250 for men and $27,500 for women, a difference of 47.4%. Men with an educational attainment of bachelor's degree enjoy the highest average annual earnings of $97,750, while those with less than high school education earn the least with $24,125. Women with an educational attainment of bachelor's degree earn the most with the average annual earnings of $94,000, while those with high school diploma education have the smallest earnings of $21,667.
| Educational Attainment | Male Income | Female Income |
| Less than High School | $24,125 | $0 |
| High School Diploma | $51,731 | $21,667 |
| College or Associate's Degree | $55,000 | $0 |
| Bachelor's Degree | $97,750 | $94,000 |
| Graduate Degree | - | - |
| Total | $52,250 | $27,500 |
Family Income in Pembina
Family Income Brackets in Pembina
According to the Pembina family income data, there are 33 families falling into the $75,000 to $99,999 income range, which is the most common income bracket and makes up 23.1% of all families. Conversely, the less than $10,000 income bracket is the least frequent group with only 2 families (1.4%) belonging to this category.
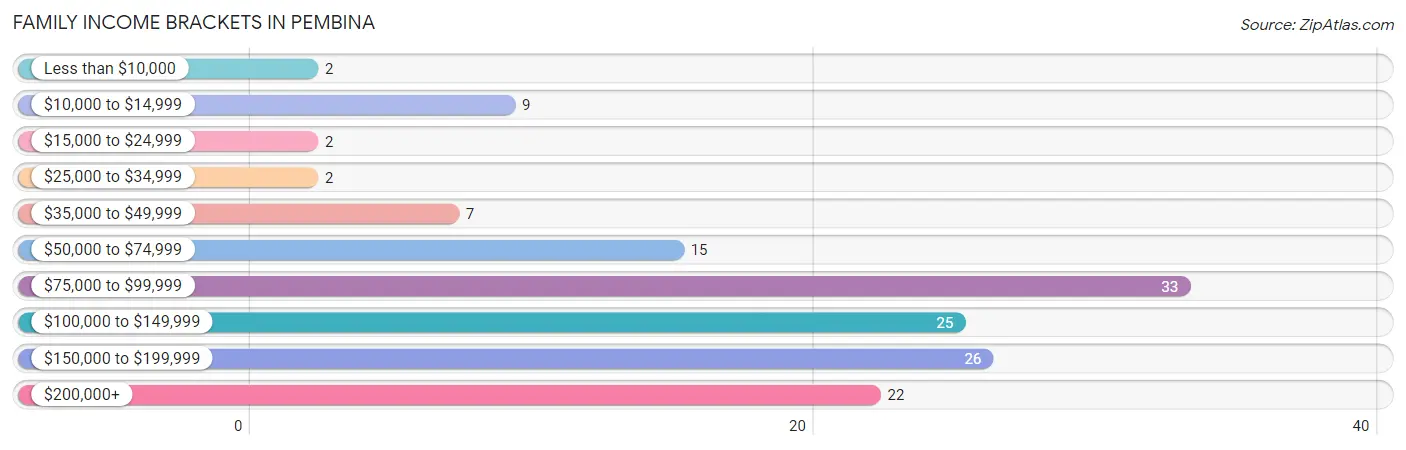
| Income Bracket | # Families | % Families |
| Less than $10,000 | 2 | 1.4% |
| $10,000 to $14,999 | 9 | 6.3% |
| $15,000 to $24,999 | 2 | 1.4% |
| $25,000 to $34,999 | 2 | 1.4% |
| $35,000 to $49,999 | 7 | 4.9% |
| $50,000 to $74,999 | 15 | 10.5% |
| $75,000 to $99,999 | 33 | 23.1% |
| $100,000 to $149,999 | 25 | 17.5% |
| $150,000 to $199,999 | 26 | 18.2% |
| $200,000+ | 22 | 15.4% |
Family Income by Famaliy Size in Pembina
4-person families (23 | 16.1%) account for the highest median family income in Pembina with $171,250 per family, while 2-person families (75 | 52.4%) have the highest median income of $47,969 per family member.
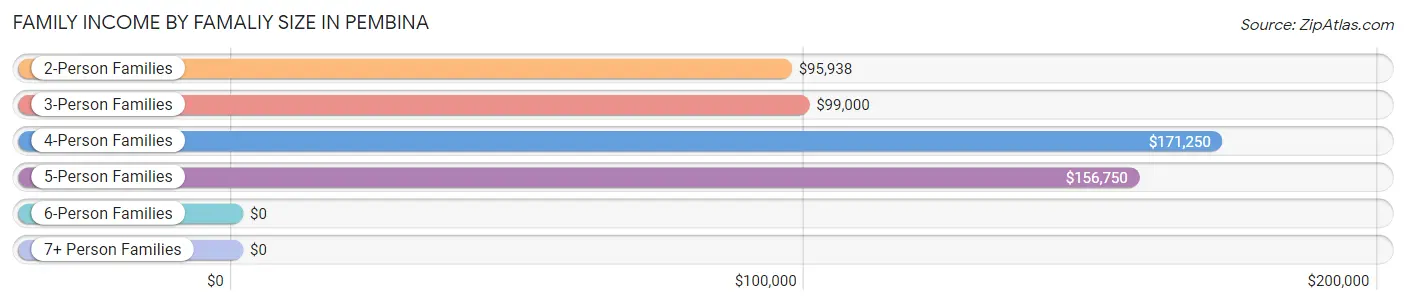
| Income Bracket | # Families | Median Income |
| 2-Person Families | 75 (52.4%) | $95,938 |
| 3-Person Families | 16 (11.2%) | $99,000 |
| 4-Person Families | 23 (16.1%) | $171,250 |
| 5-Person Families | 15 (10.5%) | $156,750 |
| 6-Person Families | 3 (2.1%) | $0 |
| 7+ Person Families | 11 (7.7%) | $0 |
| Total | 143 (100.0%) | $105,750 |
Family Income by Number of Earners in Pembina
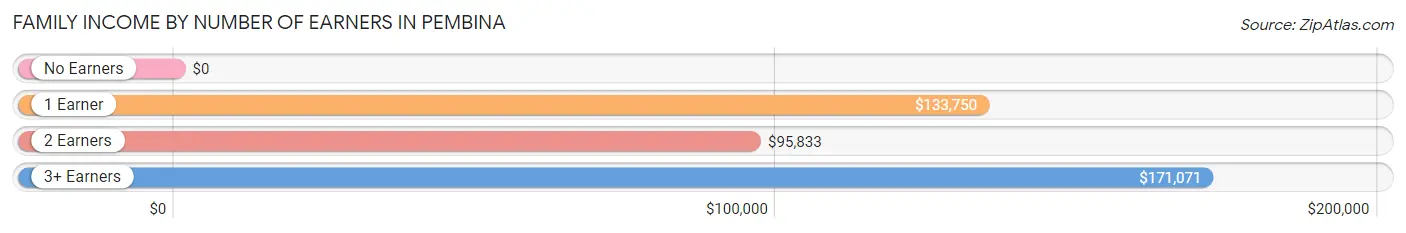
| Number of Earners | # Families | Median Income |
| No Earners | 17 (11.9%) | $0 |
| 1 Earner | 34 (23.8%) | $133,750 |
| 2 Earners | 70 (48.9%) | $95,833 |
| 3+ Earners | 22 (15.4%) | $171,071 |
| Total | 143 (100.0%) | $105,750 |
Household Income in Pembina
Household Income Brackets in Pembina
With 40 households falling in the category, the $75,000 to $99,999 income range is the most frequent in Pembina, accounting for 19.1% of all households. In contrast, only 6 households (2.9%) fall into the $15,000 to $24,999 income bracket, making it the least populous group.
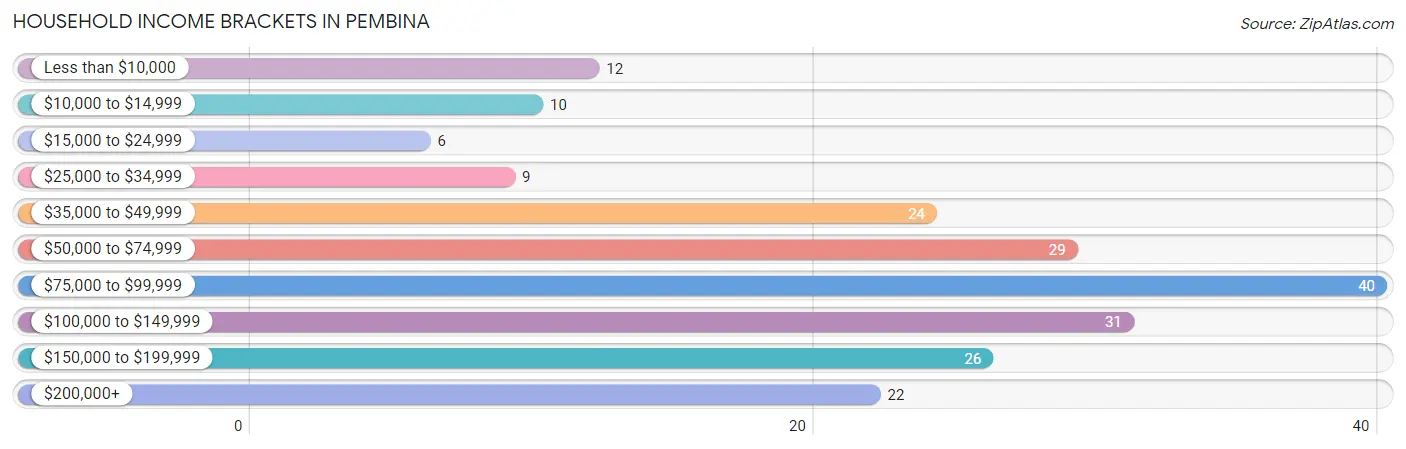
| Income Bracket | # Households | % Households |
| Less than $10,000 | 12 | 5.7% |
| $10,000 to $14,999 | 10 | 4.8% |
| $15,000 to $24,999 | 6 | 2.9% |
| $25,000 to $34,999 | 9 | 4.3% |
| $35,000 to $49,999 | 24 | 11.5% |
| $50,000 to $74,999 | 29 | 13.9% |
| $75,000 to $99,999 | 40 | 19.1% |
| $100,000 to $149,999 | 31 | 14.8% |
| $150,000 to $199,999 | 26 | 12.4% |
| $200,000+ | 22 | 10.5% |
Household Income by Householder Age in Pembina
The median household income in Pembina is $85,795, with the highest median household income of $91,250 found in the 25 to 44 years age bracket for the primary householder. A total of 71 households (34.0%) fall into this category.
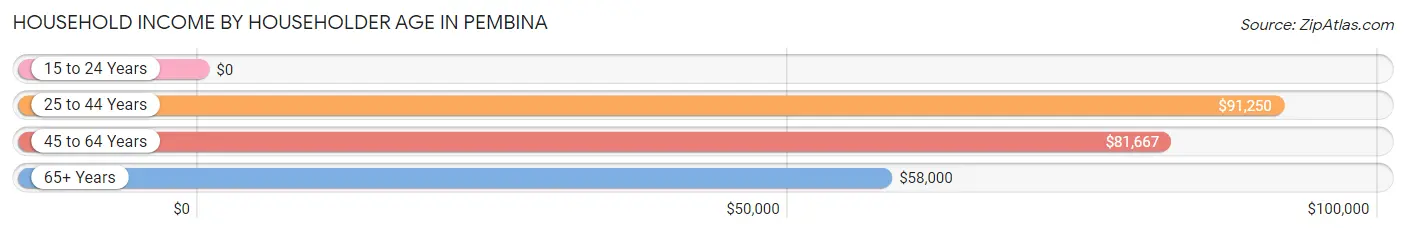
| Income Bracket | # Households | Median Income |
| 15 to 24 Years | 0 (0.0%) | $0 |
| 25 to 44 Years | 71 (34.0%) | $91,250 |
| 45 to 64 Years | 62 (29.7%) | $81,667 |
| 65+ Years | 76 (36.4%) | $58,000 |
| Total | 209 (100.0%) | $85,795 |
Poverty in Pembina
Income Below Poverty by Sex and Age in Pembina
With 6.9% poverty level for males and 11.8% for females among the residents of Pembina, 18 to 24 year old males and 75 year old and over females are the most vulnerable to poverty, with 2 males (40.0%) and 21 females (60.0%) in their respective age groups living below the poverty level.
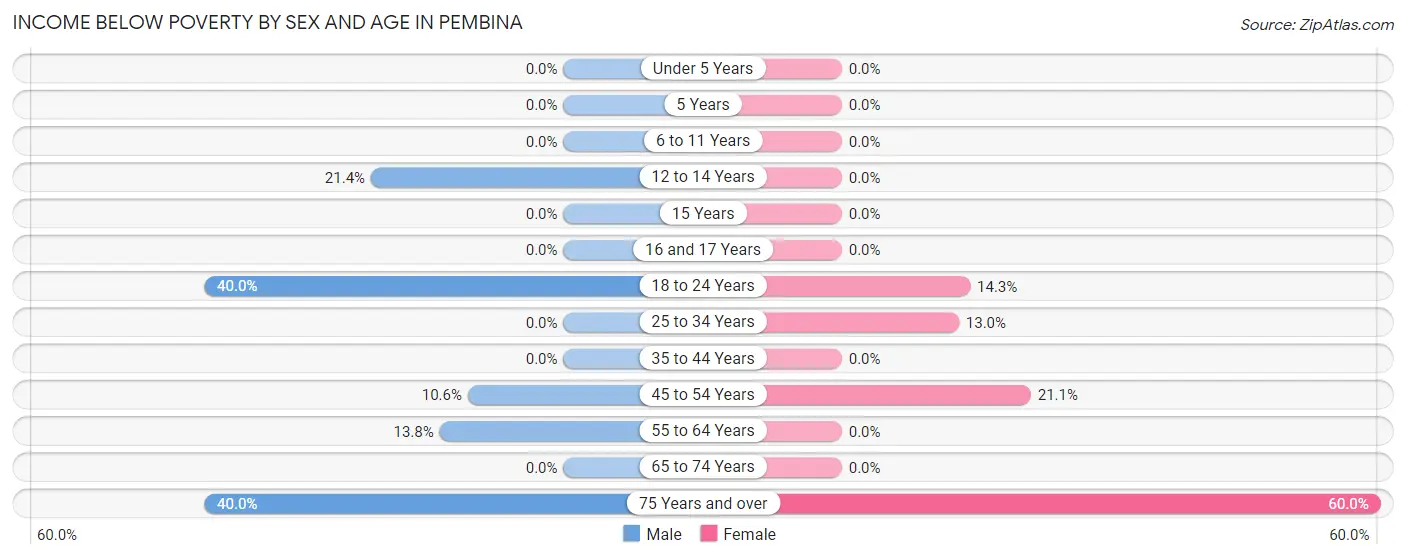
| Age Bracket | Male | Female |
| Under 5 Years | 0 (0.0%) | 0 (0.0%) |
| 5 Years | 0 (0.0%) | 0 (0.0%) |
| 6 to 11 Years | 0 (0.0%) | 0 (0.0%) |
| 12 to 14 Years | 3 (21.4%) | 0 (0.0%) |
| 15 Years | 0 (0.0%) | 0 (0.0%) |
| 16 and 17 Years | 0 (0.0%) | 0 (0.0%) |
| 18 to 24 Years | 2 (40.0%) | 3 (14.3%) |
| 25 to 34 Years | 0 (0.0%) | 3 (13.0%) |
| 35 to 44 Years | 0 (0.0%) | 0 (0.0%) |
| 45 to 54 Years | 5 (10.6%) | 4 (21.0%) |
| 55 to 64 Years | 4 (13.8%) | 0 (0.0%) |
| 65 to 74 Years | 0 (0.0%) | 0 (0.0%) |
| 75 Years and over | 6 (40.0%) | 21 (60.0%) |
| Total | 20 (6.9%) | 31 (11.8%) |
Income Above Poverty by Sex and Age in Pembina
According to the poverty statistics in Pembina, males aged under 5 years and females aged under 5 years are the age groups that are most secure financially, with 100.0% of males and 100.0% of females in these age groups living above the poverty line.
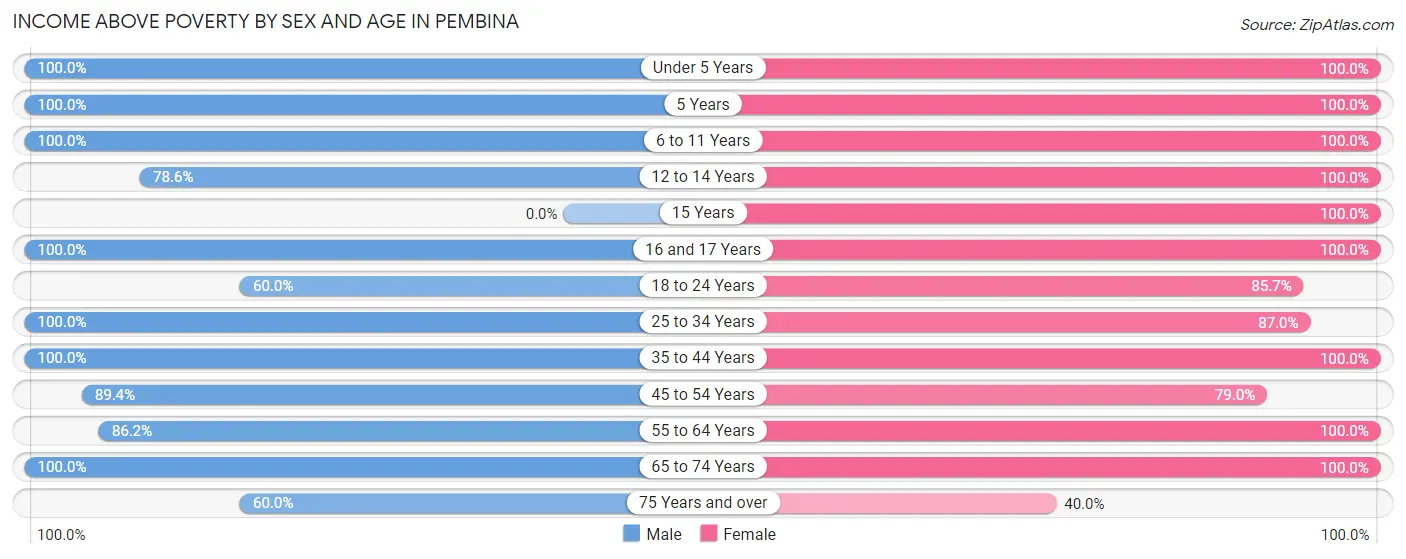
| Age Bracket | Male | Female |
| Under 5 Years | 34 (100.0%) | 14 (100.0%) |
| 5 Years | 4 (100.0%) | 11 (100.0%) |
| 6 to 11 Years | 4 (100.0%) | 14 (100.0%) |
| 12 to 14 Years | 11 (78.6%) | 19 (100.0%) |
| 15 Years | 0 (0.0%) | 2 (100.0%) |
| 16 and 17 Years | 12 (100.0%) | 3 (100.0%) |
| 18 to 24 Years | 3 (60.0%) | 18 (85.7%) |
| 25 to 34 Years | 45 (100.0%) | 20 (87.0%) |
| 35 to 44 Years | 38 (100.0%) | 43 (100.0%) |
| 45 to 54 Years | 42 (89.4%) | 15 (78.9%) |
| 55 to 64 Years | 25 (86.2%) | 33 (100.0%) |
| 65 to 74 Years | 43 (100.0%) | 25 (100.0%) |
| 75 Years and over | 9 (60.0%) | 14 (40.0%) |
| Total | 270 (93.1%) | 231 (88.2%) |
Income Below Poverty Among Married-Couple Families in Pembina
The poverty statistics for married-couple families in Pembina show that 6.2% or 8 of the total 128 families live below the poverty line. Families with no children have the highest poverty rate of 10.1%, comprising of 8 families. On the other hand, families with 1 or 2 children have the lowest poverty rate of 0.0%, which includes 0 families.
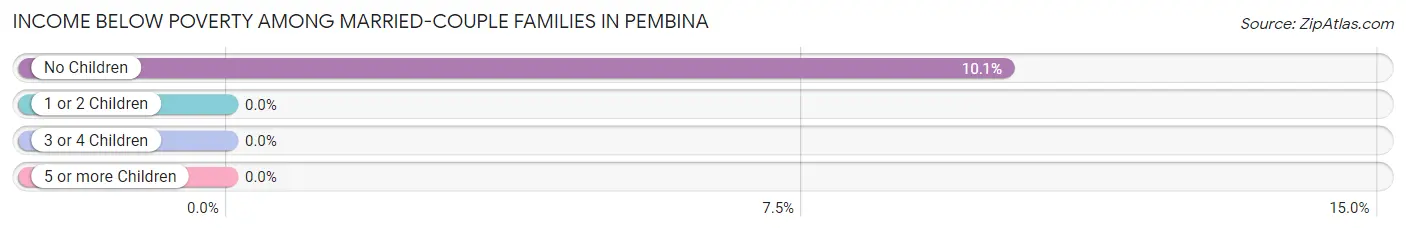
| Children | Above Poverty | Below Poverty |
| No Children | 71 (89.9%) | 8 (10.1%) |
| 1 or 2 Children | 26 (100.0%) | 0 (0.0%) |
| 3 or 4 Children | 12 (100.0%) | 0 (0.0%) |
| 5 or more Children | 11 (100.0%) | 0 (0.0%) |
| Total | 120 (93.8%) | 8 (6.2%) |
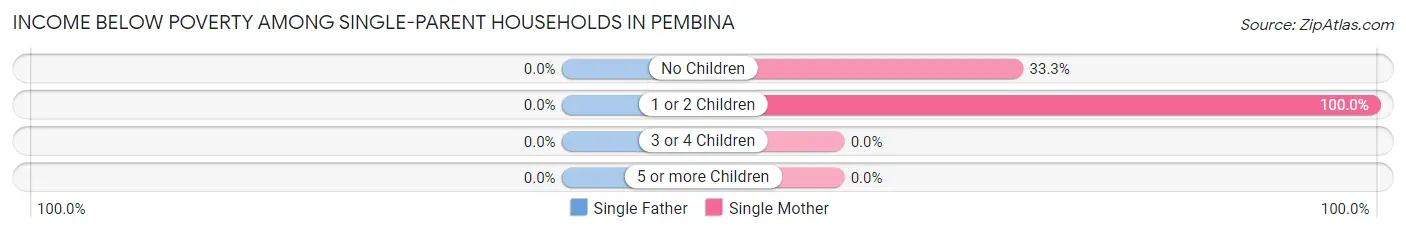
Income Below Poverty Among Single-Parent Households in Pembina
| Children | Single Father | Single Mother |
| No Children | 0 (0.0%) | 3 (33.3%) |
| 1 or 2 Children | 0 (0.0%) | 2 (100.0%) |
| 3 or 4 Children | 0 (0.0%) | 0 (0.0%) |
| 5 or more Children | 0 (0.0%) | 0 (0.0%) |
| Total | 0 (0.0%) | 5 (45.5%) |
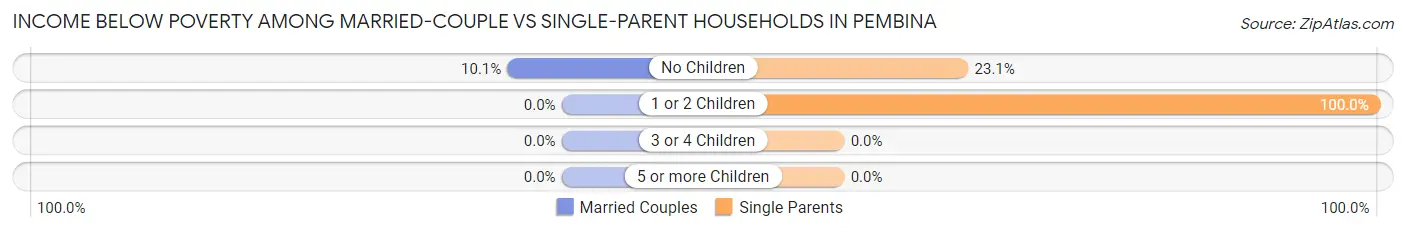
Income Below Poverty Among Married-Couple vs Single-Parent Households in Pembina
The poverty data for Pembina shows that 8 of the married-couple family households (6.2%) and 5 of the single-parent households (33.3%) are living below the poverty level. Within the married-couple family households, those with no children have the highest poverty rate, with 8 households (10.1%) falling below the poverty line. Among the single-parent households, those with 1 or 2 children have the highest poverty rate, with 2 household (100.0%) living below poverty.
| Children | Married-Couple Families | Single-Parent Households |
| No Children | 8 (10.1%) | 3 (23.1%) |
| 1 or 2 Children | 0 (0.0%) | 2 (100.0%) |
| 3 or 4 Children | 0 (0.0%) | 0 (0.0%) |
| 5 or more Children | 0 (0.0%) | 0 (0.0%) |
| Total | 8 (6.2%) | 5 (33.3%) |
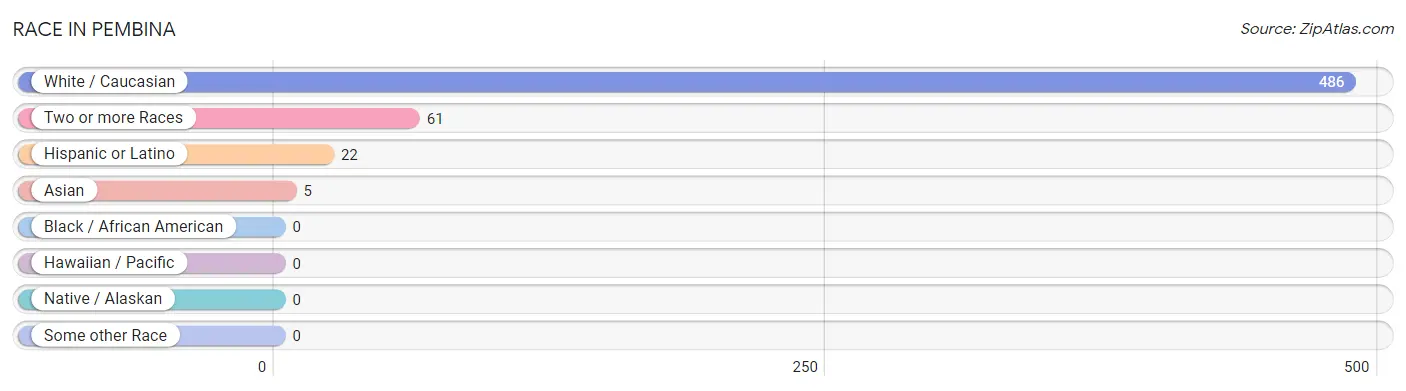
Race in Pembina
The most populous races in Pembina are White / Caucasian (486 | 88.0%), Two or more Races (61 | 11.1%), and Hispanic or Latino (22 | 4.0%).
| Race | # Population | % Population |
| Asian | 5 | 0.9% |
| Black / African American | 0 | 0.0% |
| Hawaiian / Pacific | 0 | 0.0% |
| Hispanic or Latino | 22 | 4.0% |
| Native / Alaskan | 0 | 0.0% |
| White / Caucasian | 486 | 88.0% |
| Two or more Races | 61 | 11.1% |
| Some other Race | 0 | 0.0% |
| Total | 552 | 100.0% |
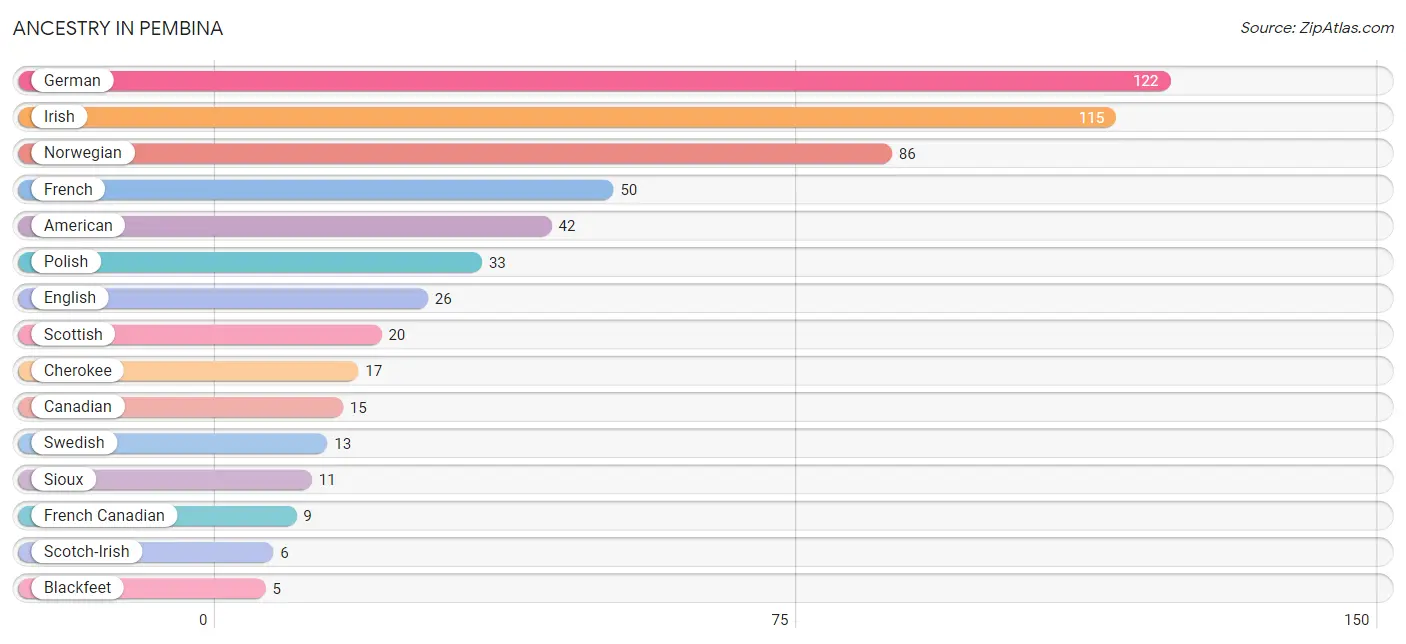
Ancestry in Pembina
The most populous ancestries reported in Pembina are German (122 | 22.1%), Irish (115 | 20.8%), Norwegian (86 | 15.6%), French (50 | 9.1%), and American (42 | 7.6%), together accounting for 75.2% of all Pembina residents.
| Ancestry | # Population | % Population |
| American | 42 | 7.6% |
| Barbadian | 2 | 0.4% |
| Blackfeet | 5 | 0.9% |
| Canadian | 15 | 2.7% |
| Cherokee | 17 | 3.1% |
| Danish | 1 | 0.2% |
| English | 26 | 4.7% |
| French | 50 | 9.1% |
| French Canadian | 9 | 1.6% |
| German | 122 | 22.1% |
| Irish | 115 | 20.8% |
| Mexican | 4 | 0.7% |
| Norwegian | 86 | 15.6% |
| Pakistani | 1 | 0.2% |
| Pennsylvania German | 3 | 0.5% |
| Polish | 33 | 6.0% |
| Romanian | 2 | 0.4% |
| Russian | 3 | 0.5% |
| Scotch-Irish | 6 | 1.1% |
| Scottish | 20 | 3.6% |
| Sioux | 11 | 2.0% |
| Swedish | 13 | 2.4% | View All 22 Rows |
Immigrants in Pembina
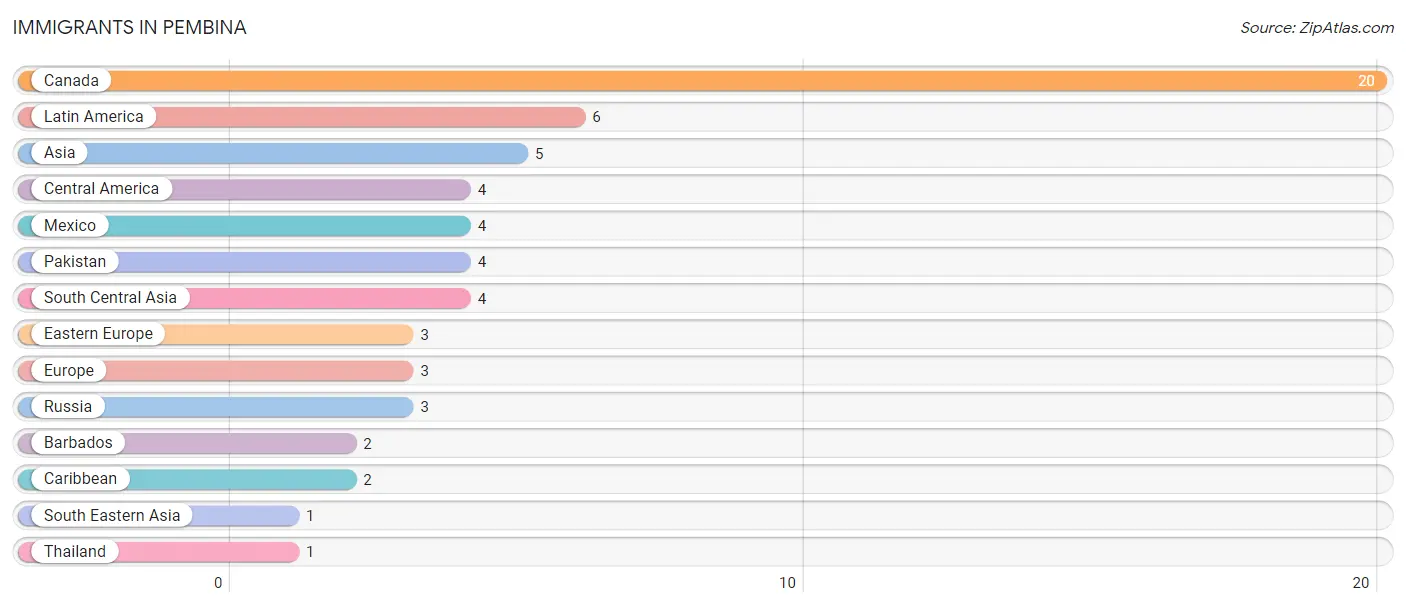
The most numerous immigrant groups reported in Pembina came from Canada (20 | 3.6%), Latin America (6 | 1.1%), Asia (5 | 0.9%), Central America (4 | 0.7%), and Mexico (4 | 0.7%), together accounting for 7.1% of all Pembina residents.
| Immigration Origin | # Population | % Population |
| Asia | 5 | 0.9% |
| Barbados | 2 | 0.4% |
| Canada | 20 | 3.6% |
| Caribbean | 2 | 0.4% |
| Central America | 4 | 0.7% |
| Eastern Europe | 3 | 0.5% |
| Europe | 3 | 0.5% |
| Latin America | 6 | 1.1% |
| Mexico | 4 | 0.7% |
| Pakistan | 4 | 0.7% |
| Russia | 3 | 0.5% |
| South Central Asia | 4 | 0.7% |
| South Eastern Asia | 1 | 0.2% |
| Thailand | 1 | 0.2% | View All 14 Rows |
Sex and Age in Pembina
Sex and Age in Pembina
The most populous age groups in Pembina are Under 5 Years (34 | 11.7%) for men and 60 to 64 Years (24 | 9.2%) for women.
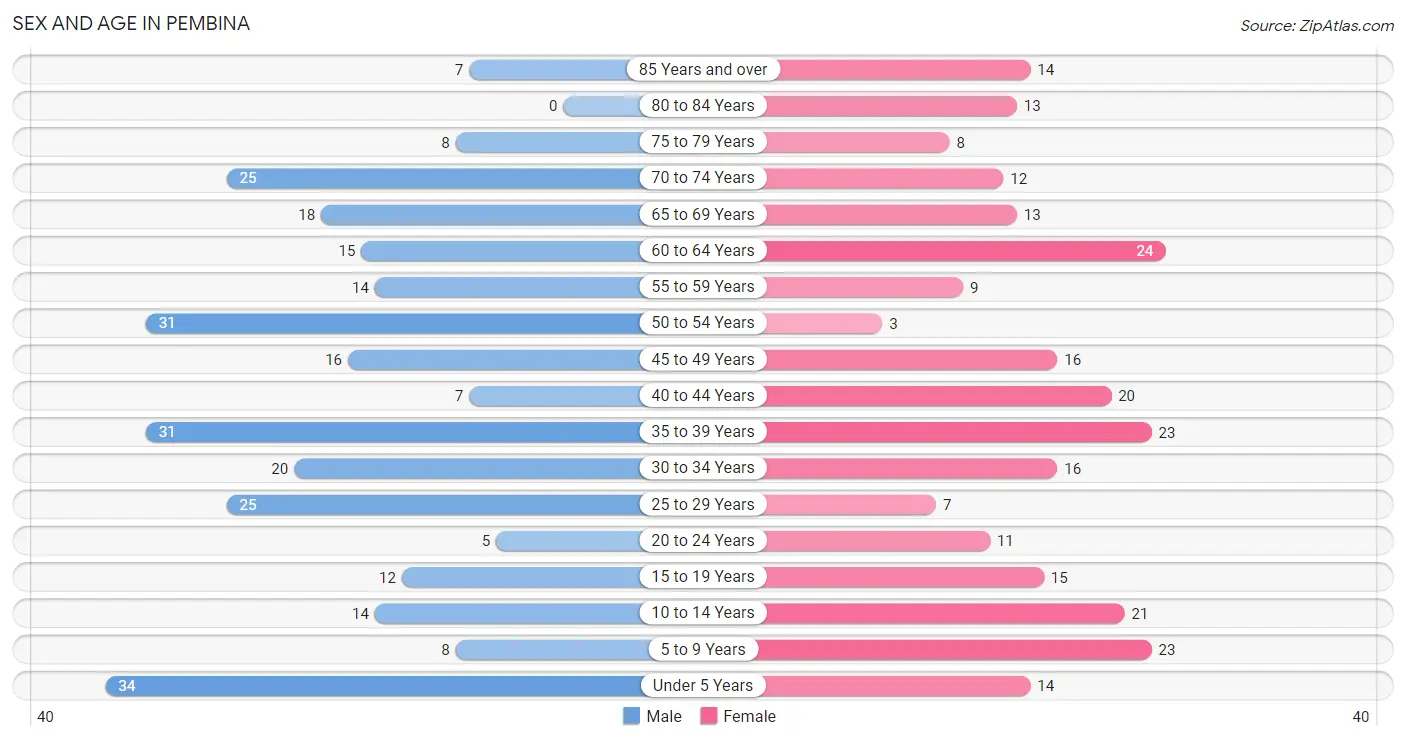
| Age Bracket | Male | Female |
| Under 5 Years | 34 (11.7%) | 14 (5.3%) |
| 5 to 9 Years | 8 (2.8%) | 23 (8.8%) |
| 10 to 14 Years | 14 (4.8%) | 21 (8.0%) |
| 15 to 19 Years | 12 (4.1%) | 15 (5.7%) |
| 20 to 24 Years | 5 (1.7%) | 11 (4.2%) |
| 25 to 29 Years | 25 (8.6%) | 7 (2.7%) |
| 30 to 34 Years | 20 (6.9%) | 16 (6.1%) |
| 35 to 39 Years | 31 (10.7%) | 23 (8.8%) |
| 40 to 44 Years | 7 (2.4%) | 20 (7.6%) |
| 45 to 49 Years | 16 (5.5%) | 16 (6.1%) |
| 50 to 54 Years | 31 (10.7%) | 3 (1.1%) |
| 55 to 59 Years | 14 (4.8%) | 9 (3.4%) |
| 60 to 64 Years | 15 (5.2%) | 24 (9.2%) |
| 65 to 69 Years | 18 (6.2%) | 13 (5.0%) |
| 70 to 74 Years | 25 (8.6%) | 12 (4.6%) |
| 75 to 79 Years | 8 (2.8%) | 8 (3.0%) |
| 80 to 84 Years | 0 (0.0%) | 13 (5.0%) |
| 85 Years and over | 7 (2.4%) | 14 (5.3%) |
| Total | 290 (100.0%) | 262 (100.0%) |
Families and Households in Pembina
Median Family Size in Pembina
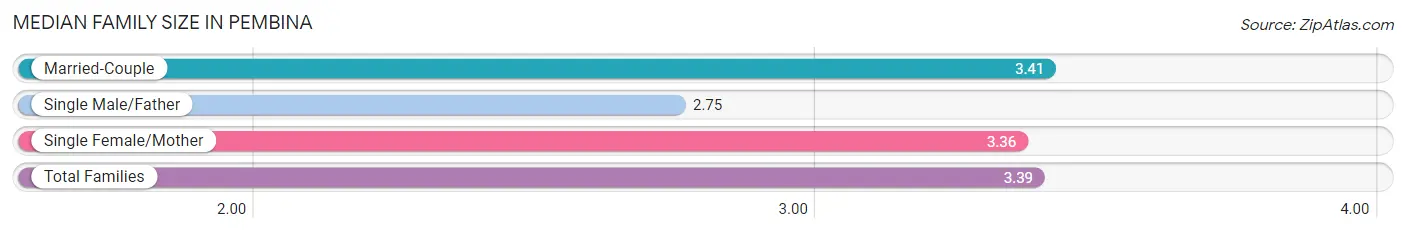
The median family size in Pembina is 3.39 persons per family, with married-couple families (128 | 89.5%) accounting for the largest median family size of 3.41 persons per family. On the other hand, single male/father families (4 | 2.8%) represent the smallest median family size with 2.75 persons per family.
| Family Type | # Families | Family Size |
| Married-Couple | 128 (89.5%) | 3.41 |
| Single Male/Father | 4 (2.8%) | 2.75 |
| Single Female/Mother | 11 (7.7%) | 3.36 |
| Total Families | 143 (100.0%) | 3.39 |
Median Household Size in Pembina
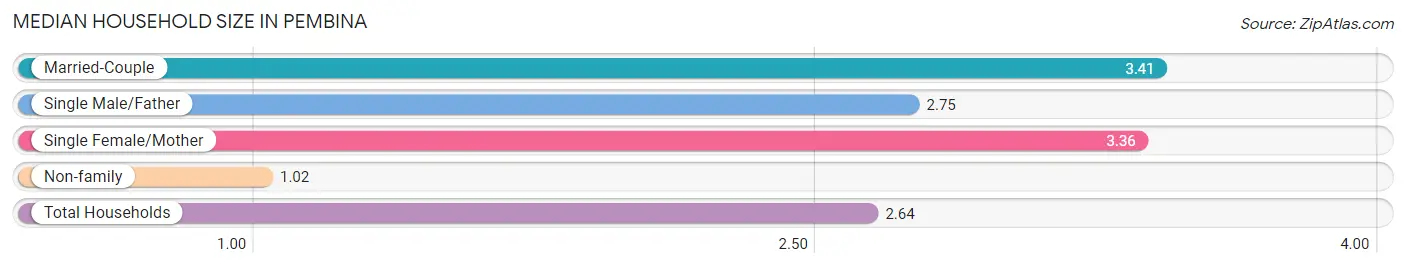
The median household size in Pembina is 2.64 persons per household, with married-couple households (128 | 61.2%) accounting for the largest median household size of 3.41 persons per household. non-family households (66 | 31.6%) represent the smallest median household size with 1.02 persons per household.
| Household Type | # Households | Household Size |
| Married-Couple | 128 (61.2%) | 3.41 |
| Single Male/Father | 4 (1.9%) | 2.75 |
| Single Female/Mother | 11 (5.3%) | 3.36 |
| Non-family | 66 (31.6%) | 1.02 |
| Total Households | 209 (100.0%) | 2.64 |
Household Size by Marriage Status in Pembina
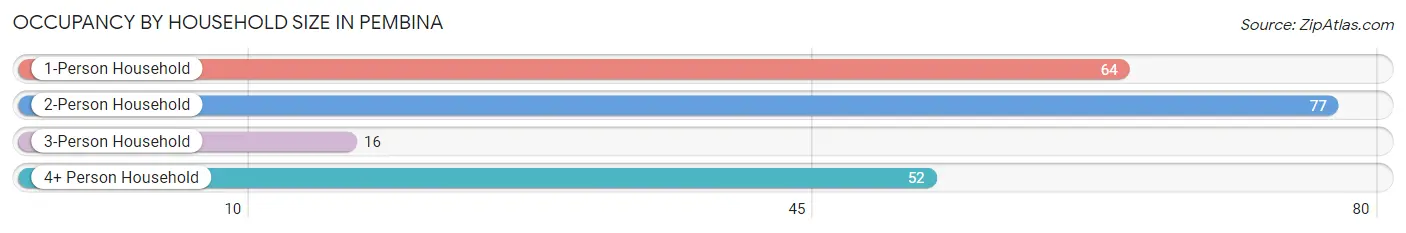
Out of a total of 209 households in Pembina, 143 (68.4%) are family households, while 66 (31.6%) are nonfamily households. The most numerous type of family households are 2-person households, comprising 75, and the most common type of nonfamily households are 1-person households, comprising 64.
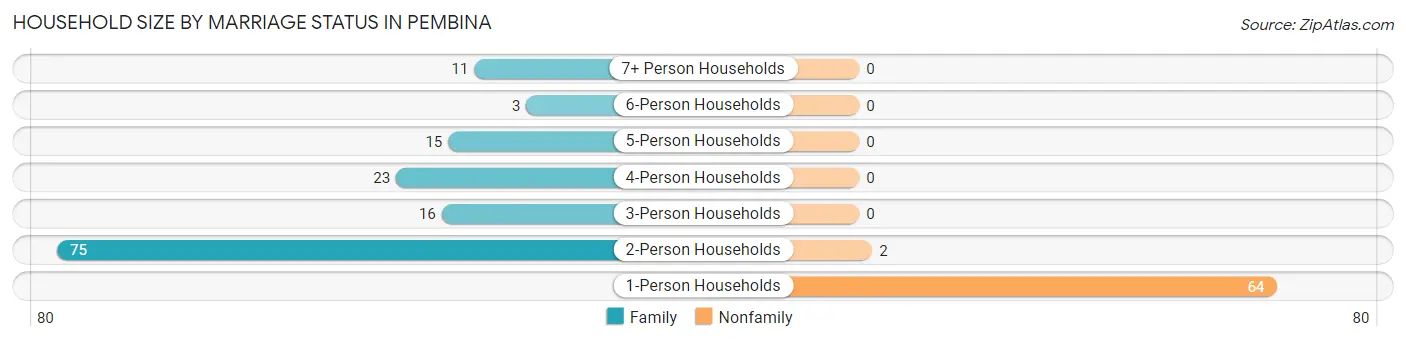
| Household Size | Family Households | Nonfamily Households |
| 1-Person Households | - | 64 (30.6%) |
| 2-Person Households | 75 (35.9%) | 2 (1.0%) |
| 3-Person Households | 16 (7.7%) | 0 (0.0%) |
| 4-Person Households | 23 (11.0%) | 0 (0.0%) |
| 5-Person Households | 15 (7.2%) | 0 (0.0%) |
| 6-Person Households | 3 (1.4%) | 0 (0.0%) |
| 7+ Person Households | 11 (5.3%) | 0 (0.0%) |
| Total | 143 (68.4%) | 66 (31.6%) |
Female Fertility in Pembina
Fertility by Age in Pembina
Average fertility rate in Pembina is 64.0 births per 1,000 women. Women in the age bracket of 20 to 34 years have the highest fertility rate with 147.0 births per 1,000 women. Women in the age bracket of 20 to 34 years acount for 71.4% of all women with births.
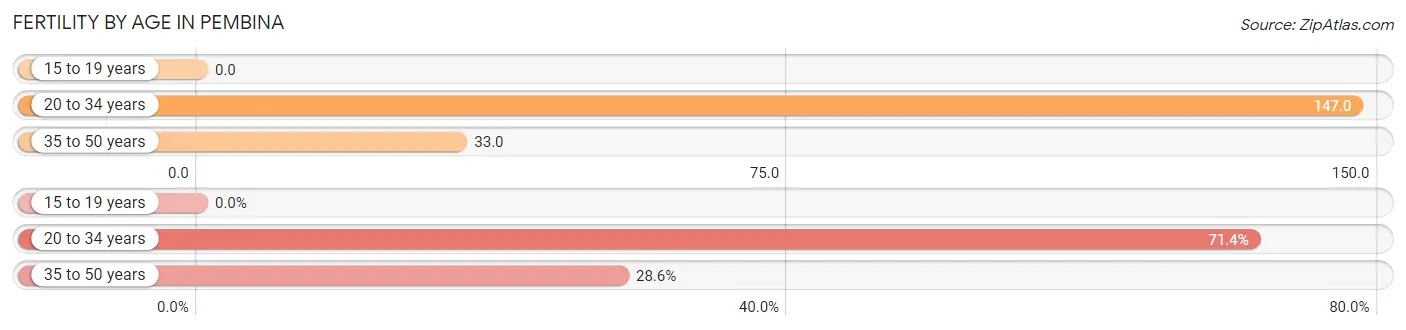
| Age Bracket | Women with Births | Births / 1,000 Women |
| 15 to 19 years | 0 (0.0%) | 0.0 |
| 20 to 34 years | 5 (71.4%) | 147.0 |
| 35 to 50 years | 2 (28.6%) | 33.0 |
| Total | 7 (100.0%) | 64.0 |
Fertility by Age by Marriage Status in Pembina
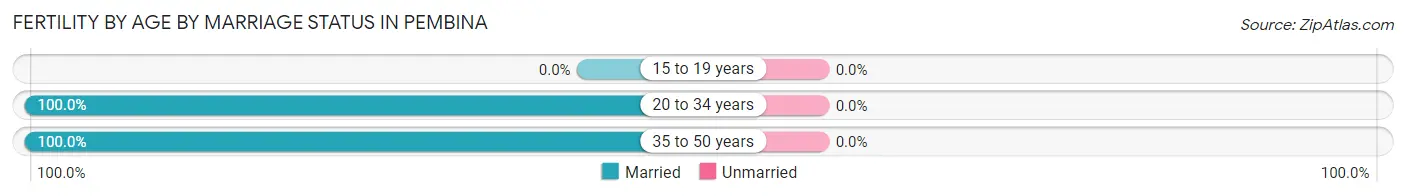
| Age Bracket | Married | Unmarried |
| 15 to 19 years | 0 (0.0%) | 0 (0.0%) |
| 20 to 34 years | 5 (100.0%) | 0 (0.0%) |
| 35 to 50 years | 2 (100.0%) | 0 (0.0%) |
| Total | 7 (100.0%) | 0 (0.0%) |
Fertility by Education in Pembina
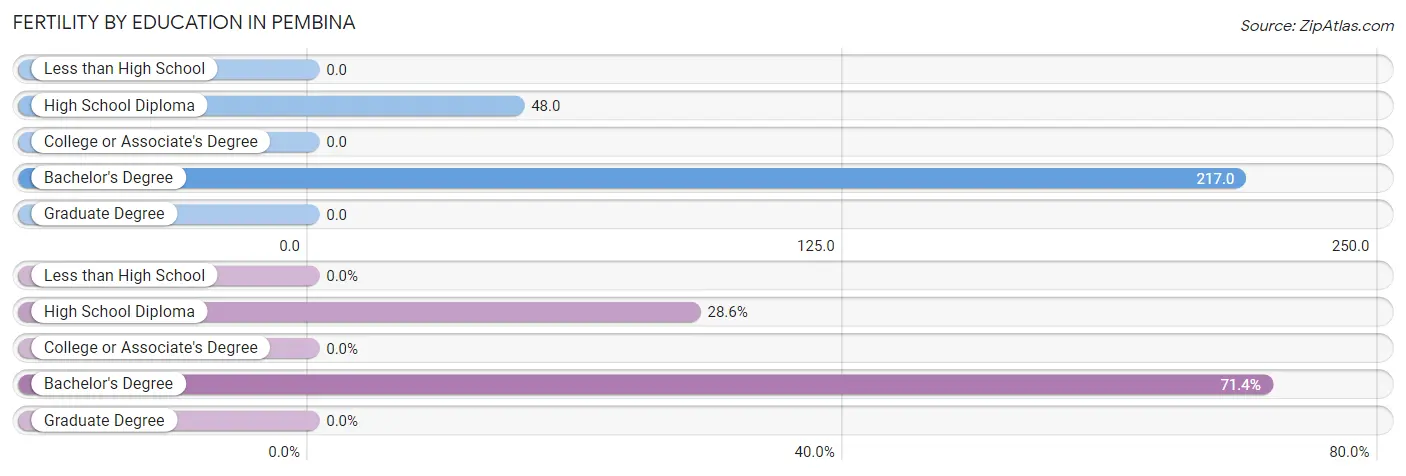
| Educational Attainment | Women with Births | Births / 1,000 Women |
| Less than High School | 0 (0.0%) | 0.0 |
| High School Diploma | 2 (28.6%) | 48.0 |
| College or Associate's Degree | 0 (0.0%) | 0.0 |
| Bachelor's Degree | 5 (71.4%) | 217.0 |
| Graduate Degree | 0 (0.0%) | 0.0 |
| Total | 7 (100.0%) | 64.0 |
Fertility by Education by Marriage Status in Pembina
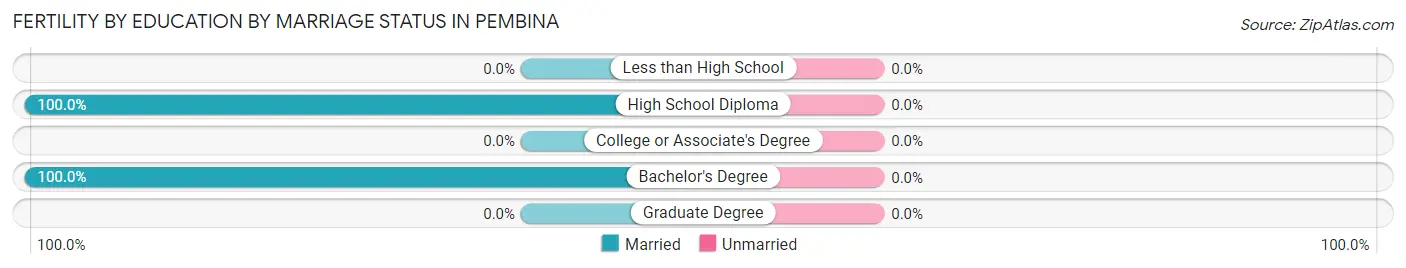
| Educational Attainment | Married | Unmarried |
| Less than High School | 0 (0.0%) | 0 (0.0%) |
| High School Diploma | 2 (100.0%) | 0 (0.0%) |
| College or Associate's Degree | 0 (0.0%) | 0 (0.0%) |
| Bachelor's Degree | 5 (100.0%) | 0 (0.0%) |
| Graduate Degree | 0 (0.0%) | 0 (0.0%) |
| Total | 7 (100.0%) | 0 (0.0%) |
Employment Characteristics in Pembina
Employment by Class of Employer in Pembina
Among the 243 employed individuals in Pembina, private company employees (154 | 63.4%), federal government employees (55 | 22.6%), and not-for-profit organizations (20 | 8.2%) make up the most common classes of employment.
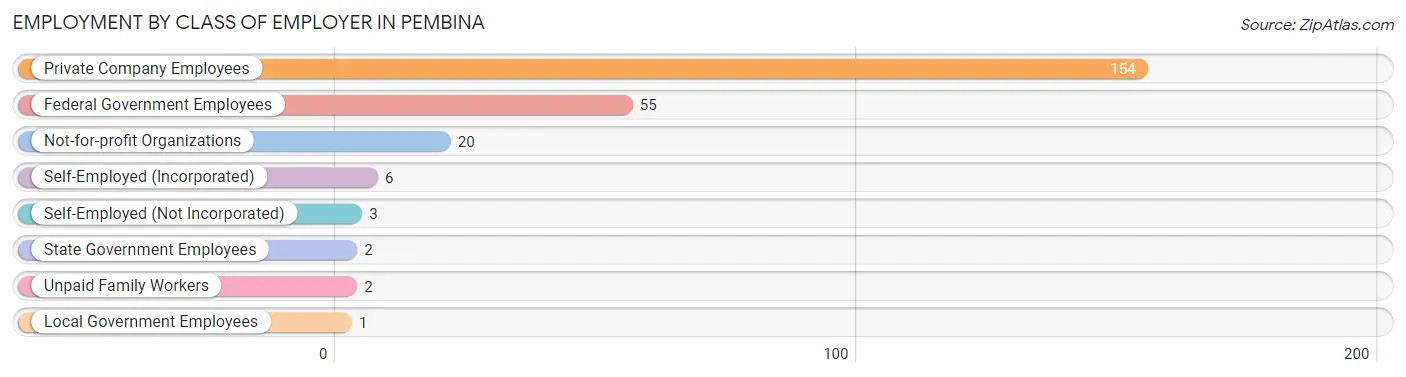
| Employer Class | # Employees | % Employees |
| Private Company Employees | 154 | 63.4% |
| Self-Employed (Incorporated) | 6 | 2.5% |
| Self-Employed (Not Incorporated) | 3 | 1.2% |
| Not-for-profit Organizations | 20 | 8.2% |
| Local Government Employees | 1 | 0.4% |
| State Government Employees | 2 | 0.8% |
| Federal Government Employees | 55 | 22.6% |
| Unpaid Family Workers | 2 | 0.8% |
| Total | 243 | 100.0% |
Employment Status by Age in Pembina
According to the labor force statistics for Pembina, out of the total population over 16 years of age (436), 60.8% or 265 individuals are in the labor force, with 4.9% or 13 of them unemployed. The age group with the highest labor force participation rate is 25 to 29 years, with 90.6% or 29 individuals in the labor force. Within the labor force, the 25 to 29 years age range has the highest percentage of unemployed individuals, with 34.5% or 10 of them being unemployed.
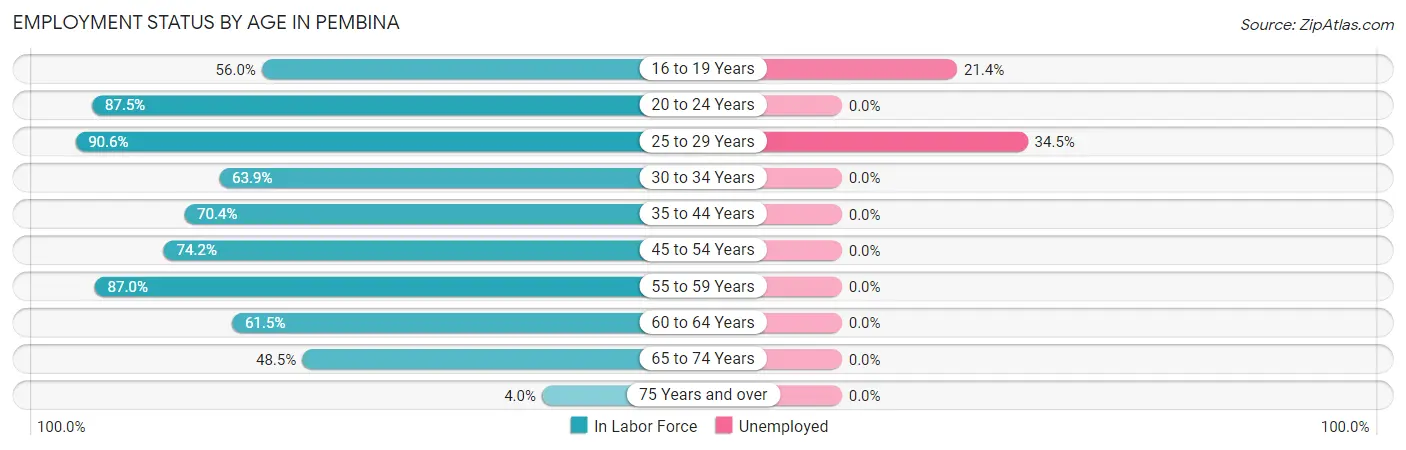
| Age Bracket | In Labor Force | Unemployed |
| 16 to 19 Years | 14 (56.0%) | 3 (21.4%) |
| 20 to 24 Years | 14 (87.5%) | 0 (0.0%) |
| 25 to 29 Years | 29 (90.6%) | 10 (34.5%) |
| 30 to 34 Years | 23 (63.9%) | 0 (0.0%) |
| 35 to 44 Years | 57 (70.4%) | 0 (0.0%) |
| 45 to 54 Years | 49 (74.2%) | 0 (0.0%) |
| 55 to 59 Years | 20 (87.0%) | 0 (0.0%) |
| 60 to 64 Years | 24 (61.5%) | 0 (0.0%) |
| 65 to 74 Years | 33 (48.5%) | 0 (0.0%) |
| 75 Years and over | 2 (4.0%) | 0 (0.0%) |
| Total | 265 (60.8%) | 13 (4.9%) |
Employment Status by Educational Attainment in Pembina
According to labor force statistics for Pembina, 72.9% of individuals (202) out of the total population between 25 and 64 years of age (277) are in the labor force, with 5.0% or 10 of them being unemployed. The group with the highest labor force participation rate are those with the educational attainment of less than high school, with 87.5% or 14 individuals in the labor force. Within the labor force, individuals with less than high school education have the highest percentage of unemployment, with 71.4% or 10 of them being unemployed.
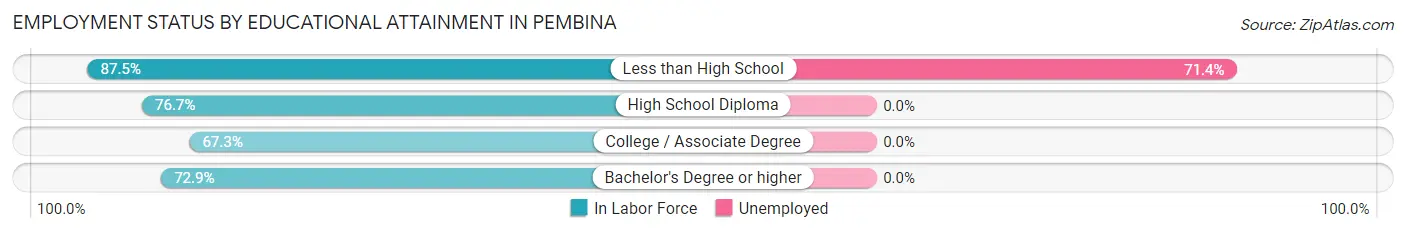
| Educational Attainment | In Labor Force | Unemployed |
| Less than High School | 14 (87.5%) | 11 (71.4%) |
| High School Diploma | 79 (76.7%) | 0 (0.0%) |
| College / Associate Degree | 74 (67.3%) | 0 (0.0%) |
| Bachelor's Degree or higher | 35 (72.9%) | 0 (0.0%) |
| Total | 202 (72.9%) | 14 (5.0%) |
Employment Occupations by Sex in Pembina
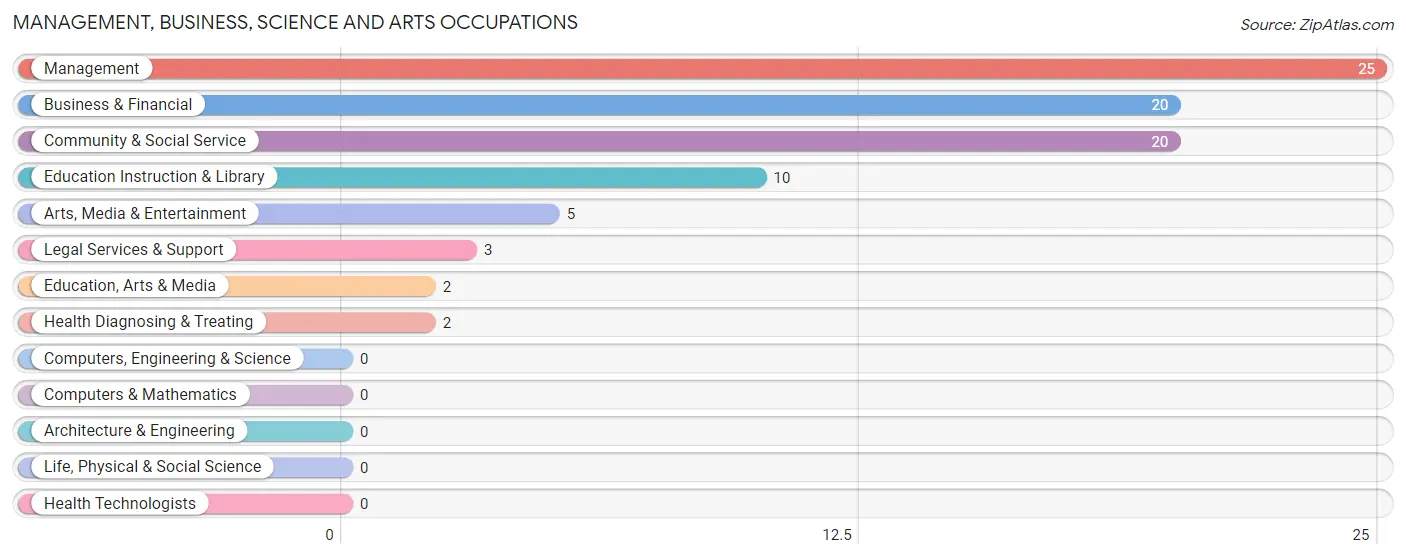
Management, Business, Science and Arts Occupations
The most common Management, Business, Science and Arts occupations in Pembina are Management (25 | 9.9%), Business & Financial (20 | 7.9%), Community & Social Service (20 | 7.9%), Education Instruction & Library (10 | 4.0%), and Arts, Media & Entertainment (5 | 2.0%).
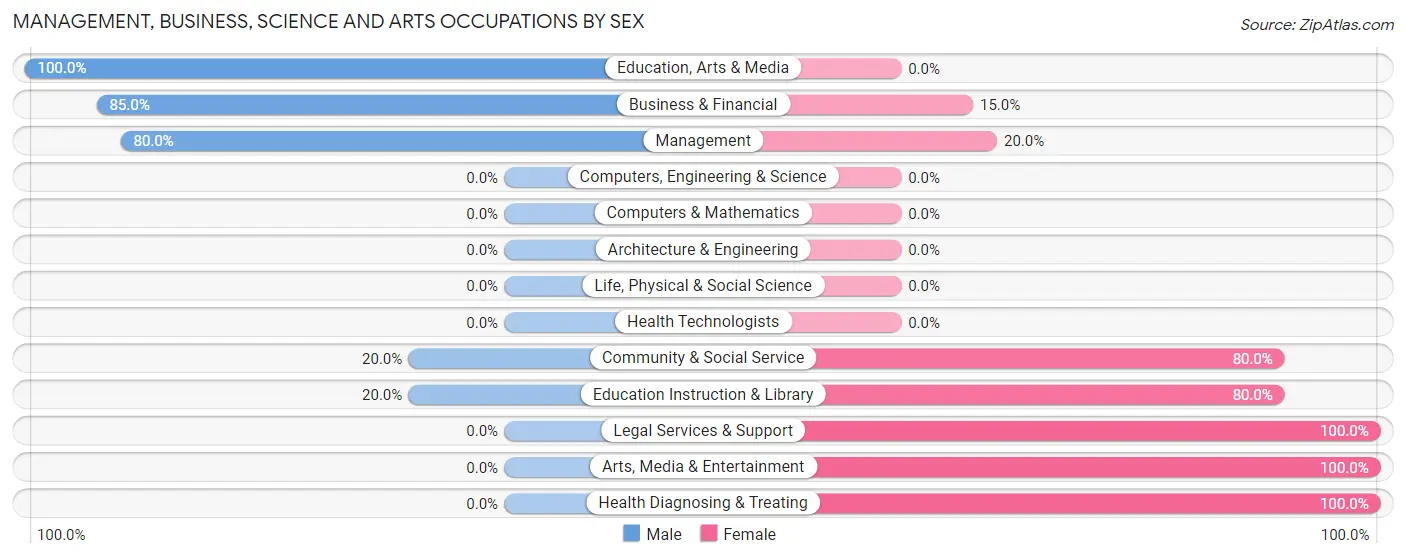
Management, Business, Science and Arts Occupations by Sex
Within the Management, Business, Science and Arts occupations in Pembina, the most male-oriented occupations are Education, Arts & Media (100.0%), Business & Financial (85.0%), and Management (80.0%), while the most female-oriented occupations are Legal Services & Support (100.0%), Arts, Media & Entertainment (100.0%), and Health Diagnosing & Treating (100.0%).
| Occupation | Male | Female |
| Management | 20 (80.0%) | 5 (20.0%) |
| Business & Financial | 17 (85.0%) | 3 (15.0%) |
| Computers, Engineering & Science | 0 (0.0%) | 0 (0.0%) |
| Computers & Mathematics | 0 (0.0%) | 0 (0.0%) |
| Architecture & Engineering | 0 (0.0%) | 0 (0.0%) |
| Life, Physical & Social Science | 0 (0.0%) | 0 (0.0%) |
| Community & Social Service | 4 (20.0%) | 16 (80.0%) |
| Education, Arts & Media | 2 (100.0%) | 0 (0.0%) |
| Legal Services & Support | 0 (0.0%) | 3 (100.0%) |
| Education Instruction & Library | 2 (20.0%) | 8 (80.0%) |
| Arts, Media & Entertainment | 0 (0.0%) | 5 (100.0%) |
| Health Diagnosing & Treating | 0 (0.0%) | 2 (100.0%) |
| Health Technologists | 0 (0.0%) | 0 (0.0%) |
| Total (Category) | 41 (61.2%) | 26 (38.8%) |
| Total (Overall) | 153 (60.7%) | 99 (39.3%) |
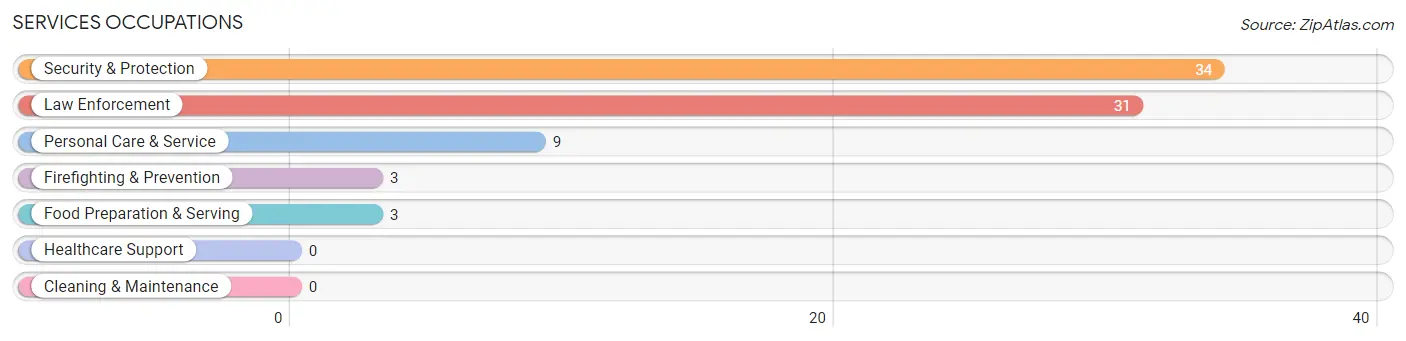
Services Occupations
The most common Services occupations in Pembina are Security & Protection (34 | 13.5%), Law Enforcement (31 | 12.3%), Personal Care & Service (9 | 3.6%), Firefighting & Prevention (3 | 1.2%), and Food Preparation & Serving (3 | 1.2%).
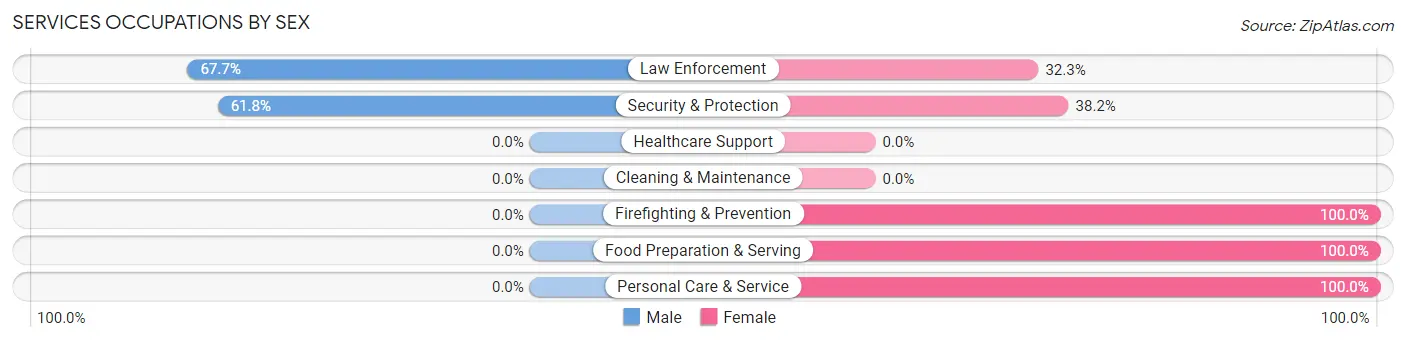
Services Occupations by Sex
Within the Services occupations in Pembina, the most male-oriented occupations are Law Enforcement (67.7%), and Security & Protection (61.8%), while the most female-oriented occupations are Firefighting & Prevention (100.0%), Food Preparation & Serving (100.0%), and Personal Care & Service (100.0%).
| Occupation | Male | Female |
| Healthcare Support | 0 (0.0%) | 0 (0.0%) |
| Security & Protection | 21 (61.8%) | 13 (38.2%) |
| Firefighting & Prevention | 0 (0.0%) | 3 (100.0%) |
| Law Enforcement | 21 (67.7%) | 10 (32.3%) |
| Food Preparation & Serving | 0 (0.0%) | 3 (100.0%) |
| Cleaning & Maintenance | 0 (0.0%) | 0 (0.0%) |
| Personal Care & Service | 0 (0.0%) | 9 (100.0%) |
| Total (Category) | 21 (45.7%) | 25 (54.3%) |
| Total (Overall) | 153 (60.7%) | 99 (39.3%) |
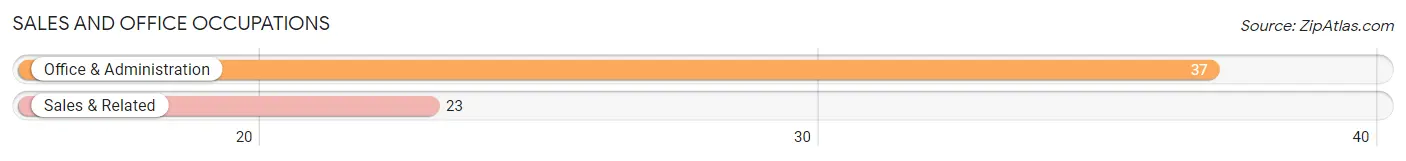
Sales and Office Occupations
The most common Sales and Office occupations in Pembina are Office & Administration (37 | 14.7%), and Sales & Related (23 | 9.1%).
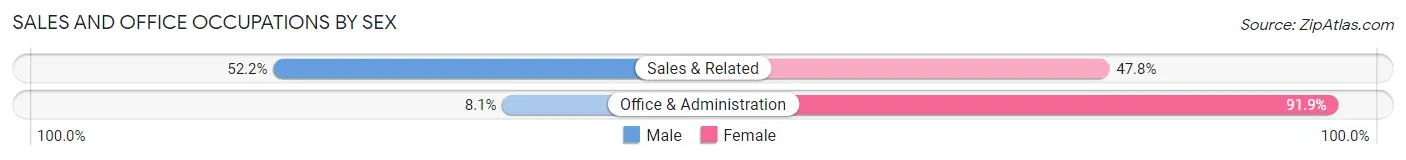
Sales and Office Occupations by Sex
| Occupation | Male | Female |
| Sales & Related | 12 (52.2%) | 11 (47.8%) |
| Office & Administration | 3 (8.1%) | 34 (91.9%) |
| Total (Category) | 15 (25.0%) | 45 (75.0%) |
| Total (Overall) | 153 (60.7%) | 99 (39.3%) |
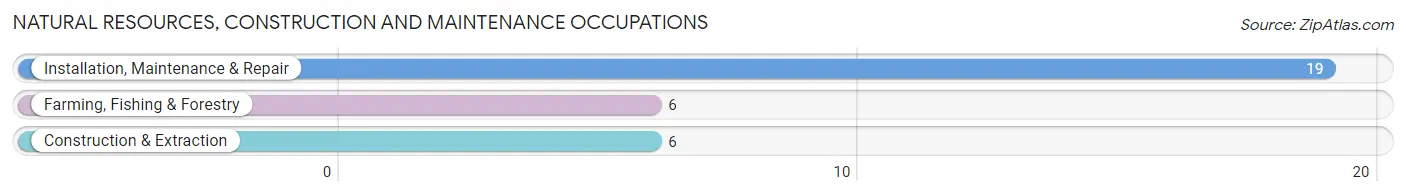
Natural Resources, Construction and Maintenance Occupations
The most common Natural Resources, Construction and Maintenance occupations in Pembina are Installation, Maintenance & Repair (19 | 7.5%), Farming, Fishing & Forestry (6 | 2.4%), and Construction & Extraction (6 | 2.4%).
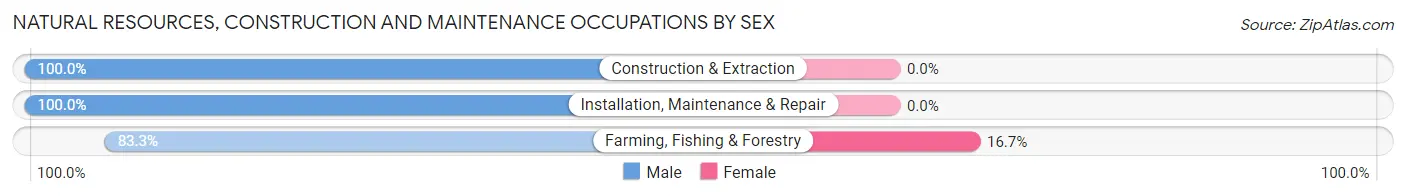
Natural Resources, Construction and Maintenance Occupations by Sex
| Occupation | Male | Female |
| Farming, Fishing & Forestry | 5 (83.3%) | 1 (16.7%) |
| Construction & Extraction | 6 (100.0%) | 0 (0.0%) |
| Installation, Maintenance & Repair | 19 (100.0%) | 0 (0.0%) |
| Total (Category) | 30 (96.8%) | 1 (3.2%) |
| Total (Overall) | 153 (60.7%) | 99 (39.3%) |
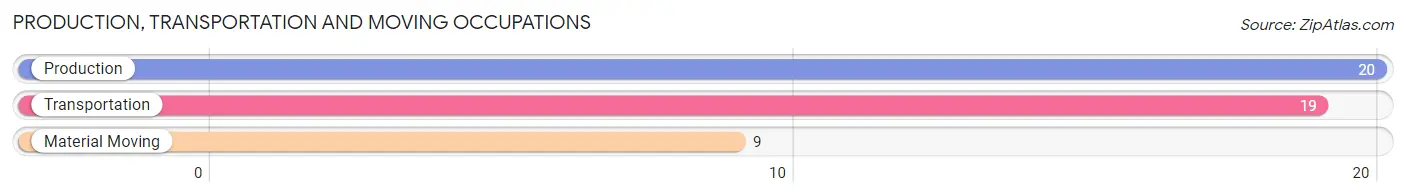
Production, Transportation and Moving Occupations
The most common Production, Transportation and Moving occupations in Pembina are Production (20 | 7.9%), Transportation (19 | 7.5%), and Material Moving (9 | 3.6%).
Production, Transportation and Moving Occupations by Sex
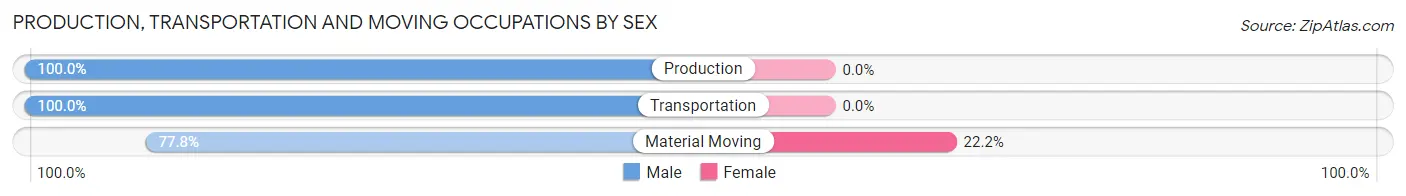
| Occupation | Male | Female |
| Production | 20 (100.0%) | 0 (0.0%) |
| Transportation | 19 (100.0%) | 0 (0.0%) |
| Material Moving | 7 (77.8%) | 2 (22.2%) |
| Total (Category) | 46 (95.8%) | 2 (4.2%) |
| Total (Overall) | 153 (60.7%) | 99 (39.3%) |
Employment Industries by Sex in Pembina
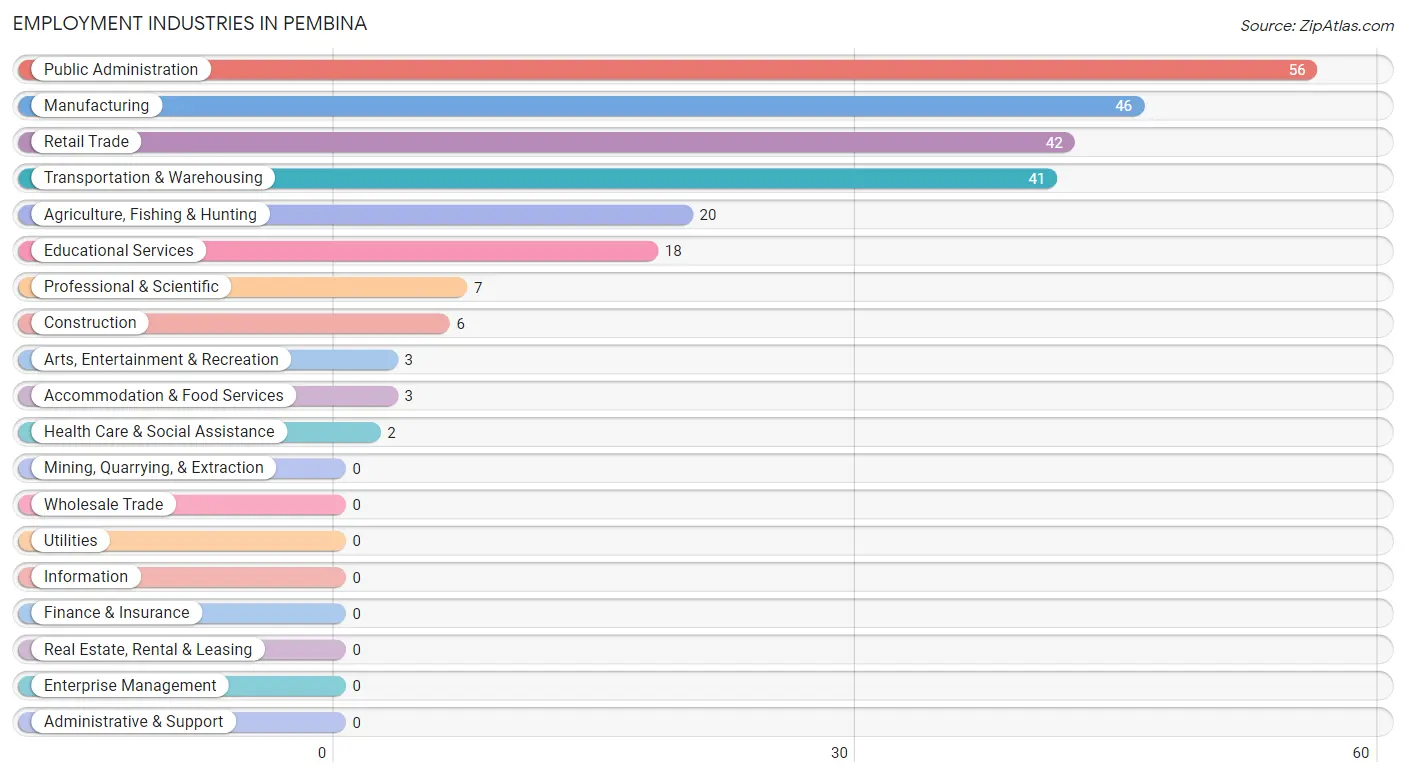
Employment Industries in Pembina
The major employment industries in Pembina include Public Administration (56 | 22.2%), Manufacturing (46 | 18.2%), Retail Trade (42 | 16.7%), Transportation & Warehousing (41 | 16.3%), and Agriculture, Fishing & Hunting (20 | 7.9%).
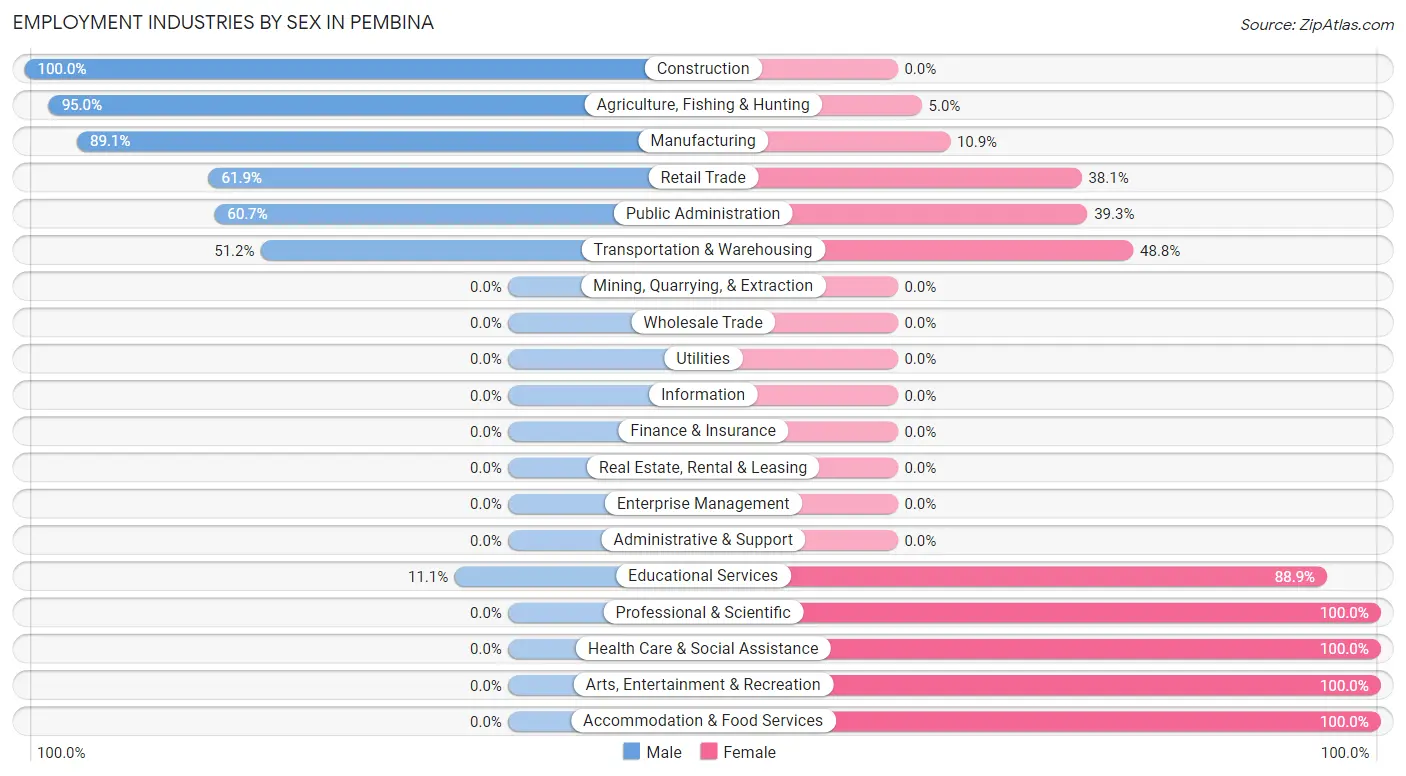
Employment Industries by Sex in Pembina
The Pembina industries that see more men than women are Construction (100.0%), Agriculture, Fishing & Hunting (95.0%), and Manufacturing (89.1%), whereas the industries that tend to have a higher number of women are Professional & Scientific (100.0%), Health Care & Social Assistance (100.0%), and Arts, Entertainment & Recreation (100.0%).
| Industry | Male | Female |
| Agriculture, Fishing & Hunting | 19 (95.0%) | 1 (5.0%) |
| Mining, Quarrying, & Extraction | 0 (0.0%) | 0 (0.0%) |
| Construction | 6 (100.0%) | 0 (0.0%) |
| Manufacturing | 41 (89.1%) | 5 (10.9%) |
| Wholesale Trade | 0 (0.0%) | 0 (0.0%) |
| Retail Trade | 26 (61.9%) | 16 (38.1%) |
| Transportation & Warehousing | 21 (51.2%) | 20 (48.8%) |
| Utilities | 0 (0.0%) | 0 (0.0%) |
| Information | 0 (0.0%) | 0 (0.0%) |
| Finance & Insurance | 0 (0.0%) | 0 (0.0%) |
| Real Estate, Rental & Leasing | 0 (0.0%) | 0 (0.0%) |
| Professional & Scientific | 0 (0.0%) | 7 (100.0%) |
| Enterprise Management | 0 (0.0%) | 0 (0.0%) |
| Administrative & Support | 0 (0.0%) | 0 (0.0%) |
| Educational Services | 2 (11.1%) | 16 (88.9%) |
| Health Care & Social Assistance | 0 (0.0%) | 2 (100.0%) |
| Arts, Entertainment & Recreation | 0 (0.0%) | 3 (100.0%) |
| Accommodation & Food Services | 0 (0.0%) | 3 (100.0%) |
| Public Administration | 34 (60.7%) | 22 (39.3%) |
| Total | 153 (60.7%) | 99 (39.3%) |
Education in Pembina
School Enrollment in Pembina
The most common levels of schooling among the 102 students in Pembina are high school (32 | 31.4%), middle school (29 | 28.4%), and elementary school (17 | 16.7%).
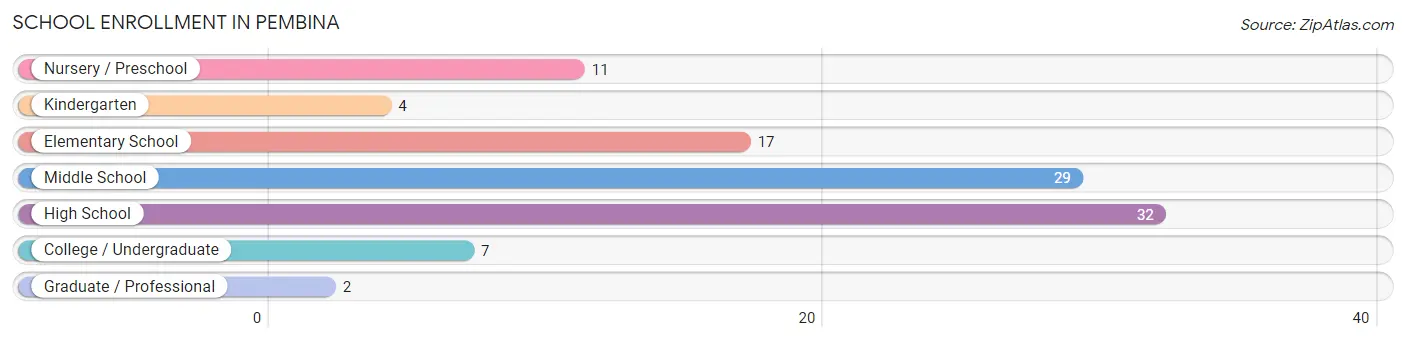
| School Level | # Students | % Students |
| Nursery / Preschool | 11 | 10.8% |
| Kindergarten | 4 | 3.9% |
| Elementary School | 17 | 16.7% |
| Middle School | 29 | 28.4% |
| High School | 32 | 31.4% |
| College / Undergraduate | 7 | 6.9% |
| Graduate / Professional | 2 | 2.0% |
| Total | 102 | 100.0% |
School Enrollment by Age by Funding Source in Pembina
Out of a total of 102 students who are enrolled in schools in Pembina, 34 (33.3%) attend a private institution, while the remaining 68 (66.7%) are enrolled in public schools. The age group of 10 to 14 year olds has the highest likelihood of being enrolled in private schools, with 20 (57.1% in the age bracket) enrolled. Conversely, the age group of 18 to 19 year olds has the lowest likelihood of being enrolled in a private school, with 10 (100.0% in the age bracket) attending a public institution.
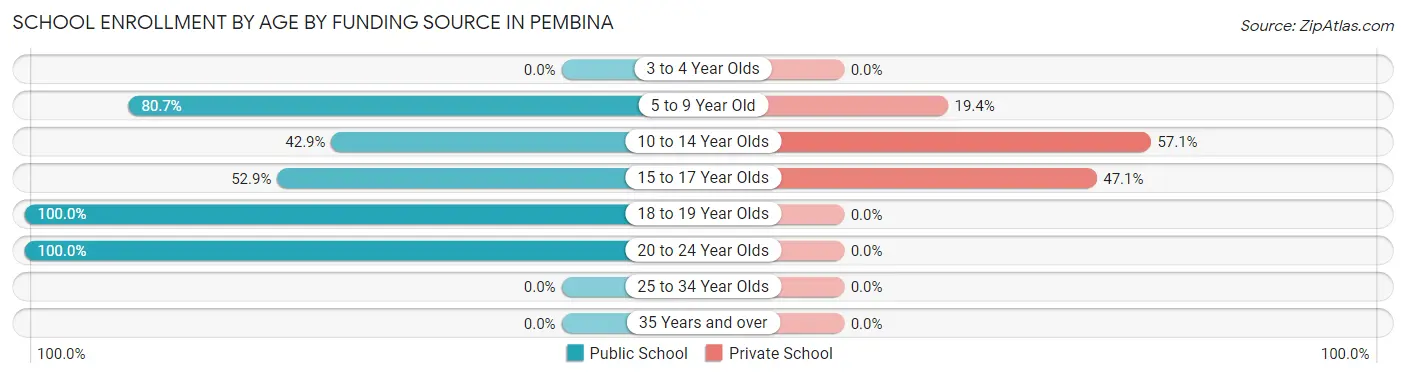
| Age Bracket | Public School | Private School |
| 3 to 4 Year Olds | 0 (0.0%) | 0 (0.0%) |
| 5 to 9 Year Old | 25 (80.6%) | 6 (19.4%) |
| 10 to 14 Year Olds | 15 (42.9%) | 20 (57.1%) |
| 15 to 17 Year Olds | 9 (52.9%) | 8 (47.1%) |
| 18 to 19 Year Olds | 10 (100.0%) | 0 (0.0%) |
| 20 to 24 Year Olds | 9 (100.0%) | 0 (0.0%) |
| 25 to 34 Year Olds | 0 (0.0%) | 0 (0.0%) |
| 35 Years and over | 0 (0.0%) | 0 (0.0%) |
| Total | 68 (66.7%) | 34 (33.3%) |
Educational Attainment by Field of Study in Pembina
Arts & humanities (21 | 29.2%), education (16 | 22.2%), business (12 | 16.7%), social sciences (8 | 11.1%), and science & technology (5 | 6.9%) are the most common fields of study among 72 individuals in Pembina who have obtained a bachelor's degree or higher.
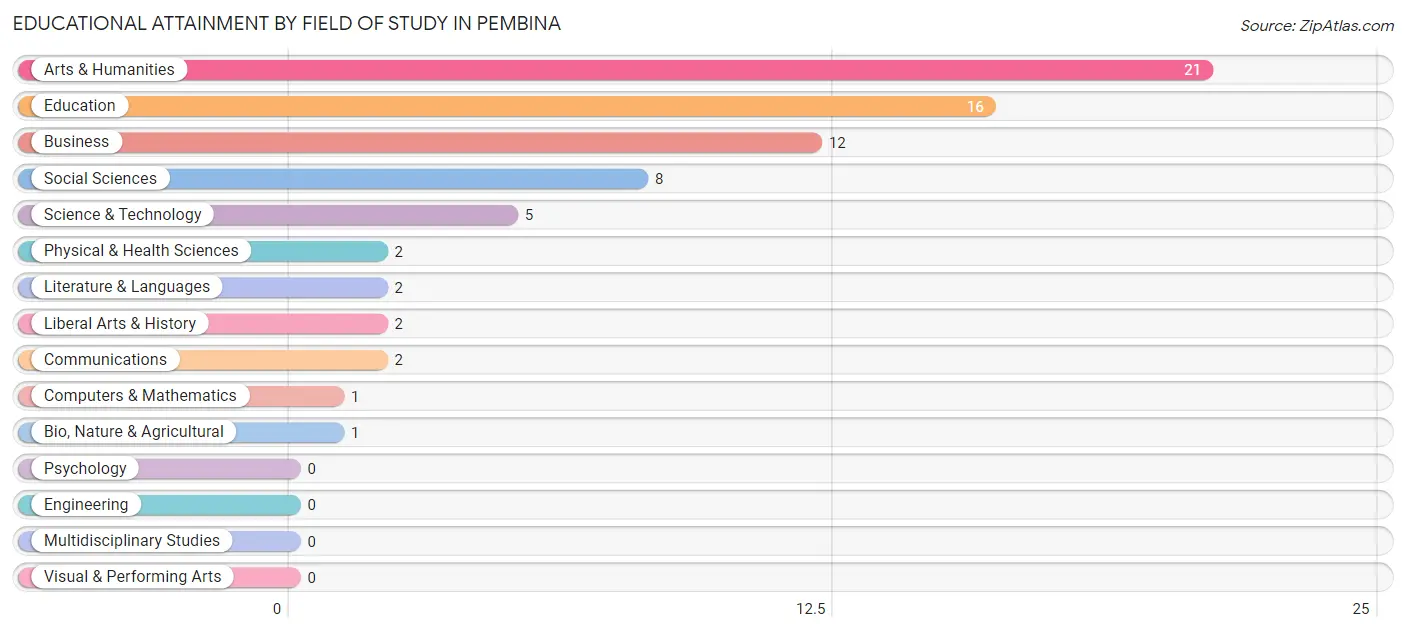
| Field of Study | # Graduates | % Graduates |
| Computers & Mathematics | 1 | 1.4% |
| Bio, Nature & Agricultural | 1 | 1.4% |
| Physical & Health Sciences | 2 | 2.8% |
| Psychology | 0 | 0.0% |
| Social Sciences | 8 | 11.1% |
| Engineering | 0 | 0.0% |
| Multidisciplinary Studies | 0 | 0.0% |
| Science & Technology | 5 | 6.9% |
| Business | 12 | 16.7% |
| Education | 16 | 22.2% |
| Literature & Languages | 2 | 2.8% |
| Liberal Arts & History | 2 | 2.8% |
| Visual & Performing Arts | 0 | 0.0% |
| Communications | 2 | 2.8% |
| Arts & Humanities | 21 | 29.2% |
| Total | 72 | 100.0% |
Transportation & Commute in Pembina
Vehicle Availability by Sex in Pembina
The most prevalent vehicle ownership categories in Pembina are males with 2 vehicles (80, accounting for 53.3%) and females with 2 vehicles (31, making up 86.0%).
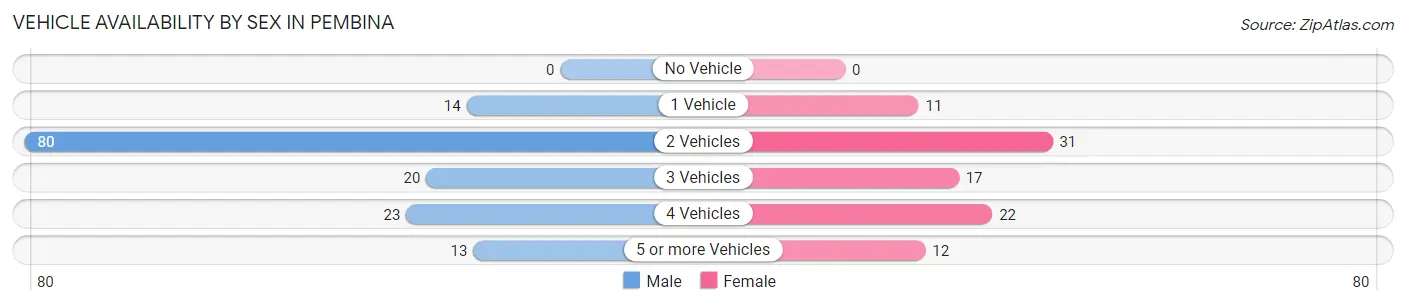
| Vehicles Available | Male | Female |
| No Vehicle | 0 (0.0%) | 0 (0.0%) |
| 1 Vehicle | 14 (9.3%) | 11 (11.8%) |
| 2 Vehicles | 80 (53.3%) | 31 (33.3%) |
| 3 Vehicles | 20 (13.3%) | 17 (18.3%) |
| 4 Vehicles | 23 (15.3%) | 22 (23.7%) |
| 5 or more Vehicles | 13 (8.7%) | 12 (12.9%) |
| Total | 150 (100.0%) | 93 (100.0%) |
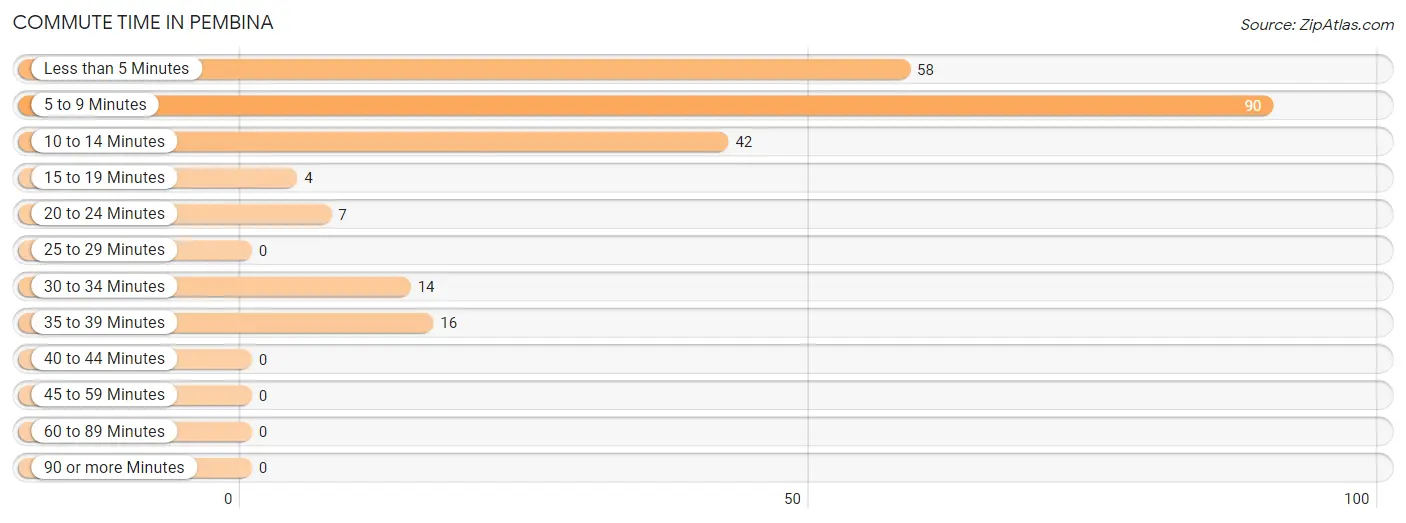
Commute Time in Pembina
The most frequently occuring commute durations in Pembina are 5 to 9 minutes (90 commuters, 39.0%), less than 5 minutes (58 commuters, 25.1%), and 10 to 14 minutes (42 commuters, 18.2%).
| Commute Time | # Commuters | % Commuters |
| Less than 5 Minutes | 58 | 25.1% |
| 5 to 9 Minutes | 90 | 39.0% |
| 10 to 14 Minutes | 42 | 18.2% |
| 15 to 19 Minutes | 4 | 1.7% |
| 20 to 24 Minutes | 7 | 3.0% |
| 25 to 29 Minutes | 0 | 0.0% |
| 30 to 34 Minutes | 14 | 6.1% |
| 35 to 39 Minutes | 16 | 6.9% |
| 40 to 44 Minutes | 0 | 0.0% |
| 45 to 59 Minutes | 0 | 0.0% |
| 60 to 89 Minutes | 0 | 0.0% |
| 90 or more Minutes | 0 | 0.0% |
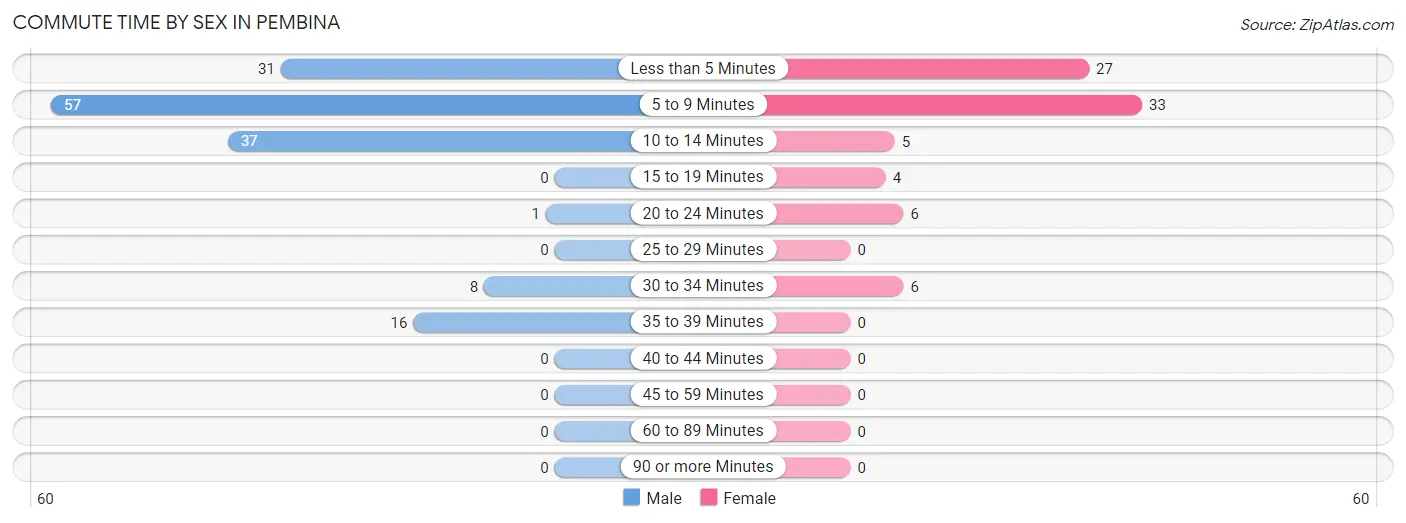
Commute Time by Sex in Pembina
The most common commute times in Pembina are 5 to 9 minutes (57 commuters, 38.0%) for males and 5 to 9 minutes (33 commuters, 40.7%) for females.
| Commute Time | Male | Female |
| Less than 5 Minutes | 31 (20.7%) | 27 (33.3%) |
| 5 to 9 Minutes | 57 (38.0%) | 33 (40.7%) |
| 10 to 14 Minutes | 37 (24.7%) | 5 (6.2%) |
| 15 to 19 Minutes | 0 (0.0%) | 4 (4.9%) |
| 20 to 24 Minutes | 1 (0.7%) | 6 (7.4%) |
| 25 to 29 Minutes | 0 (0.0%) | 0 (0.0%) |
| 30 to 34 Minutes | 8 (5.3%) | 6 (7.4%) |
| 35 to 39 Minutes | 16 (10.7%) | 0 (0.0%) |
| 40 to 44 Minutes | 0 (0.0%) | 0 (0.0%) |
| 45 to 59 Minutes | 0 (0.0%) | 0 (0.0%) |
| 60 to 89 Minutes | 0 (0.0%) | 0 (0.0%) |
| 90 or more Minutes | 0 (0.0%) | 0 (0.0%) |
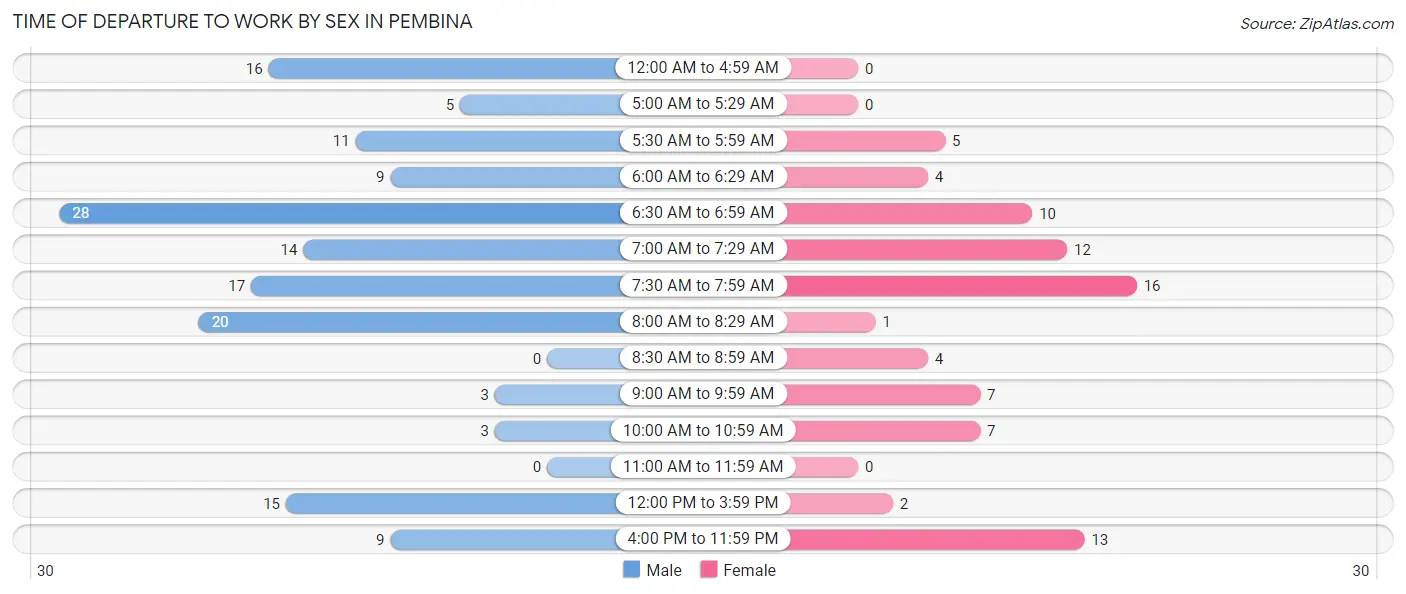
Time of Departure to Work by Sex in Pembina
The most frequent times of departure to work in Pembina are 6:30 AM to 6:59 AM (28, 18.7%) for males and 7:30 AM to 7:59 AM (16, 19.8%) for females.
| Time of Departure | Male | Female |
| 12:00 AM to 4:59 AM | 16 (10.7%) | 0 (0.0%) |
| 5:00 AM to 5:29 AM | 5 (3.3%) | 0 (0.0%) |
| 5:30 AM to 5:59 AM | 11 (7.3%) | 5 (6.2%) |
| 6:00 AM to 6:29 AM | 9 (6.0%) | 4 (4.9%) |
| 6:30 AM to 6:59 AM | 28 (18.7%) | 10 (12.3%) |
| 7:00 AM to 7:29 AM | 14 (9.3%) | 12 (14.8%) |
| 7:30 AM to 7:59 AM | 17 (11.3%) | 16 (19.8%) |
| 8:00 AM to 8:29 AM | 20 (13.3%) | 1 (1.2%) |
| 8:30 AM to 8:59 AM | 0 (0.0%) | 4 (4.9%) |
| 9:00 AM to 9:59 AM | 3 (2.0%) | 7 (8.6%) |
| 10:00 AM to 10:59 AM | 3 (2.0%) | 7 (8.6%) |
| 11:00 AM to 11:59 AM | 0 (0.0%) | 0 (0.0%) |
| 12:00 PM to 3:59 PM | 15 (10.0%) | 2 (2.5%) |
| 4:00 PM to 11:59 PM | 9 (6.0%) | 13 (16.1%) |
| Total | 150 (100.0%) | 81 (100.0%) |
Housing Occupancy in Pembina
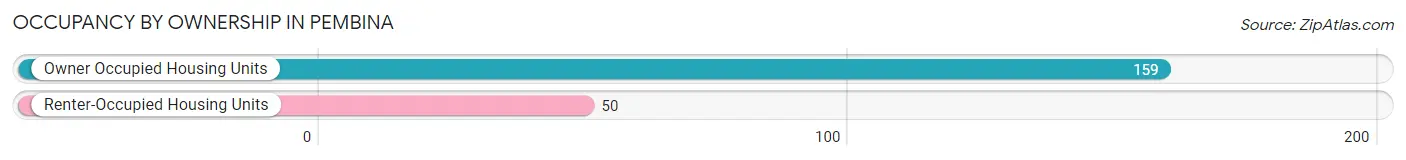
Occupancy by Ownership in Pembina
Of the total 209 dwellings in Pembina, owner-occupied units account for 159 (76.1%), while renter-occupied units make up 50 (23.9%).
| Occupancy | # Housing Units | % Housing Units |
| Owner Occupied Housing Units | 159 | 76.1% |
| Renter-Occupied Housing Units | 50 | 23.9% |
| Total Occupied Housing Units | 209 | 100.0% |
Occupancy by Household Size in Pembina
| Household Size | # Housing Units | % Housing Units |
| 1-Person Household | 64 | 30.6% |
| 2-Person Household | 77 | 36.8% |
| 3-Person Household | 16 | 7.7% |
| 4+ Person Household | 52 | 24.9% |
| Total Housing Units | 209 | 100.0% |
Occupancy by Ownership by Household Size in Pembina
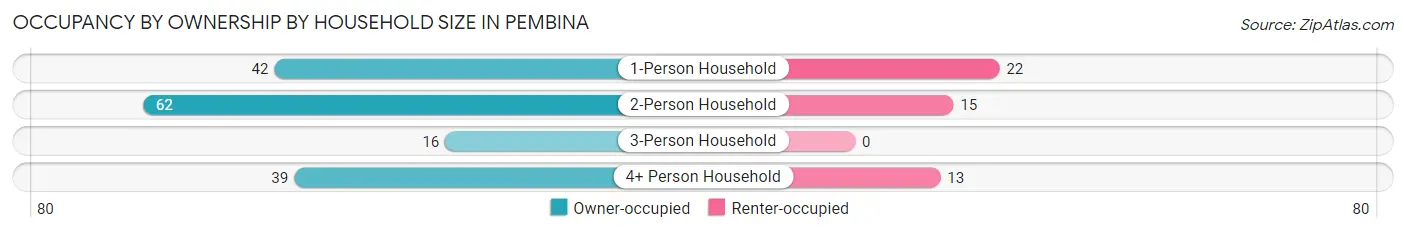
| Household Size | Owner-occupied | Renter-occupied |
| 1-Person Household | 42 (65.6%) | 22 (34.4%) |
| 2-Person Household | 62 (80.5%) | 15 (19.5%) |
| 3-Person Household | 16 (100.0%) | 0 (0.0%) |
| 4+ Person Household | 39 (75.0%) | 13 (25.0%) |
| Total Housing Units | 159 (76.1%) | 50 (23.9%) |
Occupancy by Educational Attainment in Pembina
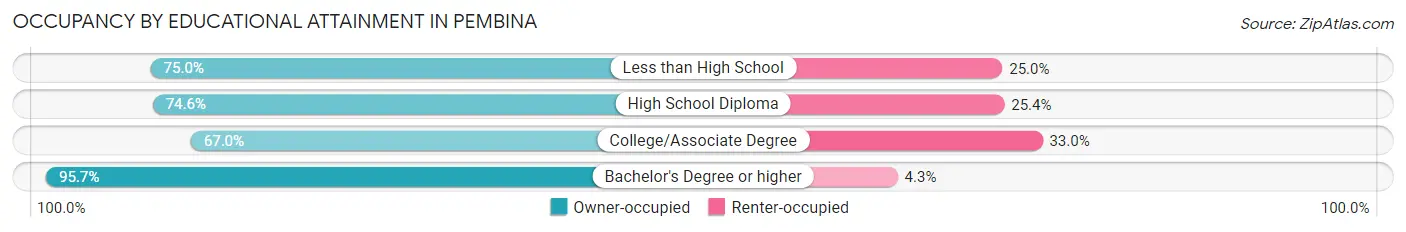
| Household Size | Owner-occupied | Renter-occupied |
| Less than High School | 6 (75.0%) | 2 (25.0%) |
| High School Diploma | 47 (74.6%) | 16 (25.4%) |
| College/Associate Degree | 61 (67.0%) | 30 (33.0%) |
| Bachelor's Degree or higher | 45 (95.7%) | 2 (4.3%) |
Occupancy by Age of Householder in Pembina

| Age Bracket | # Households | % Households |
| Under 35 Years | 29 | 13.9% |
| 35 to 44 Years | 42 | 20.1% |
| 45 to 54 Years | 28 | 13.4% |
| 55 to 64 Years | 34 | 16.3% |
| 65 to 74 Years | 46 | 22.0% |
| 75 to 84 Years | 16 | 7.7% |
| 85 Years and Over | 14 | 6.7% |
| Total | 209 | 100.0% |
Housing Finances in Pembina
Median Income by Occupancy in Pembina
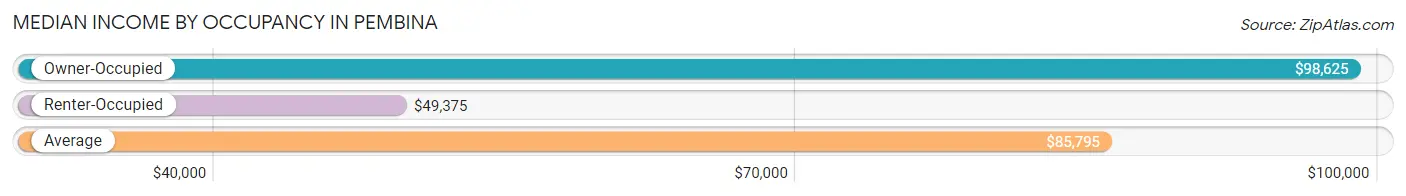
| Occupancy Type | # Households | Median Income |
| Owner-Occupied | 159 (76.1%) | $98,625 |
| Renter-Occupied | 50 (23.9%) | $49,375 |
| Average | 209 (100.0%) | $85,795 |
Occupancy by Householder Income Bracket in Pembina
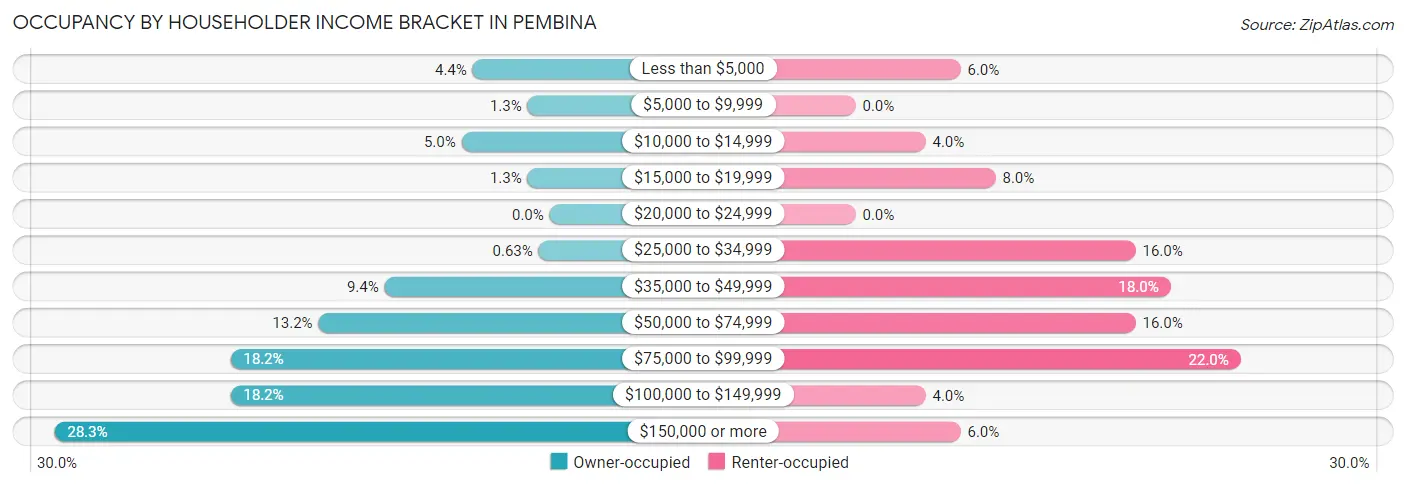
| Income Bracket | Owner-occupied | Renter-occupied |
| Less than $5,000 | 7 (4.4%) | 3 (6.0%) |
| $5,000 to $9,999 | 2 (1.3%) | 0 (0.0%) |
| $10,000 to $14,999 | 8 (5.0%) | 2 (4.0%) |
| $15,000 to $19,999 | 2 (1.3%) | 4 (8.0%) |
| $20,000 to $24,999 | 0 (0.0%) | 0 (0.0%) |
| $25,000 to $34,999 | 1 (0.6%) | 8 (16.0%) |
| $35,000 to $49,999 | 15 (9.4%) | 9 (18.0%) |
| $50,000 to $74,999 | 21 (13.2%) | 8 (16.0%) |
| $75,000 to $99,999 | 29 (18.2%) | 11 (22.0%) |
| $100,000 to $149,999 | 29 (18.2%) | 2 (4.0%) |
| $150,000 or more | 45 (28.3%) | 3 (6.0%) |
| Total | 159 (100.0%) | 50 (100.0%) |
Monthly Housing Cost Tiers in Pembina
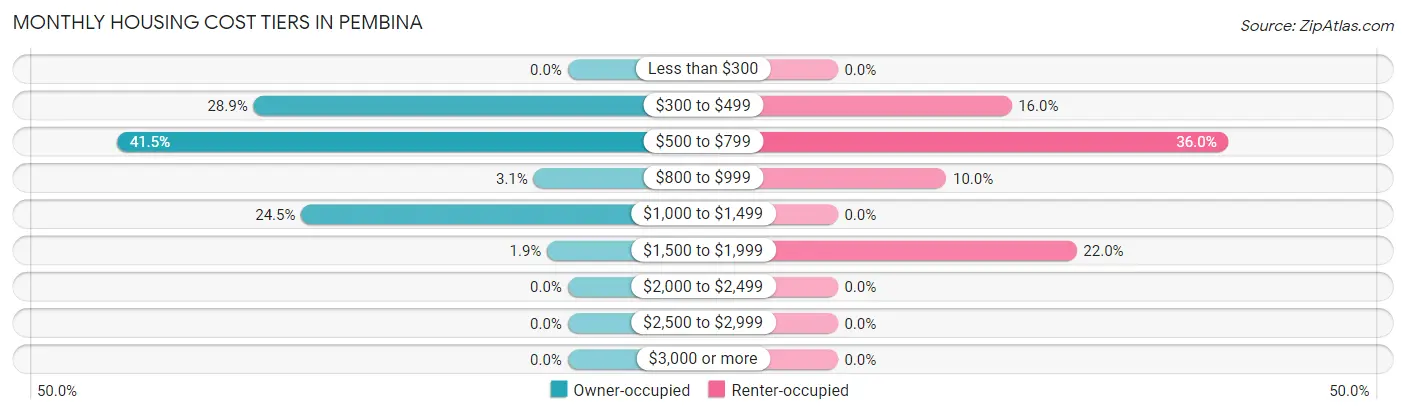
| Monthly Cost | Owner-occupied | Renter-occupied |
| Less than $300 | 0 (0.0%) | 0 (0.0%) |
| $300 to $499 | 46 (28.9%) | 8 (16.0%) |
| $500 to $799 | 66 (41.5%) | 18 (36.0%) |
| $800 to $999 | 5 (3.1%) | 5 (10.0%) |
| $1,000 to $1,499 | 39 (24.5%) | 0 (0.0%) |
| $1,500 to $1,999 | 3 (1.9%) | 11 (22.0%) |
| $2,000 to $2,499 | 0 (0.0%) | 0 (0.0%) |
| $2,500 to $2,999 | 0 (0.0%) | 0 (0.0%) |
| $3,000 or more | 0 (0.0%) | 0 (0.0%) |
| Total | 159 (100.0%) | 50 (100.0%) |
Physical Housing Characteristics in Pembina
Housing Structures in Pembina
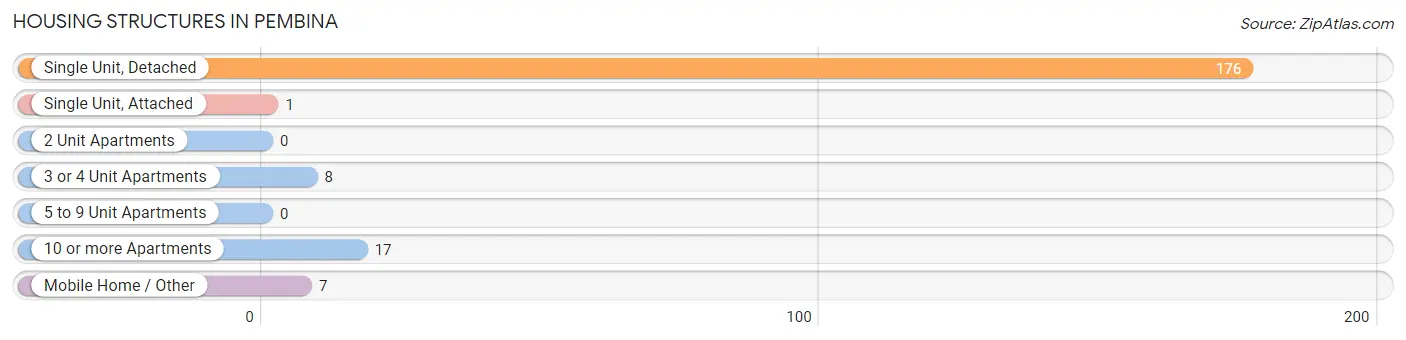
| Structure Type | # Housing Units | % Housing Units |
| Single Unit, Detached | 176 | 84.2% |
| Single Unit, Attached | 1 | 0.5% |
| 2 Unit Apartments | 0 | 0.0% |
| 3 or 4 Unit Apartments | 8 | 3.8% |
| 5 to 9 Unit Apartments | 0 | 0.0% |
| 10 or more Apartments | 17 | 8.1% |
| Mobile Home / Other | 7 | 3.4% |
| Total | 209 | 100.0% |
Housing Structures by Occupancy in Pembina
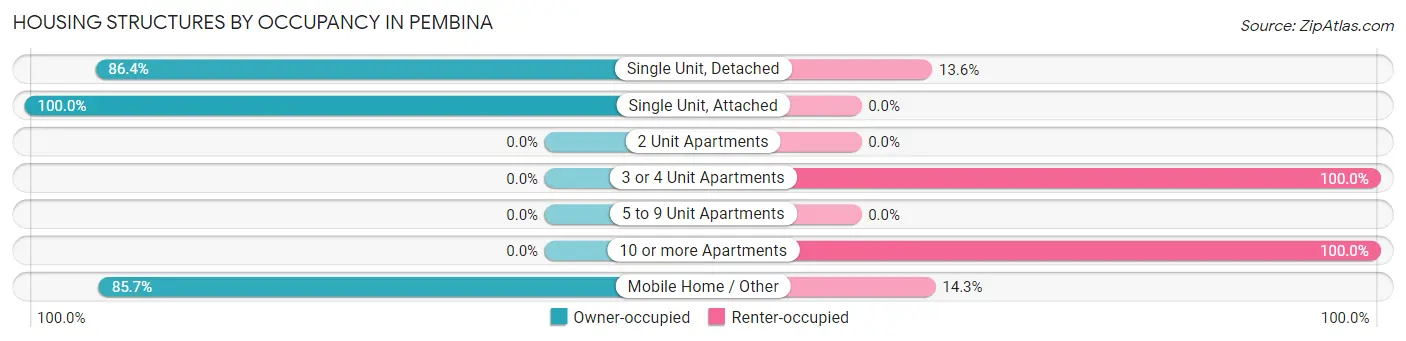
| Structure Type | Owner-occupied | Renter-occupied |
| Single Unit, Detached | 152 (86.4%) | 24 (13.6%) |
| Single Unit, Attached | 1 (100.0%) | 0 (0.0%) |
| 2 Unit Apartments | 0 (0.0%) | 0 (0.0%) |
| 3 or 4 Unit Apartments | 0 (0.0%) | 8 (100.0%) |
| 5 to 9 Unit Apartments | 0 (0.0%) | 0 (0.0%) |
| 10 or more Apartments | 0 (0.0%) | 17 (100.0%) |
| Mobile Home / Other | 6 (85.7%) | 1 (14.3%) |
| Total | 159 (76.1%) | 50 (23.9%) |
Housing Structures by Number of Rooms in Pembina
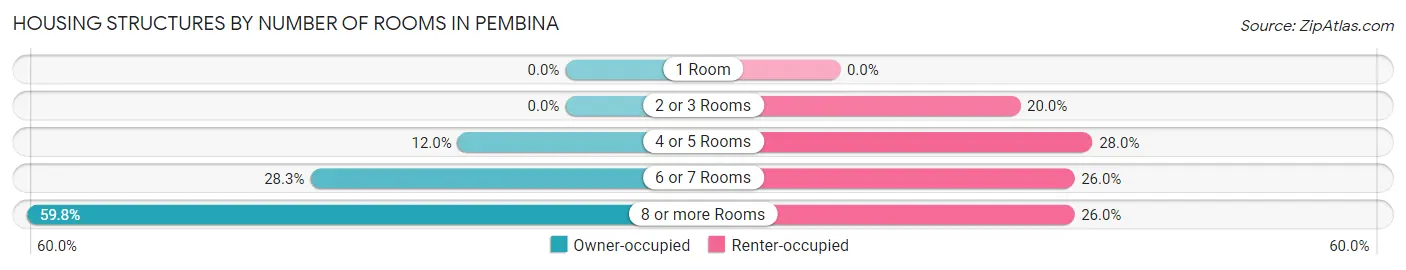
| Number of Rooms | Owner-occupied | Renter-occupied |
| 1 Room | 0 (0.0%) | 0 (0.0%) |
| 2 or 3 Rooms | 0 (0.0%) | 10 (20.0%) |
| 4 or 5 Rooms | 19 (11.9%) | 14 (28.0%) |
| 6 or 7 Rooms | 45 (28.3%) | 13 (26.0%) |
| 8 or more Rooms | 95 (59.8%) | 13 (26.0%) |
| Total | 159 (100.0%) | 50 (100.0%) |
Housing Structure by Heating Type in Pembina
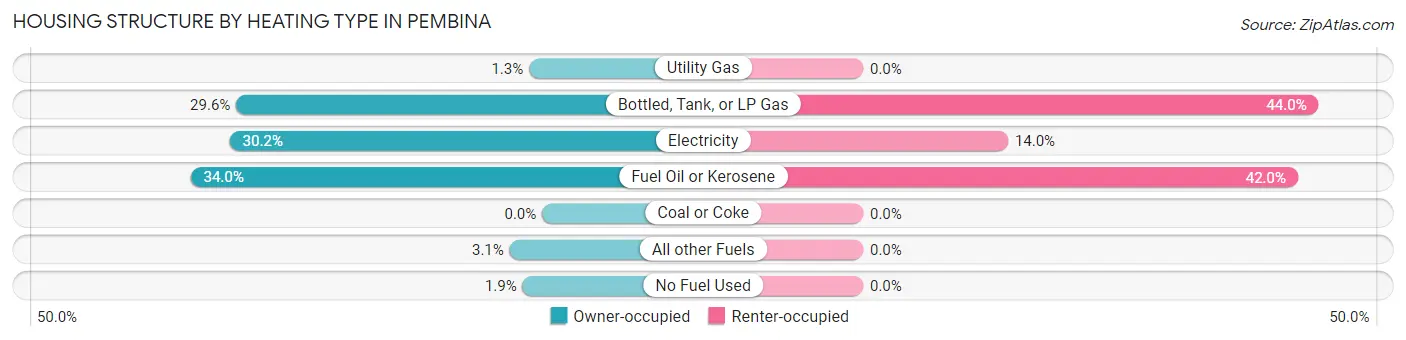
| Heating Type | Owner-occupied | Renter-occupied |
| Utility Gas | 2 (1.3%) | 0 (0.0%) |
| Bottled, Tank, or LP Gas | 47 (29.6%) | 22 (44.0%) |
| Electricity | 48 (30.2%) | 7 (14.0%) |
| Fuel Oil or Kerosene | 54 (34.0%) | 21 (42.0%) |
| Coal or Coke | 0 (0.0%) | 0 (0.0%) |
| All other Fuels | 5 (3.1%) | 0 (0.0%) |
| No Fuel Used | 3 (1.9%) | 0 (0.0%) |
| Total | 159 (100.0%) | 50 (100.0%) |
Household Vehicle Usage in Pembina
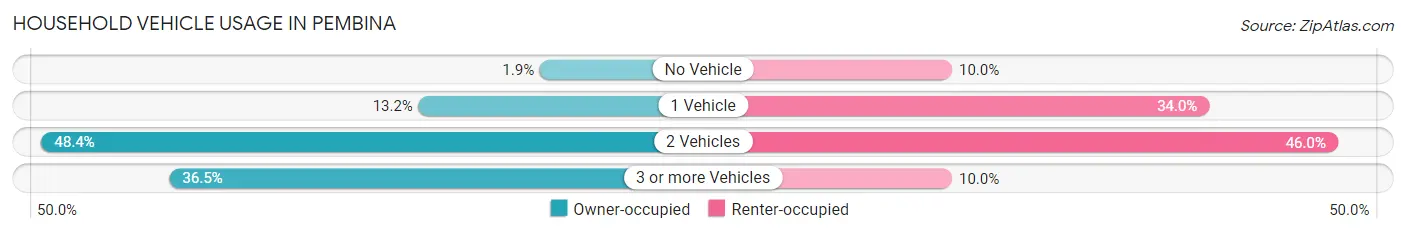
| Vehicles per Household | Owner-occupied | Renter-occupied |
| No Vehicle | 3 (1.9%) | 5 (10.0%) |
| 1 Vehicle | 21 (13.2%) | 17 (34.0%) |
| 2 Vehicles | 77 (48.4%) | 23 (46.0%) |
| 3 or more Vehicles | 58 (36.5%) | 5 (10.0%) |
| Total | 159 (100.0%) | 50 (100.0%) |
Real Estate & Mortgages in Pembina
Real Estate and Mortgage Overview in Pembina
| Characteristic | Without Mortgage | With Mortgage |
| Housing Units | 105 | 54 |
| Median Property Value | $107,700 | $161,400 |
| Median Household Income | $81,250 | $18 |
| Monthly Housing Costs | $534 | $0 |
| Real Estate Taxes | $1,573 | $0 |
Property Value by Mortgage Status in Pembina
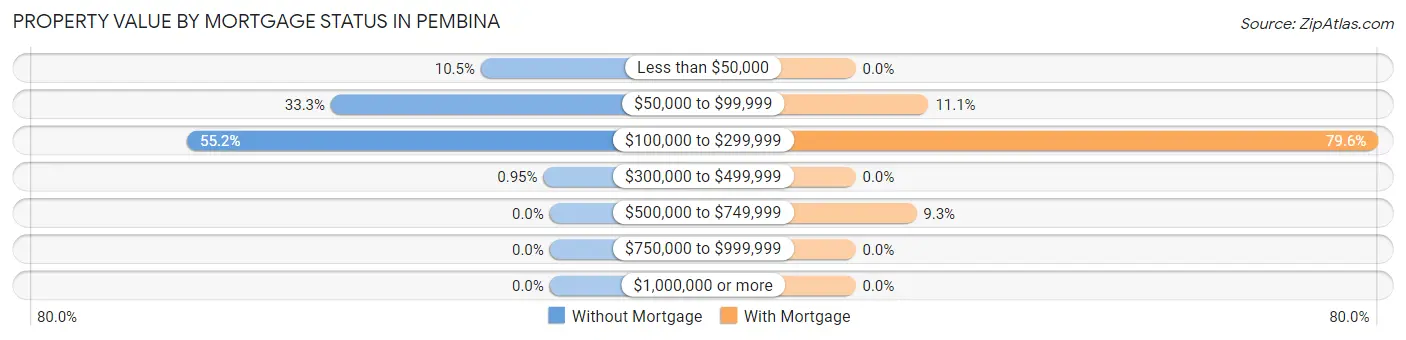
| Property Value | Without Mortgage | With Mortgage |
| Less than $50,000 | 11 (10.5%) | 0 (0.0%) |
| $50,000 to $99,999 | 35 (33.3%) | 6 (11.1%) |
| $100,000 to $299,999 | 58 (55.2%) | 43 (79.6%) |
| $300,000 to $499,999 | 1 (0.9%) | 0 (0.0%) |
| $500,000 to $749,999 | 0 (0.0%) | 5 (9.3%) |
| $750,000 to $999,999 | 0 (0.0%) | 0 (0.0%) |
| $1,000,000 or more | 0 (0.0%) | 0 (0.0%) |
| Total | 105 (100.0%) | 54 (100.0%) |
Household Income by Mortgage Status in Pembina
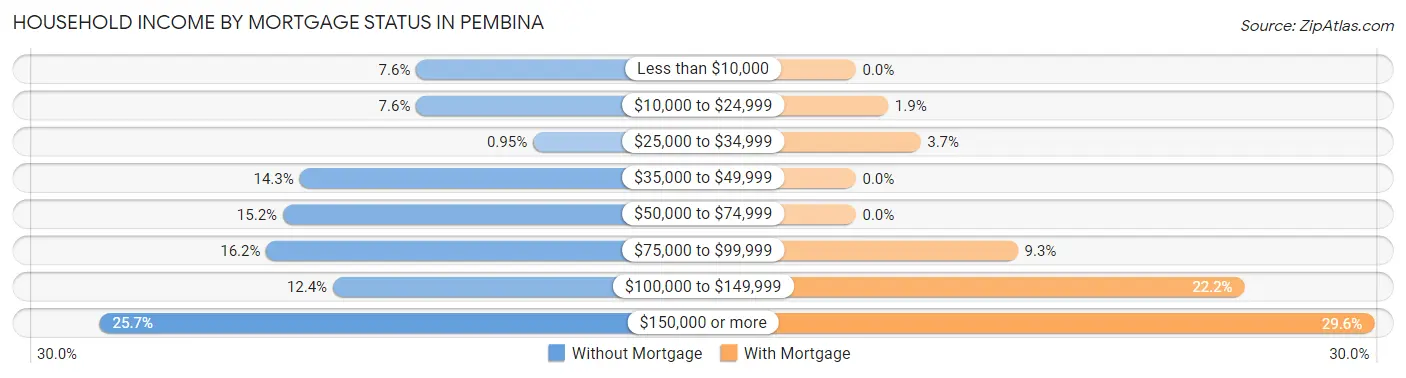
| Household Income | Without Mortgage | With Mortgage |
| Less than $10,000 | 8 (7.6%) | 0 (0.0%) |
| $10,000 to $24,999 | 8 (7.6%) | 1 (1.8%) |
| $25,000 to $34,999 | 1 (0.9%) | 2 (3.7%) |
| $35,000 to $49,999 | 15 (14.3%) | 0 (0.0%) |
| $50,000 to $74,999 | 16 (15.2%) | 0 (0.0%) |
| $75,000 to $99,999 | 17 (16.2%) | 5 (9.3%) |
| $100,000 to $149,999 | 13 (12.4%) | 12 (22.2%) |
| $150,000 or more | 27 (25.7%) | 16 (29.6%) |
| Total | 105 (100.0%) | 54 (100.0%) |
Property Value to Household Income Ratio in Pembina
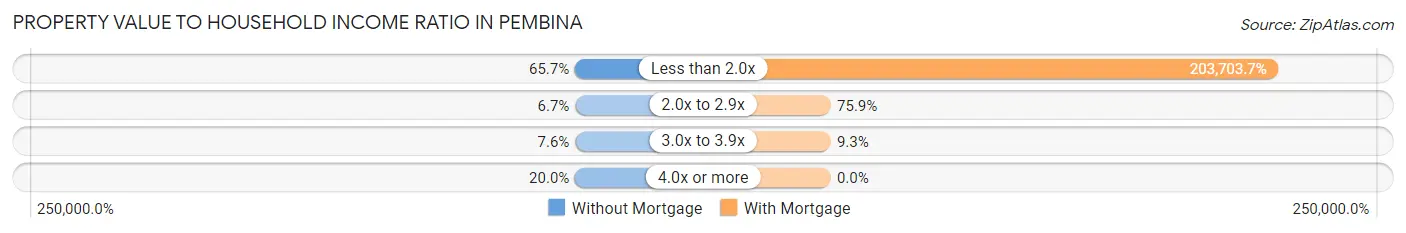
| Value-to-Income Ratio | Without Mortgage | With Mortgage |
| Less than 2.0x | 69 (65.7%) | 110,000 (203,703.7%) |
| 2.0x to 2.9x | 7 (6.7%) | 41 (75.9%) |
| 3.0x to 3.9x | 8 (7.6%) | 5 (9.3%) |
| 4.0x or more | 21 (20.0%) | 0 (0.0%) |
| Total | 105 (100.0%) | 54 (100.0%) |
Real Estate Taxes by Mortgage Status in Pembina
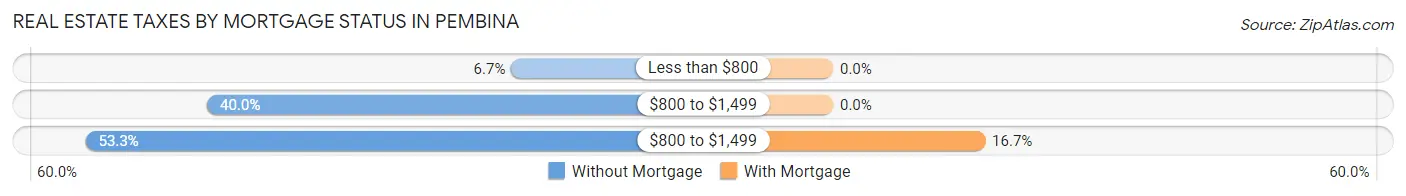
| Property Taxes | Without Mortgage | With Mortgage |
| Less than $800 | 7 (6.7%) | 0 (0.0%) |
| $800 to $1,499 | 42 (40.0%) | 0 (0.0%) |
| $800 to $1,499 | 56 (53.3%) | 9 (16.7%) |
| Total | 105 (100.0%) | 54 (100.0%) |
Health & Disability in Pembina
Health Insurance Coverage by Age in Pembina
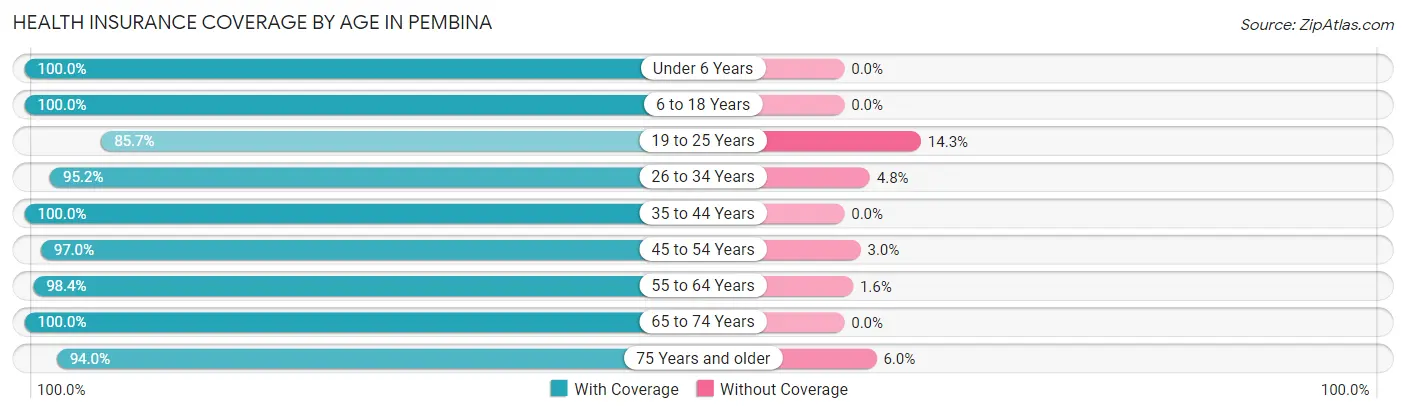
| Age Bracket | With Coverage | Without Coverage |
| Under 6 Years | 63 (100.0%) | 0 (0.0%) |
| 6 to 18 Years | 78 (100.0%) | 0 (0.0%) |
| 19 to 25 Years | 18 (85.7%) | 3 (14.3%) |
| 26 to 34 Years | 60 (95.2%) | 3 (4.8%) |
| 35 to 44 Years | 81 (100.0%) | 0 (0.0%) |
| 45 to 54 Years | 64 (97.0%) | 2 (3.0%) |
| 55 to 64 Years | 61 (98.4%) | 1 (1.6%) |
| 65 to 74 Years | 68 (100.0%) | 0 (0.0%) |
| 75 Years and older | 47 (94.0%) | 3 (6.0%) |
| Total | 540 (97.8%) | 12 (2.2%) |
Health Insurance Coverage by Citizenship Status in Pembina
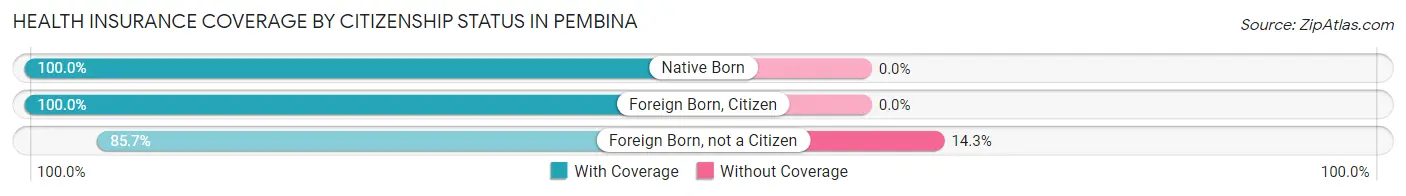
| Citizenship Status | With Coverage | Without Coverage |
| Native Born | 63 (100.0%) | 0 (0.0%) |
| Foreign Born, Citizen | 78 (100.0%) | 0 (0.0%) |
| Foreign Born, not a Citizen | 18 (85.7%) | 3 (14.3%) |
Health Insurance Coverage by Household Income in Pembina
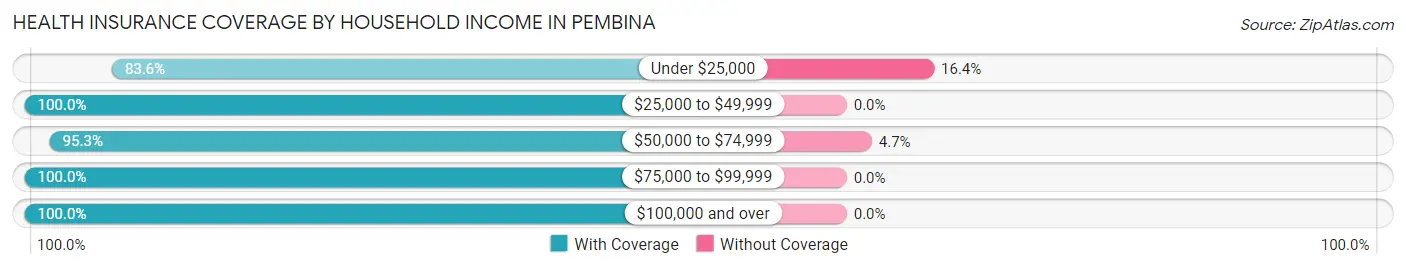
| Household Income | With Coverage | Without Coverage |
| Under $25,000 | 46 (83.6%) | 9 (16.4%) |
| $25,000 to $49,999 | 45 (100.0%) | 0 (0.0%) |
| $50,000 to $74,999 | 61 (95.3%) | 3 (4.7%) |
| $75,000 to $99,999 | 124 (100.0%) | 0 (0.0%) |
| $100,000 and over | 264 (100.0%) | 0 (0.0%) |
Public vs Private Health Insurance Coverage by Age in Pembina
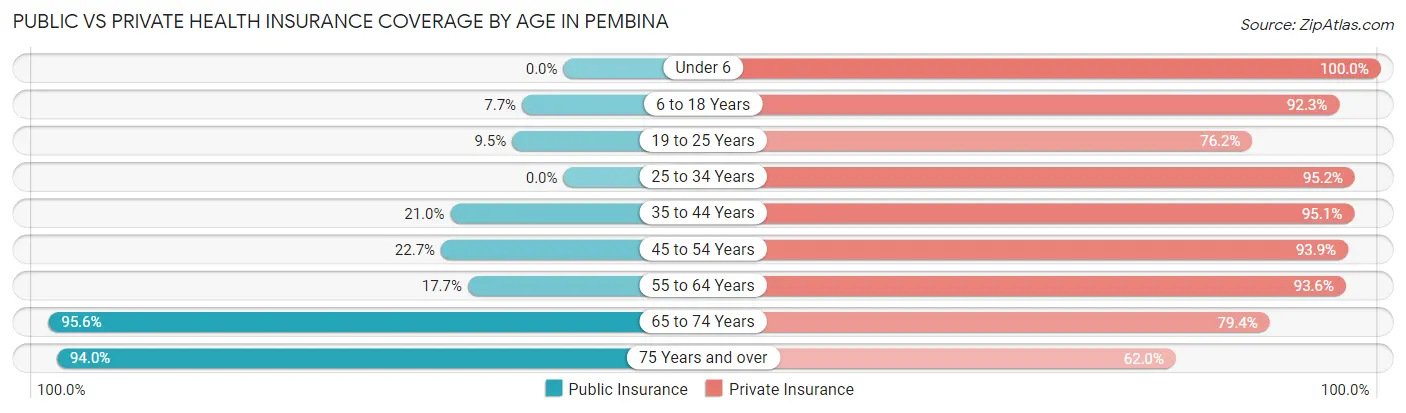
| Age Bracket | Public Insurance | Private Insurance |
| Under 6 | 0 (0.0%) | 63 (100.0%) |
| 6 to 18 Years | 6 (7.7%) | 72 (92.3%) |
| 19 to 25 Years | 2 (9.5%) | 16 (76.2%) |
| 25 to 34 Years | 0 (0.0%) | 60 (95.2%) |
| 35 to 44 Years | 17 (21.0%) | 77 (95.1%) |
| 45 to 54 Years | 15 (22.7%) | 62 (93.9%) |
| 55 to 64 Years | 11 (17.7%) | 58 (93.5%) |
| 65 to 74 Years | 65 (95.6%) | 54 (79.4%) |
| 75 Years and over | 47 (94.0%) | 31 (62.0%) |
| Total | 163 (29.5%) | 493 (89.3%) |
Disability Status by Sex by Age in Pembina
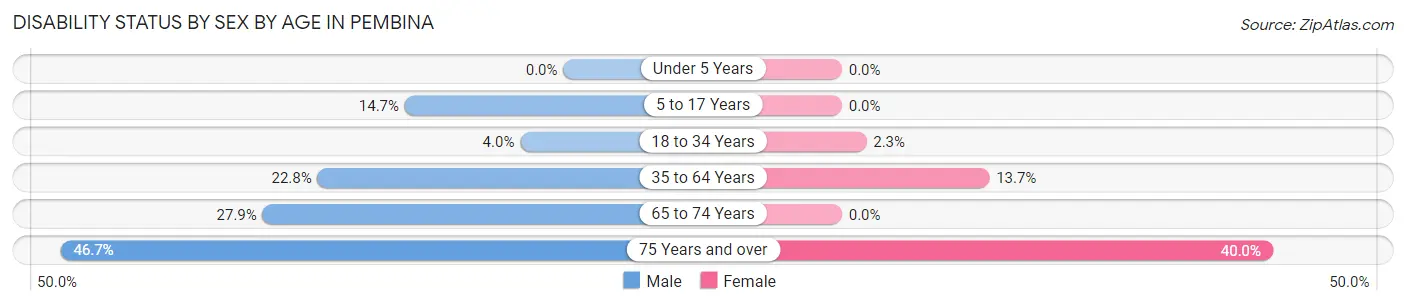
| Age Bracket | Male | Female |
| Under 5 Years | 0 (0.0%) | 0 (0.0%) |
| 5 to 17 Years | 5 (14.7%) | 0 (0.0%) |
| 18 to 34 Years | 2 (4.0%) | 1 (2.3%) |
| 35 to 64 Years | 26 (22.8%) | 13 (13.7%) |
| 65 to 74 Years | 12 (27.9%) | 0 (0.0%) |
| 75 Years and over | 7 (46.7%) | 14 (40.0%) |
Disability Class by Sex by Age in Pembina
Disability Class: Hearing Difficulty
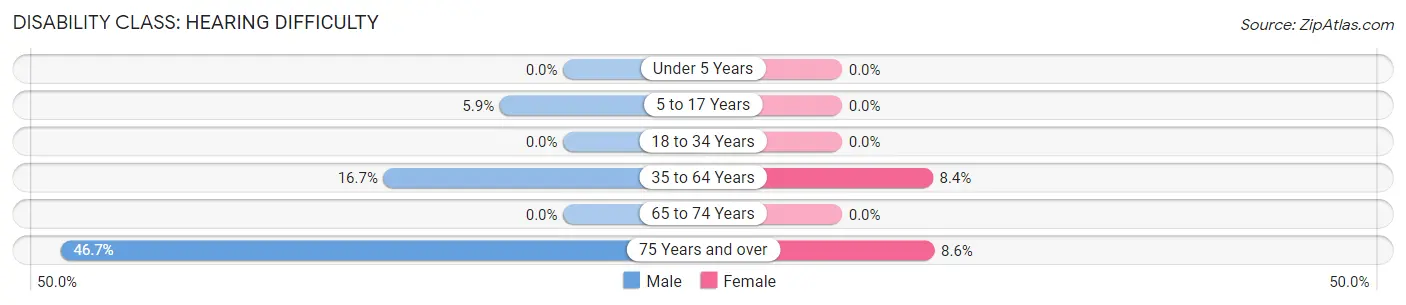
| Age Bracket | Male | Female |
| Under 5 Years | 0 (0.0%) | 0 (0.0%) |
| 5 to 17 Years | 2 (5.9%) | 0 (0.0%) |
| 18 to 34 Years | 0 (0.0%) | 0 (0.0%) |
| 35 to 64 Years | 19 (16.7%) | 8 (8.4%) |
| 65 to 74 Years | 0 (0.0%) | 0 (0.0%) |
| 75 Years and over | 7 (46.7%) | 3 (8.6%) |
Disability Class: Vision Difficulty
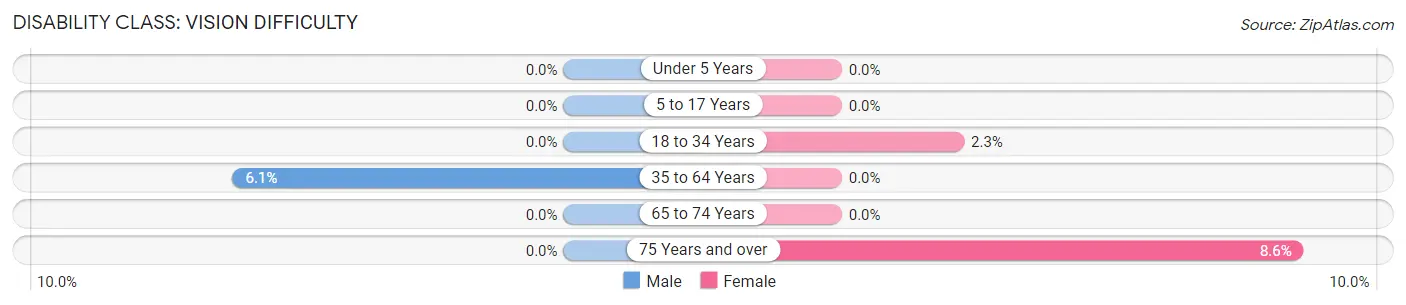
| Age Bracket | Male | Female |
| Under 5 Years | 0 (0.0%) | 0 (0.0%) |
| 5 to 17 Years | 0 (0.0%) | 0 (0.0%) |
| 18 to 34 Years | 0 (0.0%) | 1 (2.3%) |
| 35 to 64 Years | 7 (6.1%) | 0 (0.0%) |
| 65 to 74 Years | 0 (0.0%) | 0 (0.0%) |
| 75 Years and over | 0 (0.0%) | 3 (8.6%) |
Disability Class: Cognitive Difficulty
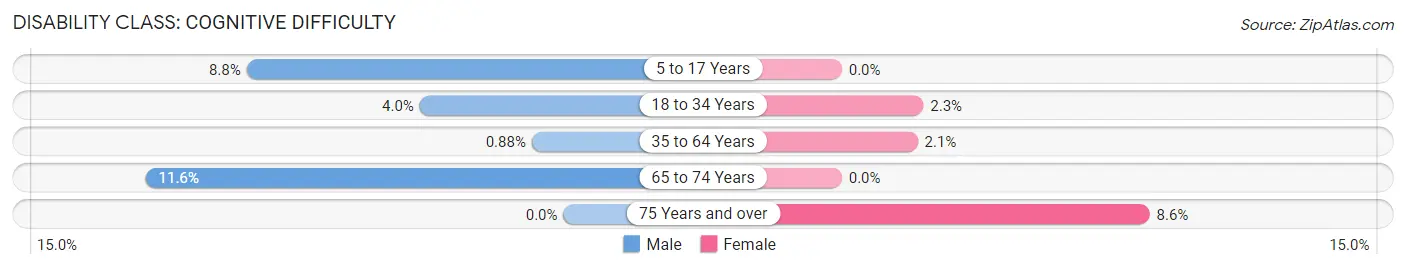
| Age Bracket | Male | Female |
| 5 to 17 Years | 3 (8.8%) | 0 (0.0%) |
| 18 to 34 Years | 2 (4.0%) | 1 (2.3%) |
| 35 to 64 Years | 1 (0.9%) | 2 (2.1%) |
| 65 to 74 Years | 5 (11.6%) | 0 (0.0%) |
| 75 Years and over | 0 (0.0%) | 3 (8.6%) |
Disability Class: Ambulatory Difficulty
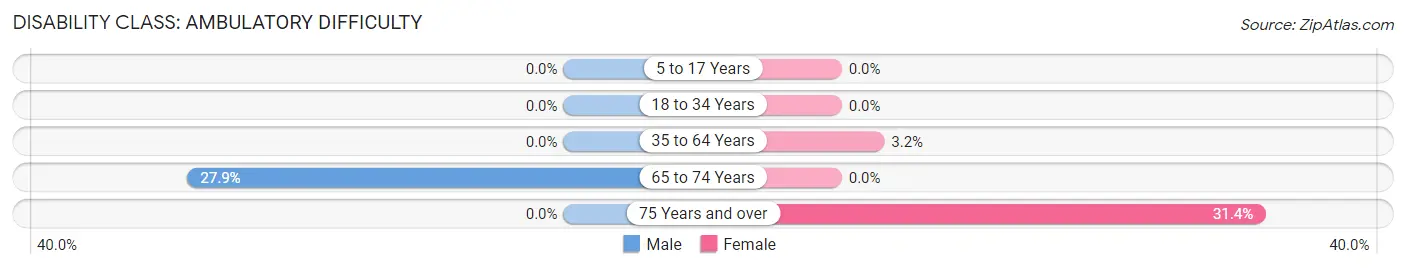
| Age Bracket | Male | Female |
| 5 to 17 Years | 0 (0.0%) | 0 (0.0%) |
| 18 to 34 Years | 0 (0.0%) | 0 (0.0%) |
| 35 to 64 Years | 0 (0.0%) | 3 (3.2%) |
| 65 to 74 Years | 12 (27.9%) | 0 (0.0%) |
| 75 Years and over | 0 (0.0%) | 11 (31.4%) |
Disability Class: Self-Care Difficulty
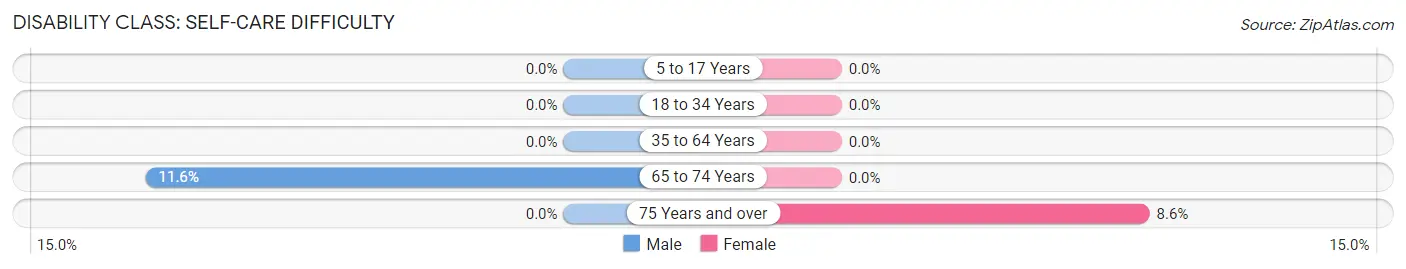
| Age Bracket | Male | Female |
| 5 to 17 Years | 0 (0.0%) | 0 (0.0%) |
| 18 to 34 Years | 0 (0.0%) | 0 (0.0%) |
| 35 to 64 Years | 0 (0.0%) | 0 (0.0%) |
| 65 to 74 Years | 5 (11.6%) | 0 (0.0%) |
| 75 Years and over | 0 (0.0%) | 3 (8.6%) |
Technology Access in Pembina
Computing Device Access in Pembina
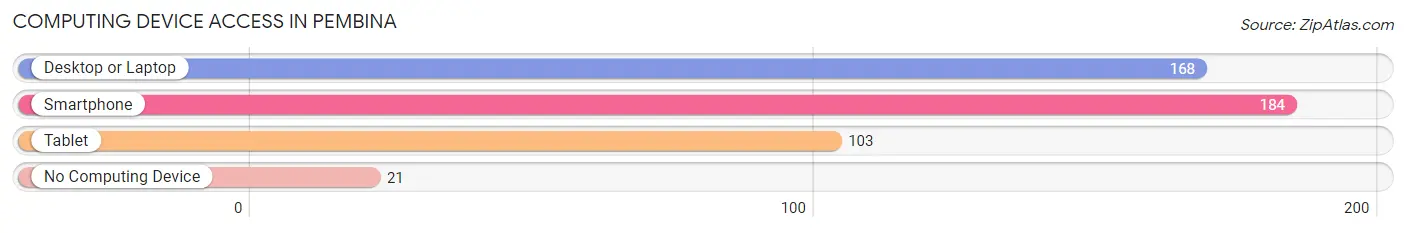
| Device Type | # Households | % Households |
| Desktop or Laptop | 168 | 80.4% |
| Smartphone | 184 | 88.0% |
| Tablet | 103 | 49.3% |
| No Computing Device | 21 | 10.1% |
| Total | 209 | 100.0% |
Internet Access in Pembina
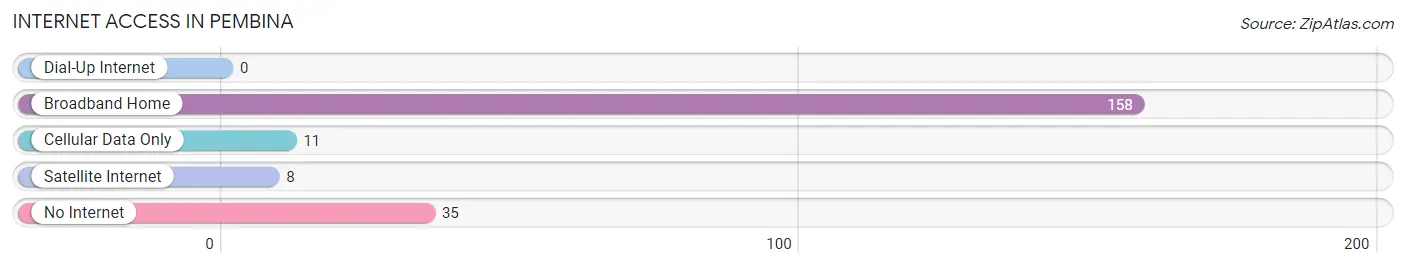
| Internet Type | # Households | % Households |
| Dial-Up Internet | 0 | 0.0% |
| Broadband Home | 158 | 75.6% |
| Cellular Data Only | 11 | 5.3% |
| Satellite Internet | 8 | 3.8% |
| No Internet | 35 | 16.8% |
| Total | 209 | 100.0% |
Pembina Summary
Pembina is a small city located in the northeastern corner of North Dakota, United States. It is the county seat of Pembina County and is situated along the Red River of the North. The city has a population of 1,521 as of the 2010 census.
Geography
Pembina is located at the intersection of U.S. Route 81 and North Dakota Highway 18. It is situated on the Red River of the North, which forms the border between North Dakota and Minnesota. The city is located in the Red River Valley, a flat, fertile region of the Great Plains. The city is surrounded by agricultural land, with the Pembina Hills to the west and the Turtle Mountains to the east.
Climate
Pembina has a humid continental climate, with cold, dry winters and hot, humid summers. The average annual temperature is 43°F (6°C), with an average high of 68°F (20°C) in July and an average low of 17°F (-8°C) in January. The average annual precipitation is 19.5 inches (495 mm).
History
The area around Pembina was first settled by French-Canadian fur traders in the late 1700s. The city was founded in 1812 and was named after the nearby Pembina River. The city was incorporated in 1883 and became the county seat of Pembina County in 1885.
The city was an important trading post for the fur trade and was a major stop on the Red River Trails, a network of trails used by traders and settlers to travel between the Great Lakes and the Red River Valley. The city was also an important stop on the Northern Pacific Railway, which was completed in 1883.
Economy
The economy of Pembina is largely based on agriculture. The city is home to several grain elevators and is a major center for the production of wheat, barley, oats, and other grains. The city is also home to several manufacturing companies, including a canning factory, a flour mill, and a furniture factory.
Demographics
As of the 2010 census, the population of Pembina was 1,521. The racial makeup of the city was 97.2% White, 0.3% African American, 0.2% Native American, 0.2% Asian, 0.1% Pacific Islander, 0.7% from other races, and 1.3% from two or more races. Hispanic or Latino of any race were 1.7% of the population.
The median income for a household in Pembina was $37,917, and the median income for a family was $45,938. The per capita income for the city was $18,945. About 8.2% of families and 10.2% of the population were below the poverty line, including 13.2% of those under age 18 and 8.3% of those age 65 or over.
Common Questions
What is Per Capita Income in Pembina?
Per Capita income in Pembina is $37,716.
What is the Median Family Income in Pembina?
Median Family Income in Pembina is $105,750.
What is the Median Household income in Pembina?
Median Household Income in Pembina is $85,795.
What is Income or Wage Gap in Pembina?
Income or Wage Gap in Pembina is 58.8%.
Women in Pembina earn 41.2 cents for every dollar earned by a man.
What is Inequality or Gini Index in Pembina?
Inequality or Gini Index in Pembina is 0.39.
What is the Total Population of Pembina?
Total Population of Pembina is 552.
What is the Total Male Population of Pembina?
Total Male Population of Pembina is 290.
What is the Total Female Population of Pembina?
Total Female Population of Pembina is 262.
What is the Ratio of Males per 100 Females in Pembina?
There are 110.69 Males per 100 Females in Pembina.
What is the Ratio of Females per 100 Males in Pembina?
There are 90.34 Females per 100 Males in Pembina.
What is the Median Population Age in Pembina?
Median Population Age in Pembina is 39.8 Years.
What is the Average Family Size in Pembina
Average Family Size in Pembina is 3.4 People.
What is the Average Household Size in Pembina
Average Household Size in Pembina is 2.6 People.
How Large is the Labor Force in Pembina?
There are 265 People in the Labor Forcein in Pembina.
What is the Percentage of People in the Labor Force in Pembina?
60.8% of People are in the Labor Force in Pembina.
What is the Unemployment Rate in Pembina?
Unemployment Rate in Pembina is 4.9%.