Shell Valley, ND Map & Demographics
Shell Valley Map
Shell Valley Overview
$16,908
PER CAPITA INCOME
$50,076
AVG FAMILY INCOME
$42,029
AVG HOUSEHOLD INCOME
26.0%
WAGE / INCOME GAP [ % ]
74.0¢/ $1
WAGE / INCOME GAP [ $ ]
0.39
INEQUALITY / GINI INDEX
1,183
TOTAL POPULATION
659
MALE POPULATION
524
FEMALE POPULATION
125.76
MALES / 100 FEMALES
79.51
FEMALES / 100 MALES
29.3
MEDIAN AGE
4.0
AVG FAMILY SIZE
3.5
AVG HOUSEHOLD SIZE
350
LABOR FORCE [ PEOPLE ]
44.6%
PERCENT IN LABOR FORCE
10.0%
UNEMPLOYMENT RATE
Income in Shell Valley
Income Overview in Shell Valley
Per Capita Income in Shell Valley is $16,908, while median incomes of families and households are $50,076 and $42,029 respectively.
| Characteristic | Number | Measure |
| Per Capita Income | 1,183 | $16,908 |
| Median Family Income | 236 | $50,076 |
| Mean Family Income | 236 | $55,987 |
| Median Household Income | 337 | $42,029 |
| Mean Household Income | 337 | $56,355 |
| Income Deficit | 236 | $0 |
| Wage / Income Gap (%) | 1,183 | 26.02% |
| Wage / Income Gap ($) | 1,183 | 73.98¢ per $1 |
| Gini / Inequality Index | 1,183 | 0.39 |
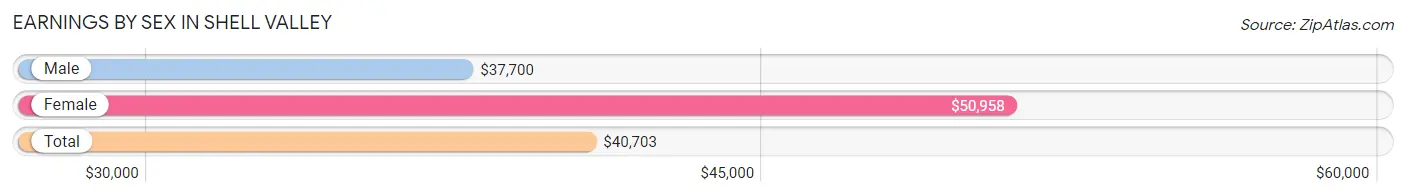
Earnings by Sex in Shell Valley
Average Earnings in Shell Valley are $40,703, $37,700 for men and $50,958 for women, a difference of 26.0%.
| Sex | Number | Average Earnings |
| Male | 144 (42.0%) | $37,700 |
| Female | 199 (58.0%) | $50,958 |
| Total | 343 (100.0%) | $40,703 |
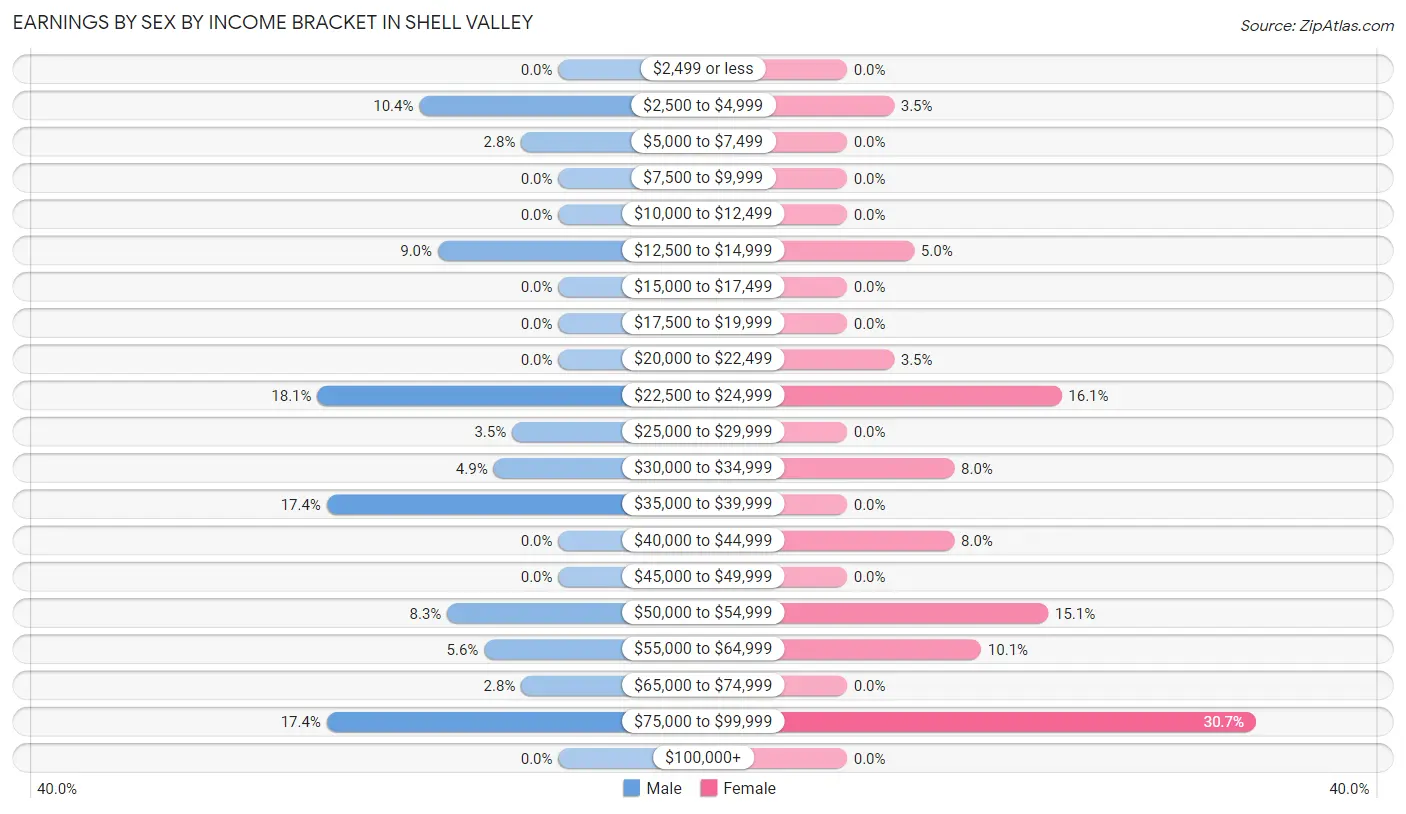
Earnings by Sex by Income Bracket in Shell Valley
The most common earnings brackets in Shell Valley are $22,500 to $24,999 for men (26 | 18.1%) and $75,000 to $99,999 for women (61 | 30.6%).
| Income | Male | Female |
| $2,499 or less | 0 (0.0%) | 0 (0.0%) |
| $2,500 to $4,999 | 15 (10.4%) | 7 (3.5%) |
| $5,000 to $7,499 | 4 (2.8%) | 0 (0.0%) |
| $7,500 to $9,999 | 0 (0.0%) | 0 (0.0%) |
| $10,000 to $12,499 | 0 (0.0%) | 0 (0.0%) |
| $12,500 to $14,999 | 13 (9.0%) | 10 (5.0%) |
| $15,000 to $17,499 | 0 (0.0%) | 0 (0.0%) |
| $17,500 to $19,999 | 0 (0.0%) | 0 (0.0%) |
| $20,000 to $22,499 | 0 (0.0%) | 7 (3.5%) |
| $22,500 to $24,999 | 26 (18.1%) | 32 (16.1%) |
| $25,000 to $29,999 | 5 (3.5%) | 0 (0.0%) |
| $30,000 to $34,999 | 7 (4.9%) | 16 (8.0%) |
| $35,000 to $39,999 | 25 (17.4%) | 0 (0.0%) |
| $40,000 to $44,999 | 0 (0.0%) | 16 (8.0%) |
| $45,000 to $49,999 | 0 (0.0%) | 0 (0.0%) |
| $50,000 to $54,999 | 12 (8.3%) | 30 (15.1%) |
| $55,000 to $64,999 | 8 (5.6%) | 20 (10.1%) |
| $65,000 to $74,999 | 4 (2.8%) | 0 (0.0%) |
| $75,000 to $99,999 | 25 (17.4%) | 61 (30.6%) |
| $100,000+ | 0 (0.0%) | 0 (0.0%) |
| Total | 144 (100.0%) | 199 (100.0%) |
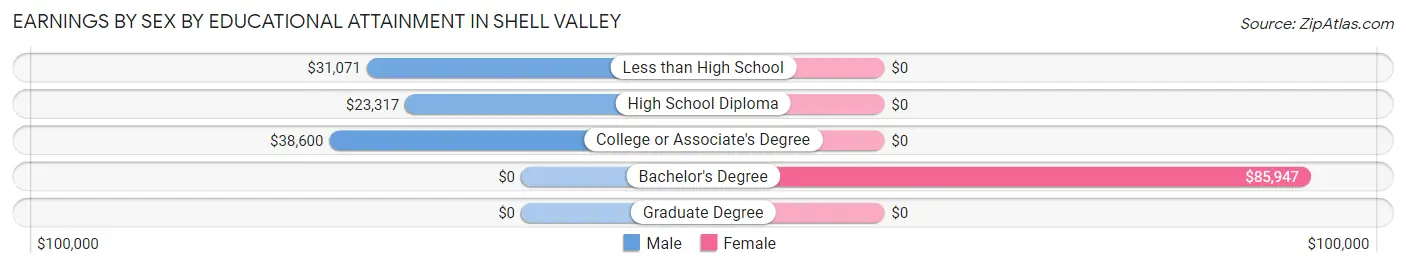
Earnings by Sex by Educational Attainment in Shell Valley
Average earnings in Shell Valley are $37,700 for men and $51,625 for women, a difference of 27.0%. Men with an educational attainment of college or associate's degree enjoy the highest average annual earnings of $38,600, while those with high school diploma education earn the least with $23,317. Women with an educational attainment of bachelor's degree earn the most with the average annual earnings of $85,947, while those with bachelor's degree education have the smallest earnings of $85,947.
| Educational Attainment | Male Income | Female Income |
| Less than High School | $31,071 | $0 |
| High School Diploma | $23,317 | $0 |
| College or Associate's Degree | $38,600 | $0 |
| Bachelor's Degree | - | - |
| Graduate Degree | - | - |
| Total | $37,700 | $51,625 |
Family Income in Shell Valley
Family Income Brackets in Shell Valley
According to the Shell Valley family income data, there are 60 families falling into the $50,000 to $74,999 income range, which is the most common income bracket and makes up 25.4% of all families.
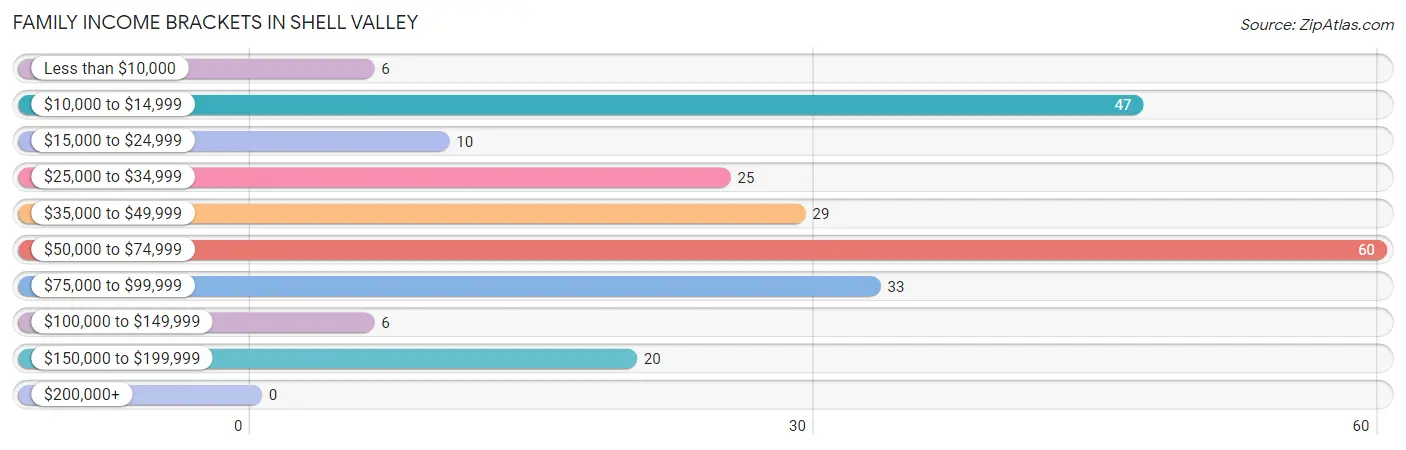
| Income Bracket | # Families | % Families |
| Less than $10,000 | 6 | 2.5% |
| $10,000 to $14,999 | 47 | 19.9% |
| $15,000 to $24,999 | 10 | 4.2% |
| $25,000 to $34,999 | 25 | 10.6% |
| $35,000 to $49,999 | 29 | 12.3% |
| $50,000 to $74,999 | 60 | 25.4% |
| $75,000 to $99,999 | 33 | 14.0% |
| $100,000 to $149,999 | 6 | 2.5% |
| $150,000 to $199,999 | 20 | 8.5% |
| $200,000+ | 0 | 0.0% |
Family Income by Famaliy Size in Shell Valley
4-person families (110 | 46.6%) account for the highest median family income in Shell Valley with $68,333 per family, while 3-person families (37 | 15.7%) have the highest median income of $19,271 per family member.
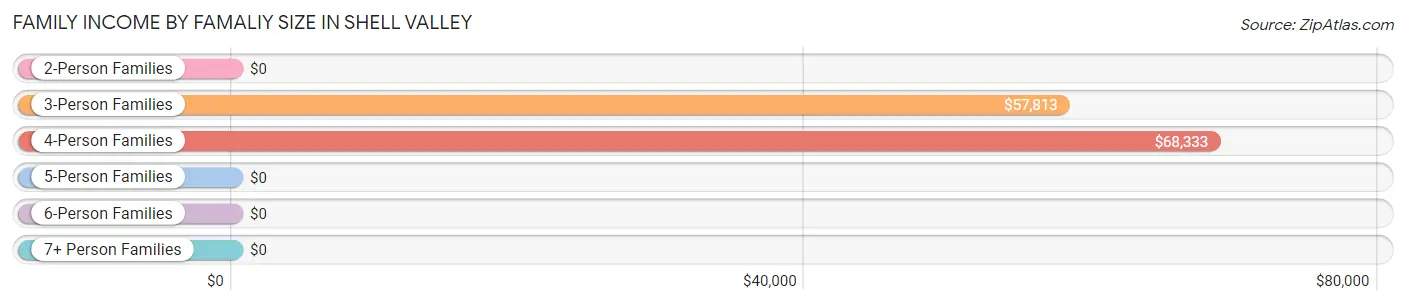
| Income Bracket | # Families | Median Income |
| 2-Person Families | 63 (26.7%) | $0 |
| 3-Person Families | 37 (15.7%) | $57,813 |
| 4-Person Families | 110 (46.6%) | $68,333 |
| 5-Person Families | 20 (8.5%) | $0 |
| 6-Person Families | 6 (2.5%) | $0 |
| 7+ Person Families | 0 (0.0%) | $0 |
| Total | 236 (100.0%) | $50,076 |
Family Income by Number of Earners in Shell Valley
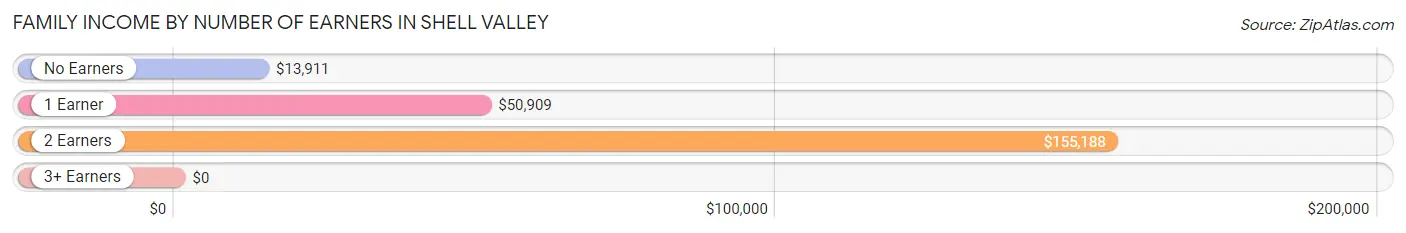
| Number of Earners | # Families | Median Income |
| No Earners | 59 (25.0%) | $13,911 |
| 1 Earner | 140 (59.3%) | $50,909 |
| 2 Earners | 37 (15.7%) | $155,188 |
| 3+ Earners | 0 (0.0%) | $0 |
| Total | 236 (100.0%) | $50,076 |
Household Income in Shell Valley
Household Income Brackets in Shell Valley
With 85 households falling in the category, the $75,000 to $99,999 income range is the most frequent in Shell Valley, accounting for 25.2% of all households.
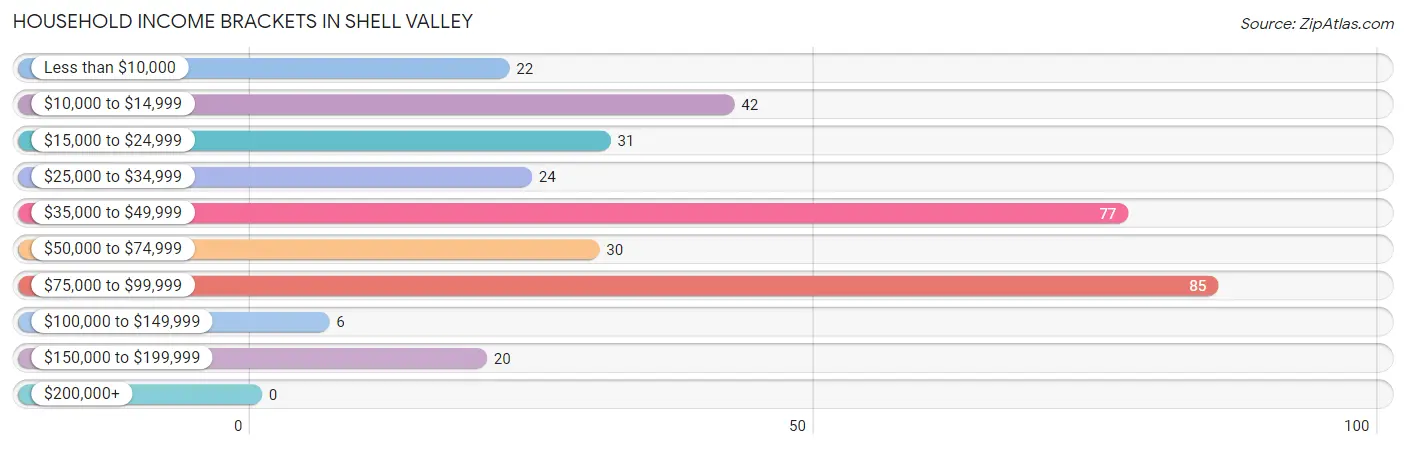
| Income Bracket | # Households | % Households |
| Less than $10,000 | 22 | 6.5% |
| $10,000 to $14,999 | 42 | 12.5% |
| $15,000 to $24,999 | 31 | 9.2% |
| $25,000 to $34,999 | 24 | 7.1% |
| $35,000 to $49,999 | 77 | 22.8% |
| $50,000 to $74,999 | 30 | 8.9% |
| $75,000 to $99,999 | 85 | 25.2% |
| $100,000 to $149,999 | 6 | 1.8% |
| $150,000 to $199,999 | 20 | 5.9% |
| $200,000+ | 0 | 0.0% |
Household Income by Householder Age in Shell Valley
The median household income in Shell Valley is $42,029, with the highest median household income of $92,560 found in the 25 to 44 years age bracket for the primary householder. A total of 123 households (36.5%) fall into this category. Meanwhile, the 15 to 24 years age bracket for the primary householder has the lowest median household income of $0, with 16 households (4.8%) in this group.
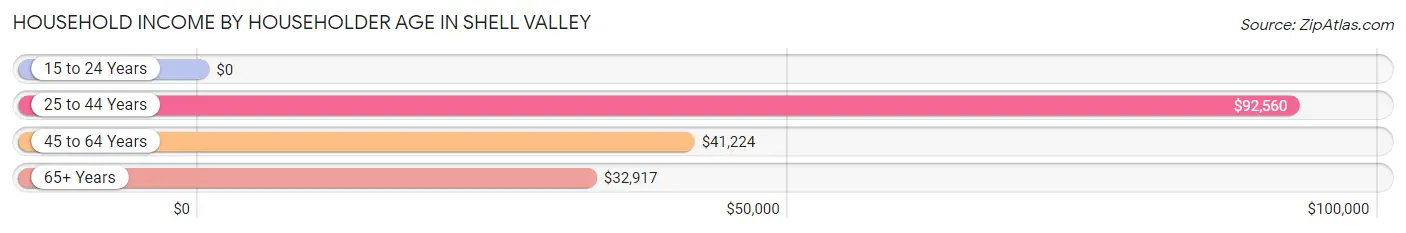
| Income Bracket | # Households | Median Income |
| 15 to 24 Years | 16 (4.8%) | $0 |
| 25 to 44 Years | 123 (36.5%) | $92,560 |
| 45 to 64 Years | 167 (49.5%) | $41,224 |
| 65+ Years | 31 (9.2%) | $32,917 |
| Total | 337 (100.0%) | $42,029 |
Poverty in Shell Valley
Income Below Poverty by Sex and Age in Shell Valley
With 22.9% poverty level for males and 31.3% for females among the residents of Shell Valley, under 5 year old males and 6 to 11 year old females are the most vulnerable to poverty, with 41 males (57.8%) and 23 females (74.2%) in their respective age groups living below the poverty level.
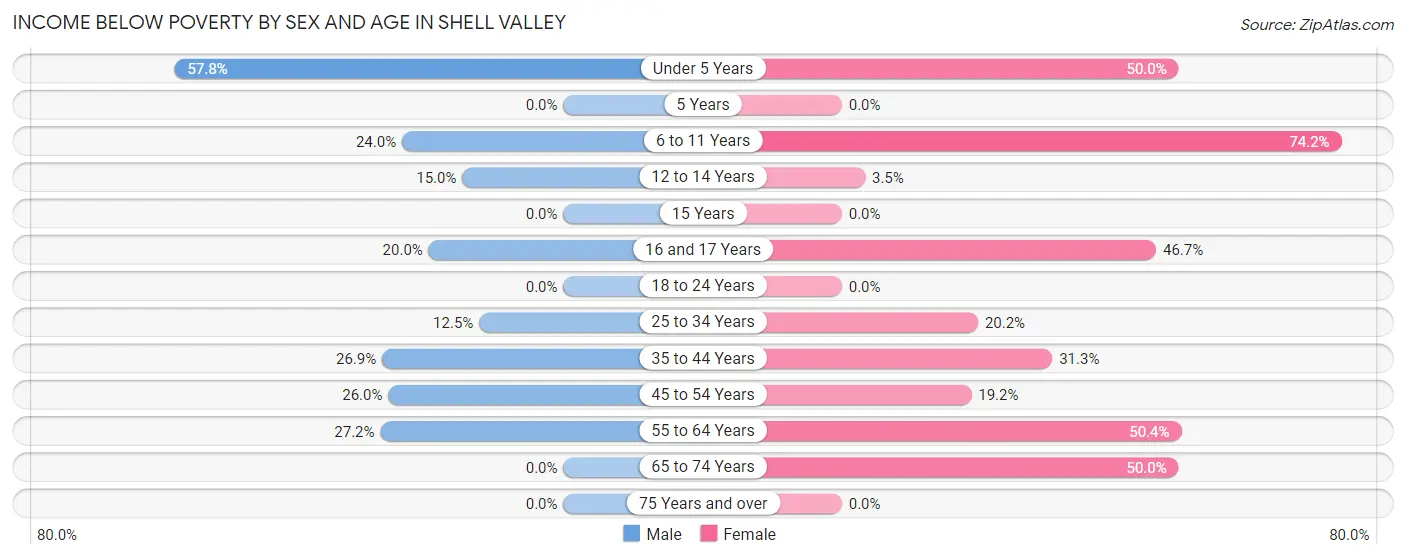
| Age Bracket | Male | Female |
| Under 5 Years | 41 (57.8%) | 24 (50.0%) |
| 5 Years | 0 (0.0%) | 0 (0.0%) |
| 6 to 11 Years | 23 (24.0%) | 23 (74.2%) |
| 12 to 14 Years | 3 (15.0%) | 3 (3.5%) |
| 15 Years | 0 (0.0%) | 0 (0.0%) |
| 16 and 17 Years | 4 (20.0%) | 7 (46.7%) |
| 18 to 24 Years | 0 (0.0%) | 0 (0.0%) |
| 25 to 34 Years | 22 (12.5%) | 18 (20.2%) |
| 35 to 44 Years | 14 (26.9%) | 15 (31.2%) |
| 45 to 54 Years | 13 (26.0%) | 10 (19.2%) |
| 55 to 64 Years | 25 (27.2%) | 61 (50.4%) |
| 65 to 74 Years | 0 (0.0%) | 3 (50.0%) |
| 75 Years and over | 0 (0.0%) | 0 (0.0%) |
| Total | 145 (22.9%) | 164 (31.3%) |
Income Above Poverty by Sex and Age in Shell Valley
According to the poverty statistics in Shell Valley, males aged 15 years and females aged 5 years are the age groups that are most secure financially, with 100.0% of males and 100.0% of females in these age groups living above the poverty line.
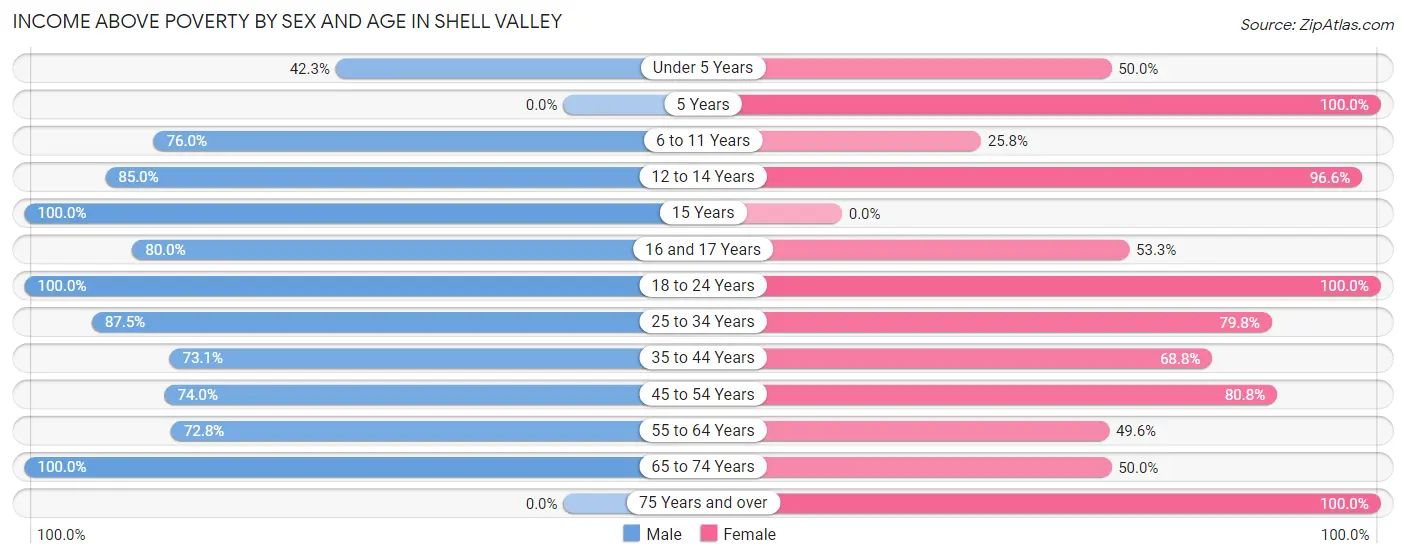
| Age Bracket | Male | Female |
| Under 5 Years | 30 (42.2%) | 24 (50.0%) |
| 5 Years | 0 (0.0%) | 1 (100.0%) |
| 6 to 11 Years | 73 (76.0%) | 8 (25.8%) |
| 12 to 14 Years | 17 (85.0%) | 84 (96.6%) |
| 15 Years | 18 (100.0%) | 0 (0.0%) |
| 16 and 17 Years | 16 (80.0%) | 8 (53.3%) |
| 18 to 24 Years | 12 (100.0%) | 16 (100.0%) |
| 25 to 34 Years | 154 (87.5%) | 71 (79.8%) |
| 35 to 44 Years | 38 (73.1%) | 33 (68.8%) |
| 45 to 54 Years | 37 (74.0%) | 42 (80.8%) |
| 55 to 64 Years | 67 (72.8%) | 60 (49.6%) |
| 65 to 74 Years | 26 (100.0%) | 3 (50.0%) |
| 75 Years and over | 0 (0.0%) | 10 (100.0%) |
| Total | 488 (77.1%) | 360 (68.7%) |
Income Below Poverty Among Married-Couple Families in Shell Valley
The poverty statistics for married-couple families in Shell Valley show that 33.8% or 25 of the total 74 families live below the poverty line. Families with no children have the highest poverty rate of 73.5%, comprising of 25 families. On the other hand, families with 1 or 2 children have the lowest poverty rate of 0.0%, which includes 0 families.
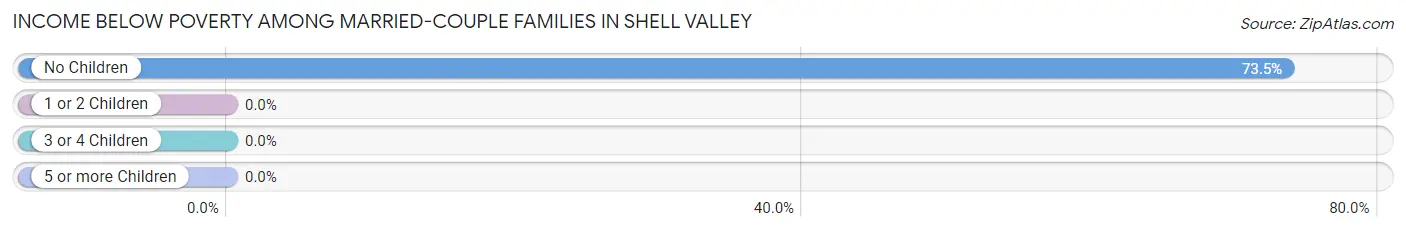
| Children | Above Poverty | Below Poverty |
| No Children | 9 (26.5%) | 25 (73.5%) |
| 1 or 2 Children | 36 (100.0%) | 0 (0.0%) |
| 3 or 4 Children | 4 (100.0%) | 0 (0.0%) |
| 5 or more Children | 0 (0.0%) | 0 (0.0%) |
| Total | 49 (66.2%) | 25 (33.8%) |
Income Below Poverty Among Single-Parent Households in Shell Valley
According to the poverty data in Shell Valley, 13.0% or 3 single-father households and 29.5% or 41 single-mother households are living below the poverty line. Among single-father households, those with 3 or 4 children have the highest poverty rate, with 3 households (100.0%) experiencing poverty. Likewise, among single-mother households, those with no children have the highest poverty rate, with 6 households (66.7%) falling below the poverty line.
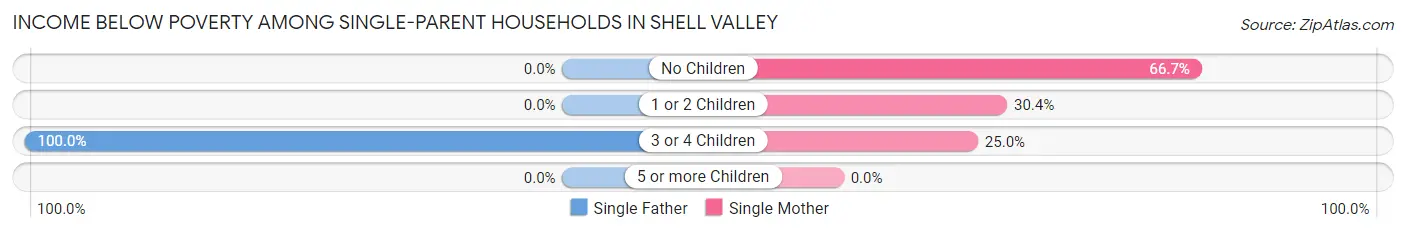
| Children | Single Father | Single Mother |
| No Children | 0 (0.0%) | 6 (66.7%) |
| 1 or 2 Children | 0 (0.0%) | 14 (30.4%) |
| 3 or 4 Children | 3 (100.0%) | 21 (25.0%) |
| 5 or more Children | 0 (0.0%) | 0 (0.0%) |
| Total | 3 (13.0%) | 41 (29.5%) |
Income Below Poverty Among Married-Couple vs Single-Parent Households in Shell Valley
The poverty data for Shell Valley shows that 25 of the married-couple family households (33.8%) and 44 of the single-parent households (27.2%) are living below the poverty level. Within the married-couple family households, those with no children have the highest poverty rate, with 25 households (73.5%) falling below the poverty line. Among the single-parent households, those with no children have the highest poverty rate, with 6 household (28.6%) living below poverty.
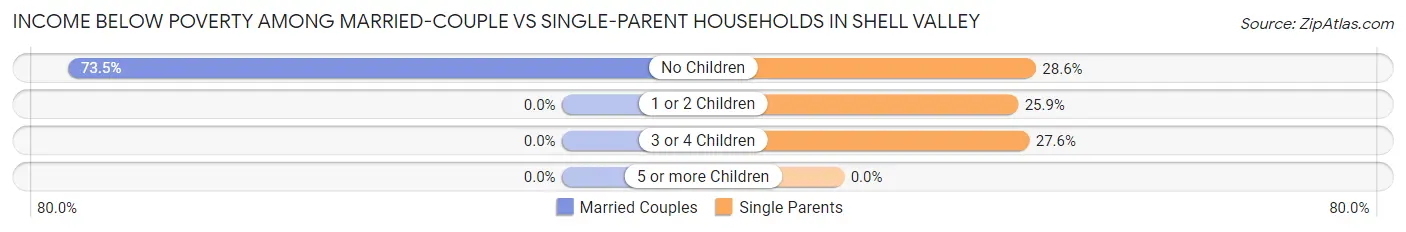
| Children | Married-Couple Families | Single-Parent Households |
| No Children | 25 (73.5%) | 6 (28.6%) |
| 1 or 2 Children | 0 (0.0%) | 14 (25.9%) |
| 3 or 4 Children | 0 (0.0%) | 24 (27.6%) |
| 5 or more Children | 0 (0.0%) | 0 (0.0%) |
| Total | 25 (33.8%) | 44 (27.2%) |
Race in Shell Valley
The most populous races in Shell Valley are Native / Alaskan (1,123 | 94.9%), Two or more Races (57 | 4.8%), and Hispanic or Latino (52 | 4.4%).
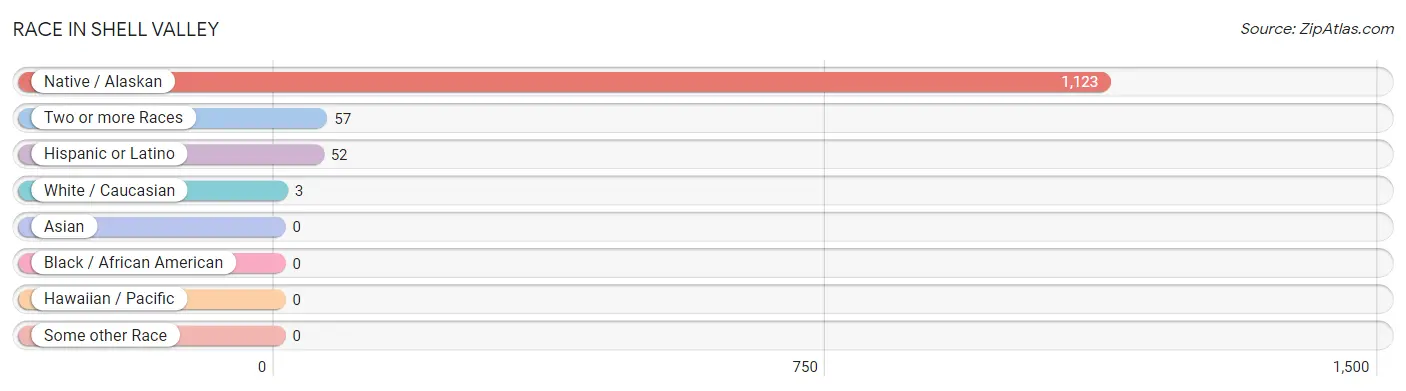
| Race | # Population | % Population |
| Asian | 0 | 0.0% |
| Black / African American | 0 | 0.0% |
| Hawaiian / Pacific | 0 | 0.0% |
| Hispanic or Latino | 52 | 4.4% |
| Native / Alaskan | 1,123 | 94.9% |
| White / Caucasian | 3 | 0.3% |
| Two or more Races | 57 | 4.8% |
| Some other Race | 0 | 0.0% |
| Total | 1,183 | 100.0% |
Ancestry in Shell Valley
The most populous ancestries reported in Shell Valley are Chippewa (1,168 | 98.7%), Mexican (52 | 4.4%), Sioux (9 | 0.8%), and German (3 | 0.3%), together accounting for 104.1% of all Shell Valley residents.
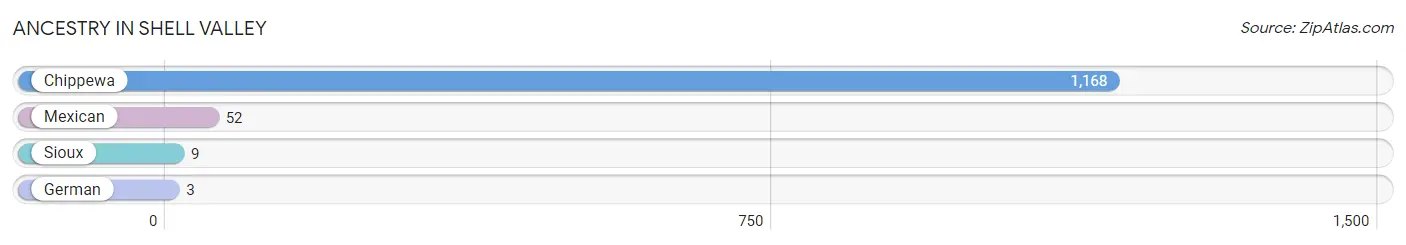
| Ancestry | # Population | % Population |
| Chippewa | 1,168 | 98.7% |
| German | 3 | 0.3% |
| Mexican | 52 | 4.4% |
| Sioux | 9 | 0.8% | View All 4 Rows |
Immigrants in Shell Valley

| Immigration Origin | # Population | % Population | View All 0 Rows |
Sex and Age in Shell Valley
Sex and Age in Shell Valley
The most populous age groups in Shell Valley are 25 to 29 Years (111 | 16.8%) for men and 55 to 59 Years (97 | 18.5%) for women.
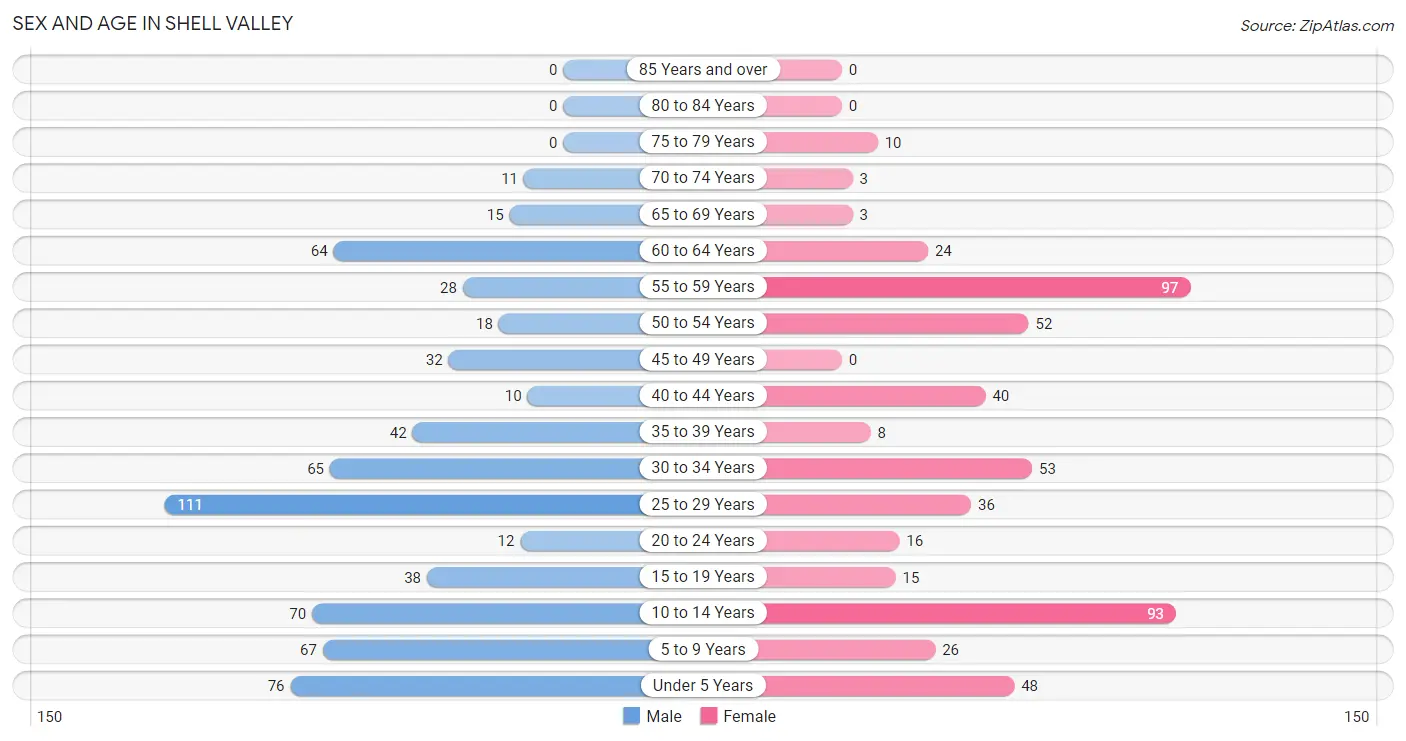
| Age Bracket | Male | Female |
| Under 5 Years | 76 (11.5%) | 48 (9.2%) |
| 5 to 9 Years | 67 (10.2%) | 26 (5.0%) |
| 10 to 14 Years | 70 (10.6%) | 93 (17.7%) |
| 15 to 19 Years | 38 (5.8%) | 15 (2.9%) |
| 20 to 24 Years | 12 (1.8%) | 16 (3.0%) |
| 25 to 29 Years | 111 (16.8%) | 36 (6.9%) |
| 30 to 34 Years | 65 (9.9%) | 53 (10.1%) |
| 35 to 39 Years | 42 (6.4%) | 8 (1.5%) |
| 40 to 44 Years | 10 (1.5%) | 40 (7.6%) |
| 45 to 49 Years | 32 (4.9%) | 0 (0.0%) |
| 50 to 54 Years | 18 (2.7%) | 52 (9.9%) |
| 55 to 59 Years | 28 (4.3%) | 97 (18.5%) |
| 60 to 64 Years | 64 (9.7%) | 24 (4.6%) |
| 65 to 69 Years | 15 (2.3%) | 3 (0.6%) |
| 70 to 74 Years | 11 (1.7%) | 3 (0.6%) |
| 75 to 79 Years | 0 (0.0%) | 10 (1.9%) |
| 80 to 84 Years | 0 (0.0%) | 0 (0.0%) |
| 85 Years and over | 0 (0.0%) | 0 (0.0%) |
| Total | 659 (100.0%) | 524 (100.0%) |
Families and Households in Shell Valley
Median Family Size in Shell Valley
The median family size in Shell Valley is 3.98 persons per family, with single male/father families (23 | 9.8%) accounting for the largest median family size of 5.13 persons per family. On the other hand, single female/mother families (139 | 58.9%) represent the smallest median family size with 3.53 persons per family.
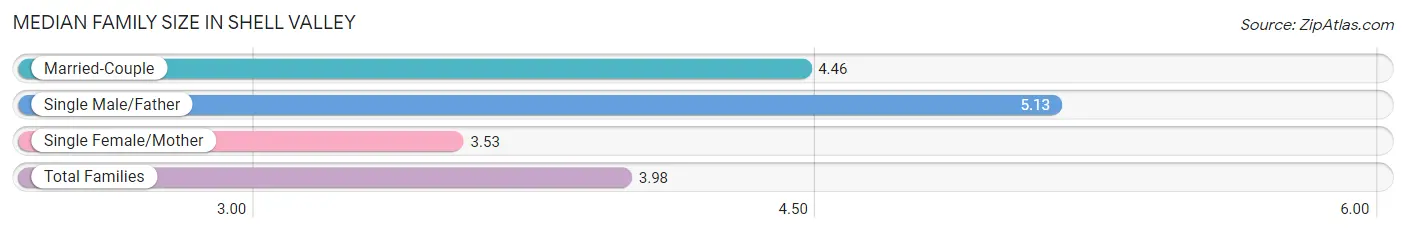
| Family Type | # Families | Family Size |
| Married-Couple | 74 (31.4%) | 4.46 |
| Single Male/Father | 23 (9.8%) | 5.13 |
| Single Female/Mother | 139 (58.9%) | 3.53 |
| Total Families | 236 (100.0%) | 3.98 |
Median Household Size in Shell Valley
The median household size in Shell Valley is 3.51 persons per household, with single male/father households (23 | 6.8%) accounting for the largest median household size of 6.96 persons per household. non-family households (101 | 30.0%) represent the smallest median household size with 1.47 persons per household.
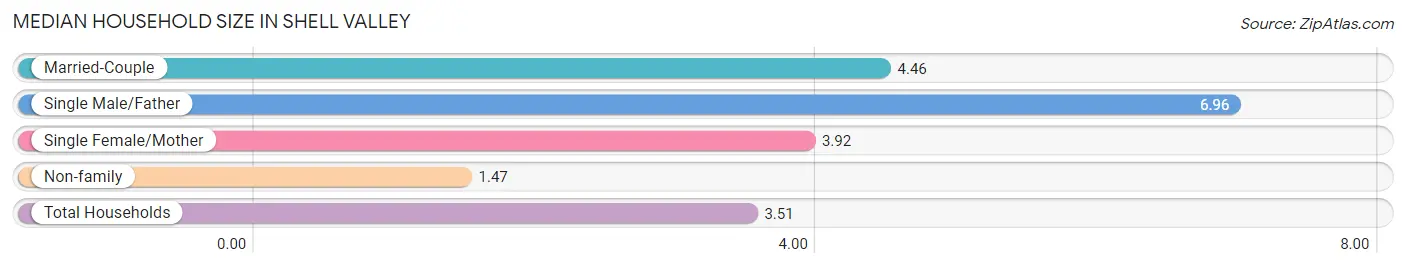
| Household Type | # Households | Household Size |
| Married-Couple | 74 (22.0%) | 4.46 |
| Single Male/Father | 23 (6.8%) | 6.96 |
| Single Female/Mother | 139 (41.2%) | 3.92 |
| Non-family | 101 (30.0%) | 1.47 |
| Total Households | 337 (100.0%) | 3.51 |
Household Size by Marriage Status in Shell Valley
Out of a total of 337 households in Shell Valley, 236 (70.0%) are family households, while 101 (30.0%) are nonfamily households. The most numerous type of family households are 4-person households, comprising 74, and the most common type of nonfamily households are 1-person households, comprising 69.
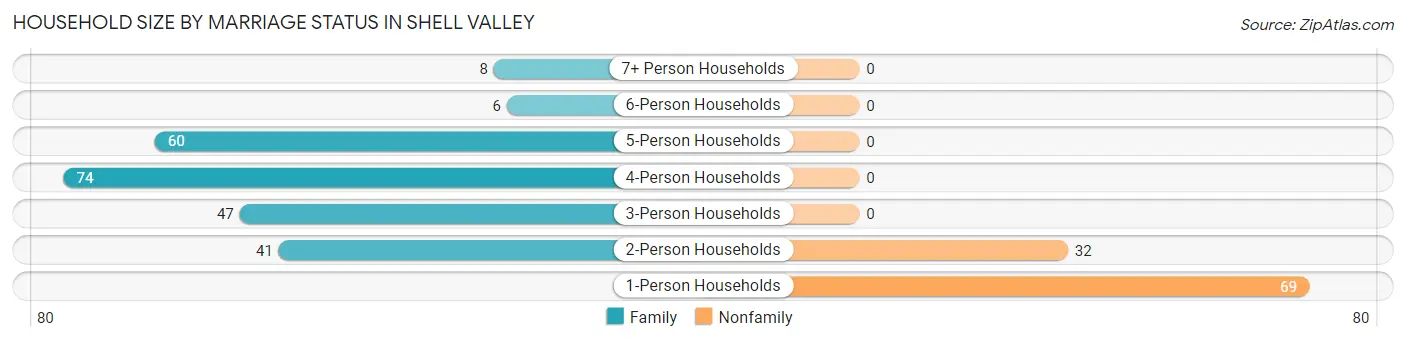
| Household Size | Family Households | Nonfamily Households |
| 1-Person Households | - | 69 (20.5%) |
| 2-Person Households | 41 (12.2%) | 32 (9.5%) |
| 3-Person Households | 47 (14.0%) | 0 (0.0%) |
| 4-Person Households | 74 (22.0%) | 0 (0.0%) |
| 5-Person Households | 60 (17.8%) | 0 (0.0%) |
| 6-Person Households | 6 (1.8%) | 0 (0.0%) |
| 7+ Person Households | 8 (2.4%) | 0 (0.0%) |
| Total | 236 (70.0%) | 101 (30.0%) |
Female Fertility in Shell Valley
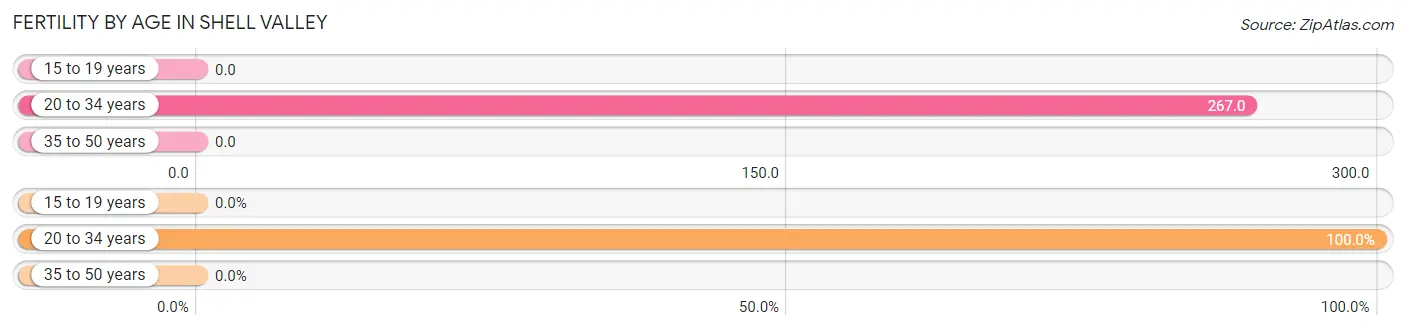
Fertility by Age in Shell Valley
Average fertility rate in Shell Valley is 149.0 births per 1,000 women. Women in the age bracket of 20 to 34 years have the highest fertility rate with 267.0 births per 1,000 women. Women in the age bracket of 20 to 34 years acount for 100.0% of all women with births.
| Age Bracket | Women with Births | Births / 1,000 Women |
| 15 to 19 years | 0 (0.0%) | 0.0 |
| 20 to 34 years | 28 (100.0%) | 267.0 |
| 35 to 50 years | 0 (0.0%) | 0.0 |
| Total | 28 (100.0%) | 149.0 |
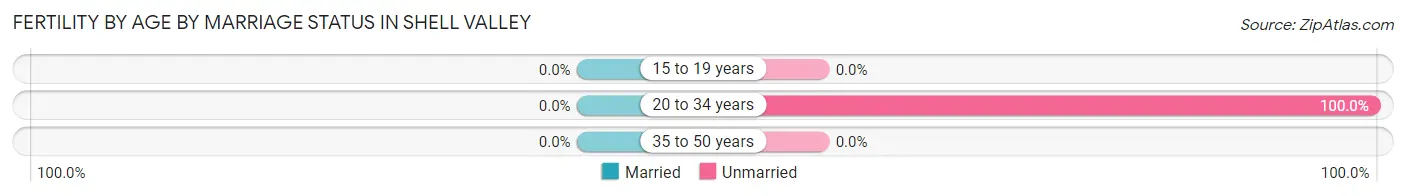
Fertility by Age by Marriage Status in Shell Valley
| Age Bracket | Married | Unmarried |
| 15 to 19 years | 0 (0.0%) | 0 (0.0%) |
| 20 to 34 years | 0 (0.0%) | 28 (100.0%) |
| 35 to 50 years | 0 (0.0%) | 0 (0.0%) |
| Total | 0 (0.0%) | 28 (100.0%) |
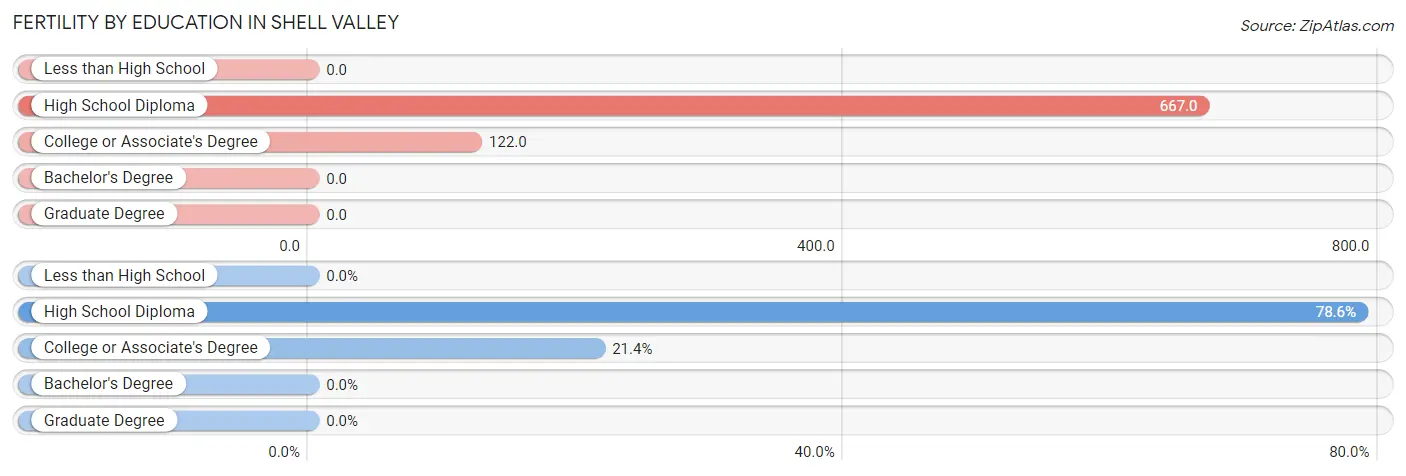
Fertility by Education in Shell Valley
| Educational Attainment | Women with Births | Births / 1,000 Women |
| Less than High School | 0 (0.0%) | 0.0 |
| High School Diploma | 22 (78.6%) | 667.0 |
| College or Associate's Degree | 6 (21.4%) | 122.0 |
| Bachelor's Degree | 0 (0.0%) | 0.0 |
| Graduate Degree | 0 (0.0%) | 0.0 |
| Total | 28 (100.0%) | 149.0 |
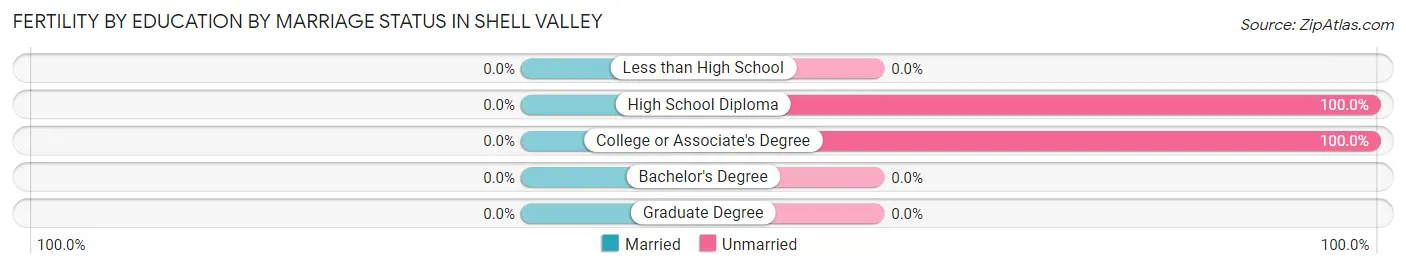
Fertility by Education by Marriage Status in Shell Valley
| Educational Attainment | Married | Unmarried |
| Less than High School | 0 (0.0%) | 0 (0.0%) |
| High School Diploma | 0 (0.0%) | 22 (100.0%) |
| College or Associate's Degree | 0 (0.0%) | 6 (100.0%) |
| Bachelor's Degree | 0 (0.0%) | 0 (0.0%) |
| Graduate Degree | 0 (0.0%) | 0 (0.0%) |
| Total | 0 (0.0%) | 28 (100.0%) |
Employment Characteristics in Shell Valley
Employment by Class of Employer in Shell Valley
Among the 275 employed individuals in Shell Valley, not-for-profit organizations (75 | 27.3%), private company employees (67 | 24.4%), and federal government employees (55 | 20.0%) make up the most common classes of employment.
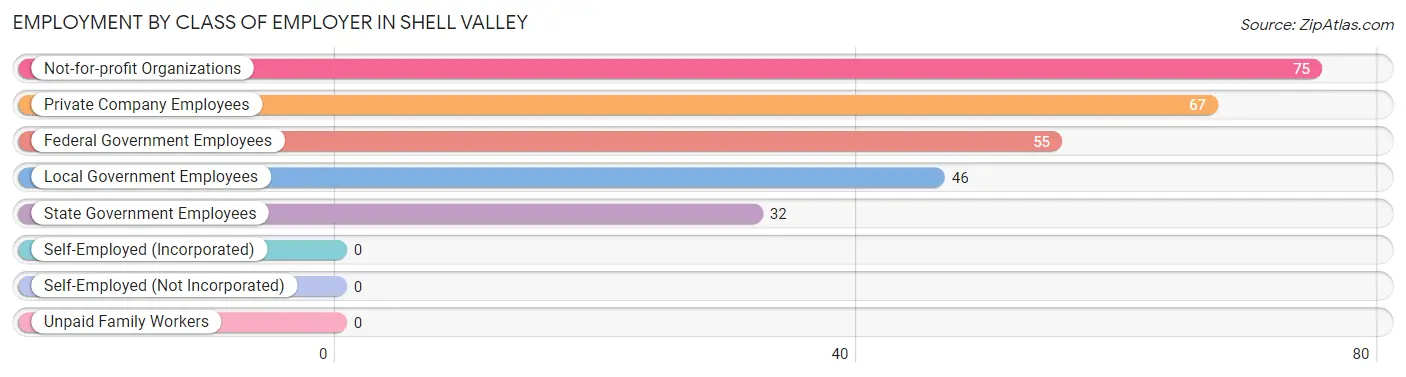
| Employer Class | # Employees | % Employees |
| Private Company Employees | 67 | 24.4% |
| Self-Employed (Incorporated) | 0 | 0.0% |
| Self-Employed (Not Incorporated) | 0 | 0.0% |
| Not-for-profit Organizations | 75 | 27.3% |
| Local Government Employees | 46 | 16.7% |
| State Government Employees | 32 | 11.6% |
| Federal Government Employees | 55 | 20.0% |
| Unpaid Family Workers | 0 | 0.0% |
| Total | 275 | 100.0% |
Employment Status by Age in Shell Valley
According to the labor force statistics for Shell Valley, out of the total population over 16 years of age (785), 44.6% or 350 individuals are in the labor force, with 10.0% or 35 of them unemployed. The age group with the highest labor force participation rate is 45 to 54 years, with 79.4% or 81 individuals in the labor force. Within the labor force, the 20 to 24 years age range has the highest percentage of unemployed individuals, with 100.0% or 12 of them being unemployed.
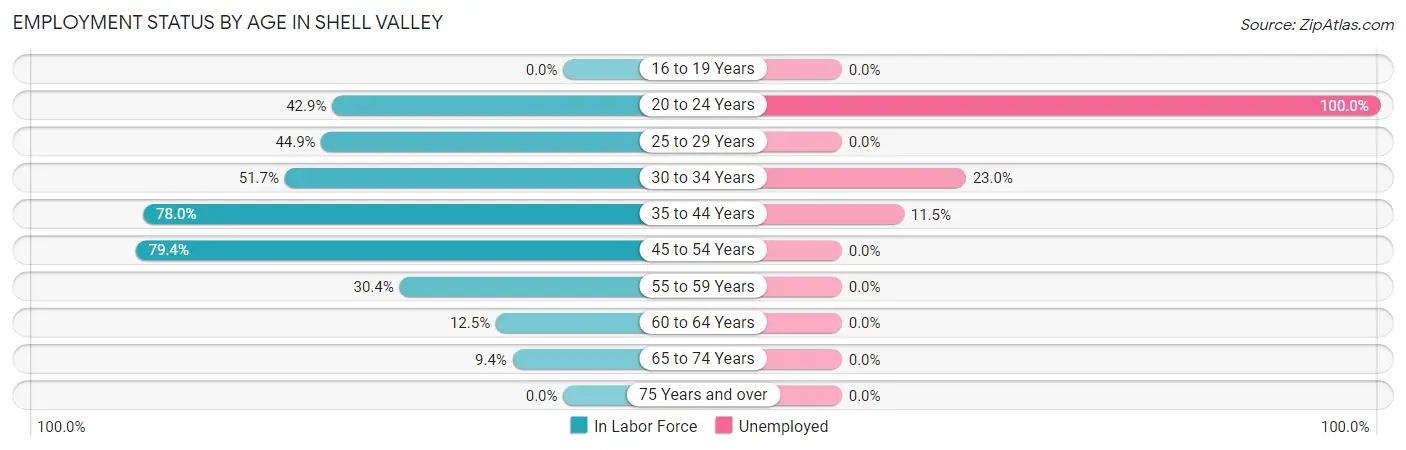
| Age Bracket | In Labor Force | Unemployed |
| 16 to 19 Years | 0 (0.0%) | 0 (0.0%) |
| 20 to 24 Years | 12 (42.9%) | 12 (100.0%) |
| 25 to 29 Years | 66 (44.9%) | 0 (0.0%) |
| 30 to 34 Years | 61 (51.7%) | 14 (23.0%) |
| 35 to 44 Years | 78 (78.0%) | 9 (11.5%) |
| 45 to 54 Years | 81 (79.4%) | 0 (0.0%) |
| 55 to 59 Years | 38 (30.4%) | 0 (0.0%) |
| 60 to 64 Years | 11 (12.5%) | 0 (0.0%) |
| 65 to 74 Years | 3 (9.4%) | 0 (0.0%) |
| 75 Years and over | 0 (0.0%) | 0 (0.0%) |
| Total | 350 (44.6%) | 35 (10.0%) |
Employment Status by Educational Attainment in Shell Valley
According to labor force statistics for Shell Valley, 49.3% of individuals (335) out of the total population between 25 and 64 years of age (680) are in the labor force, with 6.9% or 23 of them being unemployed. The group with the highest labor force participation rate are those with the educational attainment of bachelor's degree or higher, with 95.7% or 110 individuals in the labor force. Within the labor force, individuals with less than high school education have the highest percentage of unemployment, with 28.1% or 9 of them being unemployed.
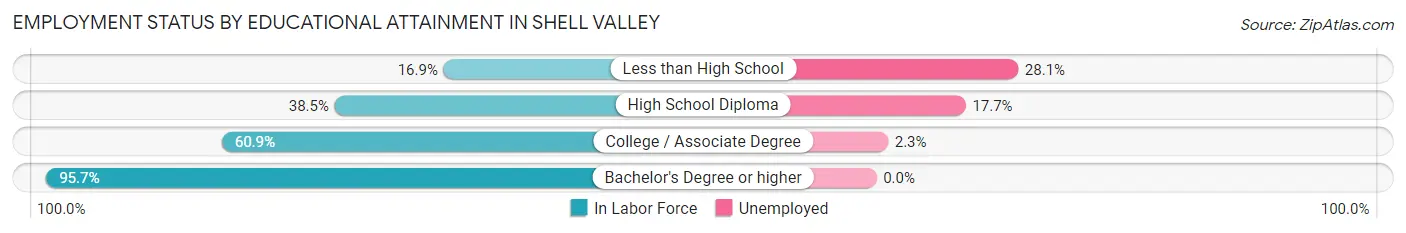
| Educational Attainment | In Labor Force | Unemployed |
| Less than High School | 32 (16.9%) | 53 (28.1%) |
| High School Diploma | 62 (38.5%) | 28 (17.7%) |
| College / Associate Degree | 131 (60.9%) | 5 (2.3%) |
| Bachelor's Degree or higher | 110 (95.7%) | 0 (0.0%) |
| Total | 335 (49.3%) | 47 (6.9%) |
Employment Occupations by Sex in Shell Valley
Management, Business, Science and Arts Occupations
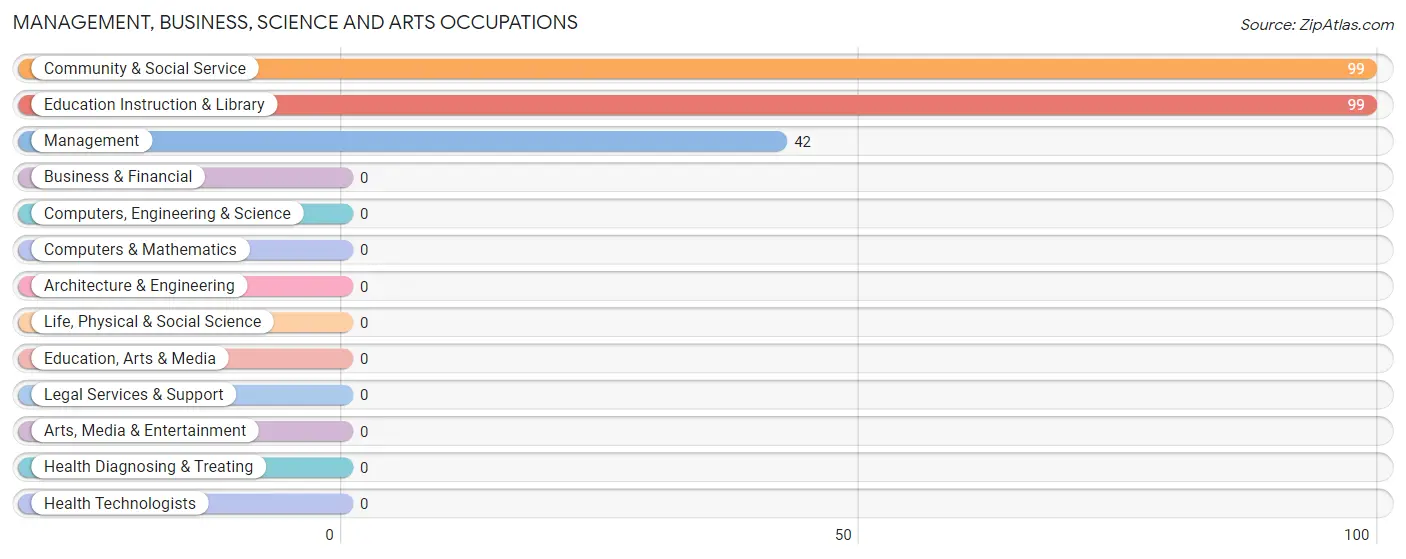
The most common Management, Business, Science and Arts occupations in Shell Valley are Community & Social Service (99 | 31.4%), Education Instruction & Library (99 | 31.4%), and Management (42 | 13.3%).
Management, Business, Science and Arts Occupations by Sex
Within the Management, Business, Science and Arts occupations in Shell Valley, the most male-oriented occupations are Community & Social Service (25.3%), and Education Instruction & Library (25.3%), while the most female-oriented occupations are Management (100.0%), Community & Social Service (74.8%), and Education Instruction & Library (74.8%).
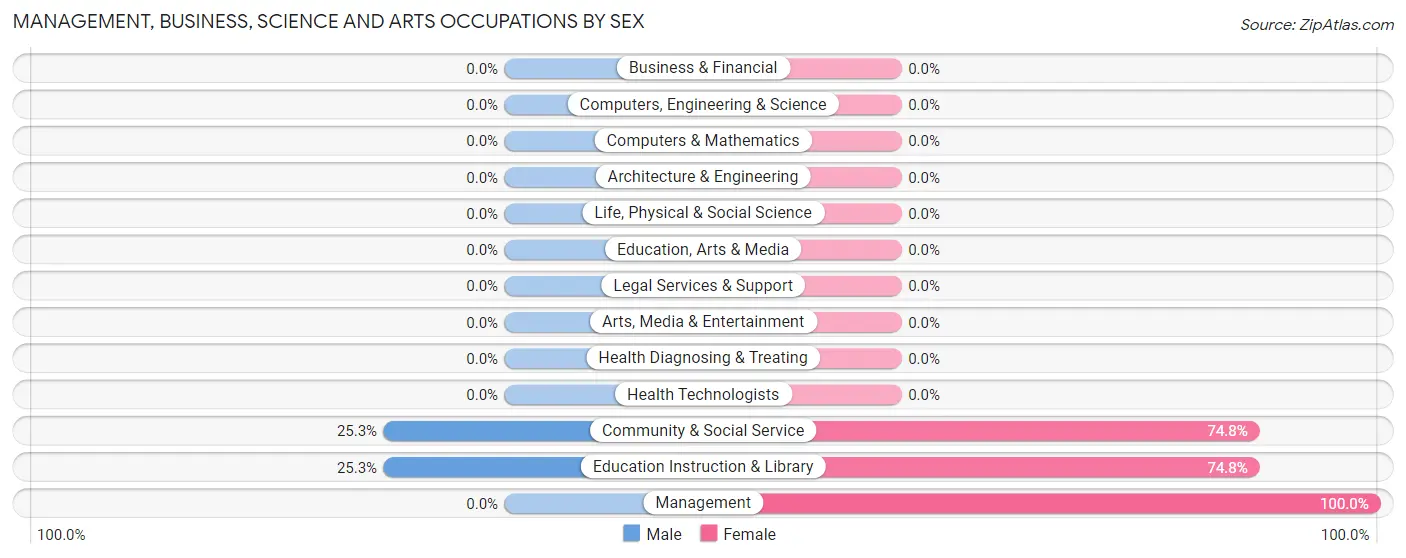
| Occupation | Male | Female |
| Management | 0 (0.0%) | 42 (100.0%) |
| Business & Financial | 0 (0.0%) | 0 (0.0%) |
| Computers, Engineering & Science | 0 (0.0%) | 0 (0.0%) |
| Computers & Mathematics | 0 (0.0%) | 0 (0.0%) |
| Architecture & Engineering | 0 (0.0%) | 0 (0.0%) |
| Life, Physical & Social Science | 0 (0.0%) | 0 (0.0%) |
| Community & Social Service | 25 (25.3%) | 74 (74.8%) |
| Education, Arts & Media | 0 (0.0%) | 0 (0.0%) |
| Legal Services & Support | 0 (0.0%) | 0 (0.0%) |
| Education Instruction & Library | 25 (25.3%) | 74 (74.8%) |
| Arts, Media & Entertainment | 0 (0.0%) | 0 (0.0%) |
| Health Diagnosing & Treating | 0 (0.0%) | 0 (0.0%) |
| Health Technologists | 0 (0.0%) | 0 (0.0%) |
| Total (Category) | 25 (17.7%) | 116 (82.3%) |
| Total (Overall) | 132 (41.9%) | 183 (58.1%) |
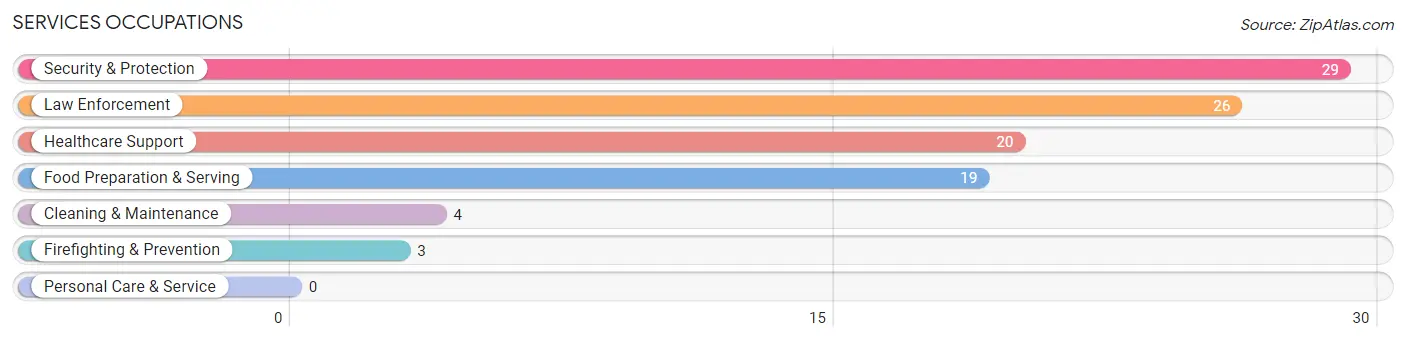
Services Occupations
The most common Services occupations in Shell Valley are Security & Protection (29 | 9.2%), Law Enforcement (26 | 8.3%), Healthcare Support (20 | 6.4%), Food Preparation & Serving (19 | 6.0%), and Cleaning & Maintenance (4 | 1.3%).
Services Occupations by Sex
Within the Services occupations in Shell Valley, the most male-oriented occupations are Law Enforcement (100.0%), Cleaning & Maintenance (100.0%), and Security & Protection (89.7%), while the most female-oriented occupations are Healthcare Support (100.0%), Firefighting & Prevention (100.0%), and Food Preparation & Serving (31.6%).
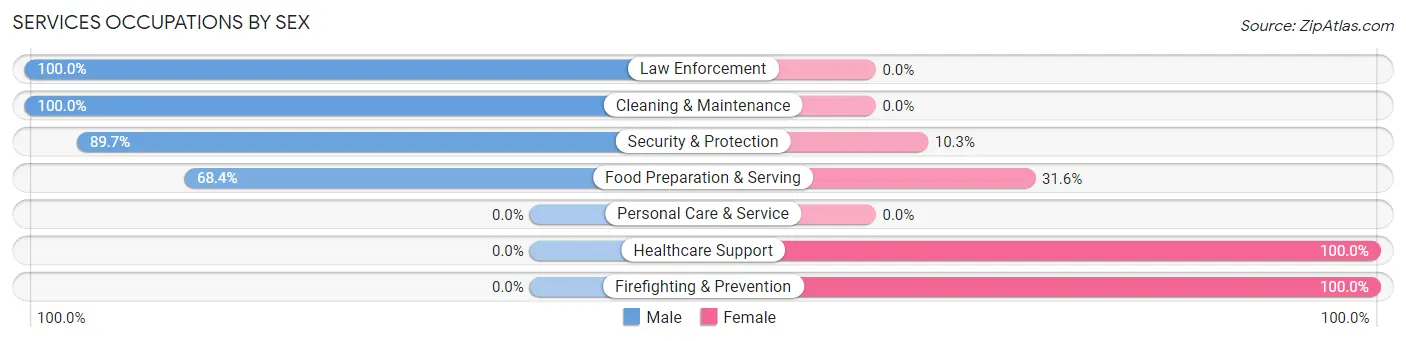
| Occupation | Male | Female |
| Healthcare Support | 0 (0.0%) | 20 (100.0%) |
| Security & Protection | 26 (89.7%) | 3 (10.3%) |
| Firefighting & Prevention | 0 (0.0%) | 3 (100.0%) |
| Law Enforcement | 26 (100.0%) | 0 (0.0%) |
| Food Preparation & Serving | 13 (68.4%) | 6 (31.6%) |
| Cleaning & Maintenance | 4 (100.0%) | 0 (0.0%) |
| Personal Care & Service | 0 (0.0%) | 0 (0.0%) |
| Total (Category) | 43 (59.7%) | 29 (40.3%) |
| Total (Overall) | 132 (41.9%) | 183 (58.1%) |
Sales and Office Occupations
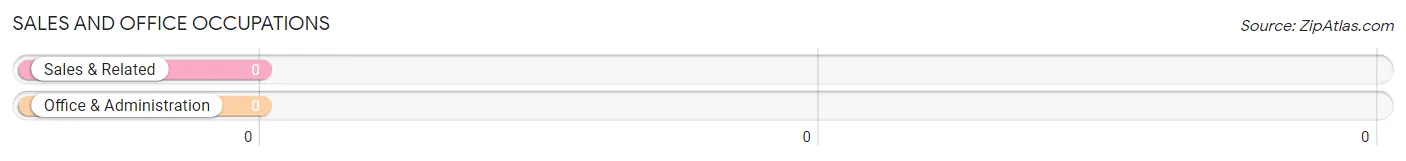
Sales and Office Occupations by Sex
| Occupation | Male | Female |
| Sales & Related | 0 (0.0%) | 0 (0.0%) |
| Office & Administration | 0 (0.0%) | 0 (0.0%) |
| Total (Category) | 0 (0.0%) | 0 (0.0%) |
| Total (Overall) | 132 (41.9%) | 183 (58.1%) |
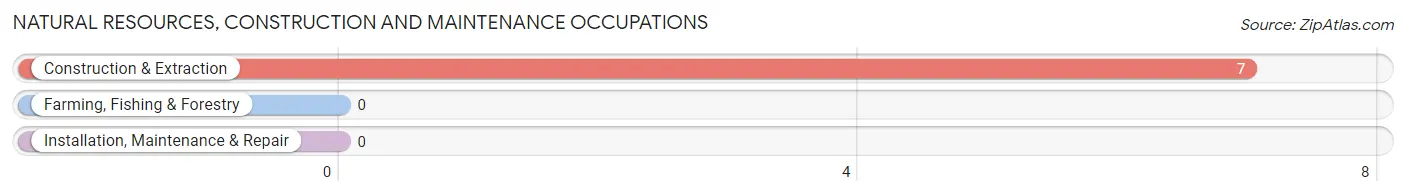
Natural Resources, Construction and Maintenance Occupations
The most common Natural Resources, Construction and Maintenance occupations in Shell Valley are , and Construction & Extraction (7 | 2.2%).
Natural Resources, Construction and Maintenance Occupations by Sex
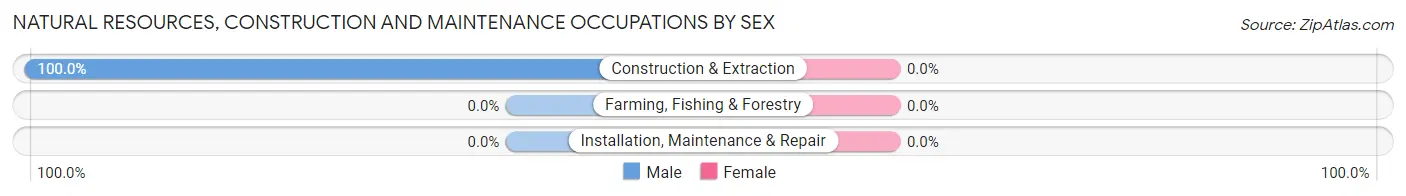
| Occupation | Male | Female |
| Farming, Fishing & Forestry | 0 (0.0%) | 0 (0.0%) |
| Construction & Extraction | 7 (100.0%) | 0 (0.0%) |
| Installation, Maintenance & Repair | 0 (0.0%) | 0 (0.0%) |
| Total (Category) | 7 (100.0%) | 0 (0.0%) |
| Total (Overall) | 132 (41.9%) | 183 (58.1%) |
Production, Transportation and Moving Occupations
The most common Production, Transportation and Moving occupations in Shell Valley are Transportation (44 | 14.0%), Production (35 | 11.1%), and Material Moving (16 | 5.1%).
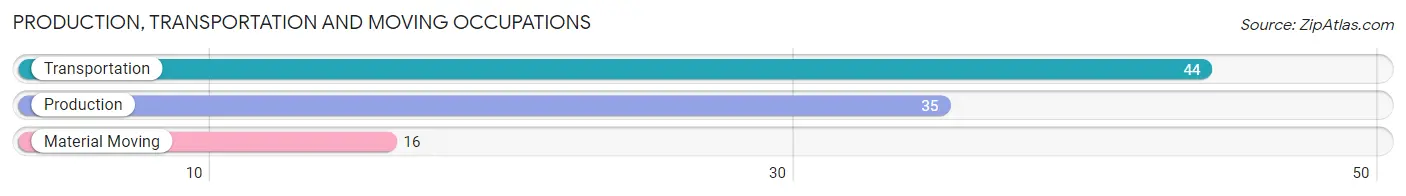
Production, Transportation and Moving Occupations by Sex
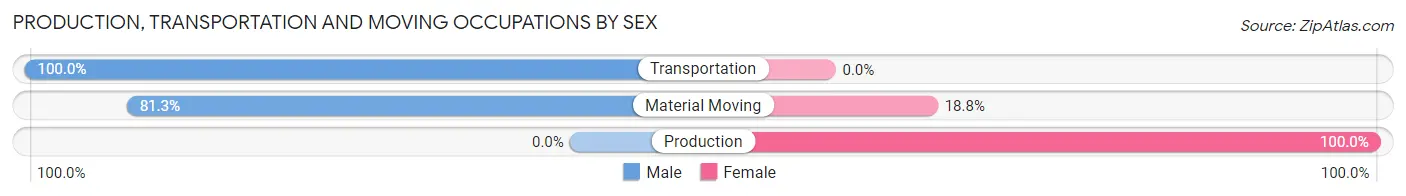
| Occupation | Male | Female |
| Production | 0 (0.0%) | 35 (100.0%) |
| Transportation | 44 (100.0%) | 0 (0.0%) |
| Material Moving | 13 (81.2%) | 3 (18.8%) |
| Total (Category) | 57 (60.0%) | 38 (40.0%) |
| Total (Overall) | 132 (41.9%) | 183 (58.1%) |
Employment Industries by Sex in Shell Valley
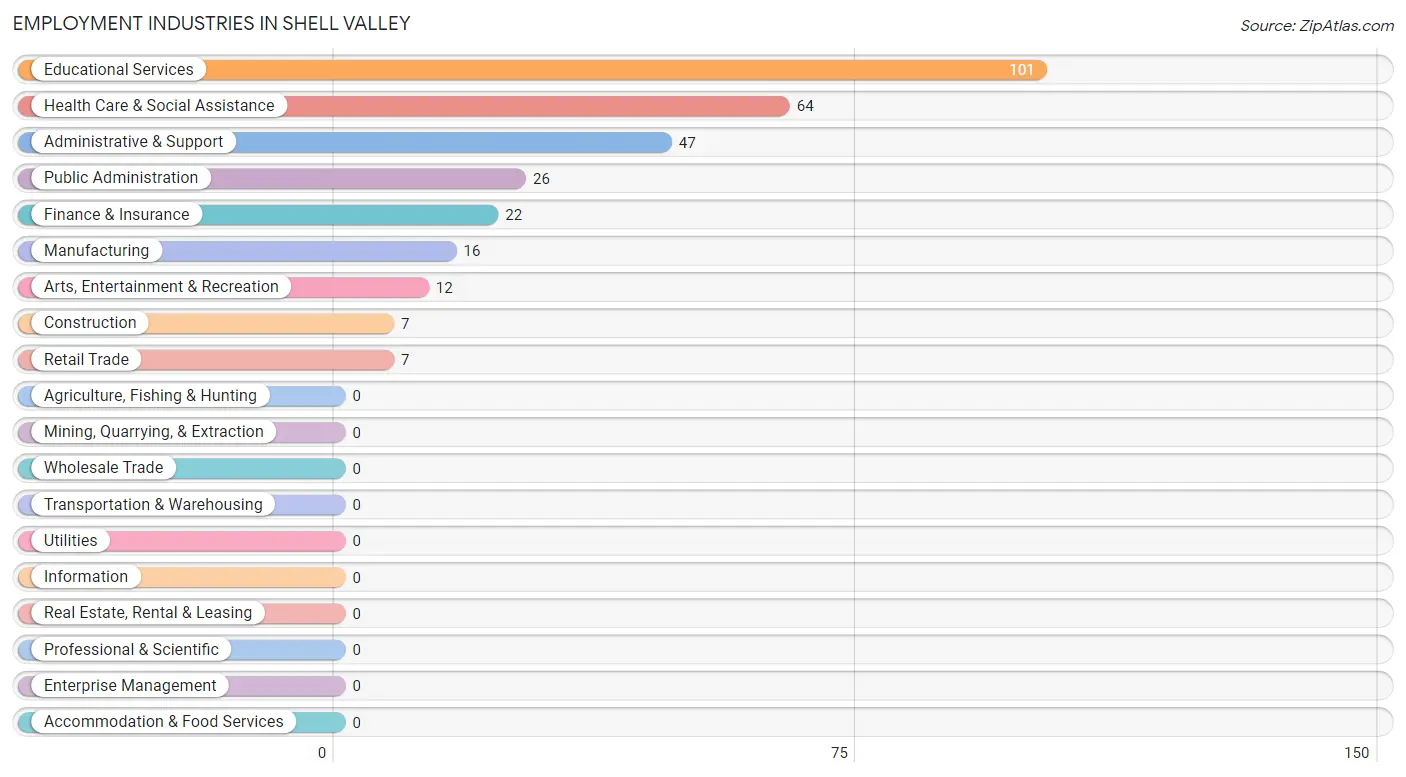
Employment Industries in Shell Valley
The major employment industries in Shell Valley include Educational Services (101 | 32.1%), Health Care & Social Assistance (64 | 20.3%), Administrative & Support (47 | 14.9%), Public Administration (26 | 8.3%), and Finance & Insurance (22 | 7.0%).
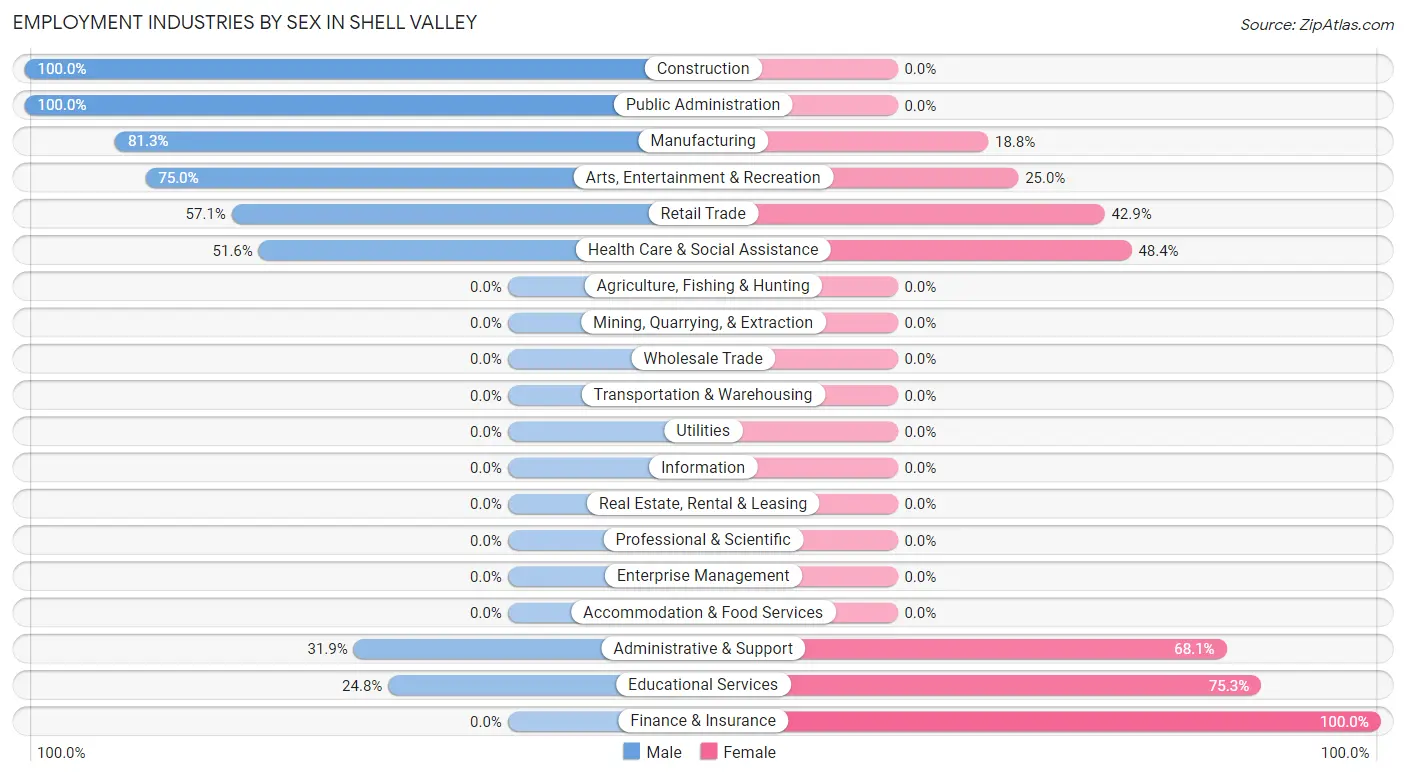
Employment Industries by Sex in Shell Valley
The Shell Valley industries that see more men than women are Construction (100.0%), Public Administration (100.0%), and Manufacturing (81.2%), whereas the industries that tend to have a higher number of women are Finance & Insurance (100.0%), Educational Services (75.2%), and Administrative & Support (68.1%).
| Industry | Male | Female |
| Agriculture, Fishing & Hunting | 0 (0.0%) | 0 (0.0%) |
| Mining, Quarrying, & Extraction | 0 (0.0%) | 0 (0.0%) |
| Construction | 7 (100.0%) | 0 (0.0%) |
| Manufacturing | 13 (81.2%) | 3 (18.8%) |
| Wholesale Trade | 0 (0.0%) | 0 (0.0%) |
| Retail Trade | 4 (57.1%) | 3 (42.9%) |
| Transportation & Warehousing | 0 (0.0%) | 0 (0.0%) |
| Utilities | 0 (0.0%) | 0 (0.0%) |
| Information | 0 (0.0%) | 0 (0.0%) |
| Finance & Insurance | 0 (0.0%) | 22 (100.0%) |
| Real Estate, Rental & Leasing | 0 (0.0%) | 0 (0.0%) |
| Professional & Scientific | 0 (0.0%) | 0 (0.0%) |
| Enterprise Management | 0 (0.0%) | 0 (0.0%) |
| Administrative & Support | 15 (31.9%) | 32 (68.1%) |
| Educational Services | 25 (24.7%) | 76 (75.2%) |
| Health Care & Social Assistance | 33 (51.6%) | 31 (48.4%) |
| Arts, Entertainment & Recreation | 9 (75.0%) | 3 (25.0%) |
| Accommodation & Food Services | 0 (0.0%) | 0 (0.0%) |
| Public Administration | 26 (100.0%) | 0 (0.0%) |
| Total | 132 (41.9%) | 183 (58.1%) |
Education in Shell Valley
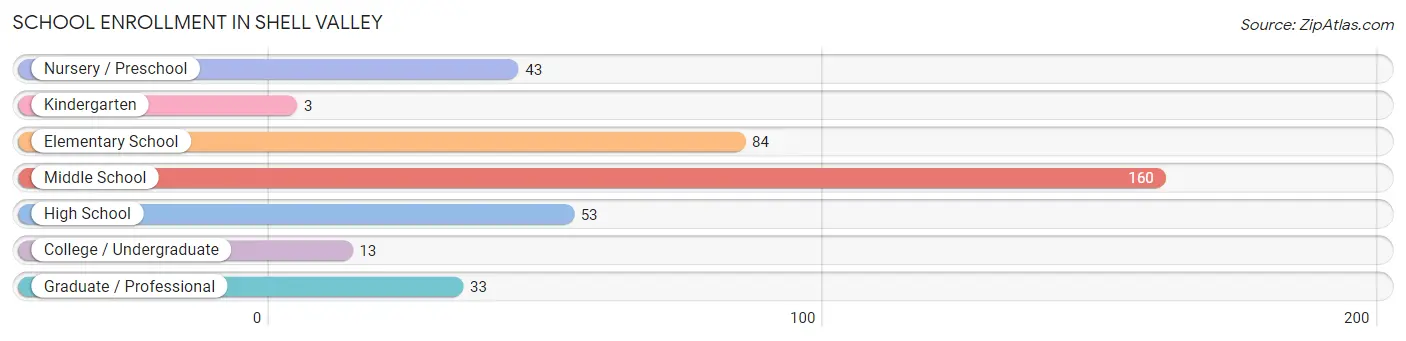
School Enrollment in Shell Valley
The most common levels of schooling among the 389 students in Shell Valley are middle school (160 | 41.1%), elementary school (84 | 21.6%), and high school (53 | 13.6%).
| School Level | # Students | % Students |
| Nursery / Preschool | 43 | 11.1% |
| Kindergarten | 3 | 0.8% |
| Elementary School | 84 | 21.6% |
| Middle School | 160 | 41.1% |
| High School | 53 | 13.6% |
| College / Undergraduate | 13 | 3.3% |
| Graduate / Professional | 33 | 8.5% |
| Total | 389 | 100.0% |
School Enrollment by Age by Funding Source in Shell Valley
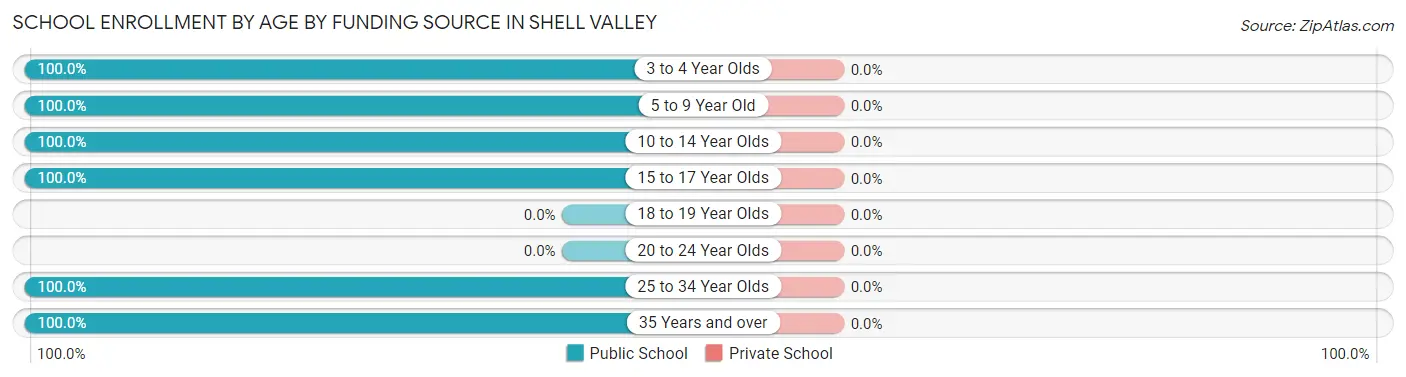
| Age Bracket | Public School | Private School |
| 3 to 4 Year Olds | 42 (100.0%) | 0 (0.0%) |
| 5 to 9 Year Old | 85 (100.0%) | 0 (0.0%) |
| 10 to 14 Year Olds | 163 (100.0%) | 0 (0.0%) |
| 15 to 17 Year Olds | 53 (100.0%) | 0 (0.0%) |
| 18 to 19 Year Olds | 0 (0.0%) | 0 (0.0%) |
| 20 to 24 Year Olds | 0 (0.0%) | 0 (0.0%) |
| 25 to 34 Year Olds | 10 (100.0%) | 0 (0.0%) |
| 35 Years and over | 36 (100.0%) | 0 (0.0%) |
| Total | 389 (100.0%) | 0 (0.0%) |
Educational Attainment by Field of Study in Shell Valley
Education (98 | 72.6%), science & technology (22 | 16.3%), arts & humanities (10 | 7.4%), and engineering (5 | 3.7%) are the most common fields of study among 135 individuals in Shell Valley who have obtained a bachelor's degree or higher.
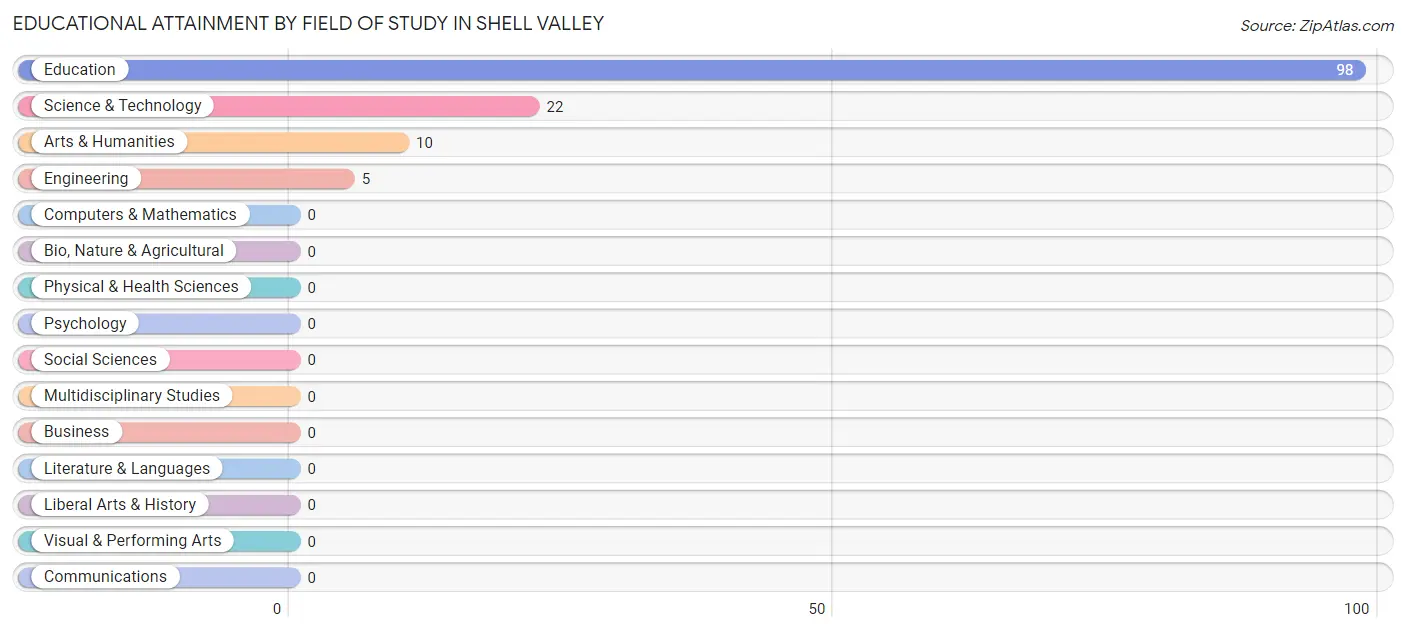
| Field of Study | # Graduates | % Graduates |
| Computers & Mathematics | 0 | 0.0% |
| Bio, Nature & Agricultural | 0 | 0.0% |
| Physical & Health Sciences | 0 | 0.0% |
| Psychology | 0 | 0.0% |
| Social Sciences | 0 | 0.0% |
| Engineering | 5 | 3.7% |
| Multidisciplinary Studies | 0 | 0.0% |
| Science & Technology | 22 | 16.3% |
| Business | 0 | 0.0% |
| Education | 98 | 72.6% |
| Literature & Languages | 0 | 0.0% |
| Liberal Arts & History | 0 | 0.0% |
| Visual & Performing Arts | 0 | 0.0% |
| Communications | 0 | 0.0% |
| Arts & Humanities | 10 | 7.4% |
| Total | 135 | 100.0% |
Transportation & Commute in Shell Valley
Vehicle Availability by Sex in Shell Valley
The most prevalent vehicle ownership categories in Shell Valley are males with 2 vehicles (51, accounting for 55.4%) and females with 2 vehicles (114, making up 27.9%).
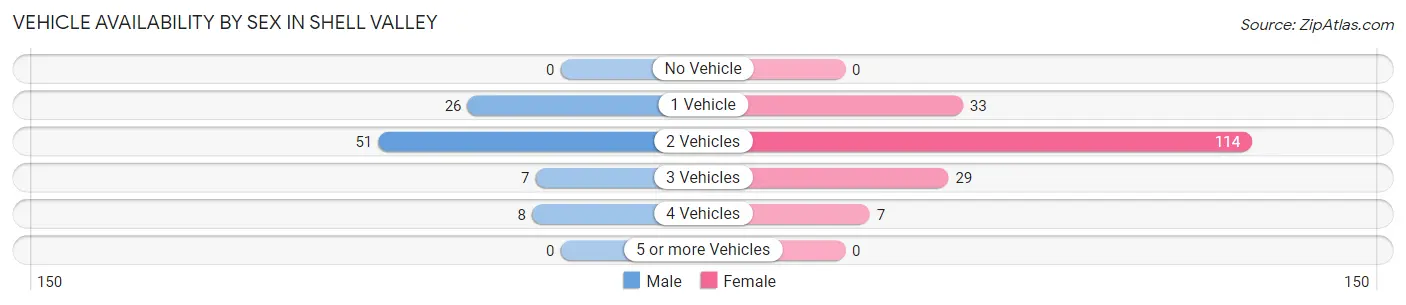
| Vehicles Available | Male | Female |
| No Vehicle | 0 (0.0%) | 0 (0.0%) |
| 1 Vehicle | 26 (28.3%) | 33 (18.0%) |
| 2 Vehicles | 51 (55.4%) | 114 (62.3%) |
| 3 Vehicles | 7 (7.6%) | 29 (15.9%) |
| 4 Vehicles | 8 (8.7%) | 7 (3.8%) |
| 5 or more Vehicles | 0 (0.0%) | 0 (0.0%) |
| Total | 92 (100.0%) | 183 (100.0%) |
Commute Time in Shell Valley
The most frequently occuring commute durations in Shell Valley are 5 to 9 minutes (63 commuters, 22.9%), 15 to 19 minutes (53 commuters, 19.3%), and 10 to 14 minutes (47 commuters, 17.1%).
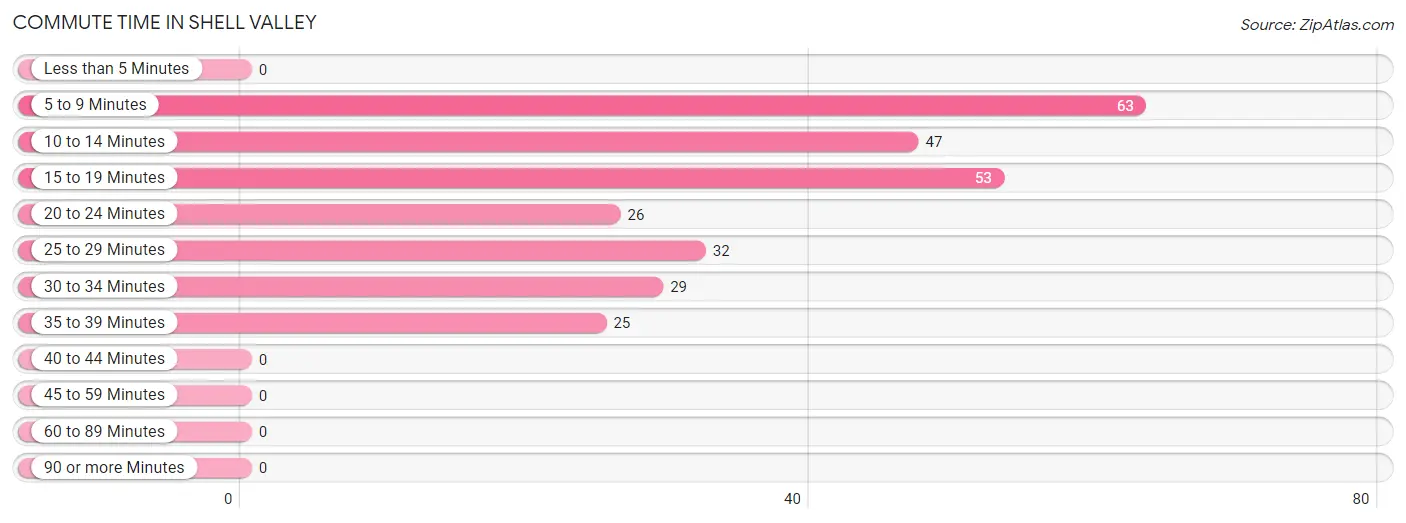
| Commute Time | # Commuters | % Commuters |
| Less than 5 Minutes | 0 | 0.0% |
| 5 to 9 Minutes | 63 | 22.9% |
| 10 to 14 Minutes | 47 | 17.1% |
| 15 to 19 Minutes | 53 | 19.3% |
| 20 to 24 Minutes | 26 | 9.5% |
| 25 to 29 Minutes | 32 | 11.6% |
| 30 to 34 Minutes | 29 | 10.5% |
| 35 to 39 Minutes | 25 | 9.1% |
| 40 to 44 Minutes | 0 | 0.0% |
| 45 to 59 Minutes | 0 | 0.0% |
| 60 to 89 Minutes | 0 | 0.0% |
| 90 or more Minutes | 0 | 0.0% |
Commute Time by Sex in Shell Valley
The most common commute times in Shell Valley are 15 to 19 minutes (26 commuters, 28.3%) for males and 5 to 9 minutes (63 commuters, 34.4%) for females.
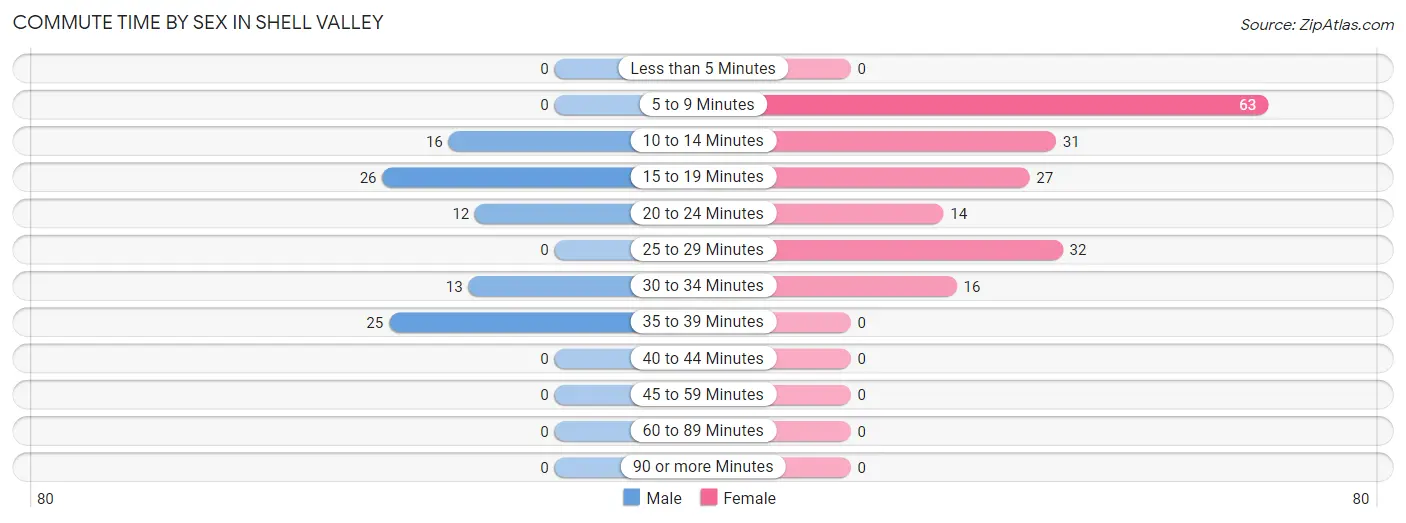
| Commute Time | Male | Female |
| Less than 5 Minutes | 0 (0.0%) | 0 (0.0%) |
| 5 to 9 Minutes | 0 (0.0%) | 63 (34.4%) |
| 10 to 14 Minutes | 16 (17.4%) | 31 (16.9%) |
| 15 to 19 Minutes | 26 (28.3%) | 27 (14.7%) |
| 20 to 24 Minutes | 12 (13.0%) | 14 (7.6%) |
| 25 to 29 Minutes | 0 (0.0%) | 32 (17.5%) |
| 30 to 34 Minutes | 13 (14.1%) | 16 (8.7%) |
| 35 to 39 Minutes | 25 (27.2%) | 0 (0.0%) |
| 40 to 44 Minutes | 0 (0.0%) | 0 (0.0%) |
| 45 to 59 Minutes | 0 (0.0%) | 0 (0.0%) |
| 60 to 89 Minutes | 0 (0.0%) | 0 (0.0%) |
| 90 or more Minutes | 0 (0.0%) | 0 (0.0%) |
Time of Departure to Work by Sex in Shell Valley
The most frequent times of departure to work in Shell Valley are 7:00 AM to 7:29 AM (32, 34.8%) for males and 7:30 AM to 7:59 AM (74, 40.4%) for females.
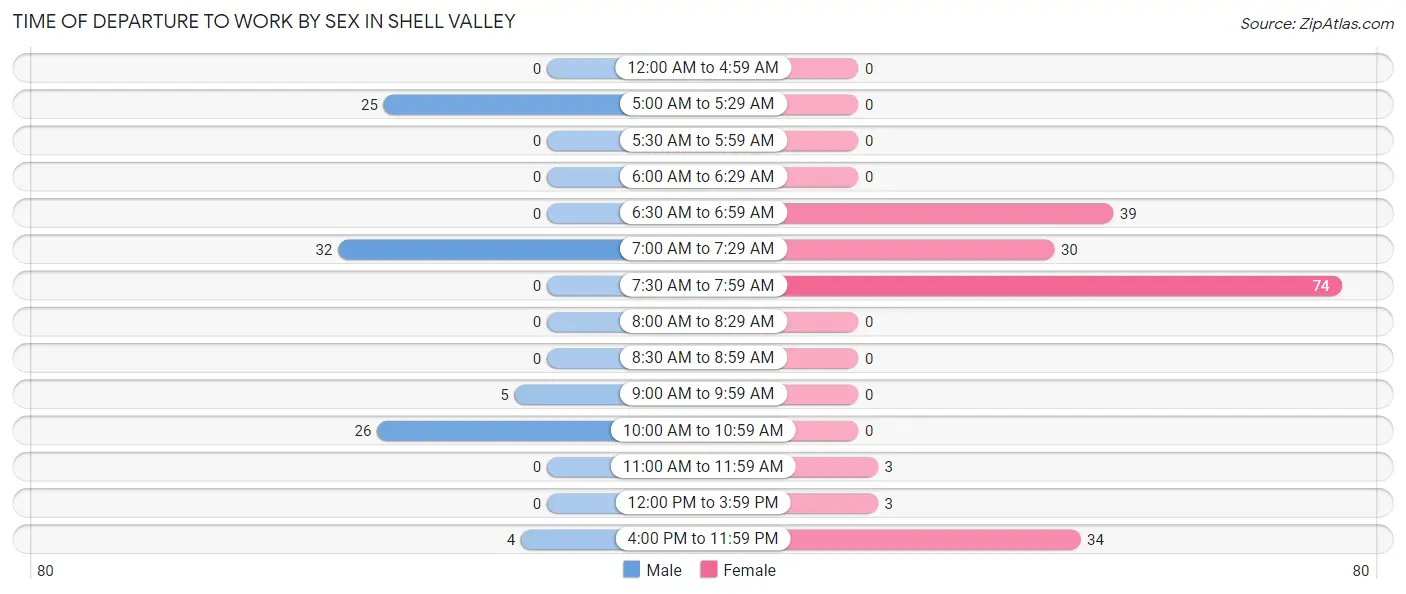
| Time of Departure | Male | Female |
| 12:00 AM to 4:59 AM | 0 (0.0%) | 0 (0.0%) |
| 5:00 AM to 5:29 AM | 25 (27.2%) | 0 (0.0%) |
| 5:30 AM to 5:59 AM | 0 (0.0%) | 0 (0.0%) |
| 6:00 AM to 6:29 AM | 0 (0.0%) | 0 (0.0%) |
| 6:30 AM to 6:59 AM | 0 (0.0%) | 39 (21.3%) |
| 7:00 AM to 7:29 AM | 32 (34.8%) | 30 (16.4%) |
| 7:30 AM to 7:59 AM | 0 (0.0%) | 74 (40.4%) |
| 8:00 AM to 8:29 AM | 0 (0.0%) | 0 (0.0%) |
| 8:30 AM to 8:59 AM | 0 (0.0%) | 0 (0.0%) |
| 9:00 AM to 9:59 AM | 5 (5.4%) | 0 (0.0%) |
| 10:00 AM to 10:59 AM | 26 (28.3%) | 0 (0.0%) |
| 11:00 AM to 11:59 AM | 0 (0.0%) | 3 (1.6%) |
| 12:00 PM to 3:59 PM | 0 (0.0%) | 3 (1.6%) |
| 4:00 PM to 11:59 PM | 4 (4.3%) | 34 (18.6%) |
| Total | 92 (100.0%) | 183 (100.0%) |
Housing Occupancy in Shell Valley
Occupancy by Ownership in Shell Valley
Of the total 337 dwellings in Shell Valley, owner-occupied units account for 214 (63.5%), while renter-occupied units make up 123 (36.5%).
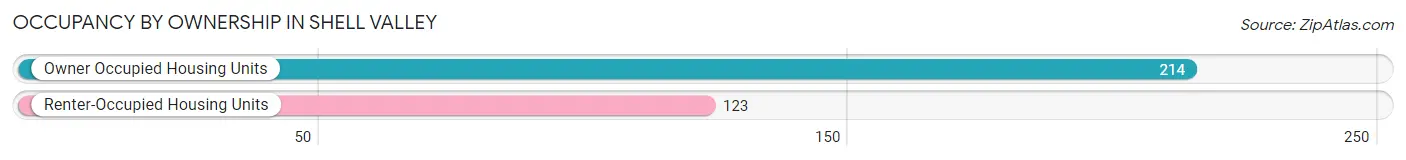
| Occupancy | # Housing Units | % Housing Units |
| Owner Occupied Housing Units | 214 | 63.5% |
| Renter-Occupied Housing Units | 123 | 36.5% |
| Total Occupied Housing Units | 337 | 100.0% |
Occupancy by Household Size in Shell Valley
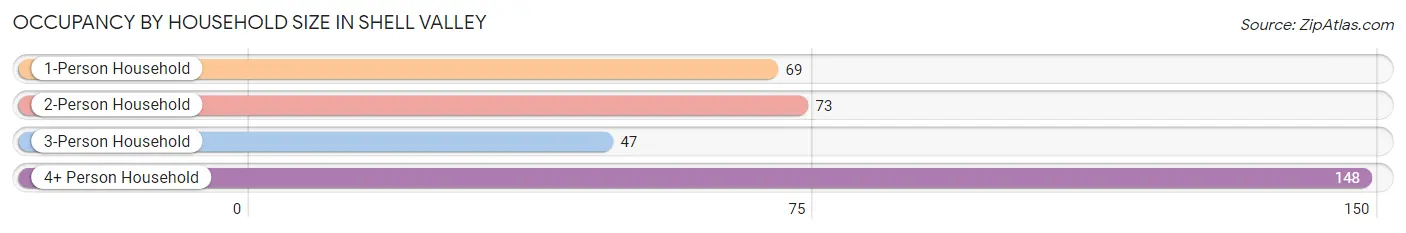
| Household Size | # Housing Units | % Housing Units |
| 1-Person Household | 69 | 20.5% |
| 2-Person Household | 73 | 21.7% |
| 3-Person Household | 47 | 14.0% |
| 4+ Person Household | 148 | 43.9% |
| Total Housing Units | 337 | 100.0% |
Occupancy by Ownership by Household Size in Shell Valley
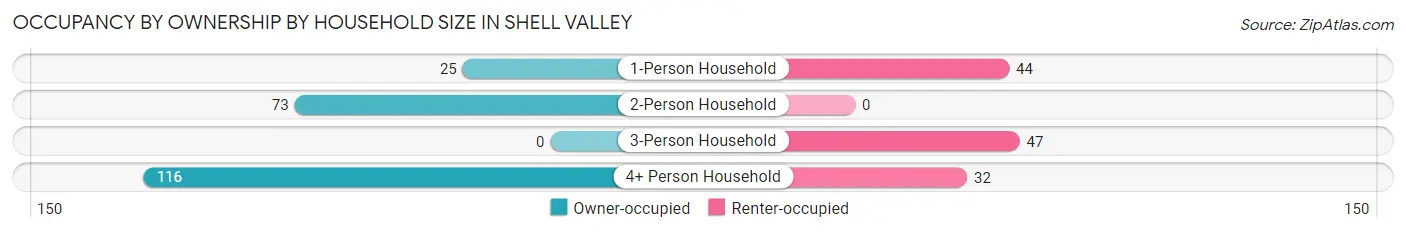
| Household Size | Owner-occupied | Renter-occupied |
| 1-Person Household | 25 (36.2%) | 44 (63.8%) |
| 2-Person Household | 73 (100.0%) | 0 (0.0%) |
| 3-Person Household | 0 (0.0%) | 47 (100.0%) |
| 4+ Person Household | 116 (78.4%) | 32 (21.6%) |
| Total Housing Units | 214 (63.5%) | 123 (36.5%) |
Occupancy by Educational Attainment in Shell Valley
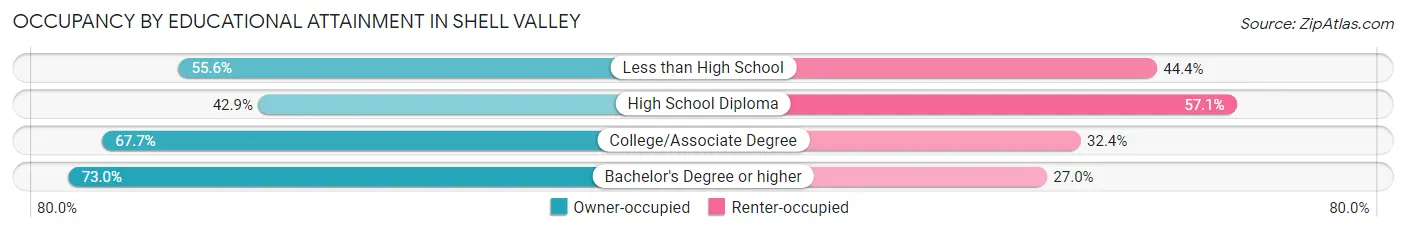
| Household Size | Owner-occupied | Renter-occupied |
| Less than High School | 25 (55.6%) | 20 (44.4%) |
| High School Diploma | 24 (42.9%) | 32 (57.1%) |
| College/Associate Degree | 92 (67.6%) | 44 (32.4%) |
| Bachelor's Degree or higher | 73 (73.0%) | 27 (27.0%) |
Occupancy by Age of Householder in Shell Valley
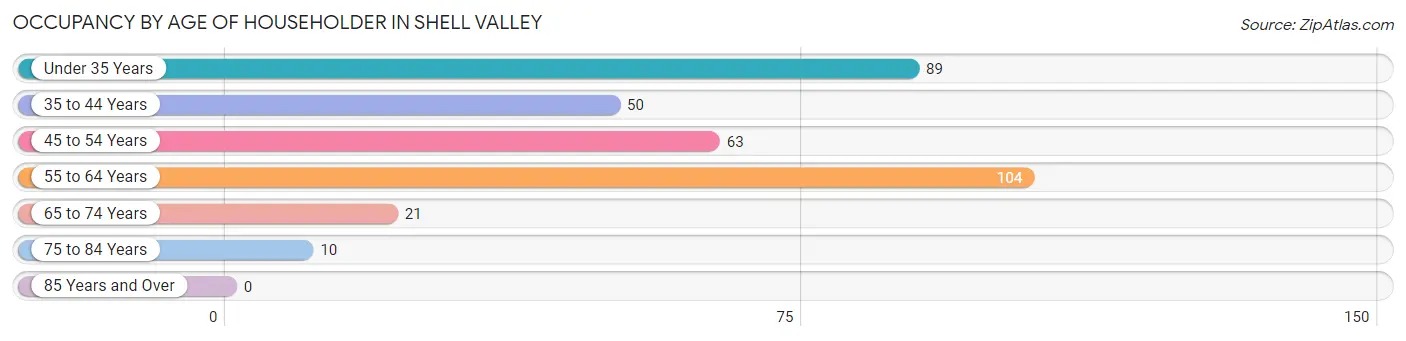
| Age Bracket | # Households | % Households |
| Under 35 Years | 89 | 26.4% |
| 35 to 44 Years | 50 | 14.8% |
| 45 to 54 Years | 63 | 18.7% |
| 55 to 64 Years | 104 | 30.9% |
| 65 to 74 Years | 21 | 6.2% |
| 75 to 84 Years | 10 | 3.0% |
| 85 Years and Over | 0 | 0.0% |
| Total | 337 | 100.0% |
Housing Finances in Shell Valley
Median Income by Occupancy in Shell Valley
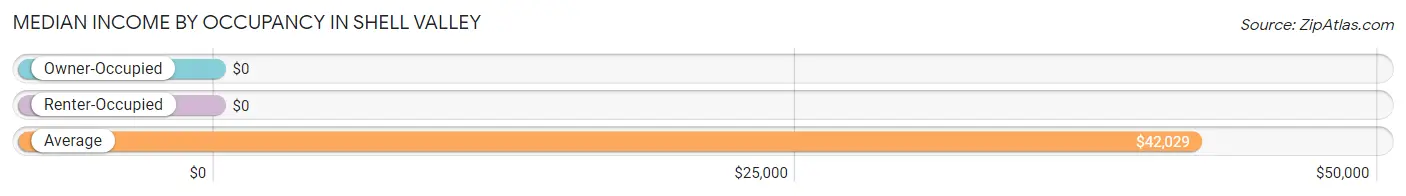
| Occupancy Type | # Households | Median Income |
| Owner-Occupied | 214 (63.5%) | $0 |
| Renter-Occupied | 123 (36.5%) | $0 |
| Average | 337 (100.0%) | $42,029 |
Occupancy by Householder Income Bracket in Shell Valley
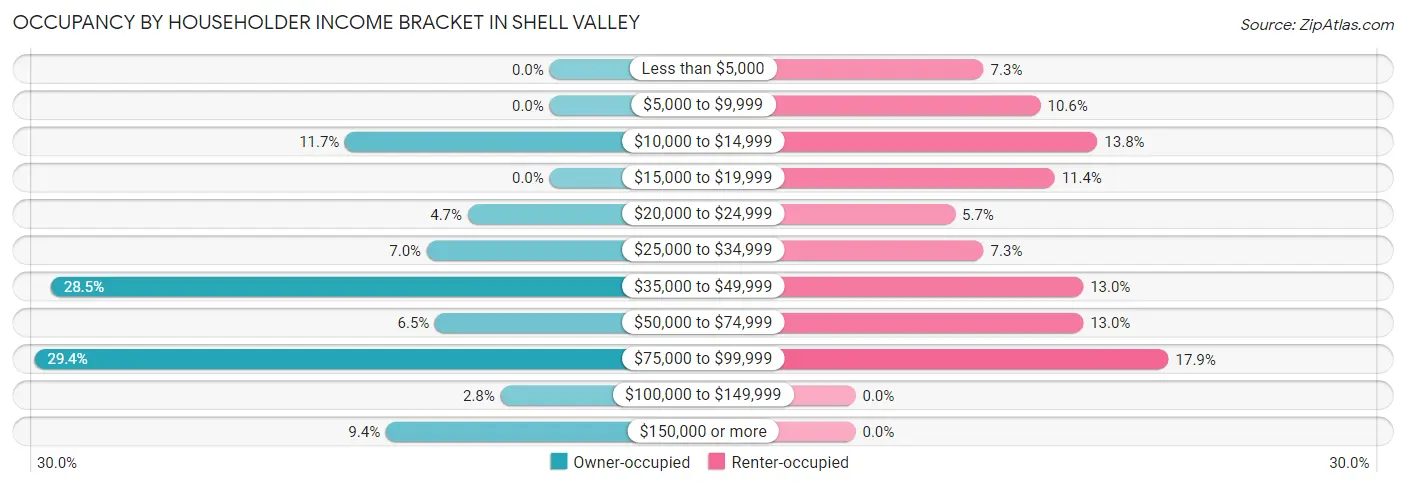
| Income Bracket | Owner-occupied | Renter-occupied |
| Less than $5,000 | 0 (0.0%) | 9 (7.3%) |
| $5,000 to $9,999 | 0 (0.0%) | 13 (10.6%) |
| $10,000 to $14,999 | 25 (11.7%) | 17 (13.8%) |
| $15,000 to $19,999 | 0 (0.0%) | 14 (11.4%) |
| $20,000 to $24,999 | 10 (4.7%) | 7 (5.7%) |
| $25,000 to $34,999 | 15 (7.0%) | 9 (7.3%) |
| $35,000 to $49,999 | 61 (28.5%) | 16 (13.0%) |
| $50,000 to $74,999 | 14 (6.5%) | 16 (13.0%) |
| $75,000 to $99,999 | 63 (29.4%) | 22 (17.9%) |
| $100,000 to $149,999 | 6 (2.8%) | 0 (0.0%) |
| $150,000 or more | 20 (9.3%) | 0 (0.0%) |
| Total | 214 (100.0%) | 123 (100.0%) |
Monthly Housing Cost Tiers in Shell Valley
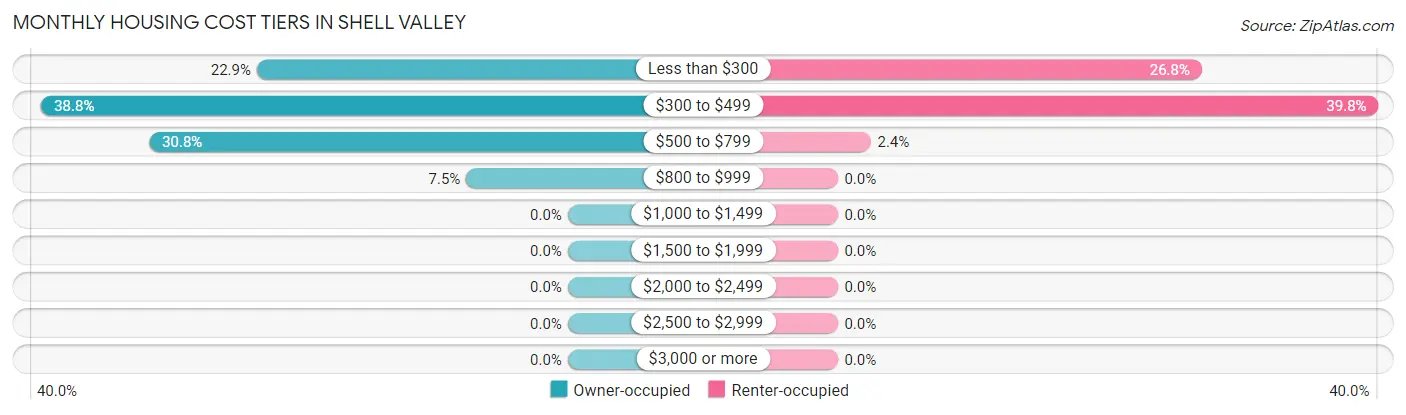
| Monthly Cost | Owner-occupied | Renter-occupied |
| Less than $300 | 49 (22.9%) | 33 (26.8%) |
| $300 to $499 | 83 (38.8%) | 49 (39.8%) |
| $500 to $799 | 66 (30.8%) | 3 (2.4%) |
| $800 to $999 | 16 (7.5%) | 0 (0.0%) |
| $1,000 to $1,499 | 0 (0.0%) | 0 (0.0%) |
| $1,500 to $1,999 | 0 (0.0%) | 0 (0.0%) |
| $2,000 to $2,499 | 0 (0.0%) | 0 (0.0%) |
| $2,500 to $2,999 | 0 (0.0%) | 0 (0.0%) |
| $3,000 or more | 0 (0.0%) | 0 (0.0%) |
| Total | 214 (100.0%) | 123 (100.0%) |
Physical Housing Characteristics in Shell Valley
Housing Structures in Shell Valley
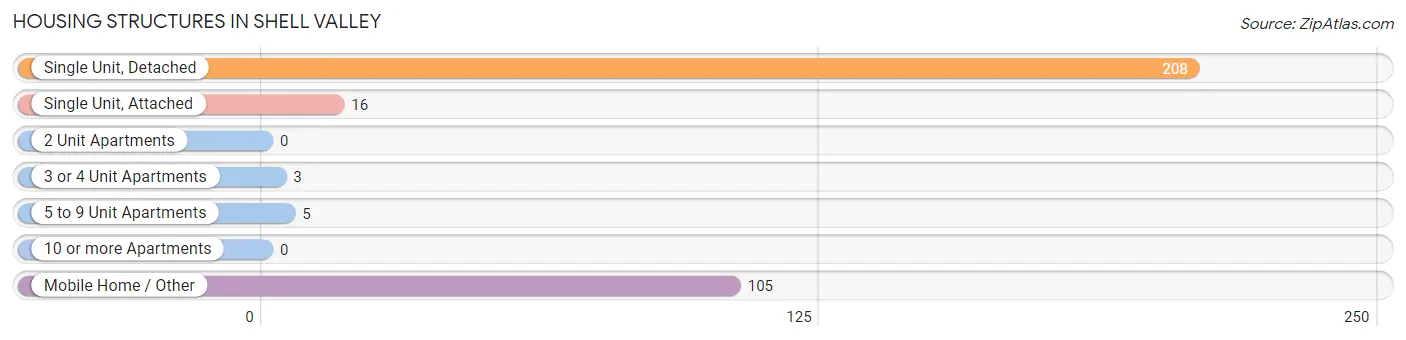
| Structure Type | # Housing Units | % Housing Units |
| Single Unit, Detached | 208 | 61.7% |
| Single Unit, Attached | 16 | 4.8% |
| 2 Unit Apartments | 0 | 0.0% |
| 3 or 4 Unit Apartments | 3 | 0.9% |
| 5 to 9 Unit Apartments | 5 | 1.5% |
| 10 or more Apartments | 0 | 0.0% |
| Mobile Home / Other | 105 | 31.2% |
| Total | 337 | 100.0% |
Housing Structures by Occupancy in Shell Valley
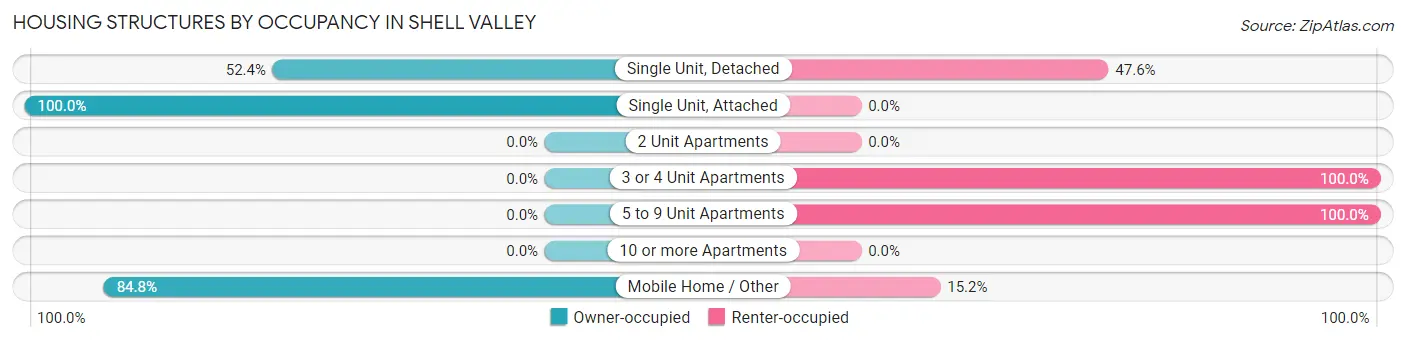
| Structure Type | Owner-occupied | Renter-occupied |
| Single Unit, Detached | 109 (52.4%) | 99 (47.6%) |
| Single Unit, Attached | 16 (100.0%) | 0 (0.0%) |
| 2 Unit Apartments | 0 (0.0%) | 0 (0.0%) |
| 3 or 4 Unit Apartments | 0 (0.0%) | 3 (100.0%) |
| 5 to 9 Unit Apartments | 0 (0.0%) | 5 (100.0%) |
| 10 or more Apartments | 0 (0.0%) | 0 (0.0%) |
| Mobile Home / Other | 89 (84.8%) | 16 (15.2%) |
| Total | 214 (63.5%) | 123 (36.5%) |
Housing Structures by Number of Rooms in Shell Valley
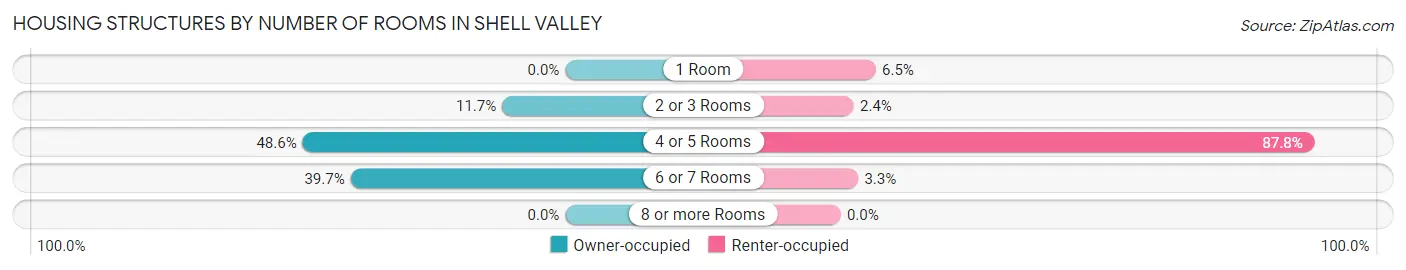
| Number of Rooms | Owner-occupied | Renter-occupied |
| 1 Room | 0 (0.0%) | 8 (6.5%) |
| 2 or 3 Rooms | 25 (11.7%) | 3 (2.4%) |
| 4 or 5 Rooms | 104 (48.6%) | 108 (87.8%) |
| 6 or 7 Rooms | 85 (39.7%) | 4 (3.3%) |
| 8 or more Rooms | 0 (0.0%) | 0 (0.0%) |
| Total | 214 (100.0%) | 123 (100.0%) |
Housing Structure by Heating Type in Shell Valley
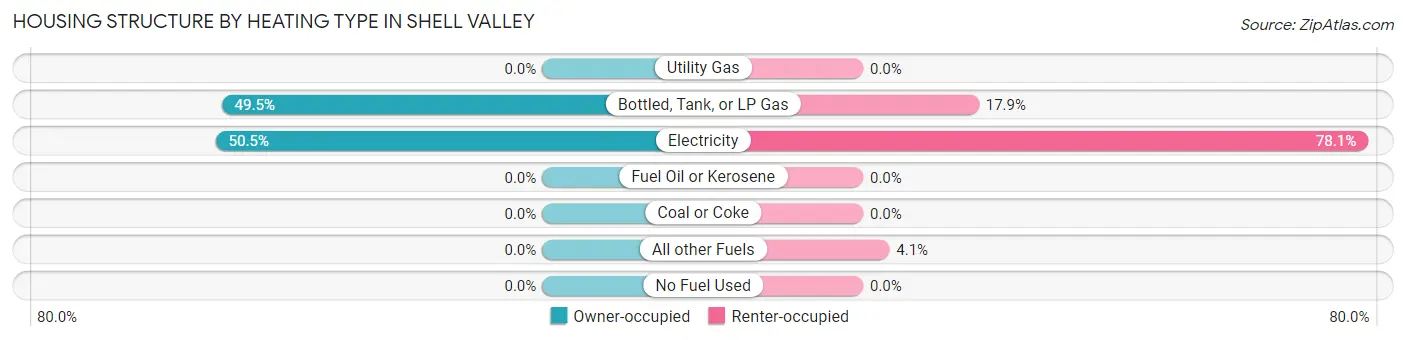
| Heating Type | Owner-occupied | Renter-occupied |
| Utility Gas | 0 (0.0%) | 0 (0.0%) |
| Bottled, Tank, or LP Gas | 106 (49.5%) | 22 (17.9%) |
| Electricity | 108 (50.5%) | 96 (78.0%) |
| Fuel Oil or Kerosene | 0 (0.0%) | 0 (0.0%) |
| Coal or Coke | 0 (0.0%) | 0 (0.0%) |
| All other Fuels | 0 (0.0%) | 5 (4.1%) |
| No Fuel Used | 0 (0.0%) | 0 (0.0%) |
| Total | 214 (100.0%) | 123 (100.0%) |
Household Vehicle Usage in Shell Valley
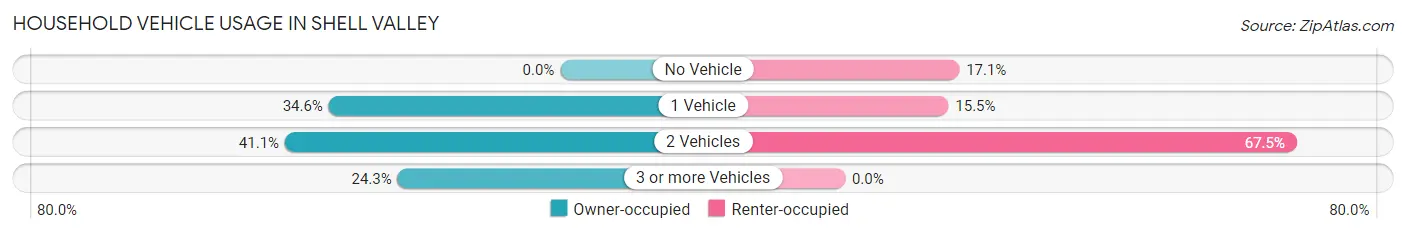
| Vehicles per Household | Owner-occupied | Renter-occupied |
| No Vehicle | 0 (0.0%) | 21 (17.1%) |
| 1 Vehicle | 74 (34.6%) | 19 (15.4%) |
| 2 Vehicles | 88 (41.1%) | 83 (67.5%) |
| 3 or more Vehicles | 52 (24.3%) | 0 (0.0%) |
| Total | 214 (100.0%) | 123 (100.0%) |
Real Estate & Mortgages in Shell Valley
Real Estate and Mortgage Overview in Shell Valley
| Characteristic | Without Mortgage | With Mortgage |
| Housing Units | 198 | 16 |
| Median Property Value | $60,800 | $0 |
| Median Household Income | - | - |
| Monthly Housing Costs | $386 | $0 |
| Real Estate Taxes | - | - |
Property Value by Mortgage Status in Shell Valley
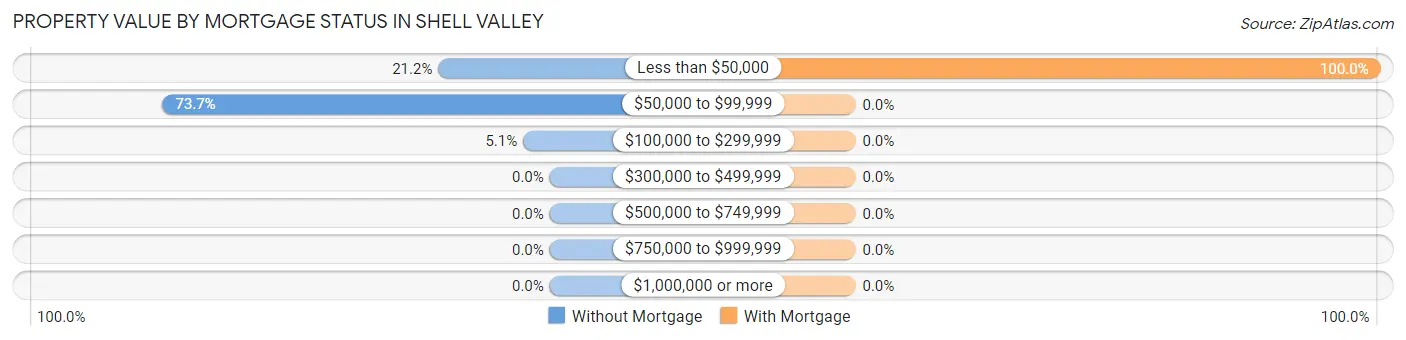
| Property Value | Without Mortgage | With Mortgage |
| Less than $50,000 | 42 (21.2%) | 16 (100.0%) |
| $50,000 to $99,999 | 146 (73.7%) | 0 (0.0%) |
| $100,000 to $299,999 | 10 (5.1%) | 0 (0.0%) |
| $300,000 to $499,999 | 0 (0.0%) | 0 (0.0%) |
| $500,000 to $749,999 | 0 (0.0%) | 0 (0.0%) |
| $750,000 to $999,999 | 0 (0.0%) | 0 (0.0%) |
| $1,000,000 or more | 0 (0.0%) | 0 (0.0%) |
| Total | 198 (100.0%) | 16 (100.0%) |
Household Income by Mortgage Status in Shell Valley
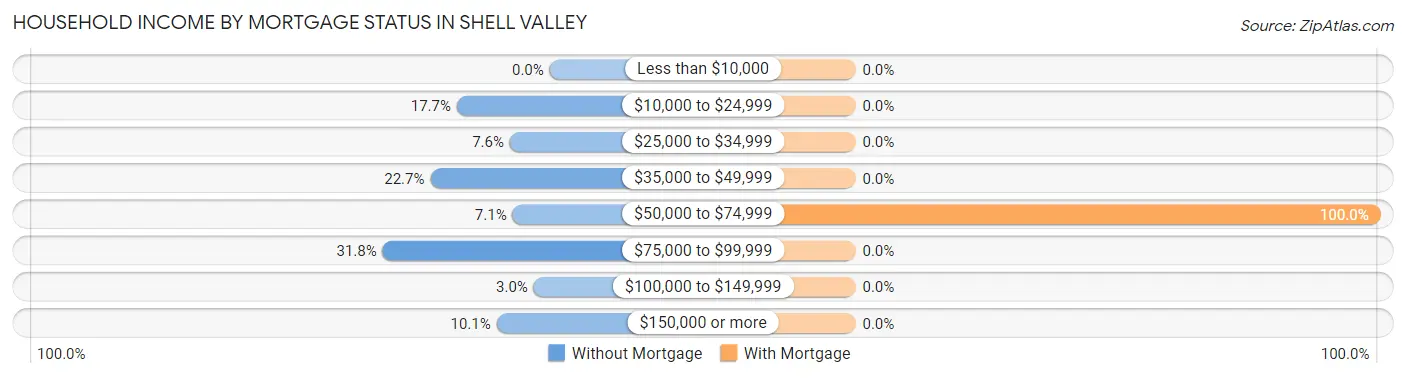
| Household Income | Without Mortgage | With Mortgage |
| Less than $10,000 | 0 (0.0%) | 0 (0.0%) |
| $10,000 to $24,999 | 35 (17.7%) | 0 (0.0%) |
| $25,000 to $34,999 | 15 (7.6%) | 0 (0.0%) |
| $35,000 to $49,999 | 45 (22.7%) | 0 (0.0%) |
| $50,000 to $74,999 | 14 (7.1%) | 16 (100.0%) |
| $75,000 to $99,999 | 63 (31.8%) | 0 (0.0%) |
| $100,000 to $149,999 | 6 (3.0%) | 0 (0.0%) |
| $150,000 or more | 20 (10.1%) | 0 (0.0%) |
| Total | 198 (100.0%) | 16 (100.0%) |
Property Value to Household Income Ratio in Shell Valley
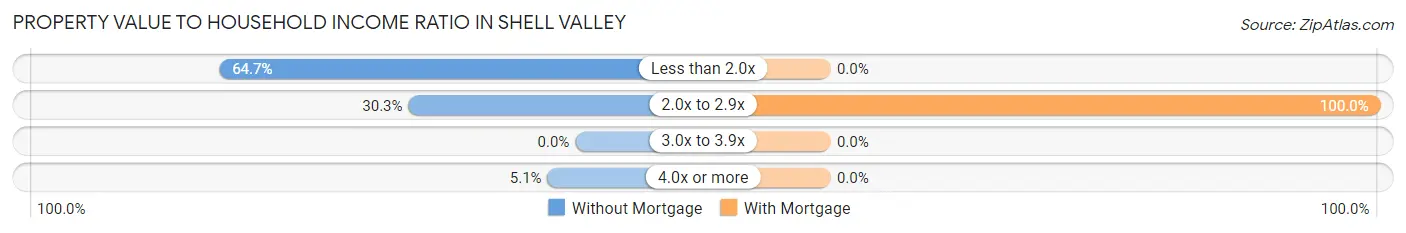
| Value-to-Income Ratio | Without Mortgage | With Mortgage |
| Less than 2.0x | 128 (64.6%) | 0 (0.0%) |
| 2.0x to 2.9x | 60 (30.3%) | 16 (100.0%) |
| 3.0x to 3.9x | 0 (0.0%) | 0 (0.0%) |
| 4.0x or more | 10 (5.1%) | 0 (0.0%) |
| Total | 198 (100.0%) | 16 (100.0%) |
Real Estate Taxes by Mortgage Status in Shell Valley
| Property Taxes | Without Mortgage | With Mortgage |
| Less than $800 | 0 (0.0%) | 0 (0.0%) |
| $800 to $1,499 | 0 (0.0%) | 0 (0.0%) |
| $800 to $1,499 | 0 (0.0%) | 0 (0.0%) |
| Total | 198 (100.0%) | 16 (100.0%) |
Health & Disability in Shell Valley
Health Insurance Coverage by Age in Shell Valley
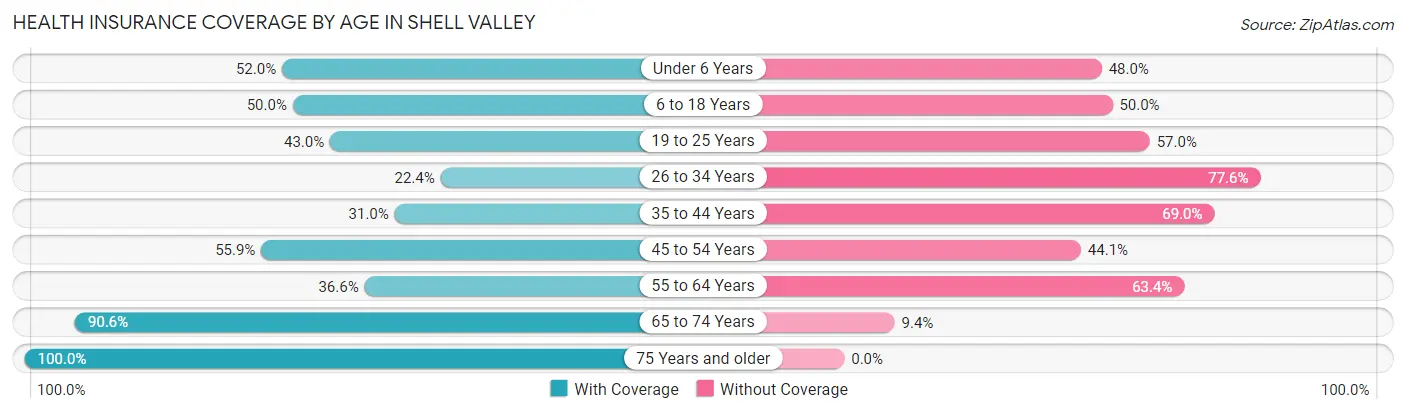
| Age Bracket | With Coverage | Without Coverage |
| Under 6 Years | 65 (52.0%) | 60 (48.0%) |
| 6 to 18 Years | 154 (50.0%) | 154 (50.0%) |
| 19 to 25 Years | 34 (43.0%) | 45 (57.0%) |
| 26 to 34 Years | 48 (22.4%) | 166 (77.6%) |
| 35 to 44 Years | 31 (31.0%) | 69 (69.0%) |
| 45 to 54 Years | 57 (55.9%) | 45 (44.1%) |
| 55 to 64 Years | 78 (36.6%) | 135 (63.4%) |
| 65 to 74 Years | 29 (90.6%) | 3 (9.4%) |
| 75 Years and older | 10 (100.0%) | 0 (0.0%) |
| Total | 506 (42.8%) | 677 (57.2%) |
Health Insurance Coverage by Citizenship Status in Shell Valley
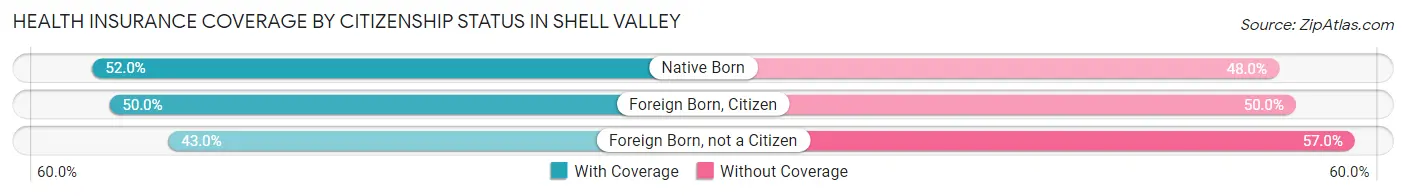
| Citizenship Status | With Coverage | Without Coverage |
| Native Born | 65 (52.0%) | 60 (48.0%) |
| Foreign Born, Citizen | 154 (50.0%) | 154 (50.0%) |
| Foreign Born, not a Citizen | 34 (43.0%) | 45 (57.0%) |
Health Insurance Coverage by Household Income in Shell Valley
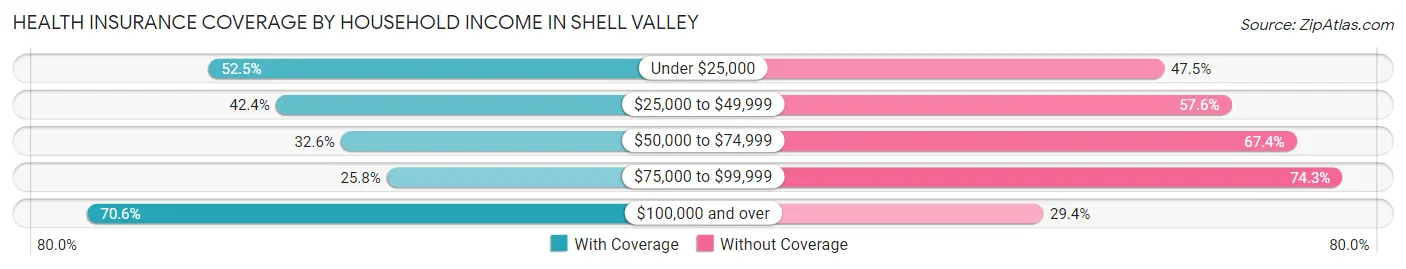
| Household Income | With Coverage | Without Coverage |
| Under $25,000 | 128 (52.5%) | 116 (47.5%) |
| $25,000 to $49,999 | 139 (42.4%) | 189 (57.6%) |
| $50,000 to $74,999 | 62 (32.6%) | 128 (67.4%) |
| $75,000 to $99,999 | 69 (25.8%) | 199 (74.3%) |
| $100,000 and over | 108 (70.6%) | 45 (29.4%) |
Public vs Private Health Insurance Coverage by Age in Shell Valley
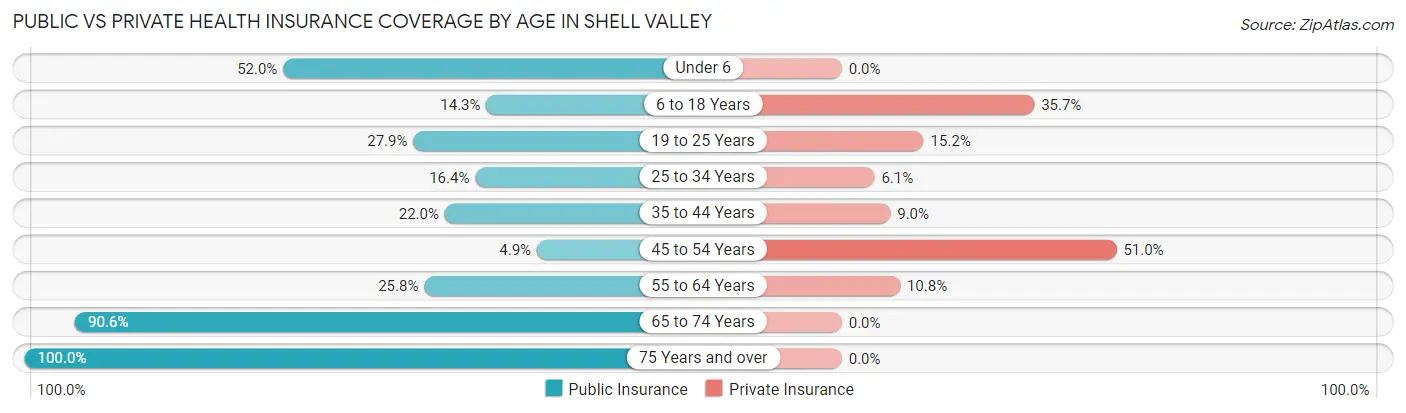
| Age Bracket | Public Insurance | Private Insurance |
| Under 6 | 65 (52.0%) | 0 (0.0%) |
| 6 to 18 Years | 44 (14.3%) | 110 (35.7%) |
| 19 to 25 Years | 22 (27.9%) | 12 (15.2%) |
| 25 to 34 Years | 35 (16.4%) | 13 (6.1%) |
| 35 to 44 Years | 22 (22.0%) | 9 (9.0%) |
| 45 to 54 Years | 5 (4.9%) | 52 (51.0%) |
| 55 to 64 Years | 55 (25.8%) | 23 (10.8%) |
| 65 to 74 Years | 29 (90.6%) | 0 (0.0%) |
| 75 Years and over | 10 (100.0%) | 0 (0.0%) |
| Total | 287 (24.3%) | 219 (18.5%) |
Disability Status by Sex by Age in Shell Valley
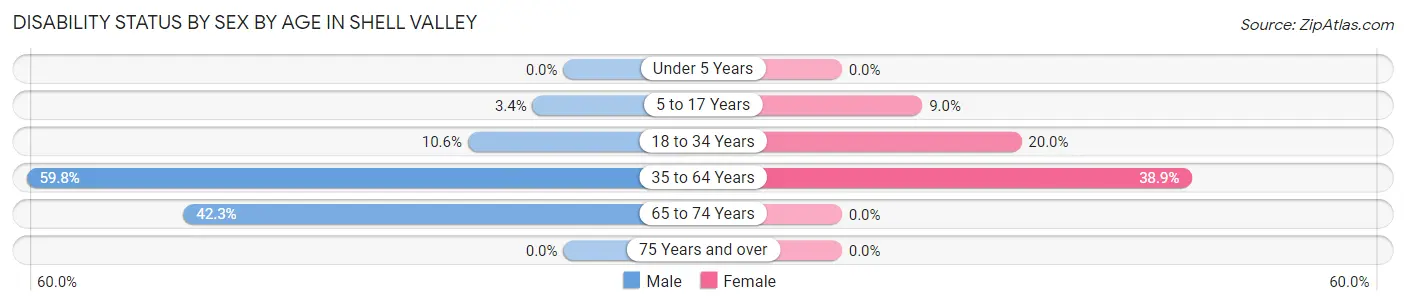
| Age Bracket | Male | Female |
| Under 5 Years | 0 (0.0%) | 0 (0.0%) |
| 5 to 17 Years | 6 (3.4%) | 12 (9.0%) |
| 18 to 34 Years | 20 (10.6%) | 21 (20.0%) |
| 35 to 64 Years | 116 (59.8%) | 86 (38.9%) |
| 65 to 74 Years | 11 (42.3%) | 0 (0.0%) |
| 75 Years and over | 0 (0.0%) | 0 (0.0%) |
Disability Class by Sex by Age in Shell Valley
Disability Class: Hearing Difficulty
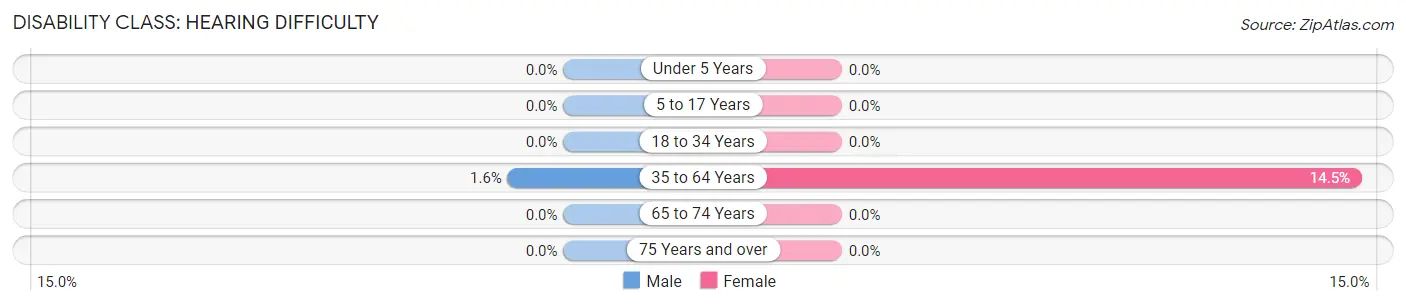
| Age Bracket | Male | Female |
| Under 5 Years | 0 (0.0%) | 0 (0.0%) |
| 5 to 17 Years | 0 (0.0%) | 0 (0.0%) |
| 18 to 34 Years | 0 (0.0%) | 0 (0.0%) |
| 35 to 64 Years | 3 (1.5%) | 32 (14.5%) |
| 65 to 74 Years | 0 (0.0%) | 0 (0.0%) |
| 75 Years and over | 0 (0.0%) | 0 (0.0%) |
Disability Class: Vision Difficulty
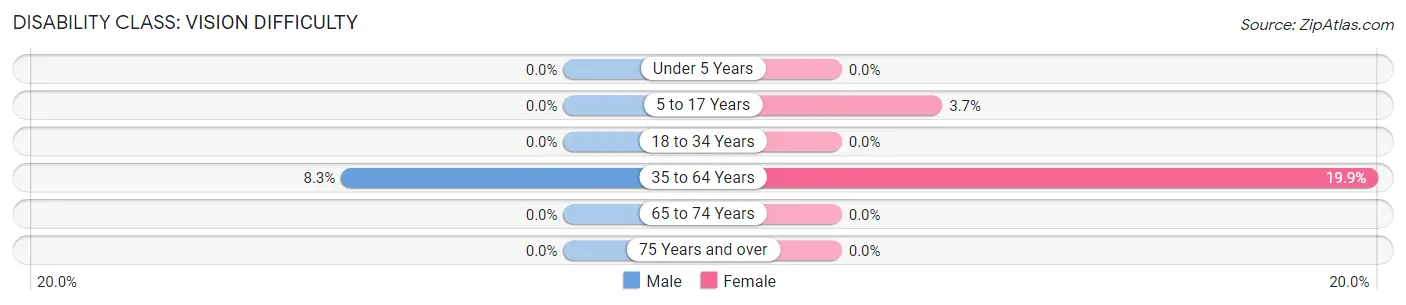
| Age Bracket | Male | Female |
| Under 5 Years | 0 (0.0%) | 0 (0.0%) |
| 5 to 17 Years | 0 (0.0%) | 5 (3.7%) |
| 18 to 34 Years | 0 (0.0%) | 0 (0.0%) |
| 35 to 64 Years | 16 (8.3%) | 44 (19.9%) |
| 65 to 74 Years | 0 (0.0%) | 0 (0.0%) |
| 75 Years and over | 0 (0.0%) | 0 (0.0%) |
Disability Class: Cognitive Difficulty
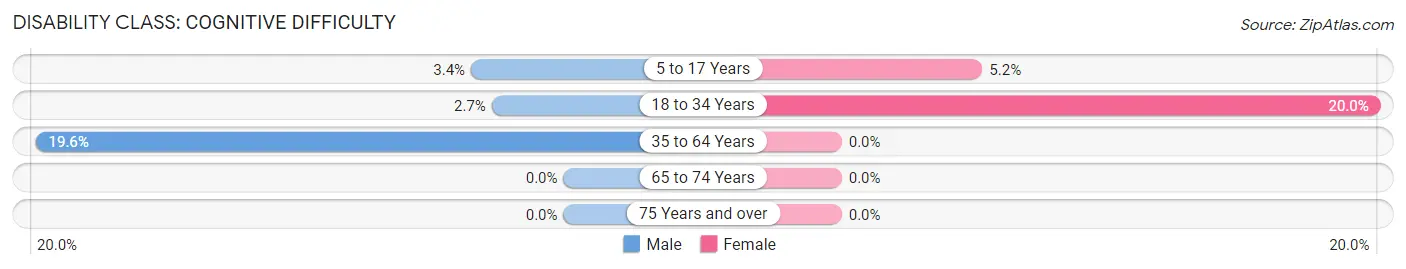
| Age Bracket | Male | Female |
| 5 to 17 Years | 6 (3.4%) | 7 (5.2%) |
| 18 to 34 Years | 5 (2.7%) | 21 (20.0%) |
| 35 to 64 Years | 38 (19.6%) | 0 (0.0%) |
| 65 to 74 Years | 0 (0.0%) | 0 (0.0%) |
| 75 Years and over | 0 (0.0%) | 0 (0.0%) |
Disability Class: Ambulatory Difficulty
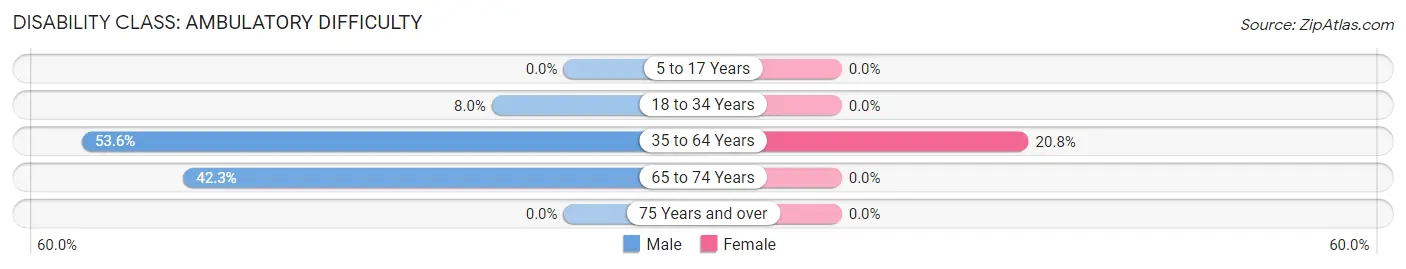
| Age Bracket | Male | Female |
| 5 to 17 Years | 0 (0.0%) | 0 (0.0%) |
| 18 to 34 Years | 15 (8.0%) | 0 (0.0%) |
| 35 to 64 Years | 104 (53.6%) | 46 (20.8%) |
| 65 to 74 Years | 11 (42.3%) | 0 (0.0%) |
| 75 Years and over | 0 (0.0%) | 0 (0.0%) |
Disability Class: Self-Care Difficulty
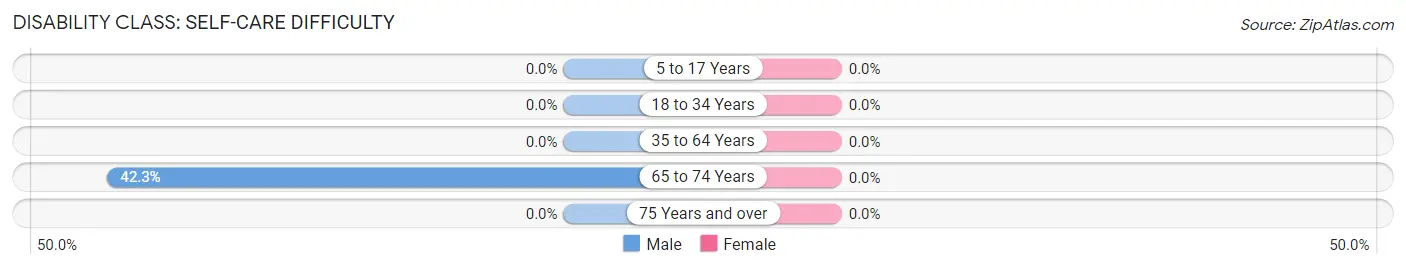
| Age Bracket | Male | Female |
| 5 to 17 Years | 0 (0.0%) | 0 (0.0%) |
| 18 to 34 Years | 0 (0.0%) | 0 (0.0%) |
| 35 to 64 Years | 0 (0.0%) | 0 (0.0%) |
| 65 to 74 Years | 11 (42.3%) | 0 (0.0%) |
| 75 Years and over | 0 (0.0%) | 0 (0.0%) |
Technology Access in Shell Valley
Computing Device Access in Shell Valley
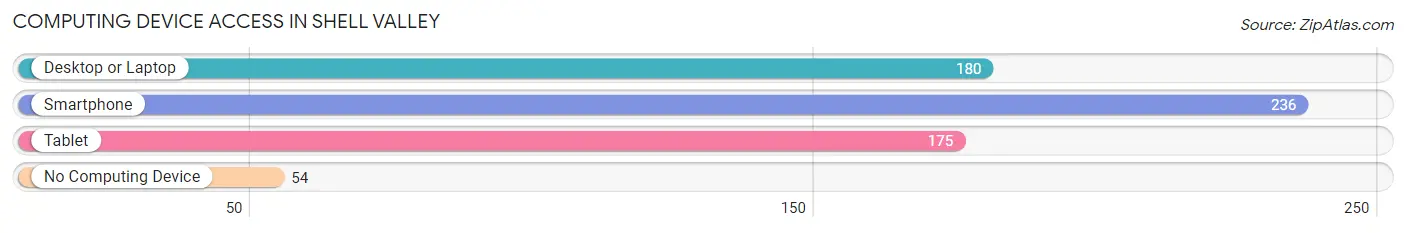
| Device Type | # Households | % Households |
| Desktop or Laptop | 180 | 53.4% |
| Smartphone | 236 | 70.0% |
| Tablet | 175 | 51.9% |
| No Computing Device | 54 | 16.0% |
| Total | 337 | 100.0% |
Internet Access in Shell Valley
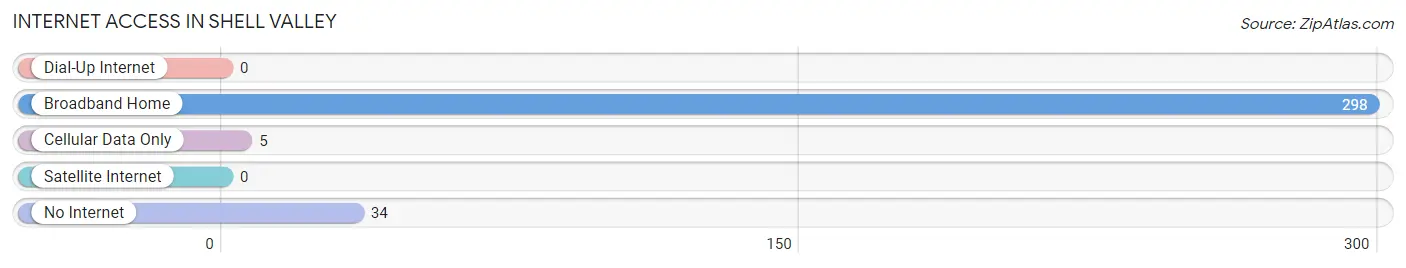
| Internet Type | # Households | % Households |
| Dial-Up Internet | 0 | 0.0% |
| Broadband Home | 298 | 88.4% |
| Cellular Data Only | 5 | 1.5% |
| Satellite Internet | 0 | 0.0% |
| No Internet | 34 | 10.1% |
| Total | 337 | 100.0% |
Shell Valley Summary
History
Shell Valley is a small rural community located in the state of North Dakota. It is situated in the southwestern corner of the state, near the border with South Dakota. The area was first settled in the late 1800s by homesteaders who were attracted to the area by its fertile soil and abundant natural resources. The town was officially founded in 1891 and named after the nearby Shell Creek.
The early settlers of Shell Valley were mostly farmers and ranchers, and the town quickly grew to become a thriving agricultural center. The town was also home to a number of small businesses, including a general store, a blacksmith shop, and a hotel. In the early 1900s, Shell Valley was a popular destination for tourists, who came to enjoy the area’s natural beauty and outdoor activities.
In the mid-1900s, Shell Valley experienced a period of decline as the agricultural industry shifted away from the area. The town’s population dwindled and many of the businesses closed. However, in recent years, Shell Valley has seen a resurgence in popularity as a tourist destination. The town is now home to a number of small businesses, including restaurants, shops, and galleries.
Geography
Shell Valley is located in the southwestern corner of North Dakota, near the border with South Dakota. The town is situated in the Missouri Plateau region of the state, which is characterized by rolling hills and wide open plains. The area is known for its abundant natural resources, including fertile soil, abundant wildlife, and numerous rivers and streams.
The town is located at the intersection of two major highways, US Highway 12 and North Dakota Highway 18. The nearest major city is Bismarck, which is located about 50 miles to the northeast. The nearest airport is located in Bismarck, and the nearest international airport is located in Minneapolis, Minnesota.
Economy
The economy of Shell Valley is largely based on agriculture and tourism. The town is home to a number of small businesses, including restaurants, shops, and galleries. The town is also home to a number of farms and ranches, which produce a variety of crops and livestock.
Tourism is an important part of the local economy. The town is home to a number of attractions, including the Shell Valley Museum, which showcases the history of the area, and the Shell Valley Wildlife Refuge, which is home to a variety of wildlife. The town is also home to a number of outdoor activities, including fishing, hunting, and camping.
Demographics
As of the 2010 census, the population of Shell Valley was 545. The town is predominantly white, with a small minority population. The median household income is $41,250, and the median home value is $117,000. The town has a low unemployment rate of 3.2%.
Conclusion
Shell Valley is a small rural community located in the southwestern corner of North Dakota. The town was founded in 1891 and has a long history of agriculture and tourism. The town is home to a number of small businesses, farms, and ranches, and is a popular destination for tourists. The population of Shell Valley is predominantly white, with a median household income of $41,250 and a median home value of $117,000. The town has a low unemployment rate of 3.2%.
Common Questions
What is Per Capita Income in Shell Valley?
Per Capita income in Shell Valley is $16,908.
What is the Median Family Income in Shell Valley?
Median Family Income in Shell Valley is $50,076.
What is the Median Household income in Shell Valley?
Median Household Income in Shell Valley is $42,029.
What is Income or Wage Gap in Shell Valley?
Income or Wage Gap in Shell Valley is 26.0%.
Women in Shell Valley earn 74.0 cents for every dollar earned by a man.
What is Inequality or Gini Index in Shell Valley?
Inequality or Gini Index in Shell Valley is 0.39.
What is the Total Population of Shell Valley?
Total Population of Shell Valley is 1,183.
What is the Total Male Population of Shell Valley?
Total Male Population of Shell Valley is 659.
What is the Total Female Population of Shell Valley?
Total Female Population of Shell Valley is 524.
What is the Ratio of Males per 100 Females in Shell Valley?
There are 125.76 Males per 100 Females in Shell Valley.
What is the Ratio of Females per 100 Males in Shell Valley?
There are 79.51 Females per 100 Males in Shell Valley.
What is the Median Population Age in Shell Valley?
Median Population Age in Shell Valley is 29.3 Years.
What is the Average Family Size in Shell Valley
Average Family Size in Shell Valley is 4.0 People.
What is the Average Household Size in Shell Valley
Average Household Size in Shell Valley is 3.5 People.
How Large is the Labor Force in Shell Valley?
There are 350 People in the Labor Forcein in Shell Valley.
What is the Percentage of People in the Labor Force in Shell Valley?
44.6% of People are in the Labor Force in Shell Valley.
What is the Unemployment Rate in Shell Valley?
Unemployment Rate in Shell Valley is 10.0%.