Menoken, ND Map & Demographics
Menoken Map
Menoken Overview
$40,414
PER CAPITA INCOME
$98,125
AVG FAMILY INCOME
$96,250
AVG HOUSEHOLD INCOME
23.2%
WAGE / INCOME GAP [ % ]
76.8¢/ $1
WAGE / INCOME GAP [ $ ]
0.40
INEQUALITY / GINI INDEX
64
TOTAL POPULATION
33
MALE POPULATION
31
FEMALE POPULATION
106.45
MALES / 100 FEMALES
93.94
FEMALES / 100 MALES
50.5
MEDIAN AGE
2.9
AVG FAMILY SIZE
2.2
AVG HOUSEHOLD SIZE
35
LABOR FORCE [ PEOPLE ]
66.0%
PERCENT IN LABOR FORCE
2.9%
UNEMPLOYMENT RATE
Menoken Zip Codes
Menoken Area Codes
Income in Menoken
Income Overview in Menoken
Per Capita Income in Menoken is $40,414, while median incomes of families and households are $98,125 and $96,250 respectively.
| Characteristic | Number | Measure |
| Per Capita Income | 64 | $40,414 |
| Median Family Income | 17 | $98,125 |
| Mean Family Income | 17 | $88,712 |
| Median Household Income | 29 | $96,250 |
| Mean Household Income | 29 | $90,121 |
| Income Deficit | 17 | $0 |
| Wage / Income Gap (%) | 64 | 23.17% |
| Wage / Income Gap ($) | 64 | 76.83¢ per $1 |
| Gini / Inequality Index | 64 | 0.40 |
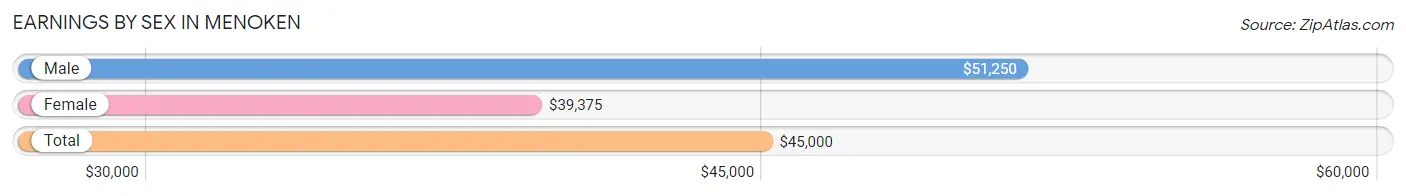
Earnings by Sex in Menoken
Average Earnings in Menoken are $45,000, $51,250 for men and $39,375 for women, a difference of 23.2%.
| Sex | Number | Average Earnings |
| Male | 21 (61.8%) | $51,250 |
| Female | 13 (38.2%) | $39,375 |
| Total | 34 (100.0%) | $45,000 |
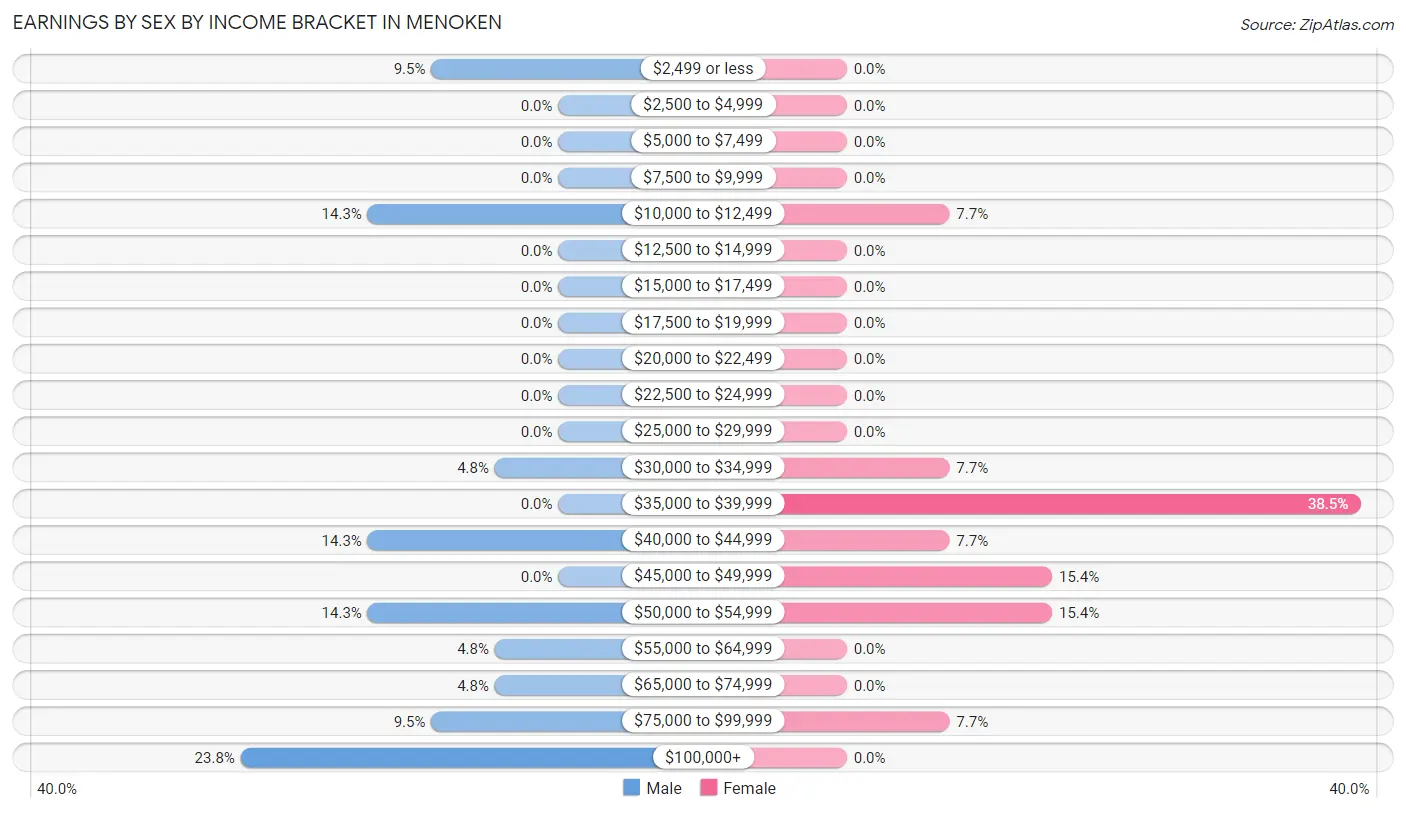
Earnings by Sex by Income Bracket in Menoken
The most common earnings brackets in Menoken are $100,000+ for men (5 | 23.8%) and $35,000 to $39,999 for women (5 | 38.5%).
| Income | Male | Female |
| $2,499 or less | 2 (9.5%) | 0 (0.0%) |
| $2,500 to $4,999 | 0 (0.0%) | 0 (0.0%) |
| $5,000 to $7,499 | 0 (0.0%) | 0 (0.0%) |
| $7,500 to $9,999 | 0 (0.0%) | 0 (0.0%) |
| $10,000 to $12,499 | 3 (14.3%) | 1 (7.7%) |
| $12,500 to $14,999 | 0 (0.0%) | 0 (0.0%) |
| $15,000 to $17,499 | 0 (0.0%) | 0 (0.0%) |
| $17,500 to $19,999 | 0 (0.0%) | 0 (0.0%) |
| $20,000 to $22,499 | 0 (0.0%) | 0 (0.0%) |
| $22,500 to $24,999 | 0 (0.0%) | 0 (0.0%) |
| $25,000 to $29,999 | 0 (0.0%) | 0 (0.0%) |
| $30,000 to $34,999 | 1 (4.8%) | 1 (7.7%) |
| $35,000 to $39,999 | 0 (0.0%) | 5 (38.5%) |
| $40,000 to $44,999 | 3 (14.3%) | 1 (7.7%) |
| $45,000 to $49,999 | 0 (0.0%) | 2 (15.4%) |
| $50,000 to $54,999 | 3 (14.3%) | 2 (15.4%) |
| $55,000 to $64,999 | 1 (4.8%) | 0 (0.0%) |
| $65,000 to $74,999 | 1 (4.8%) | 0 (0.0%) |
| $75,000 to $99,999 | 2 (9.5%) | 1 (7.7%) |
| $100,000+ | 5 (23.8%) | 0 (0.0%) |
| Total | 21 (100.0%) | 13 (100.0%) |
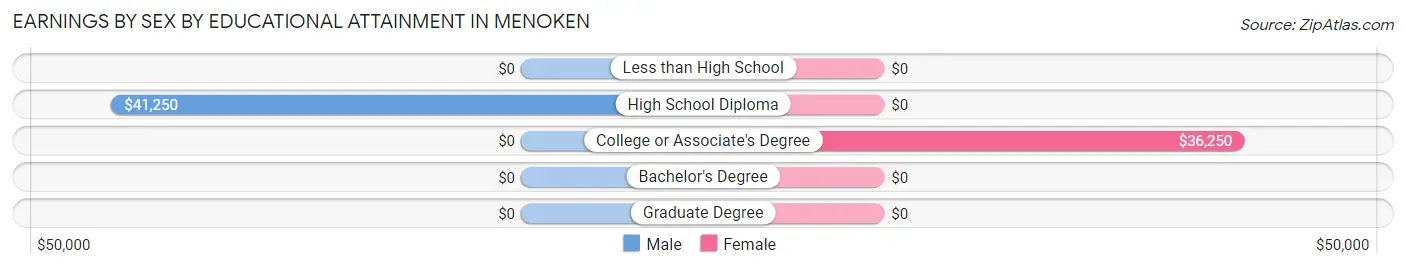
Earnings by Sex by Educational Attainment in Menoken
Average earnings in Menoken are $63,750 for men and $39,375 for women, a difference of 38.2%. Men with an educational attainment of high school diploma enjoy the highest average annual earnings of $41,250, while those with high school diploma education earn the least with $41,250. Women with an educational attainment of college or associate's degree earn the most with the average annual earnings of $36,250, while those with college or associate's degree education have the smallest earnings of $36,250.
| Educational Attainment | Male Income | Female Income |
| Less than High School | - | - |
| High School Diploma | $41,250 | $0 |
| College or Associate's Degree | - | - |
| Bachelor's Degree | - | - |
| Graduate Degree | - | - |
| Total | $63,750 | $39,375 |
Family Income in Menoken
Family Income Brackets in Menoken
According to the Menoken family income data, there are 5 families falling into the $100,000 to $149,999 income range, which is the most common income bracket and makes up 29.4% of all families.
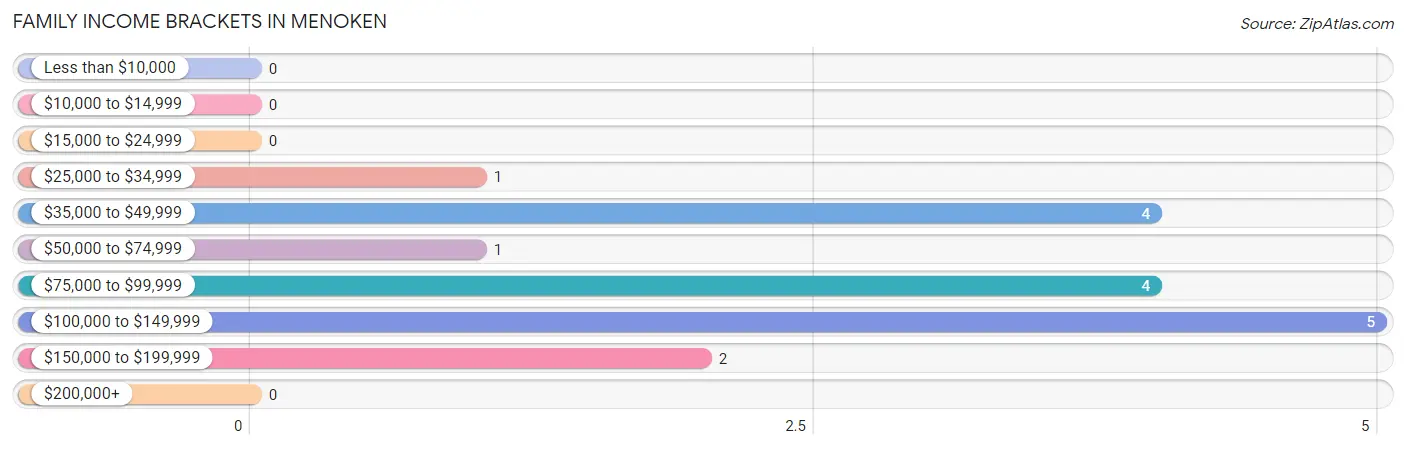
| Income Bracket | # Families | % Families |
| Less than $10,000 | 0 | 0.0% |
| $10,000 to $14,999 | 0 | 0.0% |
| $15,000 to $24,999 | 0 | 0.0% |
| $25,000 to $34,999 | 1 | 5.9% |
| $35,000 to $49,999 | 4 | 23.5% |
| $50,000 to $74,999 | 1 | 5.9% |
| $75,000 to $99,999 | 4 | 23.5% |
| $100,000 to $149,999 | 5 | 29.4% |
| $150,000 to $199,999 | 2 | 11.8% |
| $200,000+ | 0 | 0.0% |
Family Income by Famaliy Size in Menoken
2-person families (11 | 64.7%) account for the highest median family income in Menoken with $56,250 per family, while 2-person families (11 | 64.7%) have the highest median income of $28,125 per family member.
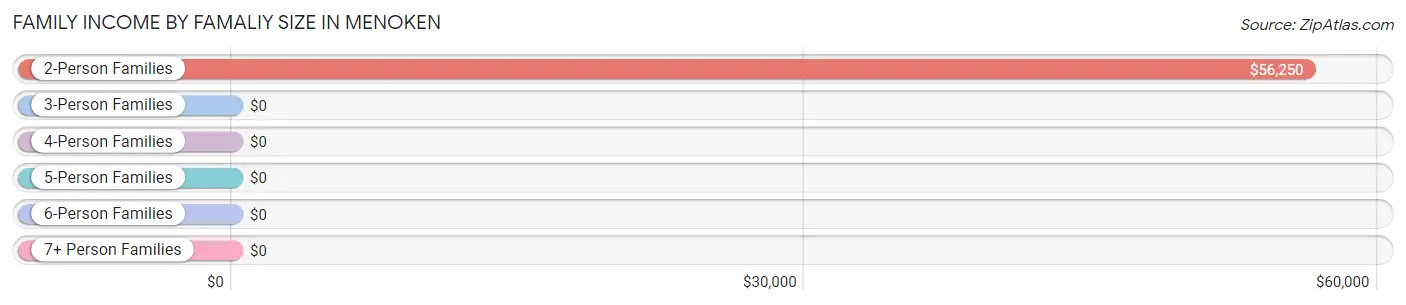
| Income Bracket | # Families | Median Income |
| 2-Person Families | 11 (64.7%) | $56,250 |
| 3-Person Families | 1 (5.9%) | $0 |
| 4-Person Families | 2 (11.8%) | $0 |
| 5-Person Families | 0 (0.0%) | $0 |
| 6-Person Families | 3 (17.6%) | $0 |
| 7+ Person Families | 0 (0.0%) | $0 |
| Total | 17 (100.0%) | $98,125 |
Family Income by Number of Earners in Menoken
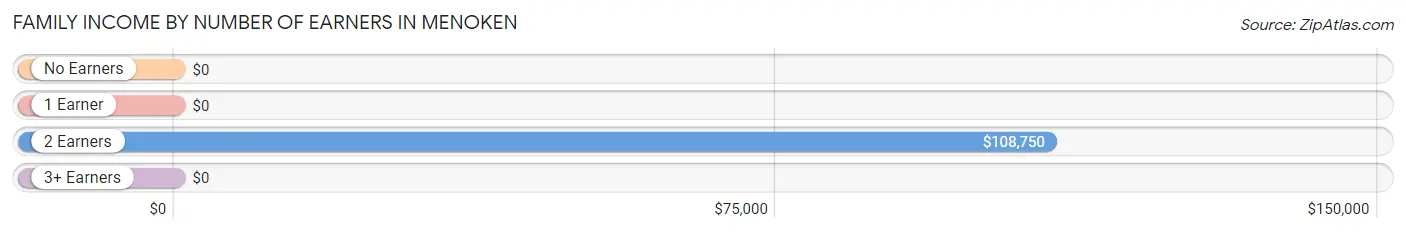
| Number of Earners | # Families | Median Income |
| No Earners | 3 (17.6%) | $0 |
| 1 Earner | 4 (23.5%) | $0 |
| 2 Earners | 8 (47.1%) | $108,750 |
| 3+ Earners | 2 (11.8%) | $0 |
| Total | 17 (100.0%) | $98,125 |
Household Income in Menoken
Household Income Brackets in Menoken
With 7 households falling in the category, the $100,000 to $149,999 income range is the most frequent in Menoken, accounting for 24.1% of all households.
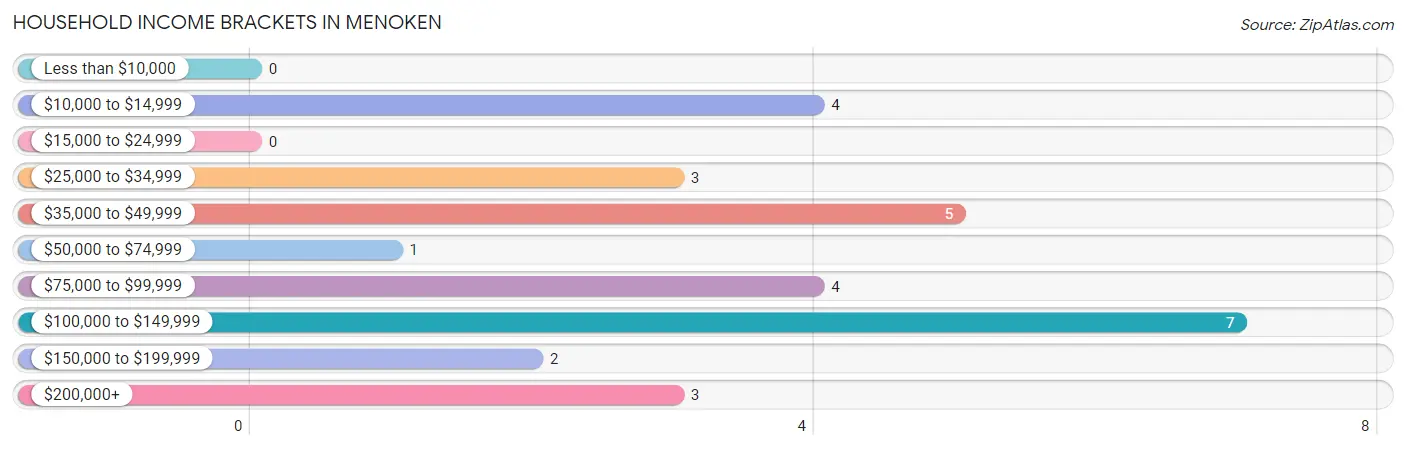
| Income Bracket | # Households | % Households |
| Less than $10,000 | 0 | 0.0% |
| $10,000 to $14,999 | 4 | 13.8% |
| $15,000 to $24,999 | 0 | 0.0% |
| $25,000 to $34,999 | 3 | 10.3% |
| $35,000 to $49,999 | 5 | 17.2% |
| $50,000 to $74,999 | 1 | 3.4% |
| $75,000 to $99,999 | 4 | 13.8% |
| $100,000 to $149,999 | 7 | 24.1% |
| $150,000 to $199,999 | 2 | 6.9% |
| $200,000+ | 3 | 10.3% |
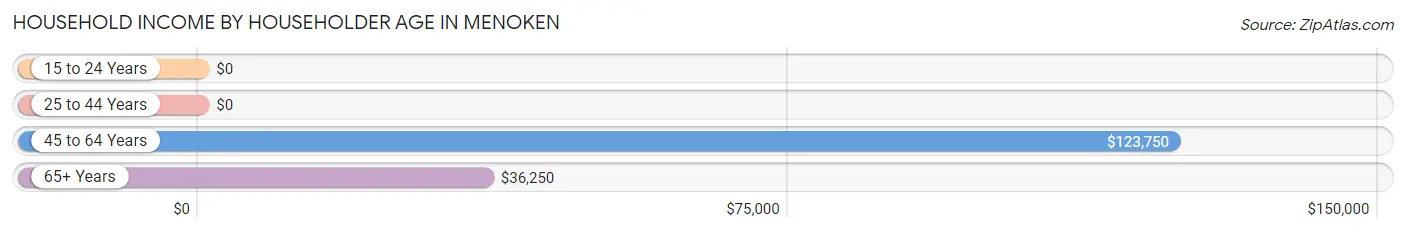
Household Income by Householder Age in Menoken
The median household income in Menoken is $96,250, with the highest median household income of $123,750 found in the 45 to 64 years age bracket for the primary householder. A total of 12 households (41.4%) fall into this category.
| Income Bracket | # Households | Median Income |
| 15 to 24 Years | 0 (0.0%) | $0 |
| 25 to 44 Years | 3 (10.3%) | $0 |
| 45 to 64 Years | 12 (41.4%) | $123,750 |
| 65+ Years | 14 (48.3%) | $36,250 |
| Total | 29 (100.0%) | $96,250 |
Poverty in Menoken
Income Below Poverty by Sex and Age in Menoken
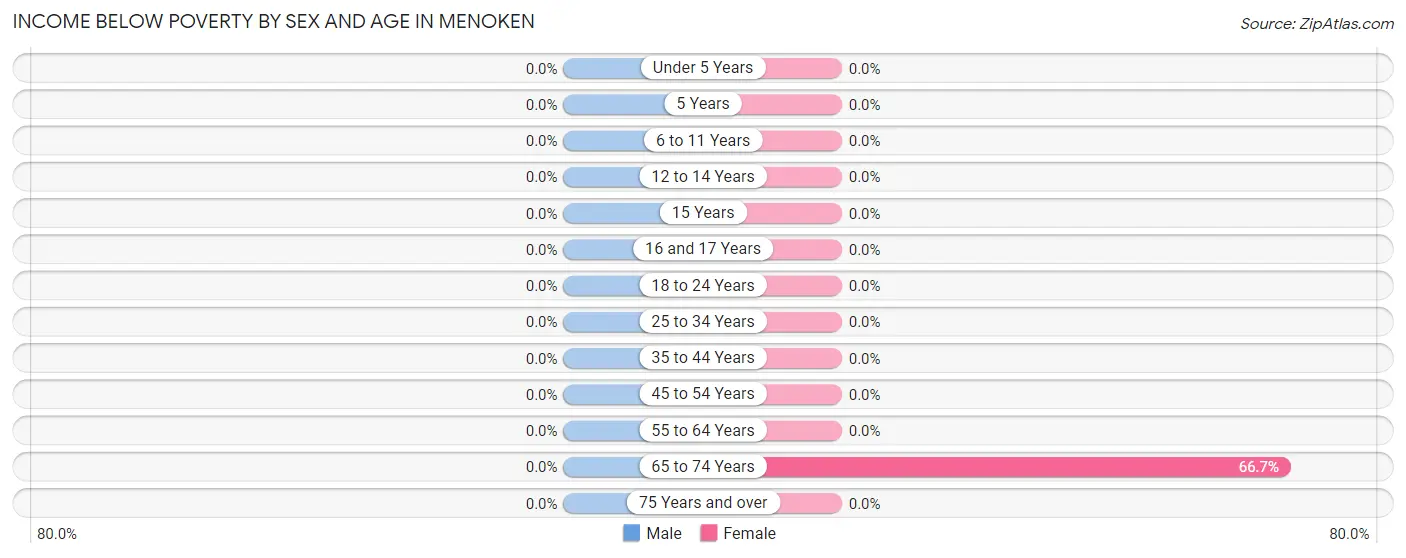
| Age Bracket | Male | Female |
| Under 5 Years | 0 (0.0%) | 0 (0.0%) |
| 5 Years | 0 (0.0%) | 0 (0.0%) |
| 6 to 11 Years | 0 (0.0%) | 0 (0.0%) |
| 12 to 14 Years | 0 (0.0%) | 0 (0.0%) |
| 15 Years | 0 (0.0%) | 0 (0.0%) |
| 16 and 17 Years | 0 (0.0%) | 0 (0.0%) |
| 18 to 24 Years | 0 (0.0%) | 0 (0.0%) |
| 25 to 34 Years | 0 (0.0%) | 0 (0.0%) |
| 35 to 44 Years | 0 (0.0%) | 0 (0.0%) |
| 45 to 54 Years | 0 (0.0%) | 0 (0.0%) |
| 55 to 64 Years | 0 (0.0%) | 0 (0.0%) |
| 65 to 74 Years | 0 (0.0%) | 4 (66.7%) |
| 75 Years and over | 0 (0.0%) | 0 (0.0%) |
| Total | 0 (0.0%) | 4 (12.9%) |
Income Above Poverty by Sex and Age in Menoken
According to the poverty statistics in Menoken, males aged under 5 years and females aged 5 years are the age groups that are most secure financially, with 100.0% of males and 100.0% of females in these age groups living above the poverty line.
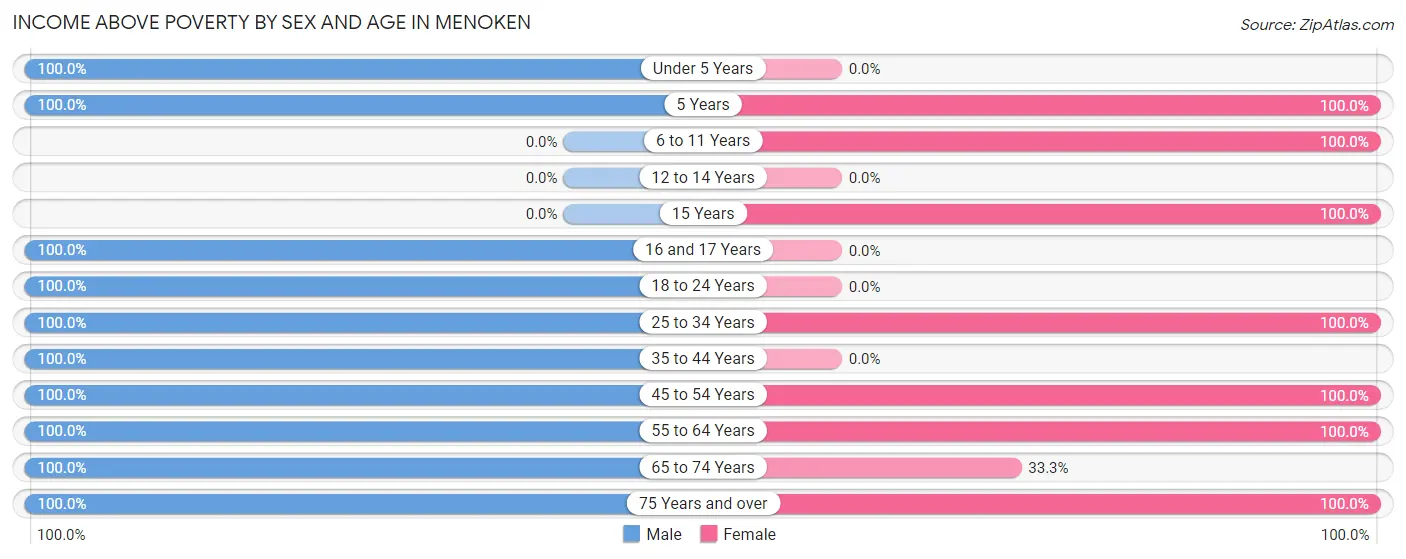
| Age Bracket | Male | Female |
| Under 5 Years | 3 (100.0%) | 0 (0.0%) |
| 5 Years | 1 (100.0%) | 1 (100.0%) |
| 6 to 11 Years | 0 (0.0%) | 3 (100.0%) |
| 12 to 14 Years | 0 (0.0%) | 0 (0.0%) |
| 15 Years | 0 (0.0%) | 3 (100.0%) |
| 16 and 17 Years | 3 (100.0%) | 0 (0.0%) |
| 18 to 24 Years | 2 (100.0%) | 0 (0.0%) |
| 25 to 34 Years | 2 (100.0%) | 5 (100.0%) |
| 35 to 44 Years | 1 (100.0%) | 0 (0.0%) |
| 45 to 54 Years | 9 (100.0%) | 7 (100.0%) |
| 55 to 64 Years | 4 (100.0%) | 2 (100.0%) |
| 65 to 74 Years | 5 (100.0%) | 2 (33.3%) |
| 75 Years and over | 3 (100.0%) | 4 (100.0%) |
| Total | 33 (100.0%) | 27 (87.1%) |
Income Below Poverty Among Married-Couple Families in Menoken
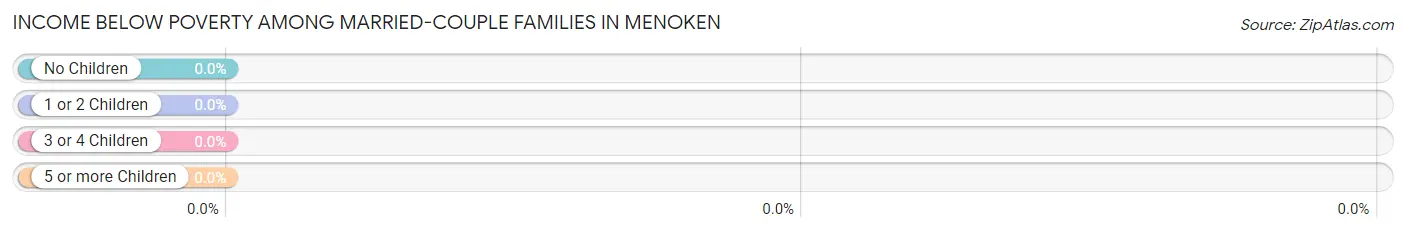
| Children | Above Poverty | Below Poverty |
| No Children | 10 (100.0%) | 0 (0.0%) |
| 1 or 2 Children | 3 (100.0%) | 0 (0.0%) |
| 3 or 4 Children | 3 (100.0%) | 0 (0.0%) |
| 5 or more Children | 0 (0.0%) | 0 (0.0%) |
| Total | 16 (100.0%) | 0 (0.0%) |
Income Below Poverty Among Single-Parent Households in Menoken
| Children | Single Father | Single Mother |
| No Children | 0 (0.0%) | 0 (0.0%) |
| 1 or 2 Children | 0 (0.0%) | 0 (0.0%) |
| 3 or 4 Children | 0 (0.0%) | 0 (0.0%) |
| 5 or more Children | 0 (0.0%) | 0 (0.0%) |
| Total | 0 (0.0%) | 0 (0.0%) |
Income Below Poverty Among Married-Couple vs Single-Parent Households in Menoken
| Children | Married-Couple Families | Single-Parent Households |
| No Children | 0 (0.0%) | 0 (0.0%) |
| 1 or 2 Children | 0 (0.0%) | 0 (0.0%) |
| 3 or 4 Children | 0 (0.0%) | 0 (0.0%) |
| 5 or more Children | 0 (0.0%) | 0 (0.0%) |
| Total | 0 (0.0%) | 0 (0.0%) |
Race in Menoken
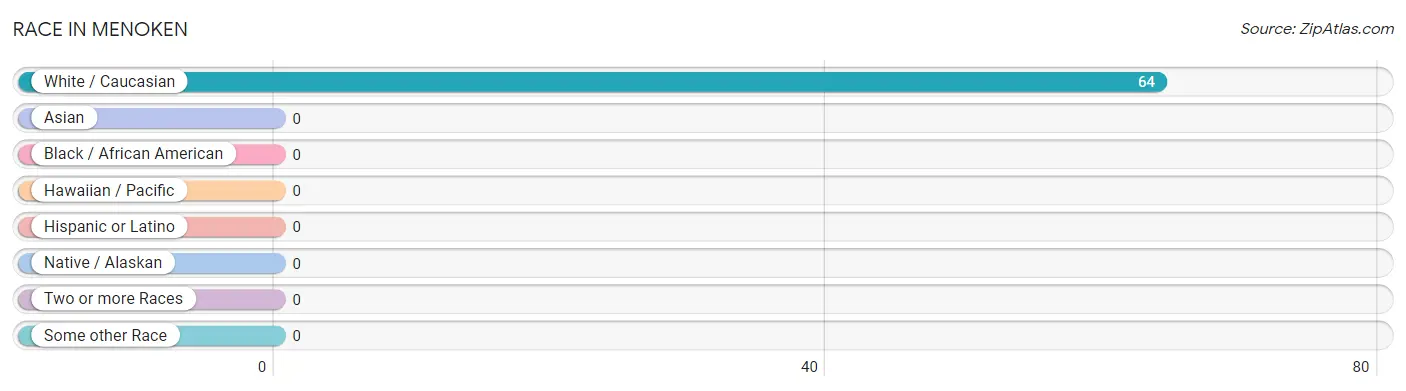
The most populous races in Menoken are , and White / Caucasian (64 | 100.0%).
| Race | # Population | % Population |
| Asian | 0 | 0.0% |
| Black / African American | 0 | 0.0% |
| Hawaiian / Pacific | 0 | 0.0% |
| Hispanic or Latino | 0 | 0.0% |
| Native / Alaskan | 0 | 0.0% |
| White / Caucasian | 64 | 100.0% |
| Two or more Races | 0 | 0.0% |
| Some other Race | 0 | 0.0% |
| Total | 64 | 100.0% |
Ancestry in Menoken
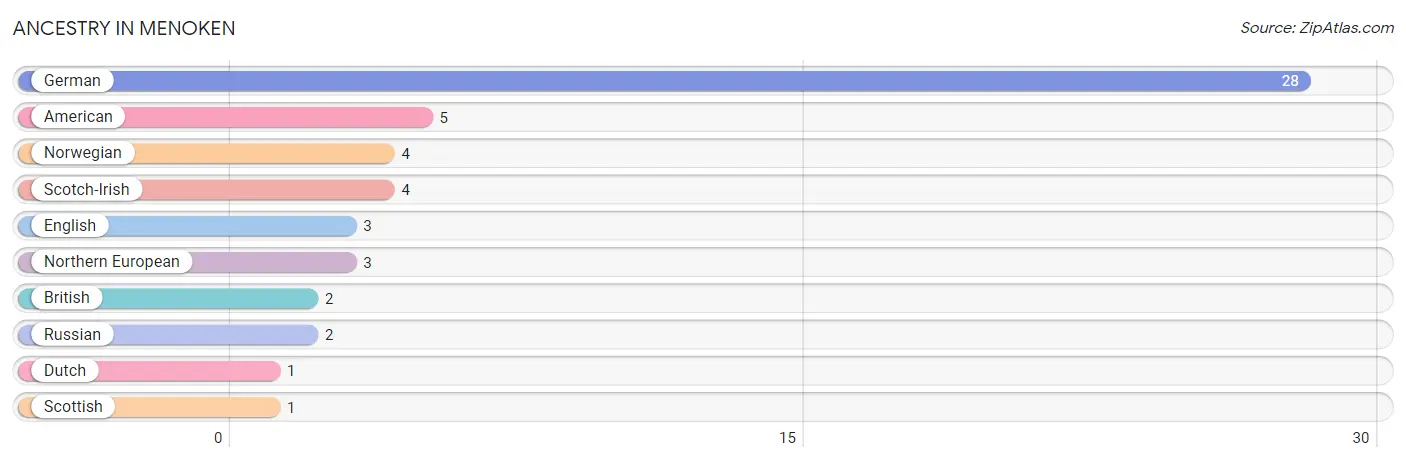
The most populous ancestries reported in Menoken are German (28 | 43.8%), American (5 | 7.8%), Norwegian (4 | 6.2%), Scotch-Irish (4 | 6.2%), and English (3 | 4.7%), together accounting for 68.8% of all Menoken residents.
| Ancestry | # Population | % Population |
| American | 5 | 7.8% |
| British | 2 | 3.1% |
| Dutch | 1 | 1.6% |
| English | 3 | 4.7% |
| German | 28 | 43.8% |
| Northern European | 3 | 4.7% |
| Norwegian | 4 | 6.2% |
| Russian | 2 | 3.1% |
| Scotch-Irish | 4 | 6.2% |
| Scottish | 1 | 1.6% | View All 10 Rows |
Immigrants in Menoken

| Immigration Origin | # Population | % Population | View All 0 Rows |
Sex and Age in Menoken
Sex and Age in Menoken
The most populous age groups in Menoken are 50 to 54 Years (6 | 18.2%) for men and 65 to 69 Years (5 | 16.1%) for women.
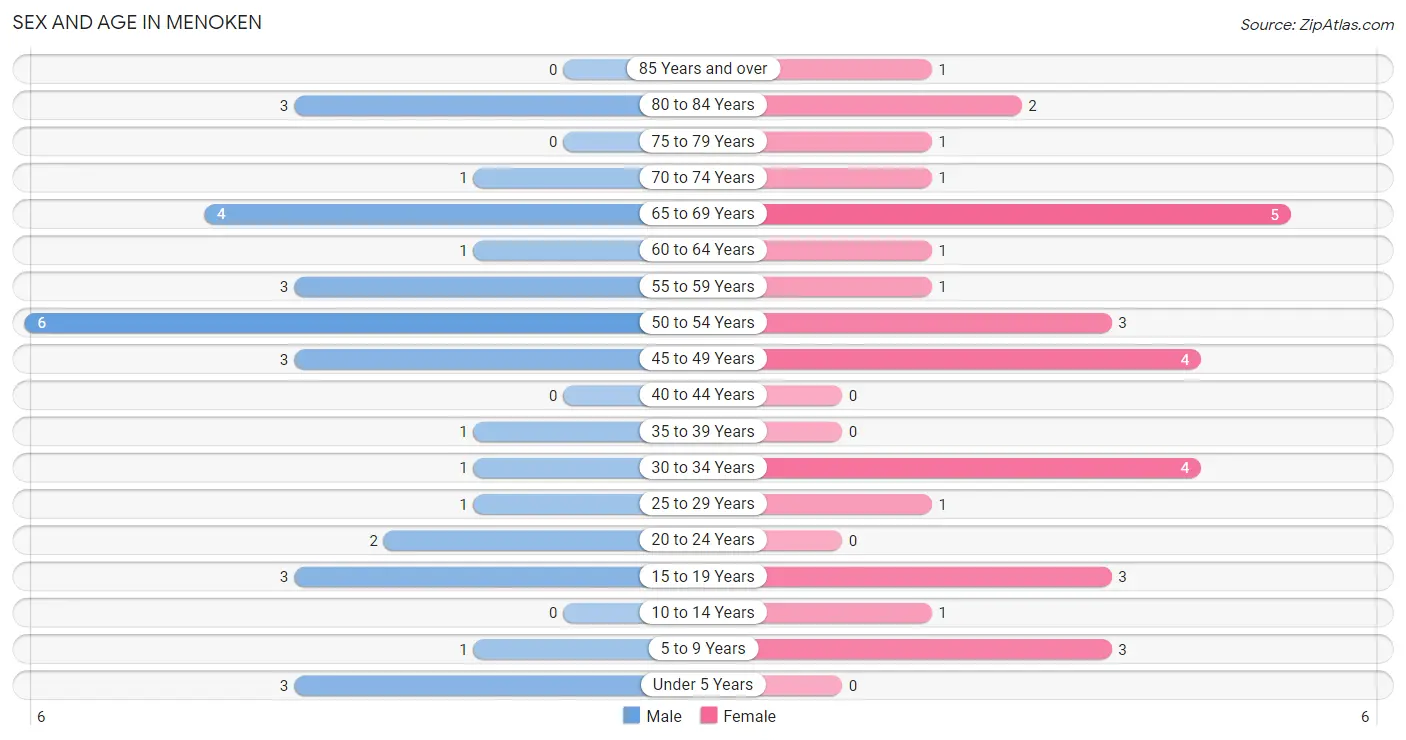
| Age Bracket | Male | Female |
| Under 5 Years | 3 (9.1%) | 0 (0.0%) |
| 5 to 9 Years | 1 (3.0%) | 3 (9.7%) |
| 10 to 14 Years | 0 (0.0%) | 1 (3.2%) |
| 15 to 19 Years | 3 (9.1%) | 3 (9.7%) |
| 20 to 24 Years | 2 (6.1%) | 0 (0.0%) |
| 25 to 29 Years | 1 (3.0%) | 1 (3.2%) |
| 30 to 34 Years | 1 (3.0%) | 4 (12.9%) |
| 35 to 39 Years | 1 (3.0%) | 0 (0.0%) |
| 40 to 44 Years | 0 (0.0%) | 0 (0.0%) |
| 45 to 49 Years | 3 (9.1%) | 4 (12.9%) |
| 50 to 54 Years | 6 (18.2%) | 3 (9.7%) |
| 55 to 59 Years | 3 (9.1%) | 1 (3.2%) |
| 60 to 64 Years | 1 (3.0%) | 1 (3.2%) |
| 65 to 69 Years | 4 (12.1%) | 5 (16.1%) |
| 70 to 74 Years | 1 (3.0%) | 1 (3.2%) |
| 75 to 79 Years | 0 (0.0%) | 1 (3.2%) |
| 80 to 84 Years | 3 (9.1%) | 2 (6.5%) |
| 85 Years and over | 0 (0.0%) | 1 (3.2%) |
| Total | 33 (100.0%) | 31 (100.0%) |
Families and Households in Menoken
Median Family Size in Menoken
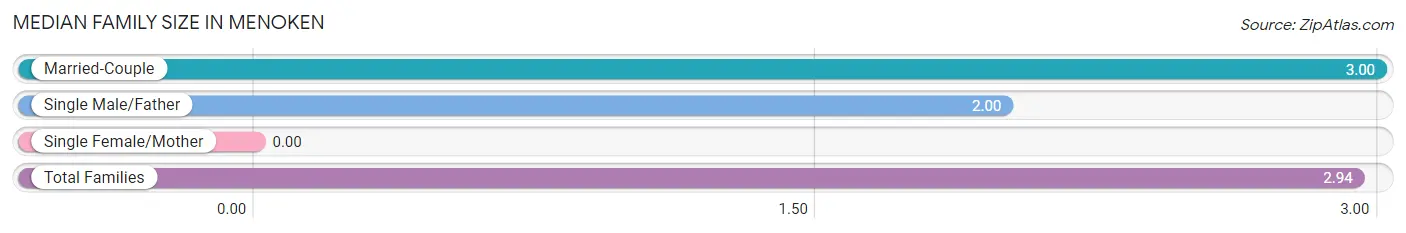
| Family Type | # Families | Family Size |
| Married-Couple | 16 (94.1%) | 3.00 |
| Single Male/Father | 1 (5.9%) | 2.00 |
| Single Female/Mother | 0 (0.0%) | - |
| Total Families | 17 (100.0%) | 2.94 |
Median Household Size in Menoken
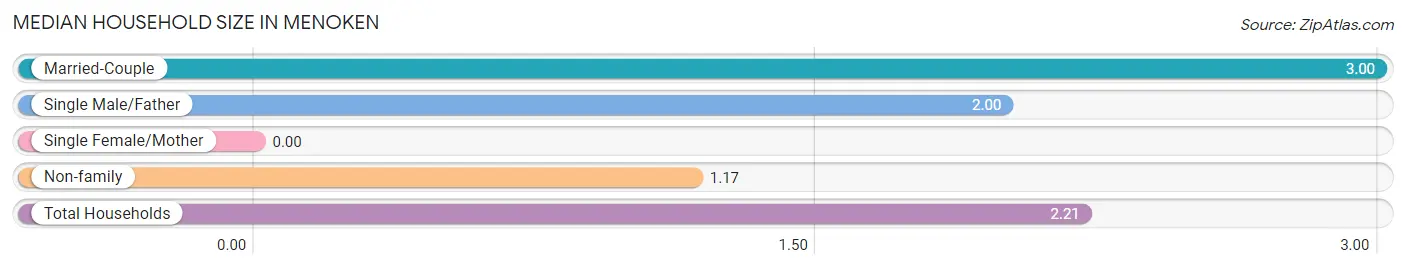
| Household Type | # Households | Household Size |
| Married-Couple | 16 (55.2%) | 3.00 |
| Single Male/Father | 1 (3.5%) | 2.00 |
| Single Female/Mother | 0 (0.0%) | - |
| Non-family | 12 (41.4%) | 1.17 |
| Total Households | 29 (100.0%) | 2.21 |
Household Size by Marriage Status in Menoken
Out of a total of 29 households in Menoken, 17 (58.6%) are family households, while 12 (41.4%) are nonfamily households. The most numerous type of family households are 2-person households, comprising 11, and the most common type of nonfamily households are 1-person households, comprising 9.
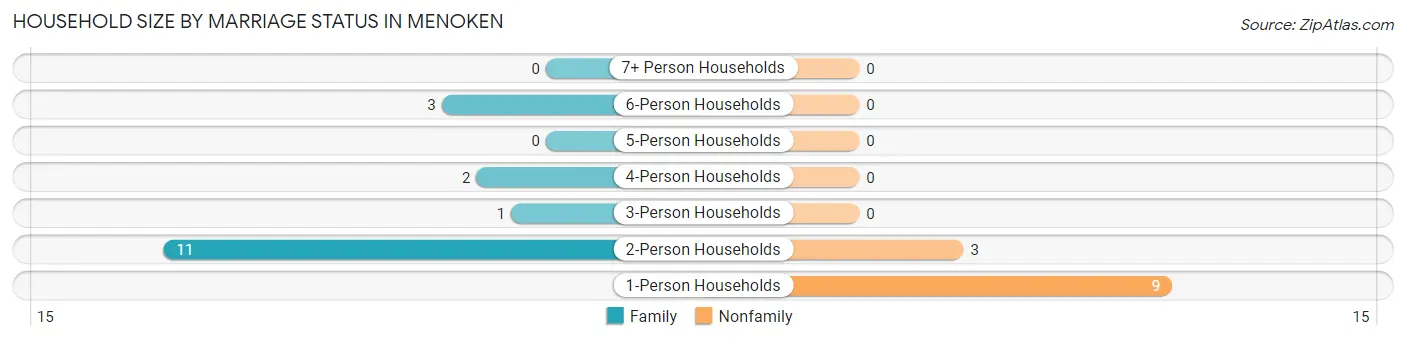
| Household Size | Family Households | Nonfamily Households |
| 1-Person Households | - | 9 (31.0%) |
| 2-Person Households | 11 (37.9%) | 3 (10.3%) |
| 3-Person Households | 1 (3.5%) | 0 (0.0%) |
| 4-Person Households | 2 (6.9%) | 0 (0.0%) |
| 5-Person Households | 0 (0.0%) | 0 (0.0%) |
| 6-Person Households | 3 (10.3%) | 0 (0.0%) |
| 7+ Person Households | 0 (0.0%) | 0 (0.0%) |
| Total | 17 (58.6%) | 12 (41.4%) |
Female Fertility in Menoken
Fertility by Age in Menoken
Average fertility rate in Menoken is 83.0 births per 1,000 women. Women in the age bracket of 20 to 34 years have the highest fertility rate with 200.0 births per 1,000 women. Women in the age bracket of 20 to 34 years acount for 100.0% of all women with births.
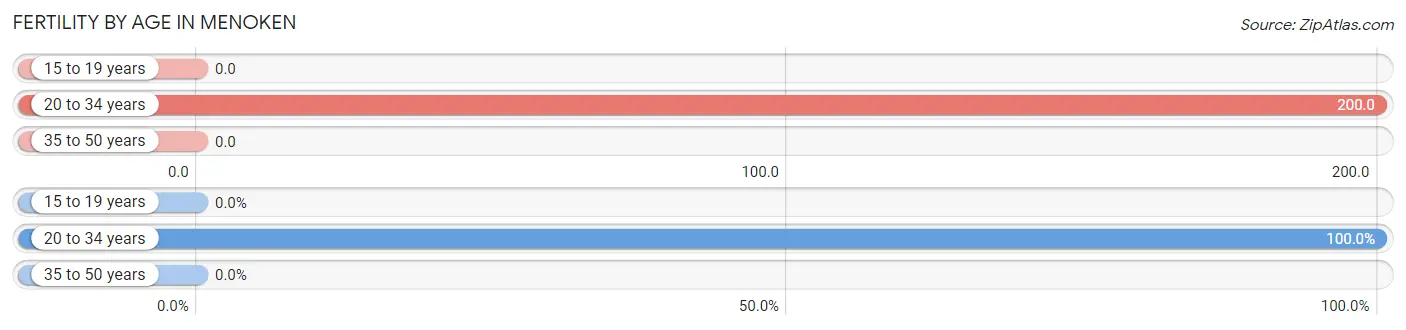
| Age Bracket | Women with Births | Births / 1,000 Women |
| 15 to 19 years | 0 (0.0%) | 0.0 |
| 20 to 34 years | 1 (100.0%) | 200.0 |
| 35 to 50 years | 0 (0.0%) | 0.0 |
| Total | 1 (100.0%) | 83.0 |
Fertility by Age by Marriage Status in Menoken
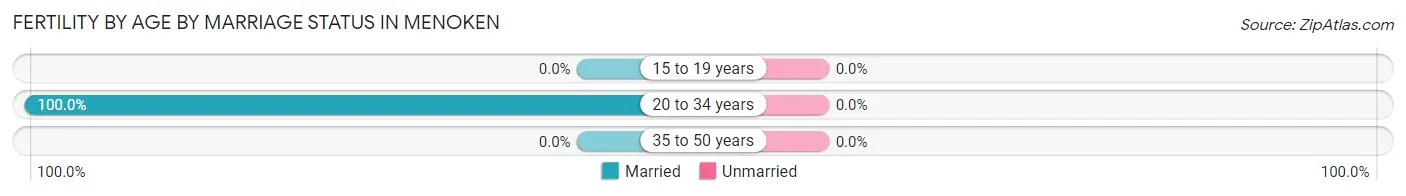
| Age Bracket | Married | Unmarried |
| 15 to 19 years | 0 (0.0%) | 0 (0.0%) |
| 20 to 34 years | 1 (100.0%) | 0 (0.0%) |
| 35 to 50 years | 0 (0.0%) | 0 (0.0%) |
| Total | 1 (100.0%) | 0 (0.0%) |
Fertility by Education in Menoken
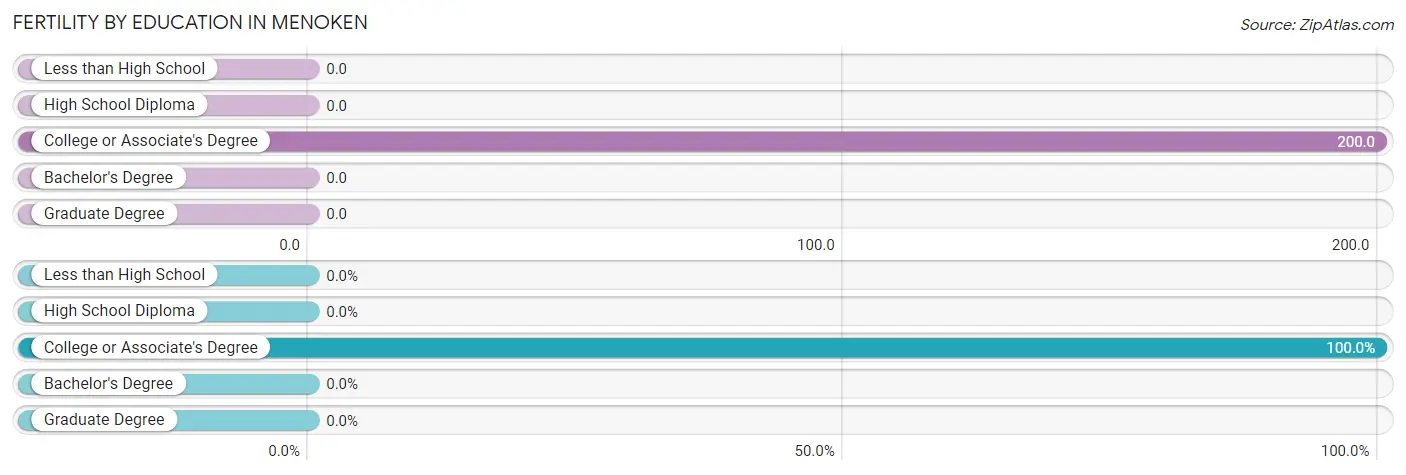
| Educational Attainment | Women with Births | Births / 1,000 Women |
| Less than High School | 0 (0.0%) | 0.0 |
| High School Diploma | 0 (0.0%) | 0.0 |
| College or Associate's Degree | 1 (100.0%) | 200.0 |
| Bachelor's Degree | 0 (0.0%) | 0.0 |
| Graduate Degree | 0 (0.0%) | 0.0 |
| Total | 1 (100.0%) | 83.0 |
Fertility by Education by Marriage Status in Menoken
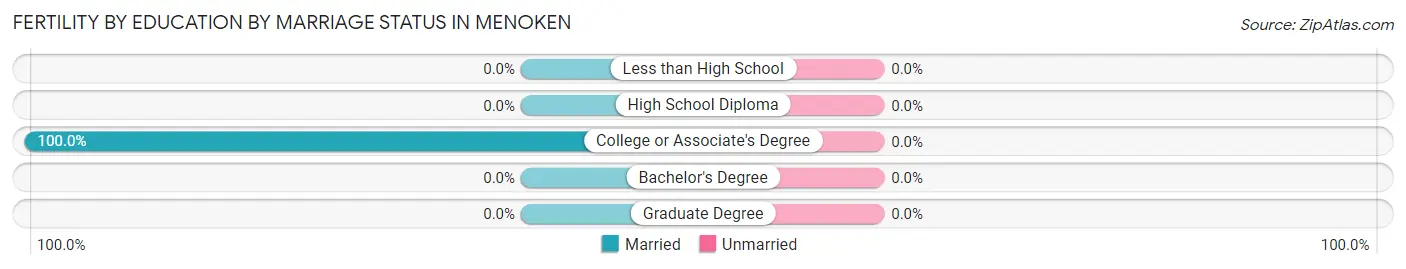
| Educational Attainment | Married | Unmarried |
| Less than High School | 0 (0.0%) | 0 (0.0%) |
| High School Diploma | 0 (0.0%) | 0 (0.0%) |
| College or Associate's Degree | 1 (100.0%) | 0 (0.0%) |
| Bachelor's Degree | 0 (0.0%) | 0 (0.0%) |
| Graduate Degree | 0 (0.0%) | 0 (0.0%) |
| Total | 1 (100.0%) | 0 (0.0%) |
Employment Characteristics in Menoken
Employment by Class of Employer in Menoken
Among the 32 employed individuals in Menoken, private company employees (13 | 40.6%), not-for-profit organizations (6 | 18.8%), and self-employed (incorporated) (5 | 15.6%) make up the most common classes of employment.
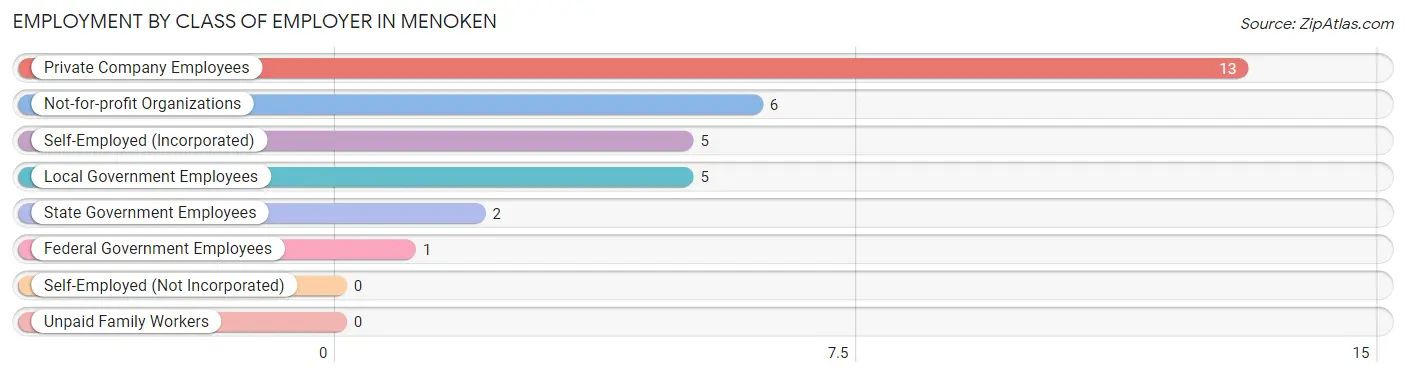
| Employer Class | # Employees | % Employees |
| Private Company Employees | 13 | 40.6% |
| Self-Employed (Incorporated) | 5 | 15.6% |
| Self-Employed (Not Incorporated) | 0 | 0.0% |
| Not-for-profit Organizations | 6 | 18.8% |
| Local Government Employees | 5 | 15.6% |
| State Government Employees | 2 | 6.2% |
| Federal Government Employees | 1 | 3.1% |
| Unpaid Family Workers | 0 | 0.0% |
| Total | 32 | 100.0% |
Employment Status by Age in Menoken
According to the labor force statistics for Menoken, out of the total population over 16 years of age (53), 66.0% or 35 individuals are in the labor force, with 2.9% or 1 of them unemployed. The age group with the highest labor force participation rate is 20 to 24 years, with 100.0% or 2 individuals in the labor force. Within the labor force, the 55 to 59 years age range has the highest percentage of unemployed individuals, with 33.3% or 1 of them being unemployed.
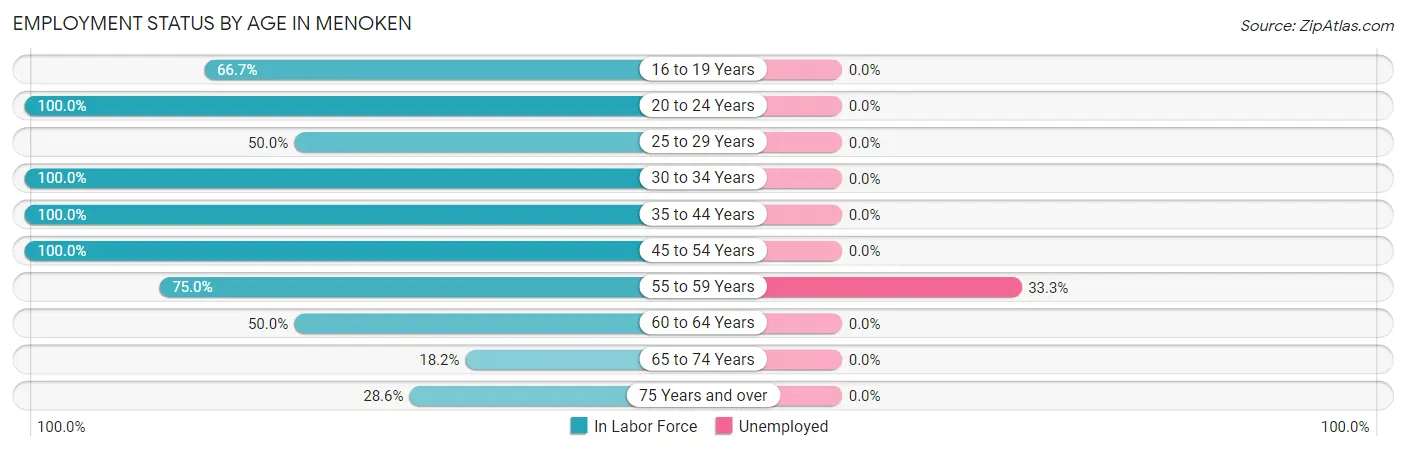
| Age Bracket | In Labor Force | Unemployed |
| 16 to 19 Years | 2 (66.7%) | 0 (0.0%) |
| 20 to 24 Years | 2 (100.0%) | 0 (0.0%) |
| 25 to 29 Years | 1 (50.0%) | 0 (0.0%) |
| 30 to 34 Years | 5 (100.0%) | 0 (0.0%) |
| 35 to 44 Years | 1 (100.0%) | 0 (0.0%) |
| 45 to 54 Years | 16 (100.0%) | 0 (0.0%) |
| 55 to 59 Years | 3 (75.0%) | 1 (33.3%) |
| 60 to 64 Years | 1 (50.0%) | 0 (0.0%) |
| 65 to 74 Years | 2 (18.2%) | 0 (0.0%) |
| 75 Years and over | 2 (28.6%) | 0 (0.0%) |
| Total | 35 (66.0%) | 1 (2.9%) |
Employment Status by Educational Attainment in Menoken
According to labor force statistics for Menoken, 90.0% of individuals (27) out of the total population between 25 and 64 years of age (30) are in the labor force, with 3.7% or 1 of them being unemployed. The group with the highest labor force participation rate are those with the educational attainment of bachelor's degree or higher, with 100.0% or 4 individuals in the labor force. Within the labor force, individuals with college / associate degree education have the highest percentage of unemployment, with 6.3% or 1 of them being unemployed.
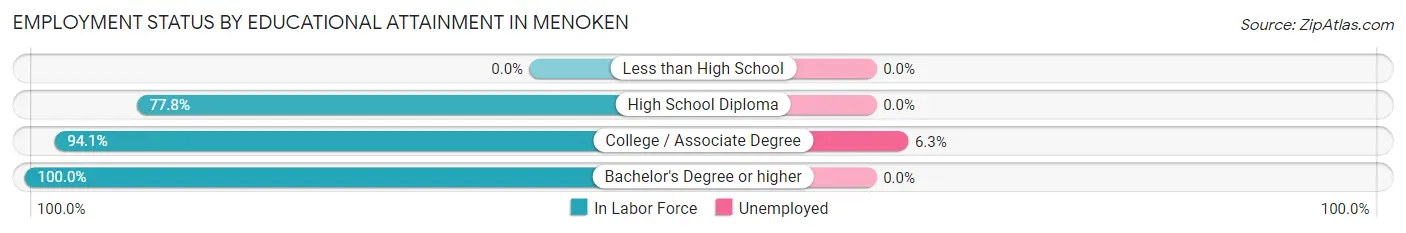
| Educational Attainment | In Labor Force | Unemployed |
| Less than High School | 0 (0.0%) | 0 (0.0%) |
| High School Diploma | 7 (77.8%) | 0 (0.0%) |
| College / Associate Degree | 16 (94.1%) | 1 (6.3%) |
| Bachelor's Degree or higher | 4 (100.0%) | 0 (0.0%) |
| Total | 27 (90.0%) | 1 (3.7%) |
Employment Occupations by Sex in Menoken
Management, Business, Science and Arts Occupations
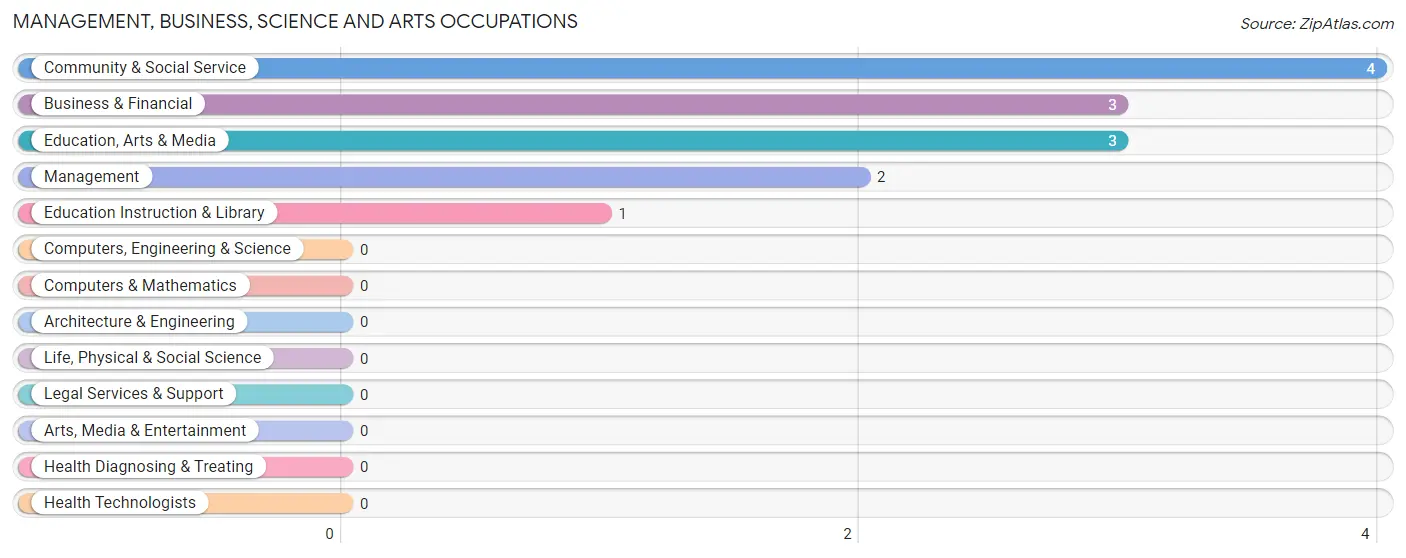
The most common Management, Business, Science and Arts occupations in Menoken are Community & Social Service (4 | 11.8%), Business & Financial (3 | 8.8%), Education, Arts & Media (3 | 8.8%), Management (2 | 5.9%), and Education Instruction & Library (1 | 2.9%).
Management, Business, Science and Arts Occupations by Sex
Within the Management, Business, Science and Arts occupations in Menoken, the most male-oriented occupations are Management (100.0%), Business & Financial (33.3%), and Education, Arts & Media (33.3%), while the most female-oriented occupations are Education Instruction & Library (100.0%), Community & Social Service (75.0%), and Business & Financial (66.7%).
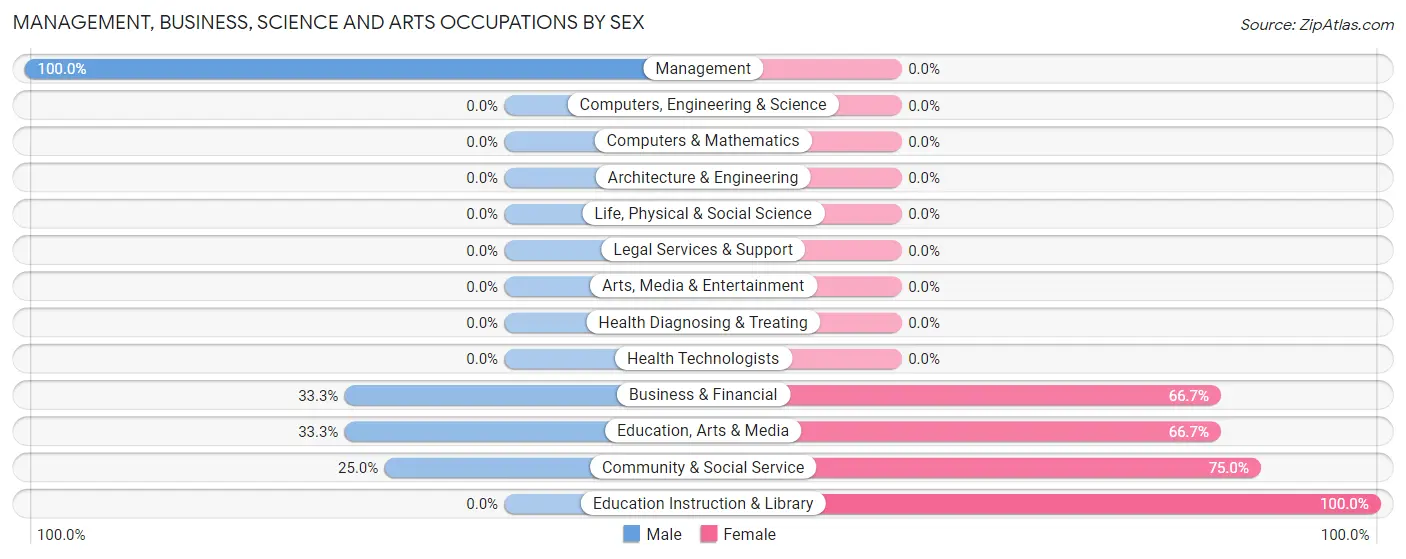
| Occupation | Male | Female |
| Management | 2 (100.0%) | 0 (0.0%) |
| Business & Financial | 1 (33.3%) | 2 (66.7%) |
| Computers, Engineering & Science | 0 (0.0%) | 0 (0.0%) |
| Computers & Mathematics | 0 (0.0%) | 0 (0.0%) |
| Architecture & Engineering | 0 (0.0%) | 0 (0.0%) |
| Life, Physical & Social Science | 0 (0.0%) | 0 (0.0%) |
| Community & Social Service | 1 (25.0%) | 3 (75.0%) |
| Education, Arts & Media | 1 (33.3%) | 2 (66.7%) |
| Legal Services & Support | 0 (0.0%) | 0 (0.0%) |
| Education Instruction & Library | 0 (0.0%) | 1 (100.0%) |
| Arts, Media & Entertainment | 0 (0.0%) | 0 (0.0%) |
| Health Diagnosing & Treating | 0 (0.0%) | 0 (0.0%) |
| Health Technologists | 0 (0.0%) | 0 (0.0%) |
| Total (Category) | 4 (44.4%) | 5 (55.6%) |
| Total (Overall) | 21 (61.8%) | 13 (38.2%) |
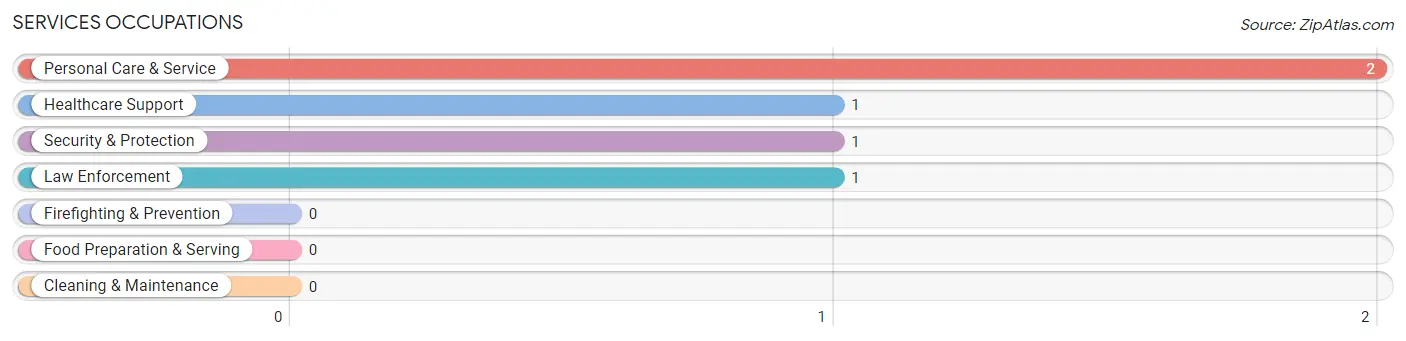
Services Occupations
The most common Services occupations in Menoken are Personal Care & Service (2 | 5.9%), Healthcare Support (1 | 2.9%), Security & Protection (1 | 2.9%), and Law Enforcement (1 | 2.9%).
Services Occupations by Sex
Within the Services occupations in Menoken, the most male-oriented occupations are Security & Protection (100.0%), and Law Enforcement (100.0%), while the most female-oriented occupations are Healthcare Support (100.0%), and Personal Care & Service (100.0%).
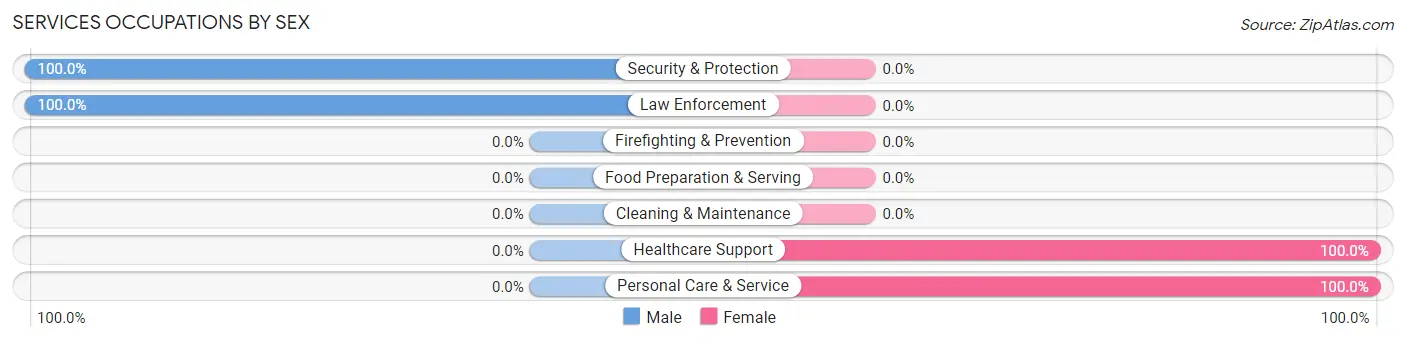
| Occupation | Male | Female |
| Healthcare Support | 0 (0.0%) | 1 (100.0%) |
| Security & Protection | 1 (100.0%) | 0 (0.0%) |
| Firefighting & Prevention | 0 (0.0%) | 0 (0.0%) |
| Law Enforcement | 1 (100.0%) | 0 (0.0%) |
| Food Preparation & Serving | 0 (0.0%) | 0 (0.0%) |
| Cleaning & Maintenance | 0 (0.0%) | 0 (0.0%) |
| Personal Care & Service | 0 (0.0%) | 2 (100.0%) |
| Total (Category) | 1 (25.0%) | 3 (75.0%) |
| Total (Overall) | 21 (61.8%) | 13 (38.2%) |
Sales and Office Occupations
The most common Sales and Office occupations in Menoken are , and Office & Administration (4 | 11.8%).
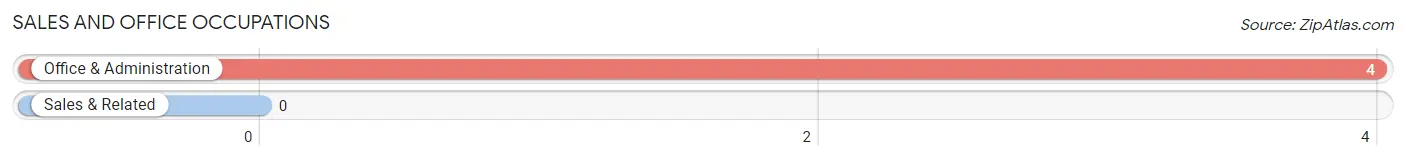
Sales and Office Occupations by Sex
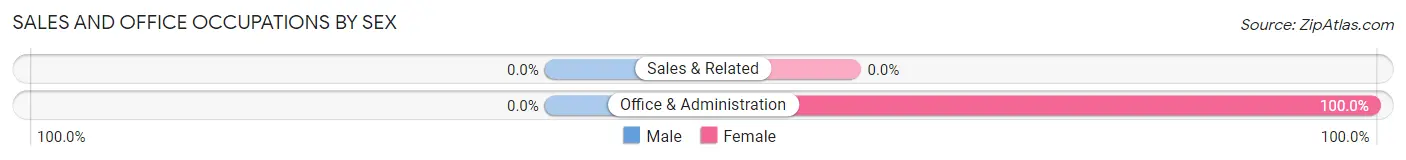
| Occupation | Male | Female |
| Sales & Related | 0 (0.0%) | 0 (0.0%) |
| Office & Administration | 0 (0.0%) | 4 (100.0%) |
| Total (Category) | 0 (0.0%) | 4 (100.0%) |
| Total (Overall) | 21 (61.8%) | 13 (38.2%) |
Natural Resources, Construction and Maintenance Occupations
The most common Natural Resources, Construction and Maintenance occupations in Menoken are , and Installation, Maintenance & Repair (5 | 14.7%).
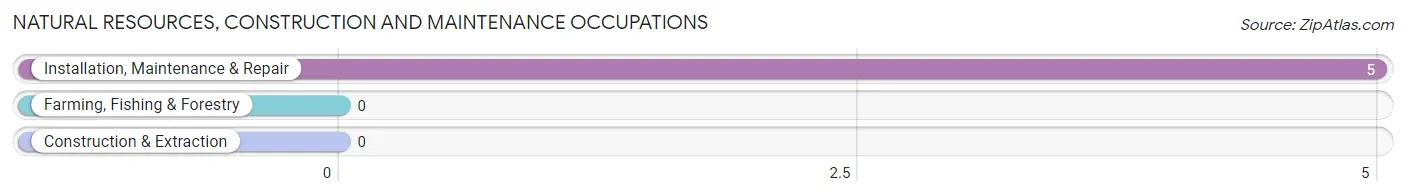
Natural Resources, Construction and Maintenance Occupations by Sex
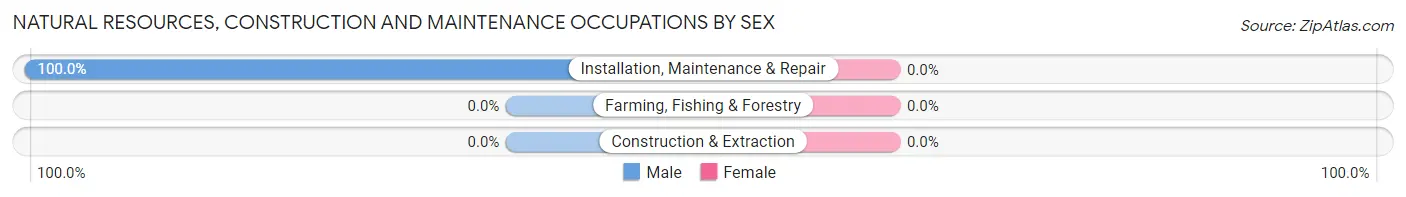
| Occupation | Male | Female |
| Farming, Fishing & Forestry | 0 (0.0%) | 0 (0.0%) |
| Construction & Extraction | 0 (0.0%) | 0 (0.0%) |
| Installation, Maintenance & Repair | 5 (100.0%) | 0 (0.0%) |
| Total (Category) | 5 (100.0%) | 0 (0.0%) |
| Total (Overall) | 21 (61.8%) | 13 (38.2%) |
Production, Transportation and Moving Occupations
The most common Production, Transportation and Moving occupations in Menoken are Production (5 | 14.7%), Material Moving (5 | 14.7%), and Transportation (2 | 5.9%).
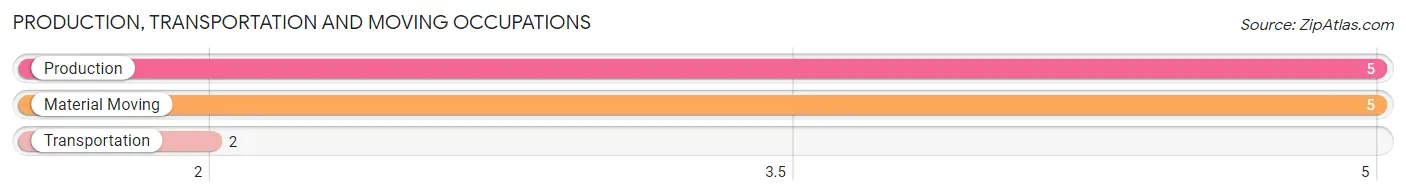
Production, Transportation and Moving Occupations by Sex
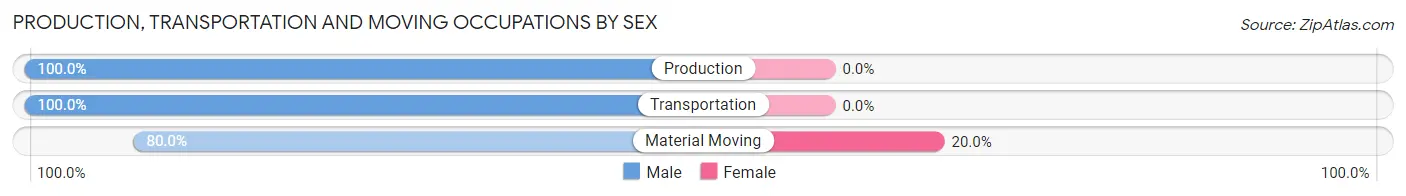
| Occupation | Male | Female |
| Production | 5 (100.0%) | 0 (0.0%) |
| Transportation | 2 (100.0%) | 0 (0.0%) |
| Material Moving | 4 (80.0%) | 1 (20.0%) |
| Total (Category) | 11 (91.7%) | 1 (8.3%) |
| Total (Overall) | 21 (61.8%) | 13 (38.2%) |
Employment Industries by Sex in Menoken
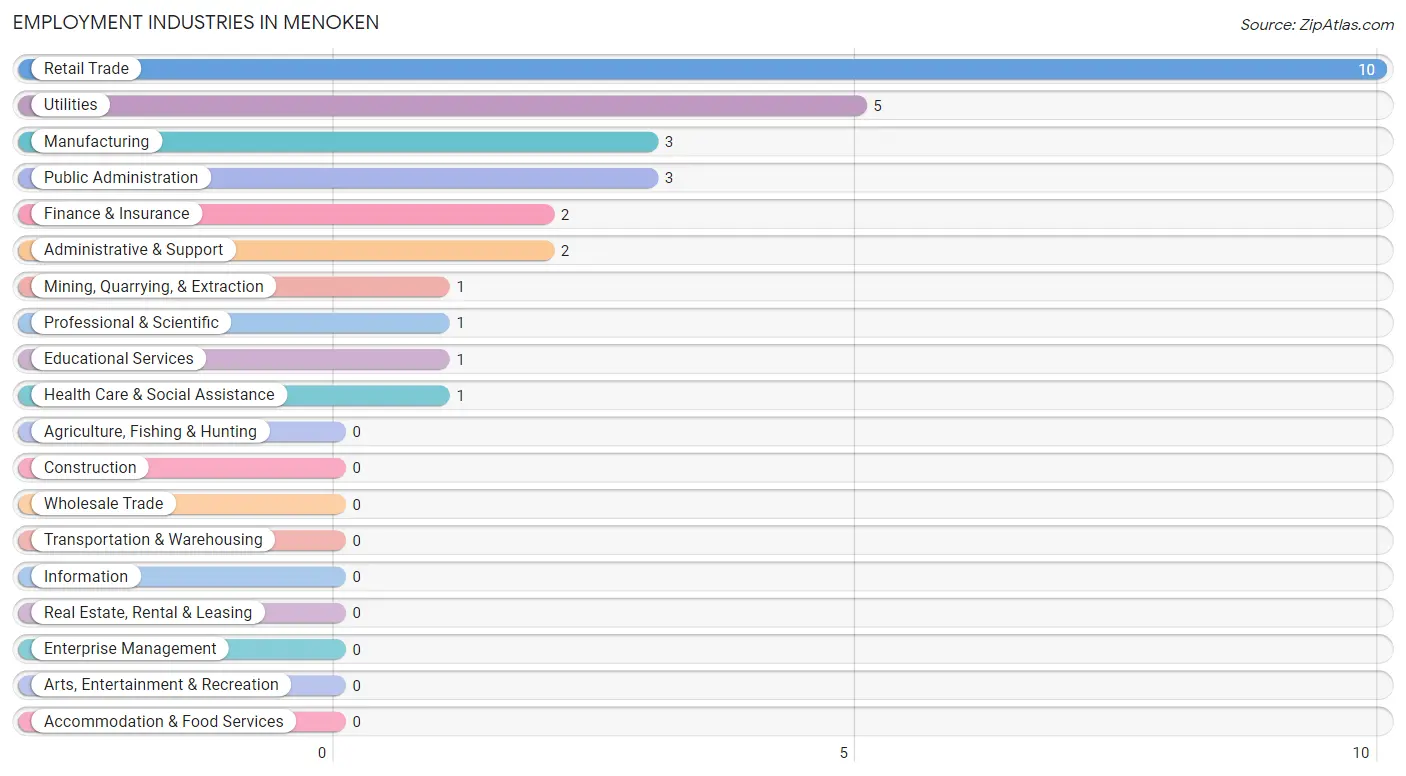
Employment Industries in Menoken
The major employment industries in Menoken include Retail Trade (10 | 29.4%), Utilities (5 | 14.7%), Manufacturing (3 | 8.8%), Public Administration (3 | 8.8%), and Finance & Insurance (2 | 5.9%).
Employment Industries by Sex in Menoken
The Menoken industries that see more men than women are Mining, Quarrying, & Extraction (100.0%), Manufacturing (100.0%), and Utilities (100.0%), whereas the industries that tend to have a higher number of women are Finance & Insurance (100.0%), Professional & Scientific (100.0%), and Educational Services (100.0%).
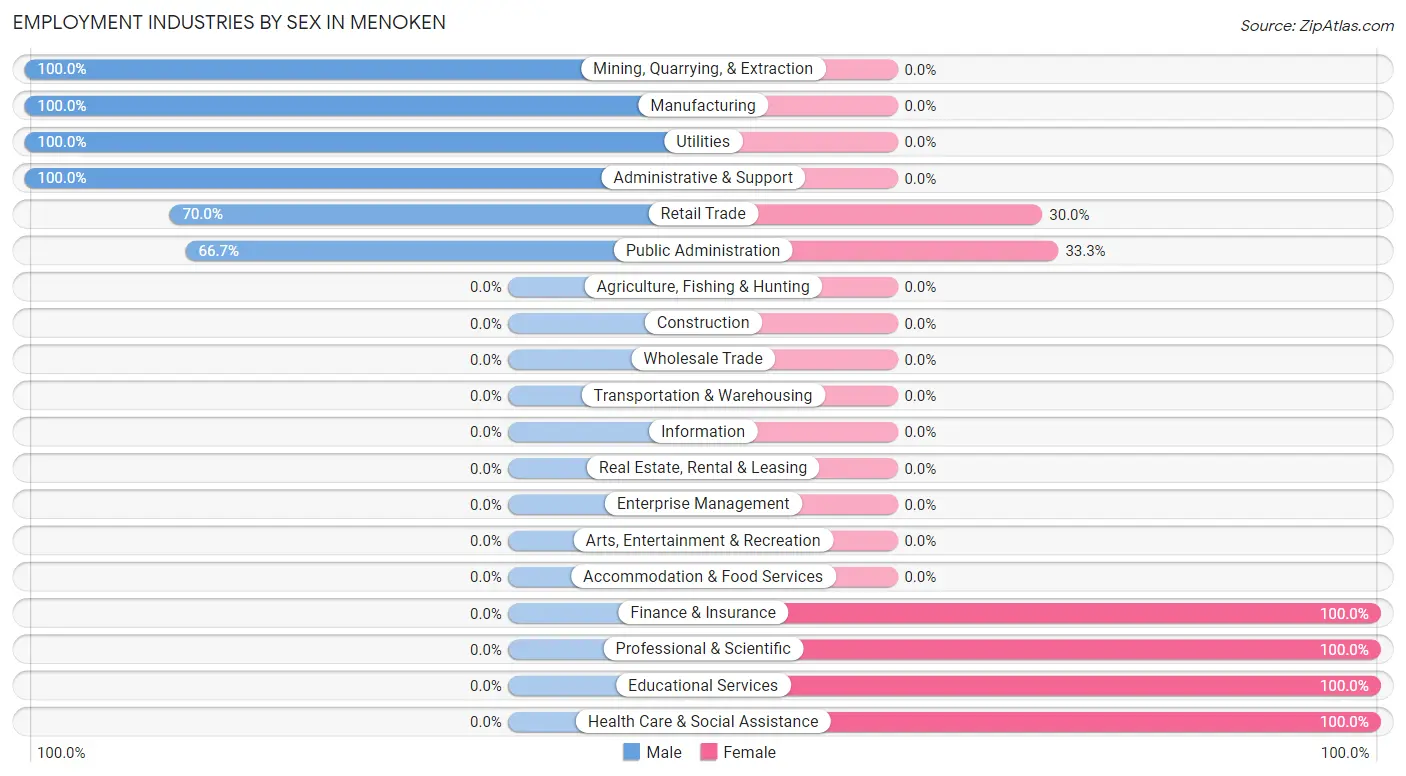
| Industry | Male | Female |
| Agriculture, Fishing & Hunting | 0 (0.0%) | 0 (0.0%) |
| Mining, Quarrying, & Extraction | 1 (100.0%) | 0 (0.0%) |
| Construction | 0 (0.0%) | 0 (0.0%) |
| Manufacturing | 3 (100.0%) | 0 (0.0%) |
| Wholesale Trade | 0 (0.0%) | 0 (0.0%) |
| Retail Trade | 7 (70.0%) | 3 (30.0%) |
| Transportation & Warehousing | 0 (0.0%) | 0 (0.0%) |
| Utilities | 5 (100.0%) | 0 (0.0%) |
| Information | 0 (0.0%) | 0 (0.0%) |
| Finance & Insurance | 0 (0.0%) | 2 (100.0%) |
| Real Estate, Rental & Leasing | 0 (0.0%) | 0 (0.0%) |
| Professional & Scientific | 0 (0.0%) | 1 (100.0%) |
| Enterprise Management | 0 (0.0%) | 0 (0.0%) |
| Administrative & Support | 2 (100.0%) | 0 (0.0%) |
| Educational Services | 0 (0.0%) | 1 (100.0%) |
| Health Care & Social Assistance | 0 (0.0%) | 1 (100.0%) |
| Arts, Entertainment & Recreation | 0 (0.0%) | 0 (0.0%) |
| Accommodation & Food Services | 0 (0.0%) | 0 (0.0%) |
| Public Administration | 2 (66.7%) | 1 (33.3%) |
| Total | 21 (61.8%) | 13 (38.2%) |
Education in Menoken
School Enrollment in Menoken
The most common levels of schooling among the 12 students in Menoken are high school (6 | 50.0%), elementary school (3 | 25.0%), and college / undergraduate (2 | 16.7%).
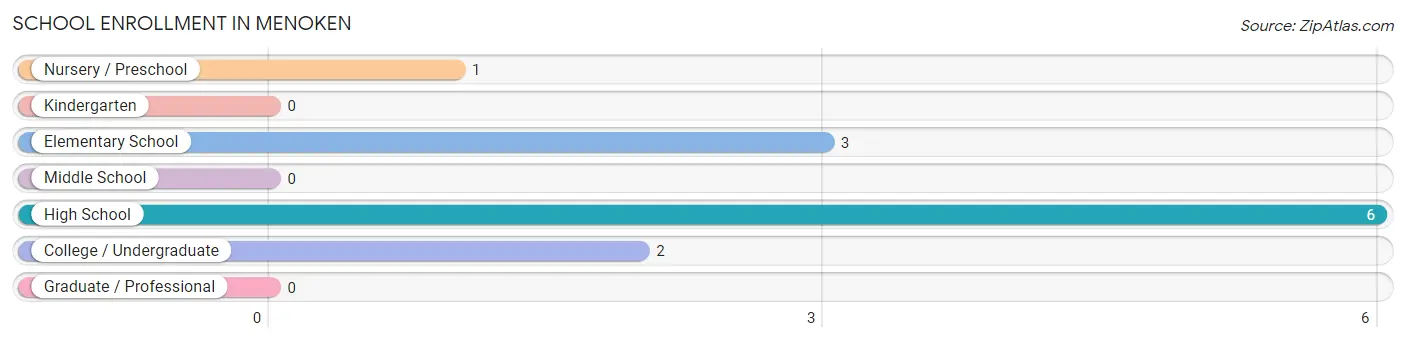
| School Level | # Students | % Students |
| Nursery / Preschool | 1 | 8.3% |
| Kindergarten | 0 | 0.0% |
| Elementary School | 3 | 25.0% |
| Middle School | 0 | 0.0% |
| High School | 6 | 50.0% |
| College / Undergraduate | 2 | 16.7% |
| Graduate / Professional | 0 | 0.0% |
| Total | 12 | 100.0% |
School Enrollment by Age by Funding Source in Menoken
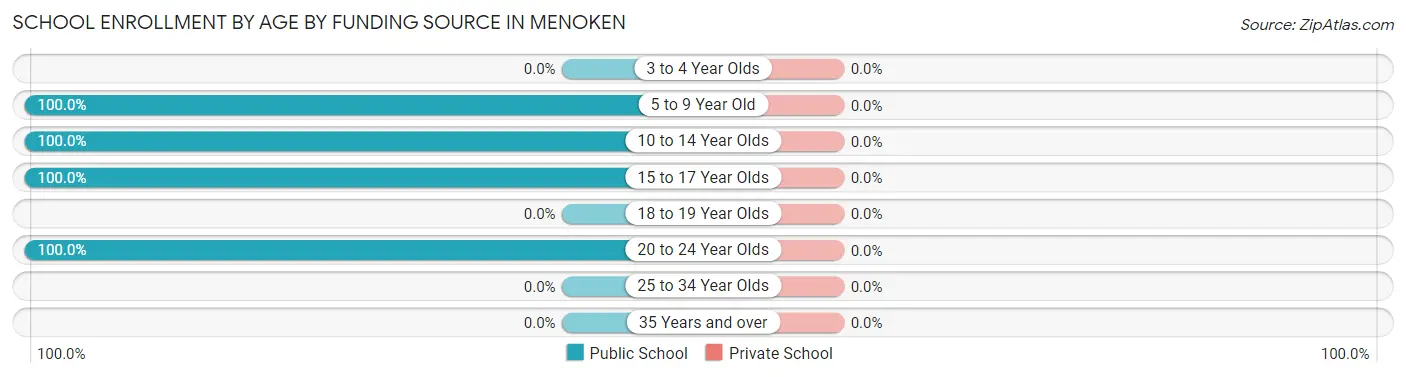
| Age Bracket | Public School | Private School |
| 3 to 4 Year Olds | 0 (0.0%) | 0 (0.0%) |
| 5 to 9 Year Old | 3 (100.0%) | 0 (0.0%) |
| 10 to 14 Year Olds | 1 (100.0%) | 0 (0.0%) |
| 15 to 17 Year Olds | 6 (100.0%) | 0 (0.0%) |
| 18 to 19 Year Olds | 0 (0.0%) | 0 (0.0%) |
| 20 to 24 Year Olds | 2 (100.0%) | 0 (0.0%) |
| 25 to 34 Year Olds | 0 (0.0%) | 0 (0.0%) |
| 35 Years and over | 0 (0.0%) | 0 (0.0%) |
| Total | 12 (100.0%) | 0 (0.0%) |
Educational Attainment by Field of Study in Menoken
Education (5 | 55.6%), bio, nature & agricultural (2 | 22.2%), physical & health sciences (1 | 11.1%), and liberal arts & history (1 | 11.1%) are the most common fields of study among 9 individuals in Menoken who have obtained a bachelor's degree or higher.
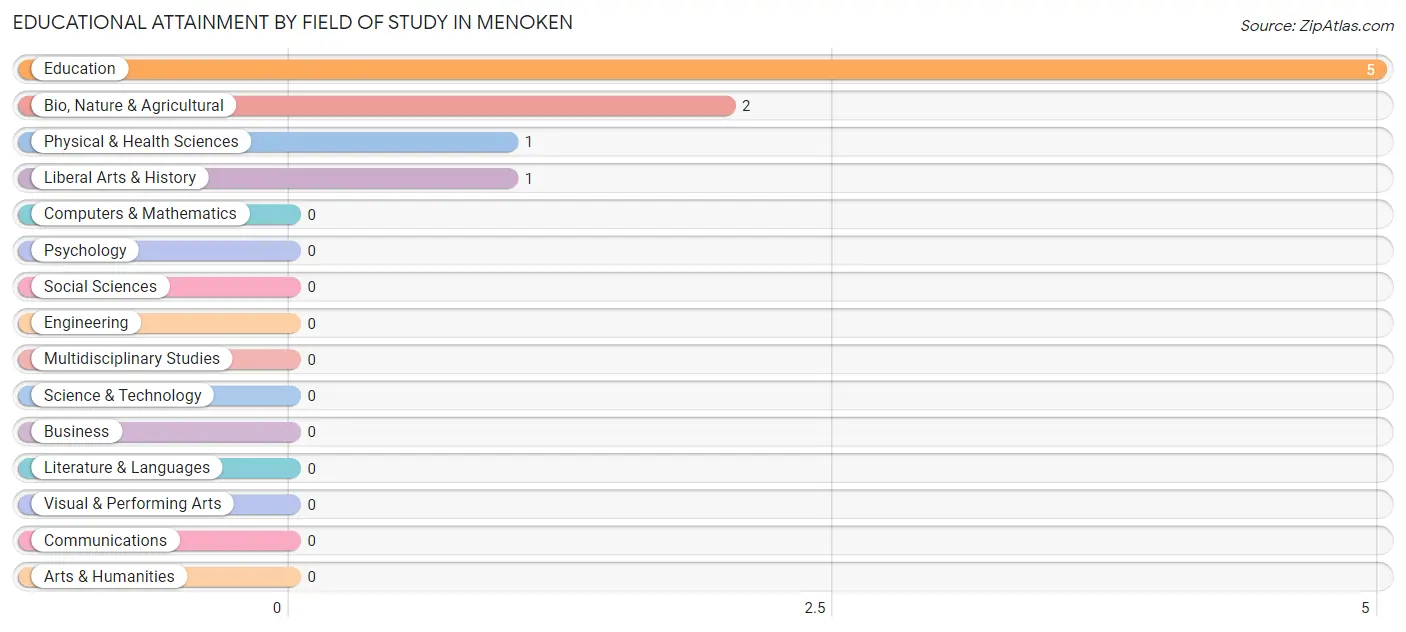
| Field of Study | # Graduates | % Graduates |
| Computers & Mathematics | 0 | 0.0% |
| Bio, Nature & Agricultural | 2 | 22.2% |
| Physical & Health Sciences | 1 | 11.1% |
| Psychology | 0 | 0.0% |
| Social Sciences | 0 | 0.0% |
| Engineering | 0 | 0.0% |
| Multidisciplinary Studies | 0 | 0.0% |
| Science & Technology | 0 | 0.0% |
| Business | 0 | 0.0% |
| Education | 5 | 55.6% |
| Literature & Languages | 0 | 0.0% |
| Liberal Arts & History | 1 | 11.1% |
| Visual & Performing Arts | 0 | 0.0% |
| Communications | 0 | 0.0% |
| Arts & Humanities | 0 | 0.0% |
| Total | 9 | 100.0% |
Transportation & Commute in Menoken
Vehicle Availability by Sex in Menoken
The most prevalent vehicle ownership categories in Menoken are males with 2 vehicles (8, accounting for 38.1%) and females with 2 vehicles (5, making up 72.7%).
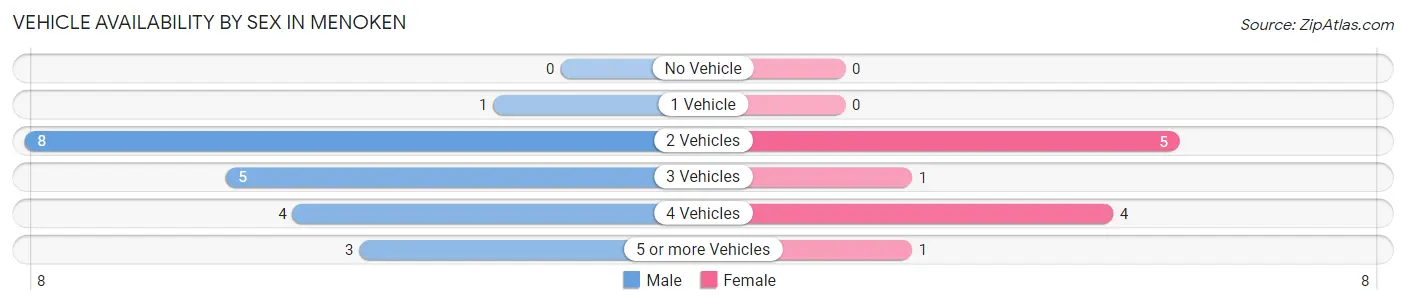
| Vehicles Available | Male | Female |
| No Vehicle | 0 (0.0%) | 0 (0.0%) |
| 1 Vehicle | 1 (4.8%) | 0 (0.0%) |
| 2 Vehicles | 8 (38.1%) | 5 (45.5%) |
| 3 Vehicles | 5 (23.8%) | 1 (9.1%) |
| 4 Vehicles | 4 (19.1%) | 4 (36.4%) |
| 5 or more Vehicles | 3 (14.3%) | 1 (9.1%) |
| Total | 21 (100.0%) | 11 (100.0%) |
Commute Time in Menoken
The most frequently occuring commute durations in Menoken are 10 to 14 minutes (12 commuters, 40.0%), 20 to 24 minutes (12 commuters, 40.0%), and 30 to 34 minutes (3 commuters, 10.0%).
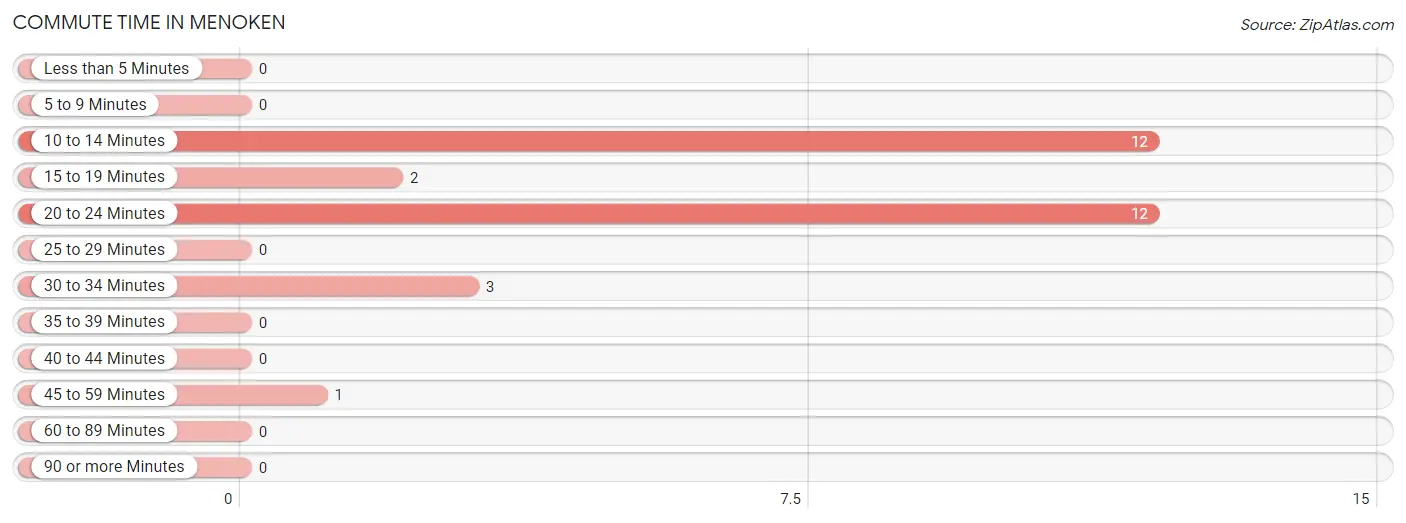
| Commute Time | # Commuters | % Commuters |
| Less than 5 Minutes | 0 | 0.0% |
| 5 to 9 Minutes | 0 | 0.0% |
| 10 to 14 Minutes | 12 | 40.0% |
| 15 to 19 Minutes | 2 | 6.7% |
| 20 to 24 Minutes | 12 | 40.0% |
| 25 to 29 Minutes | 0 | 0.0% |
| 30 to 34 Minutes | 3 | 10.0% |
| 35 to 39 Minutes | 0 | 0.0% |
| 40 to 44 Minutes | 0 | 0.0% |
| 45 to 59 Minutes | 1 | 3.3% |
| 60 to 89 Minutes | 0 | 0.0% |
| 90 or more Minutes | 0 | 0.0% |
Commute Time by Sex in Menoken
The most common commute times in Menoken are 10 to 14 minutes (9 commuters, 42.9%) for males and 20 to 24 minutes (4 commuters, 44.4%) for females.
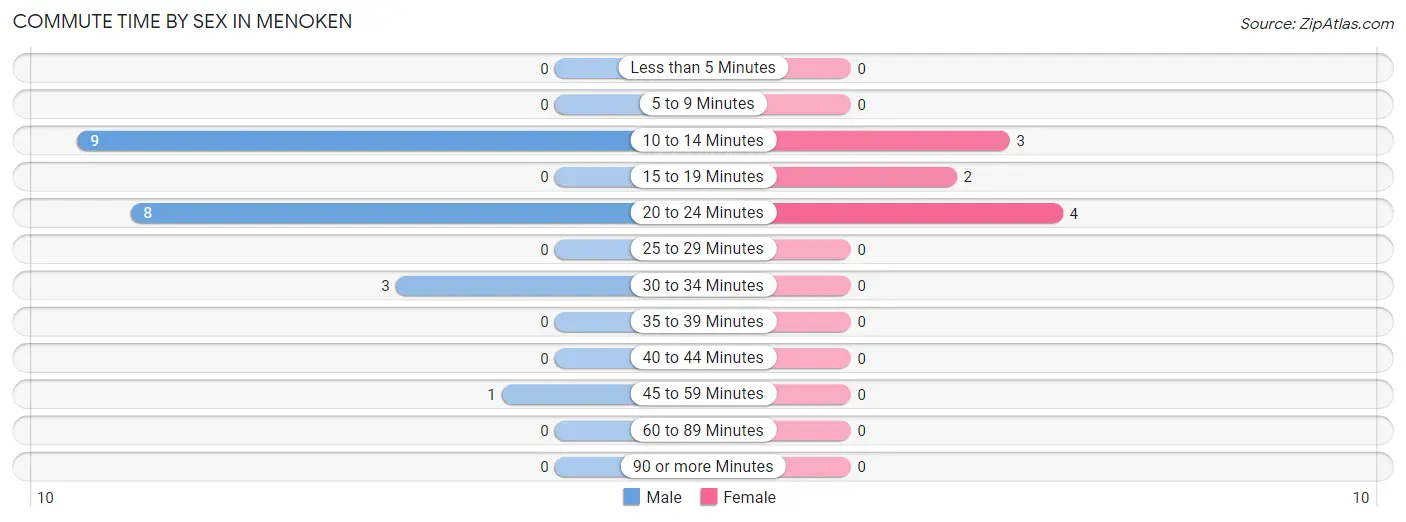
| Commute Time | Male | Female |
| Less than 5 Minutes | 0 (0.0%) | 0 (0.0%) |
| 5 to 9 Minutes | 0 (0.0%) | 0 (0.0%) |
| 10 to 14 Minutes | 9 (42.9%) | 3 (33.3%) |
| 15 to 19 Minutes | 0 (0.0%) | 2 (22.2%) |
| 20 to 24 Minutes | 8 (38.1%) | 4 (44.4%) |
| 25 to 29 Minutes | 0 (0.0%) | 0 (0.0%) |
| 30 to 34 Minutes | 3 (14.3%) | 0 (0.0%) |
| 35 to 39 Minutes | 0 (0.0%) | 0 (0.0%) |
| 40 to 44 Minutes | 0 (0.0%) | 0 (0.0%) |
| 45 to 59 Minutes | 1 (4.8%) | 0 (0.0%) |
| 60 to 89 Minutes | 0 (0.0%) | 0 (0.0%) |
| 90 or more Minutes | 0 (0.0%) | 0 (0.0%) |
Time of Departure to Work by Sex in Menoken
The most frequent times of departure to work in Menoken are 7:00 AM to 7:29 AM (4, 19.1%) for males and 7:00 AM to 7:29 AM (3, 33.3%) for females.
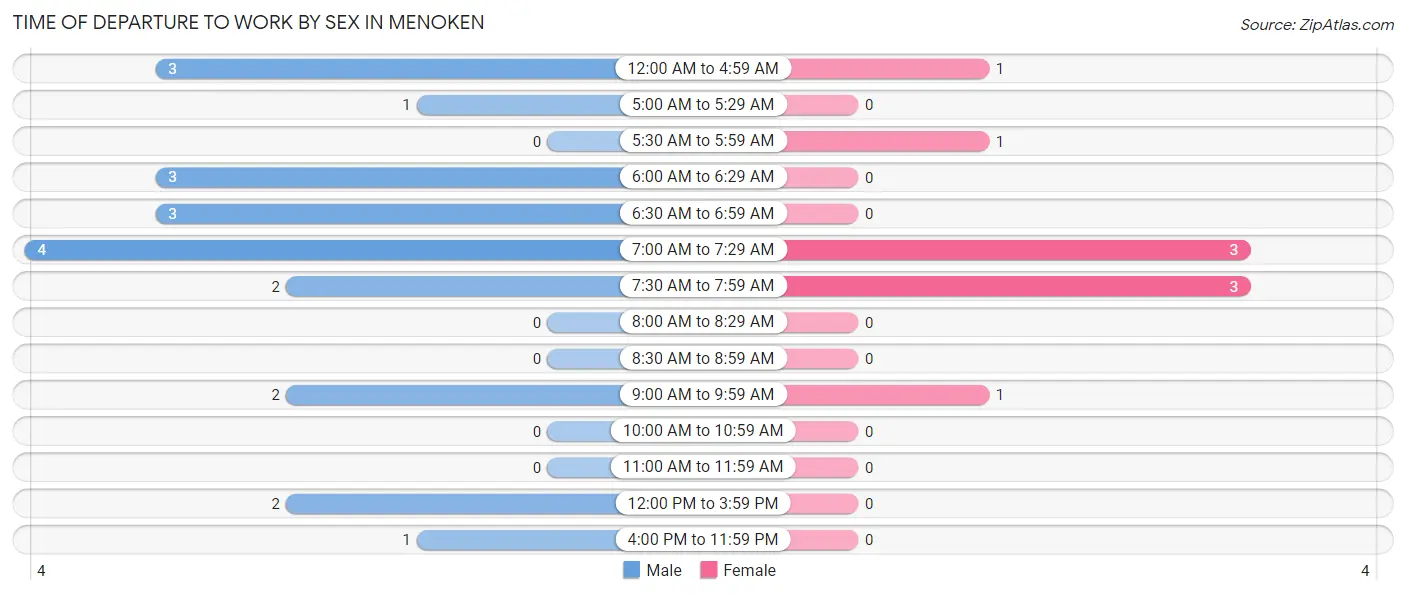
| Time of Departure | Male | Female |
| 12:00 AM to 4:59 AM | 3 (14.3%) | 1 (11.1%) |
| 5:00 AM to 5:29 AM | 1 (4.8%) | 0 (0.0%) |
| 5:30 AM to 5:59 AM | 0 (0.0%) | 1 (11.1%) |
| 6:00 AM to 6:29 AM | 3 (14.3%) | 0 (0.0%) |
| 6:30 AM to 6:59 AM | 3 (14.3%) | 0 (0.0%) |
| 7:00 AM to 7:29 AM | 4 (19.1%) | 3 (33.3%) |
| 7:30 AM to 7:59 AM | 2 (9.5%) | 3 (33.3%) |
| 8:00 AM to 8:29 AM | 0 (0.0%) | 0 (0.0%) |
| 8:30 AM to 8:59 AM | 0 (0.0%) | 0 (0.0%) |
| 9:00 AM to 9:59 AM | 2 (9.5%) | 1 (11.1%) |
| 10:00 AM to 10:59 AM | 0 (0.0%) | 0 (0.0%) |
| 11:00 AM to 11:59 AM | 0 (0.0%) | 0 (0.0%) |
| 12:00 PM to 3:59 PM | 2 (9.5%) | 0 (0.0%) |
| 4:00 PM to 11:59 PM | 1 (4.8%) | 0 (0.0%) |
| Total | 21 (100.0%) | 9 (100.0%) |
Housing Occupancy in Menoken
Occupancy by Ownership in Menoken
Of the total 29 dwellings in Menoken, owner-occupied units account for 28 (96.6%), while renter-occupied units make up 1 (3.5%).
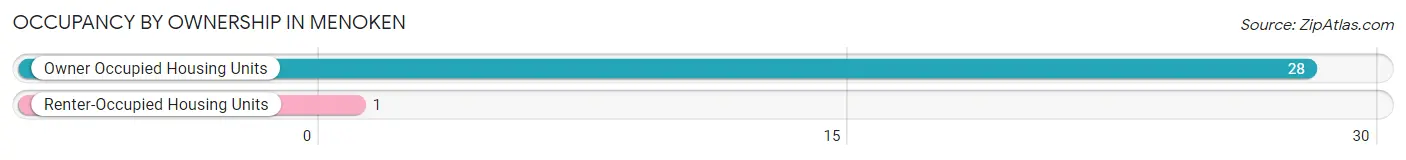
| Occupancy | # Housing Units | % Housing Units |
| Owner Occupied Housing Units | 28 | 96.6% |
| Renter-Occupied Housing Units | 1 | 3.5% |
| Total Occupied Housing Units | 29 | 100.0% |
Occupancy by Household Size in Menoken
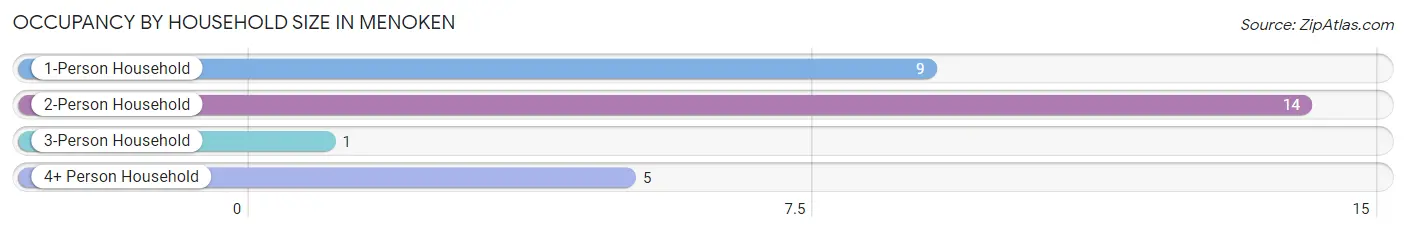
| Household Size | # Housing Units | % Housing Units |
| 1-Person Household | 9 | 31.0% |
| 2-Person Household | 14 | 48.3% |
| 3-Person Household | 1 | 3.5% |
| 4+ Person Household | 5 | 17.2% |
| Total Housing Units | 29 | 100.0% |
Occupancy by Ownership by Household Size in Menoken
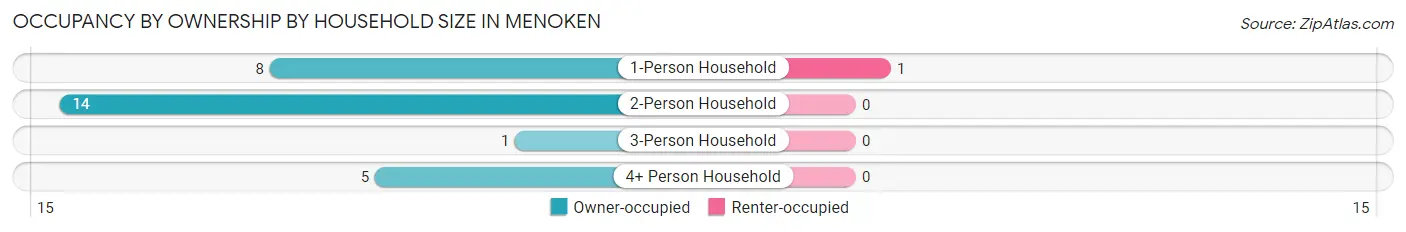
| Household Size | Owner-occupied | Renter-occupied |
| 1-Person Household | 8 (88.9%) | 1 (11.1%) |
| 2-Person Household | 14 (100.0%) | 0 (0.0%) |
| 3-Person Household | 1 (100.0%) | 0 (0.0%) |
| 4+ Person Household | 5 (100.0%) | 0 (0.0%) |
| Total Housing Units | 28 (96.6%) | 1 (3.5%) |
Occupancy by Educational Attainment in Menoken
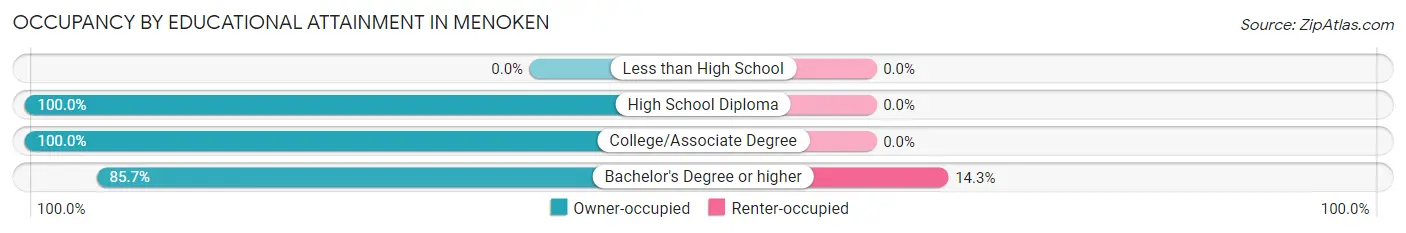
| Household Size | Owner-occupied | Renter-occupied |
| Less than High School | 0 (0.0%) | 0 (0.0%) |
| High School Diploma | 6 (100.0%) | 0 (0.0%) |
| College/Associate Degree | 16 (100.0%) | 0 (0.0%) |
| Bachelor's Degree or higher | 6 (85.7%) | 1 (14.3%) |
Occupancy by Age of Householder in Menoken
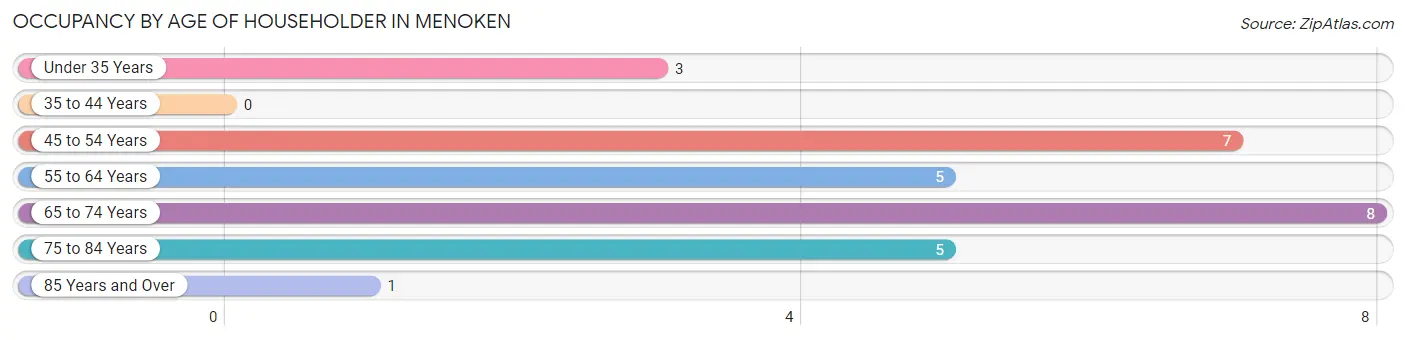
| Age Bracket | # Households | % Households |
| Under 35 Years | 3 | 10.3% |
| 35 to 44 Years | 0 | 0.0% |
| 45 to 54 Years | 7 | 24.1% |
| 55 to 64 Years | 5 | 17.2% |
| 65 to 74 Years | 8 | 27.6% |
| 75 to 84 Years | 5 | 17.2% |
| 85 Years and Over | 1 | 3.5% |
| Total | 29 | 100.0% |
Housing Finances in Menoken
Median Income by Occupancy in Menoken
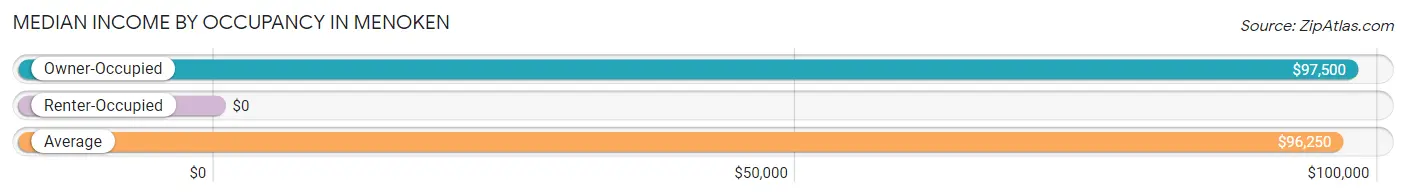
| Occupancy Type | # Households | Median Income |
| Owner-Occupied | 28 (96.6%) | $97,500 |
| Renter-Occupied | 1 (3.5%) | $0 |
| Average | 29 (100.0%) | $96,250 |
Occupancy by Householder Income Bracket in Menoken
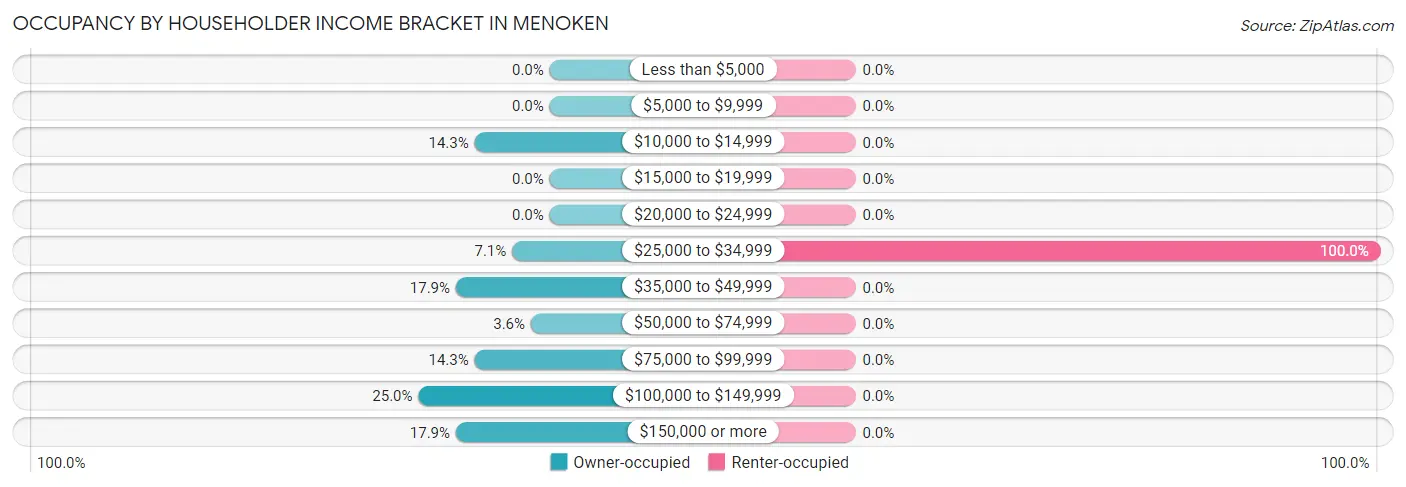
| Income Bracket | Owner-occupied | Renter-occupied |
| Less than $5,000 | 0 (0.0%) | 0 (0.0%) |
| $5,000 to $9,999 | 0 (0.0%) | 0 (0.0%) |
| $10,000 to $14,999 | 4 (14.3%) | 0 (0.0%) |
| $15,000 to $19,999 | 0 (0.0%) | 0 (0.0%) |
| $20,000 to $24,999 | 0 (0.0%) | 0 (0.0%) |
| $25,000 to $34,999 | 2 (7.1%) | 1 (100.0%) |
| $35,000 to $49,999 | 5 (17.9%) | 0 (0.0%) |
| $50,000 to $74,999 | 1 (3.6%) | 0 (0.0%) |
| $75,000 to $99,999 | 4 (14.3%) | 0 (0.0%) |
| $100,000 to $149,999 | 7 (25.0%) | 0 (0.0%) |
| $150,000 or more | 5 (17.9%) | 0 (0.0%) |
| Total | 28 (100.0%) | 1 (100.0%) |
Monthly Housing Cost Tiers in Menoken
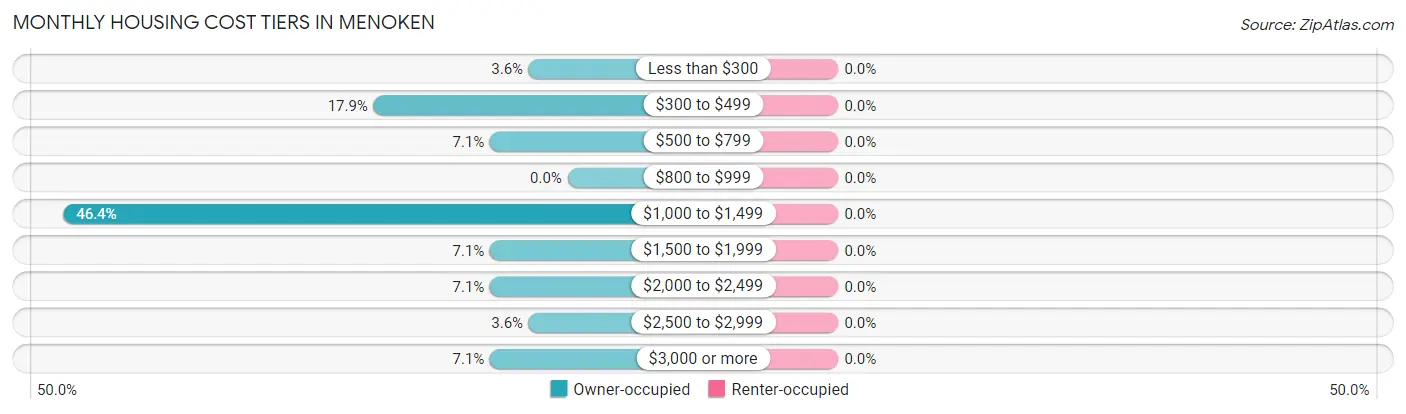
| Monthly Cost | Owner-occupied | Renter-occupied |
| Less than $300 | 1 (3.6%) | 0 (0.0%) |
| $300 to $499 | 5 (17.9%) | 0 (0.0%) |
| $500 to $799 | 2 (7.1%) | 0 (0.0%) |
| $800 to $999 | 0 (0.0%) | 0 (0.0%) |
| $1,000 to $1,499 | 13 (46.4%) | 0 (0.0%) |
| $1,500 to $1,999 | 2 (7.1%) | 0 (0.0%) |
| $2,000 to $2,499 | 2 (7.1%) | 0 (0.0%) |
| $2,500 to $2,999 | 1 (3.6%) | 0 (0.0%) |
| $3,000 or more | 2 (7.1%) | 0 (0.0%) |
| Total | 28 (100.0%) | 1 (100.0%) |
Physical Housing Characteristics in Menoken
Housing Structures in Menoken
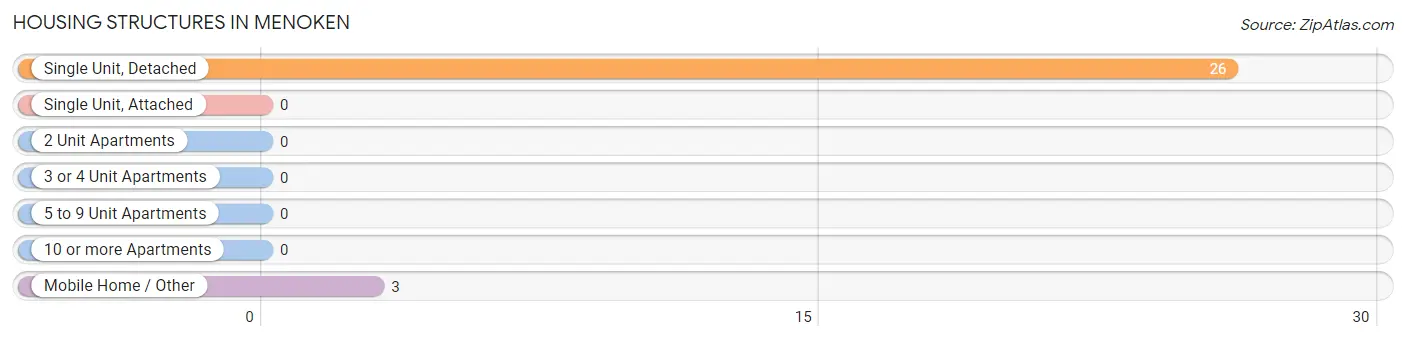
| Structure Type | # Housing Units | % Housing Units |
| Single Unit, Detached | 26 | 89.7% |
| Single Unit, Attached | 0 | 0.0% |
| 2 Unit Apartments | 0 | 0.0% |
| 3 or 4 Unit Apartments | 0 | 0.0% |
| 5 to 9 Unit Apartments | 0 | 0.0% |
| 10 or more Apartments | 0 | 0.0% |
| Mobile Home / Other | 3 | 10.3% |
| Total | 29 | 100.0% |
Housing Structures by Occupancy in Menoken
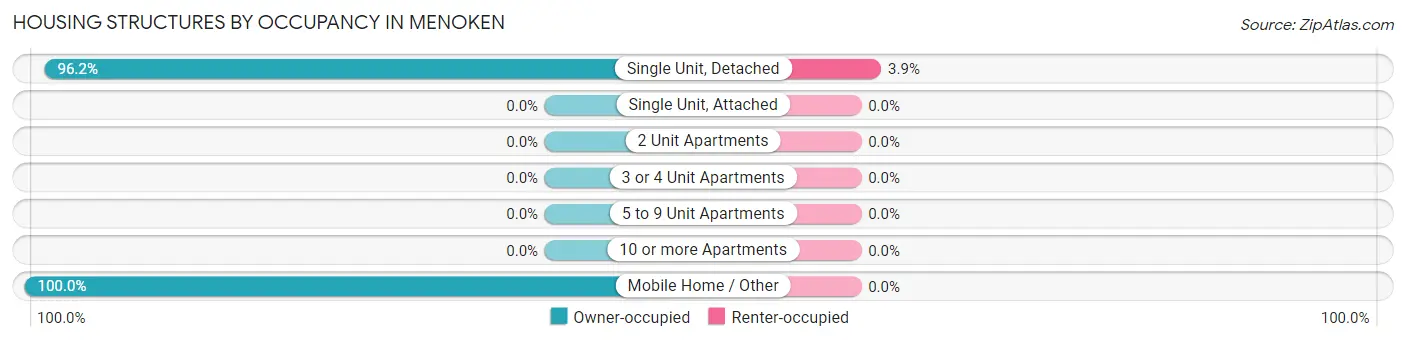
| Structure Type | Owner-occupied | Renter-occupied |
| Single Unit, Detached | 25 (96.2%) | 1 (3.8%) |
| Single Unit, Attached | 0 (0.0%) | 0 (0.0%) |
| 2 Unit Apartments | 0 (0.0%) | 0 (0.0%) |
| 3 or 4 Unit Apartments | 0 (0.0%) | 0 (0.0%) |
| 5 to 9 Unit Apartments | 0 (0.0%) | 0 (0.0%) |
| 10 or more Apartments | 0 (0.0%) | 0 (0.0%) |
| Mobile Home / Other | 3 (100.0%) | 0 (0.0%) |
| Total | 28 (96.6%) | 1 (3.5%) |
Housing Structures by Number of Rooms in Menoken
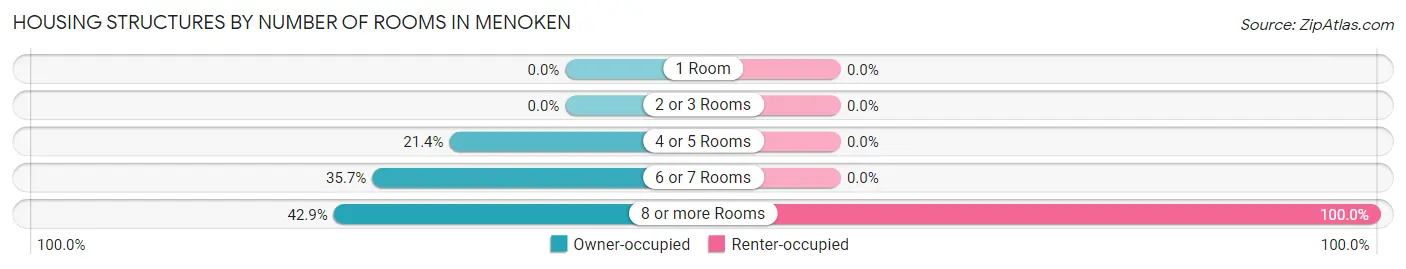
| Number of Rooms | Owner-occupied | Renter-occupied |
| 1 Room | 0 (0.0%) | 0 (0.0%) |
| 2 or 3 Rooms | 0 (0.0%) | 0 (0.0%) |
| 4 or 5 Rooms | 6 (21.4%) | 0 (0.0%) |
| 6 or 7 Rooms | 10 (35.7%) | 0 (0.0%) |
| 8 or more Rooms | 12 (42.9%) | 1 (100.0%) |
| Total | 28 (100.0%) | 1 (100.0%) |
Housing Structure by Heating Type in Menoken
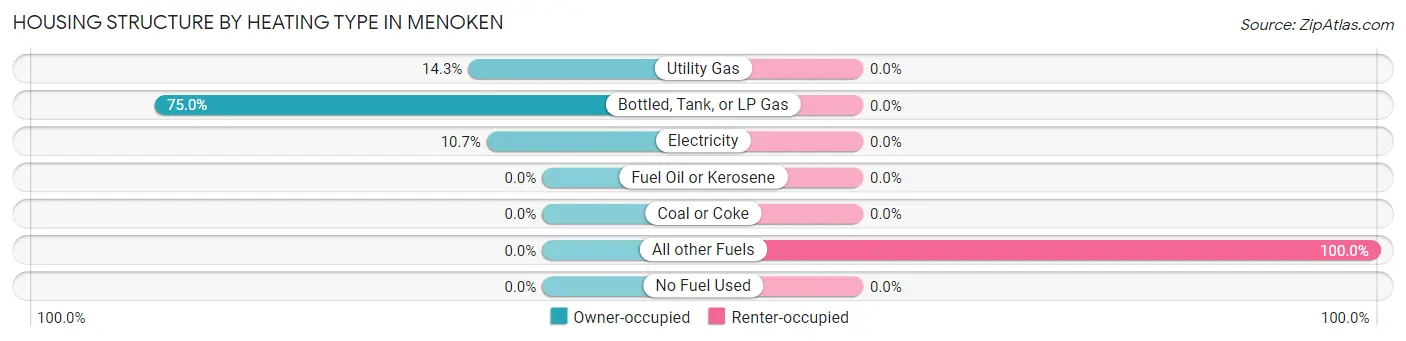
| Heating Type | Owner-occupied | Renter-occupied |
| Utility Gas | 4 (14.3%) | 0 (0.0%) |
| Bottled, Tank, or LP Gas | 21 (75.0%) | 0 (0.0%) |
| Electricity | 3 (10.7%) | 0 (0.0%) |
| Fuel Oil or Kerosene | 0 (0.0%) | 0 (0.0%) |
| Coal or Coke | 0 (0.0%) | 0 (0.0%) |
| All other Fuels | 0 (0.0%) | 1 (100.0%) |
| No Fuel Used | 0 (0.0%) | 0 (0.0%) |
| Total | 28 (100.0%) | 1 (100.0%) |
Household Vehicle Usage in Menoken
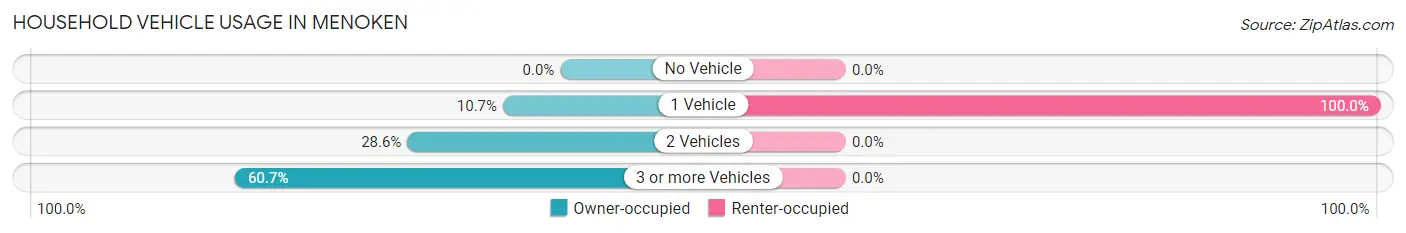
| Vehicles per Household | Owner-occupied | Renter-occupied |
| No Vehicle | 0 (0.0%) | 0 (0.0%) |
| 1 Vehicle | 3 (10.7%) | 1 (100.0%) |
| 2 Vehicles | 8 (28.6%) | 0 (0.0%) |
| 3 or more Vehicles | 17 (60.7%) | 0 (0.0%) |
| Total | 28 (100.0%) | 1 (100.0%) |
Real Estate & Mortgages in Menoken
Real Estate and Mortgage Overview in Menoken
| Characteristic | Without Mortgage | With Mortgage |
| Housing Units | 16 | 12 |
| Median Property Value | $227,800 | $420,000 |
| Median Household Income | - | - |
| Monthly Housing Costs | $900 | $2 |
| Real Estate Taxes | - | - |
Property Value by Mortgage Status in Menoken
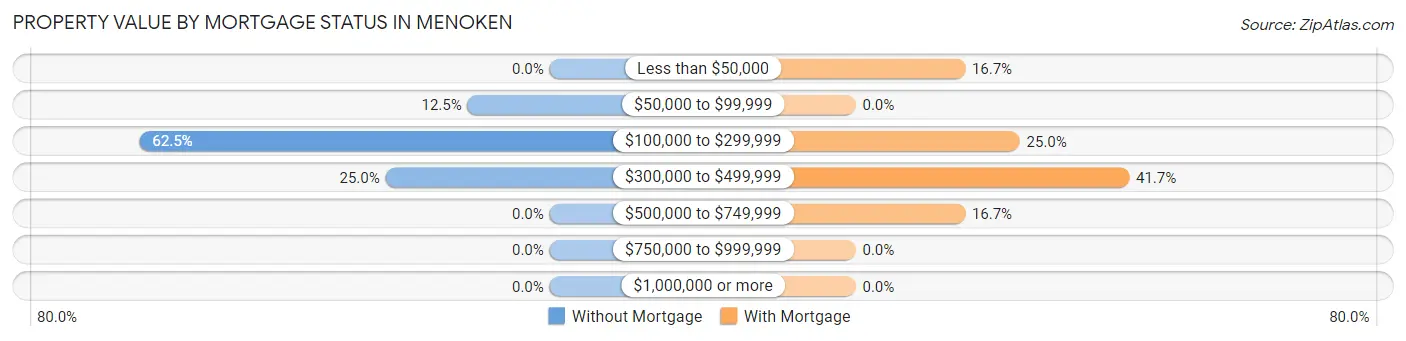
| Property Value | Without Mortgage | With Mortgage |
| Less than $50,000 | 0 (0.0%) | 2 (16.7%) |
| $50,000 to $99,999 | 2 (12.5%) | 0 (0.0%) |
| $100,000 to $299,999 | 10 (62.5%) | 3 (25.0%) |
| $300,000 to $499,999 | 4 (25.0%) | 5 (41.7%) |
| $500,000 to $749,999 | 0 (0.0%) | 2 (16.7%) |
| $750,000 to $999,999 | 0 (0.0%) | 0 (0.0%) |
| $1,000,000 or more | 0 (0.0%) | 0 (0.0%) |
| Total | 16 (100.0%) | 12 (100.0%) |
Household Income by Mortgage Status in Menoken
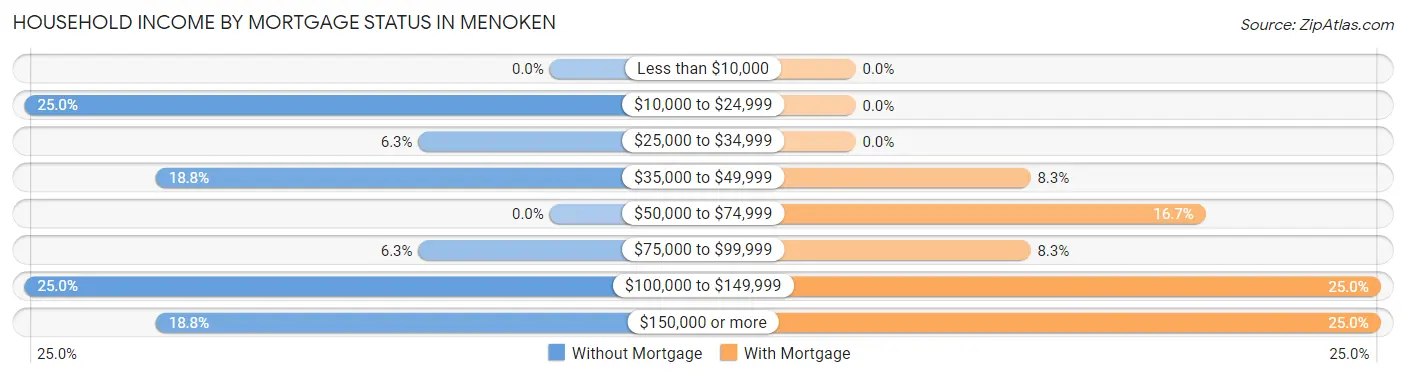
| Household Income | Without Mortgage | With Mortgage |
| Less than $10,000 | 0 (0.0%) | 0 (0.0%) |
| $10,000 to $24,999 | 4 (25.0%) | 0 (0.0%) |
| $25,000 to $34,999 | 1 (6.2%) | 0 (0.0%) |
| $35,000 to $49,999 | 3 (18.8%) | 1 (8.3%) |
| $50,000 to $74,999 | 0 (0.0%) | 2 (16.7%) |
| $75,000 to $99,999 | 1 (6.2%) | 1 (8.3%) |
| $100,000 to $149,999 | 4 (25.0%) | 3 (25.0%) |
| $150,000 or more | 3 (18.8%) | 3 (25.0%) |
| Total | 16 (100.0%) | 12 (100.0%) |
Property Value to Household Income Ratio in Menoken
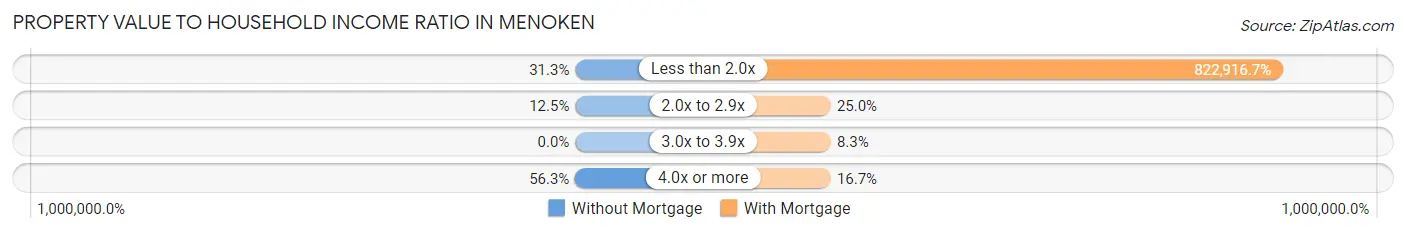
| Value-to-Income Ratio | Without Mortgage | With Mortgage |
| Less than 2.0x | 5 (31.2%) | 98,750 (822,916.7%) |
| 2.0x to 2.9x | 2 (12.5%) | 3 (25.0%) |
| 3.0x to 3.9x | 0 (0.0%) | 1 (8.3%) |
| 4.0x or more | 9 (56.2%) | 2 (16.7%) |
| Total | 16 (100.0%) | 12 (100.0%) |
Real Estate Taxes by Mortgage Status in Menoken
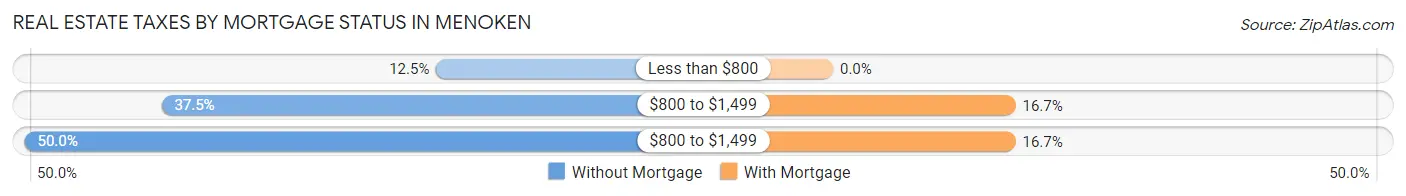
| Property Taxes | Without Mortgage | With Mortgage |
| Less than $800 | 2 (12.5%) | 0 (0.0%) |
| $800 to $1,499 | 6 (37.5%) | 2 (16.7%) |
| $800 to $1,499 | 8 (50.0%) | 2 (16.7%) |
| Total | 16 (100.0%) | 12 (100.0%) |
Health & Disability in Menoken
Health Insurance Coverage by Age in Menoken
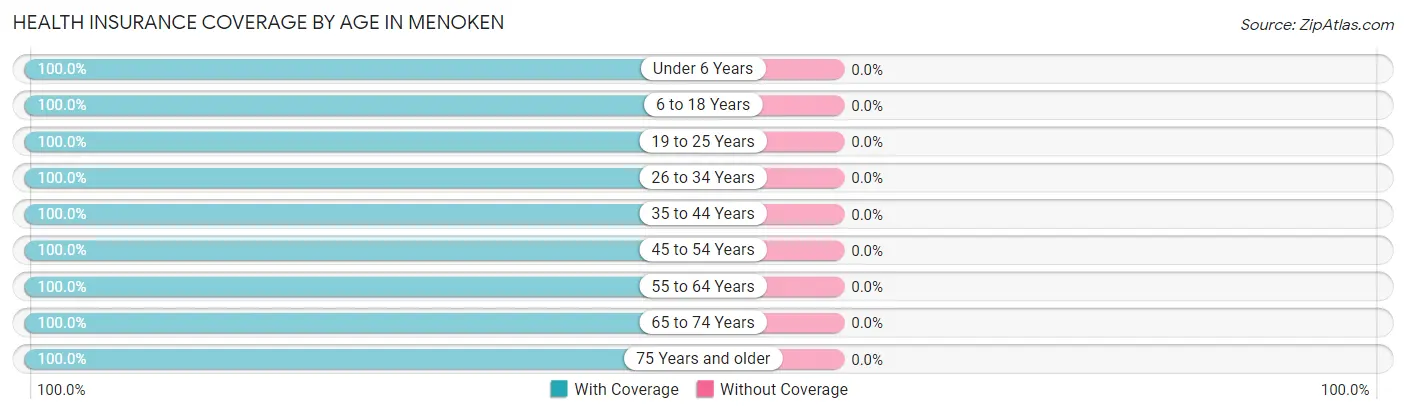
| Age Bracket | With Coverage | Without Coverage |
| Under 6 Years | 5 (100.0%) | 0 (0.0%) |
| 6 to 18 Years | 9 (100.0%) | 0 (0.0%) |
| 19 to 25 Years | 2 (100.0%) | 0 (0.0%) |
| 26 to 34 Years | 7 (100.0%) | 0 (0.0%) |
| 35 to 44 Years | 1 (100.0%) | 0 (0.0%) |
| 45 to 54 Years | 16 (100.0%) | 0 (0.0%) |
| 55 to 64 Years | 6 (100.0%) | 0 (0.0%) |
| 65 to 74 Years | 11 (100.0%) | 0 (0.0%) |
| 75 Years and older | 7 (100.0%) | 0 (0.0%) |
| Total | 64 (100.0%) | 0 (0.0%) |
Health Insurance Coverage by Citizenship Status in Menoken
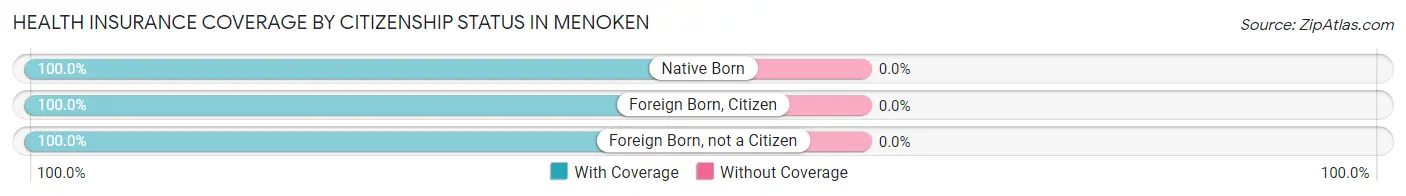
| Citizenship Status | With Coverage | Without Coverage |
| Native Born | 5 (100.0%) | 0 (0.0%) |
| Foreign Born, Citizen | 9 (100.0%) | 0 (0.0%) |
| Foreign Born, not a Citizen | 2 (100.0%) | 0 (0.0%) |
Health Insurance Coverage by Household Income in Menoken
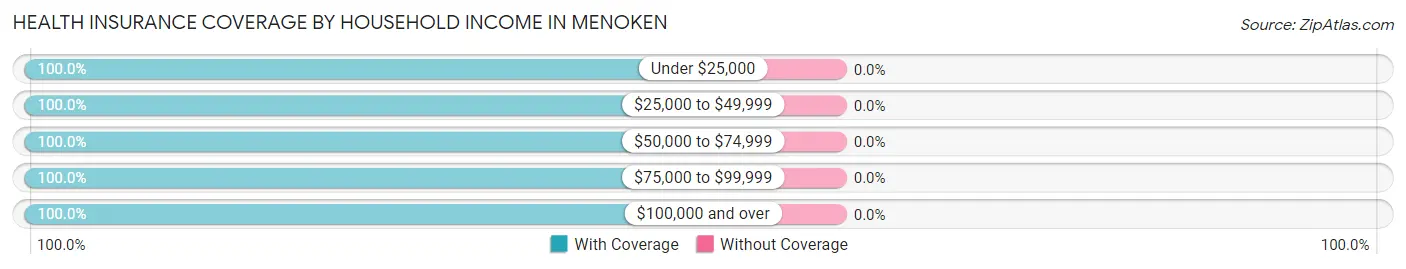
| Household Income | With Coverage | Without Coverage |
| Under $25,000 | 4 (100.0%) | 0 (0.0%) |
| $25,000 to $49,999 | 12 (100.0%) | 0 (0.0%) |
| $50,000 to $74,999 | 2 (100.0%) | 0 (0.0%) |
| $75,000 to $99,999 | 13 (100.0%) | 0 (0.0%) |
| $100,000 and over | 33 (100.0%) | 0 (0.0%) |
Public vs Private Health Insurance Coverage by Age in Menoken
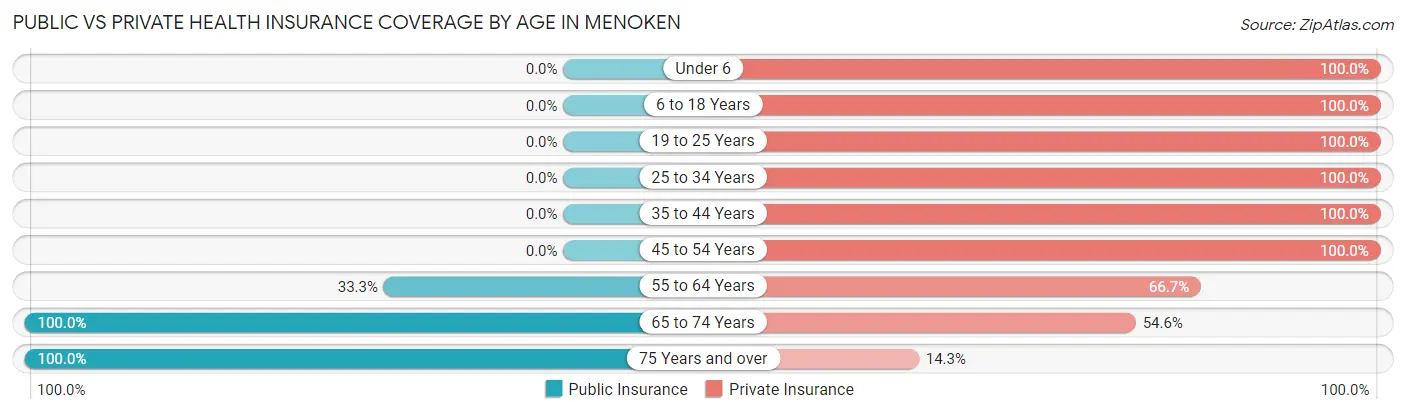
| Age Bracket | Public Insurance | Private Insurance |
| Under 6 | 0 (0.0%) | 5 (100.0%) |
| 6 to 18 Years | 0 (0.0%) | 9 (100.0%) |
| 19 to 25 Years | 0 (0.0%) | 2 (100.0%) |
| 25 to 34 Years | 0 (0.0%) | 7 (100.0%) |
| 35 to 44 Years | 0 (0.0%) | 1 (100.0%) |
| 45 to 54 Years | 0 (0.0%) | 16 (100.0%) |
| 55 to 64 Years | 2 (33.3%) | 4 (66.7%) |
| 65 to 74 Years | 11 (100.0%) | 6 (54.5%) |
| 75 Years and over | 7 (100.0%) | 1 (14.3%) |
| Total | 20 (31.2%) | 51 (79.7%) |
Disability Status by Sex by Age in Menoken
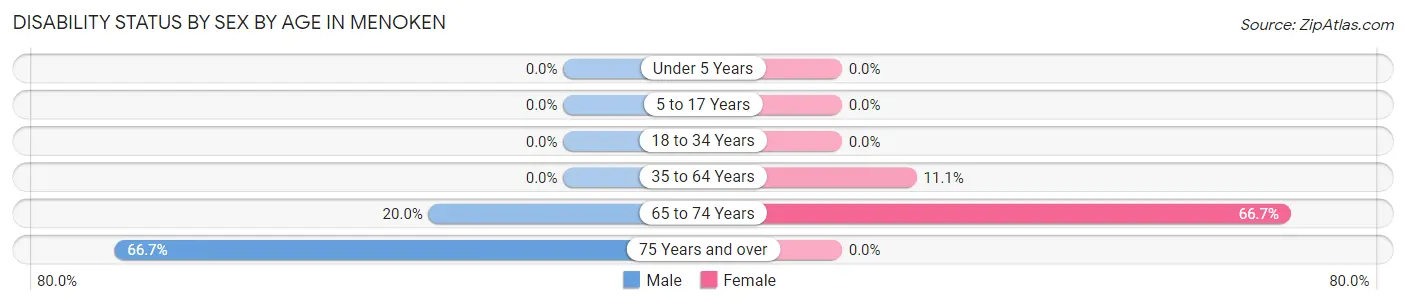
| Age Bracket | Male | Female |
| Under 5 Years | 0 (0.0%) | 0 (0.0%) |
| 5 to 17 Years | 0 (0.0%) | 0 (0.0%) |
| 18 to 34 Years | 0 (0.0%) | 0 (0.0%) |
| 35 to 64 Years | 0 (0.0%) | 1 (11.1%) |
| 65 to 74 Years | 1 (20.0%) | 4 (66.7%) |
| 75 Years and over | 2 (66.7%) | 0 (0.0%) |
Disability Class by Sex by Age in Menoken
Disability Class: Hearing Difficulty
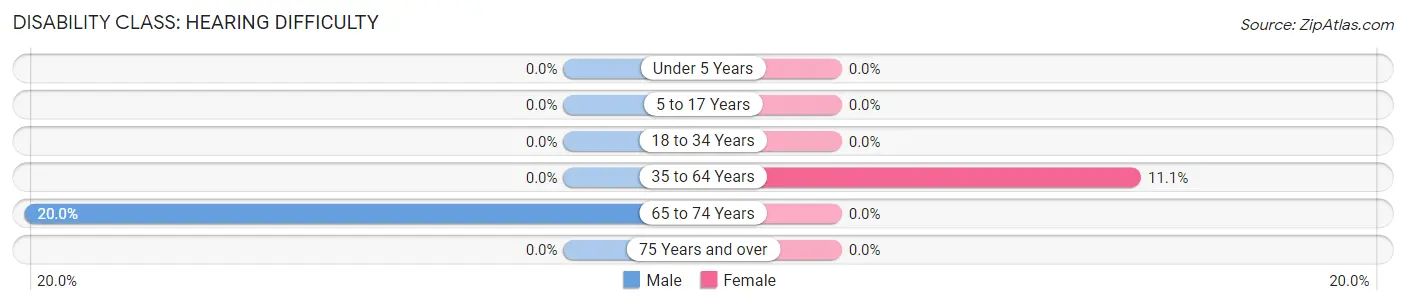
| Age Bracket | Male | Female |
| Under 5 Years | 0 (0.0%) | 0 (0.0%) |
| 5 to 17 Years | 0 (0.0%) | 0 (0.0%) |
| 18 to 34 Years | 0 (0.0%) | 0 (0.0%) |
| 35 to 64 Years | 0 (0.0%) | 1 (11.1%) |
| 65 to 74 Years | 1 (20.0%) | 0 (0.0%) |
| 75 Years and over | 0 (0.0%) | 0 (0.0%) |
Disability Class: Vision Difficulty
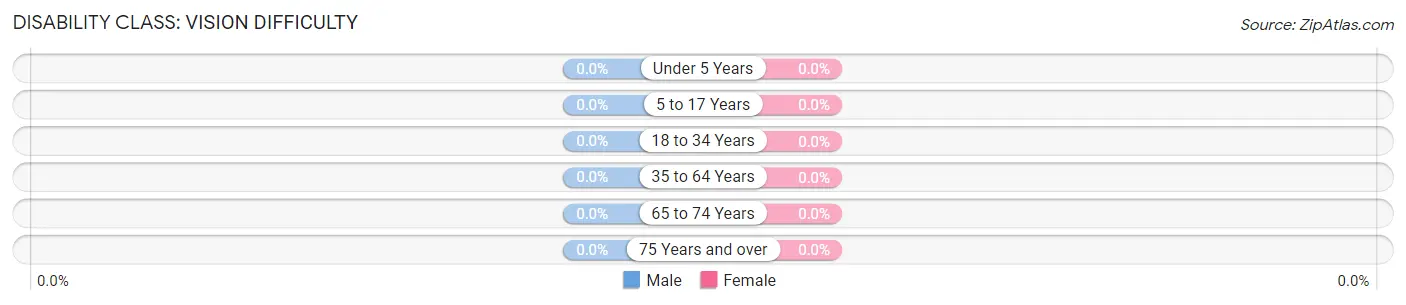
| Age Bracket | Male | Female |
| Under 5 Years | 0 (0.0%) | 0 (0.0%) |
| 5 to 17 Years | 0 (0.0%) | 0 (0.0%) |
| 18 to 34 Years | 0 (0.0%) | 0 (0.0%) |
| 35 to 64 Years | 0 (0.0%) | 0 (0.0%) |
| 65 to 74 Years | 0 (0.0%) | 0 (0.0%) |
| 75 Years and over | 0 (0.0%) | 0 (0.0%) |
Disability Class: Cognitive Difficulty
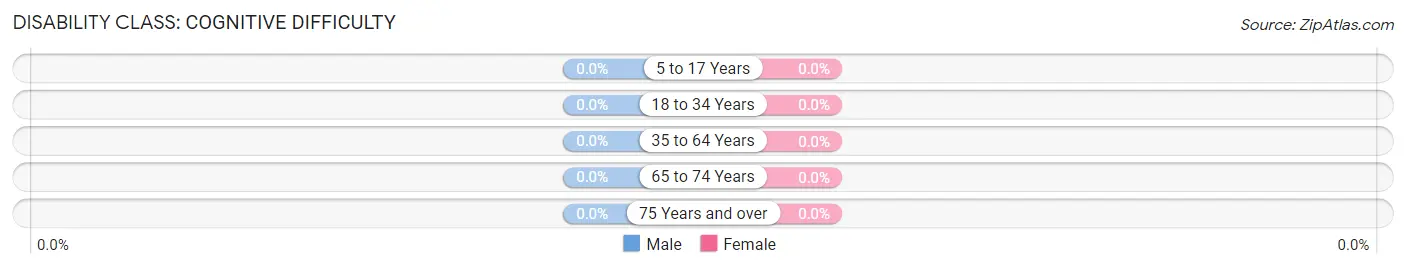
| Age Bracket | Male | Female |
| 5 to 17 Years | 0 (0.0%) | 0 (0.0%) |
| 18 to 34 Years | 0 (0.0%) | 0 (0.0%) |
| 35 to 64 Years | 0 (0.0%) | 0 (0.0%) |
| 65 to 74 Years | 0 (0.0%) | 0 (0.0%) |
| 75 Years and over | 0 (0.0%) | 0 (0.0%) |
Disability Class: Ambulatory Difficulty
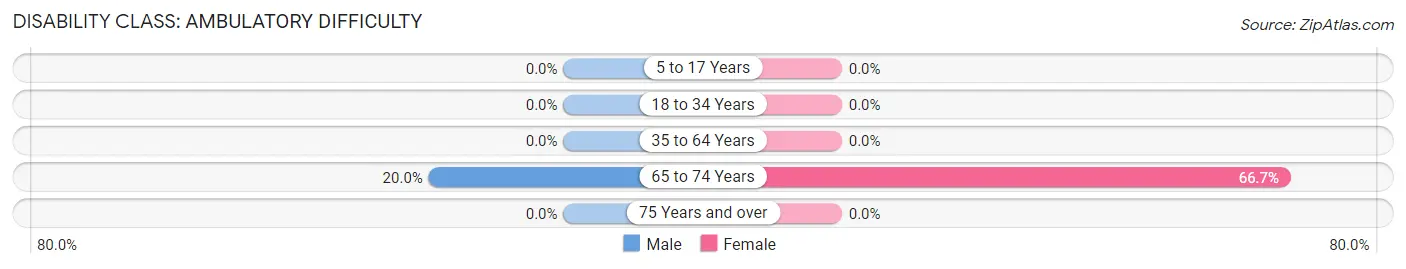
| Age Bracket | Male | Female |
| 5 to 17 Years | 0 (0.0%) | 0 (0.0%) |
| 18 to 34 Years | 0 (0.0%) | 0 (0.0%) |
| 35 to 64 Years | 0 (0.0%) | 0 (0.0%) |
| 65 to 74 Years | 1 (20.0%) | 4 (66.7%) |
| 75 Years and over | 0 (0.0%) | 0 (0.0%) |
Disability Class: Self-Care Difficulty
| Age Bracket | Male | Female |
| 5 to 17 Years | 0 (0.0%) | 0 (0.0%) |
| 18 to 34 Years | 0 (0.0%) | 0 (0.0%) |
| 35 to 64 Years | 0 (0.0%) | 0 (0.0%) |
| 65 to 74 Years | 0 (0.0%) | 0 (0.0%) |
| 75 Years and over | 0 (0.0%) | 0 (0.0%) |
Technology Access in Menoken
Computing Device Access in Menoken
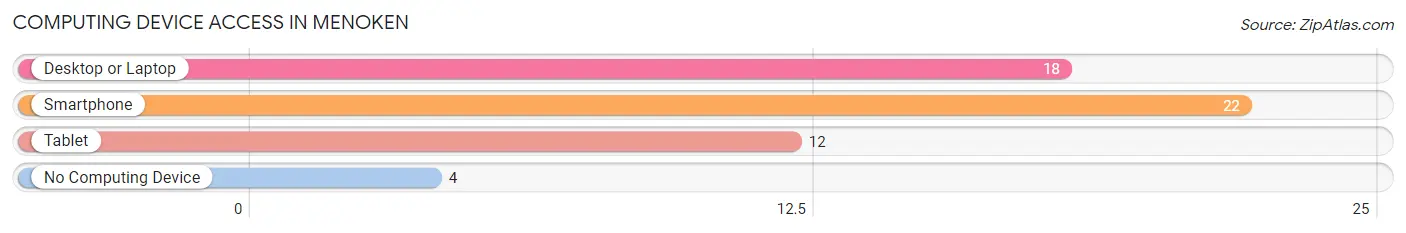
| Device Type | # Households | % Households |
| Desktop or Laptop | 18 | 62.1% |
| Smartphone | 22 | 75.9% |
| Tablet | 12 | 41.4% |
| No Computing Device | 4 | 13.8% |
| Total | 29 | 100.0% |
Internet Access in Menoken
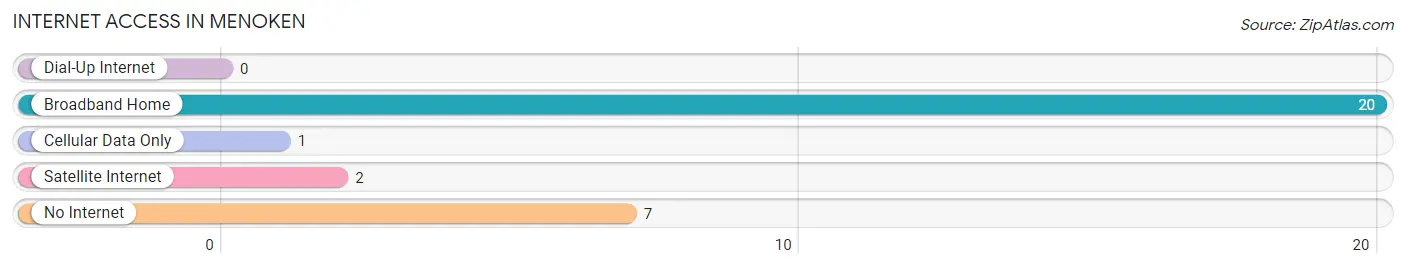
| Internet Type | # Households | % Households |
| Dial-Up Internet | 0 | 0.0% |
| Broadband Home | 20 | 69.0% |
| Cellular Data Only | 1 | 3.5% |
| Satellite Internet | 2 | 6.9% |
| No Internet | 7 | 24.1% |
| Total | 29 | 100.0% |
Menoken Summary
History
Menoken, North Dakota is a small unincorporated community located in Burleigh County, North Dakota. It is located about 10 miles south of Bismarck, the state capital. The community was founded in 1883 by German immigrants who were looking for a place to settle and farm. The town was named after the Menoken Indian tribe, which had lived in the area for centuries.
The town grew slowly but steadily over the years, and by the early 1900s it had become a thriving community. It had a post office, a general store, a blacksmith shop, a school, and several churches. The town also had a large population of German immigrants, who brought with them their culture and traditions.
In the early 1900s, Menoken was a major center for the production of wheat and other grains. The town was also home to several businesses, including a flour mill, a creamery, and a brewery. The town was also home to a number of small businesses, such as a butcher shop, a bakery, and a barber shop.
The town continued to grow and prosper until the Great Depression hit in the 1930s. Many of the businesses in Menoken closed, and the population began to decline. The town was able to survive the depression, however, and by the 1950s it had begun to recover.
In the late 1950s, the town was chosen as the site of a new state prison. The prison was built in 1959 and is still in operation today. The prison has had a major impact on the town, providing jobs and economic stability.
Geography
Menoken is located in Burleigh County, North Dakota, about 10 miles south of Bismarck, the state capital. The town is situated on the banks of the Missouri River, and is surrounded by rolling hills and prairies. The town is located in the Central Plains region of the state, and has a semi-arid climate with hot summers and cold winters.
The town covers an area of about 1.5 square miles, and has a population of about 200 people. The town is served by a single road, which connects it to Bismarck and other nearby towns.
Economy
The economy of Menoken is largely based on agriculture. The town is home to several farms, which produce wheat, corn, and other grains. The town is also home to a number of small businesses, including a butcher shop, a bakery, and a barber shop.
The town is also home to the North Dakota State Penitentiary, which provides jobs and economic stability to the town. The prison is the largest employer in the town, and provides jobs for about 200 people.
Demographics
As of the 2010 census, the population of Menoken was 200 people. The town is predominantly white, with about 95% of the population being white. The town also has a small Hispanic population, with about 5% of the population being Hispanic. The median household income in the town is about $45,000, and the median home value is about $150,000.
Common Questions
What is Per Capita Income in Menoken?
Per Capita income in Menoken is $40,414.
What is the Median Family Income in Menoken?
Median Family Income in Menoken is $98,125.
What is the Median Household income in Menoken?
Median Household Income in Menoken is $96,250.
What is Income or Wage Gap in Menoken?
Income or Wage Gap in Menoken is 23.2%.
Women in Menoken earn 76.8 cents for every dollar earned by a man.
What is Inequality or Gini Index in Menoken?
Inequality or Gini Index in Menoken is 0.40.
What is the Total Population of Menoken?
Total Population of Menoken is 64.
What is the Total Male Population of Menoken?
Total Male Population of Menoken is 33.
What is the Total Female Population of Menoken?
Total Female Population of Menoken is 31.
What is the Ratio of Males per 100 Females in Menoken?
There are 106.45 Males per 100 Females in Menoken.
What is the Ratio of Females per 100 Males in Menoken?
There are 93.94 Females per 100 Males in Menoken.
What is the Median Population Age in Menoken?
Median Population Age in Menoken is 50.5 Years.
What is the Average Family Size in Menoken
Average Family Size in Menoken is 2.9 People.
What is the Average Household Size in Menoken
Average Household Size in Menoken is 2.2 People.
How Large is the Labor Force in Menoken?
There are 35 People in the Labor Forcein in Menoken.
What is the Percentage of People in the Labor Force in Menoken?
66.0% of People are in the Labor Force in Menoken.
What is the Unemployment Rate in Menoken?
Unemployment Rate in Menoken is 2.9%.