Michigan City, ND Map & Demographics
Michigan City Map
Michigan City Overview
$39,070
PER CAPITA INCOME
$82,500
AVG FAMILY INCOME
$71,875
AVG HOUSEHOLD INCOME
3.1%
WAGE / INCOME GAP [ % ]
96.9¢/ $1
WAGE / INCOME GAP [ $ ]
0.39
INEQUALITY / GINI INDEX
312
TOTAL POPULATION
140
MALE POPULATION
172
FEMALE POPULATION
81.40
MALES / 100 FEMALES
122.86
FEMALES / 100 MALES
45.9
MEDIAN AGE
2.8
AVG FAMILY SIZE
2.1
AVG HOUSEHOLD SIZE
213
LABOR FORCE [ PEOPLE ]
75.5%
PERCENT IN LABOR FORCE
Income in Michigan City
Income Overview in Michigan City
Per Capita Income in Michigan City is $39,070, while median incomes of families and households are $82,500 and $71,875 respectively.
| Characteristic | Number | Measure |
| Per Capita Income | 312 | $39,070 |
| Median Family Income | 80 | $82,500 |
| Mean Family Income | 80 | $101,705 |
| Median Household Income | 145 | $71,875 |
| Mean Household Income | 145 | $77,268 |
| Income Deficit | 80 | $0 |
| Wage / Income Gap (%) | 312 | 3.13% |
| Wage / Income Gap ($) | 312 | 96.87¢ per $1 |
| Gini / Inequality Index | 312 | 0.39 |
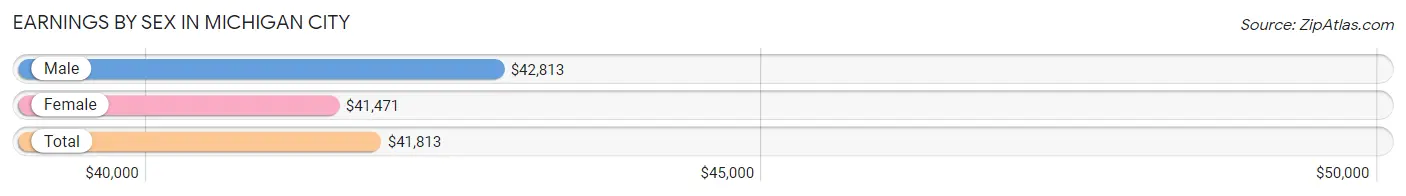
Earnings by Sex in Michigan City
Average Earnings in Michigan City are $41,813, $42,813 for men and $41,471 for women, a difference of 3.1%.
| Sex | Number | Average Earnings |
| Male | 107 (49.3%) | $42,813 |
| Female | 110 (50.7%) | $41,471 |
| Total | 217 (100.0%) | $41,813 |
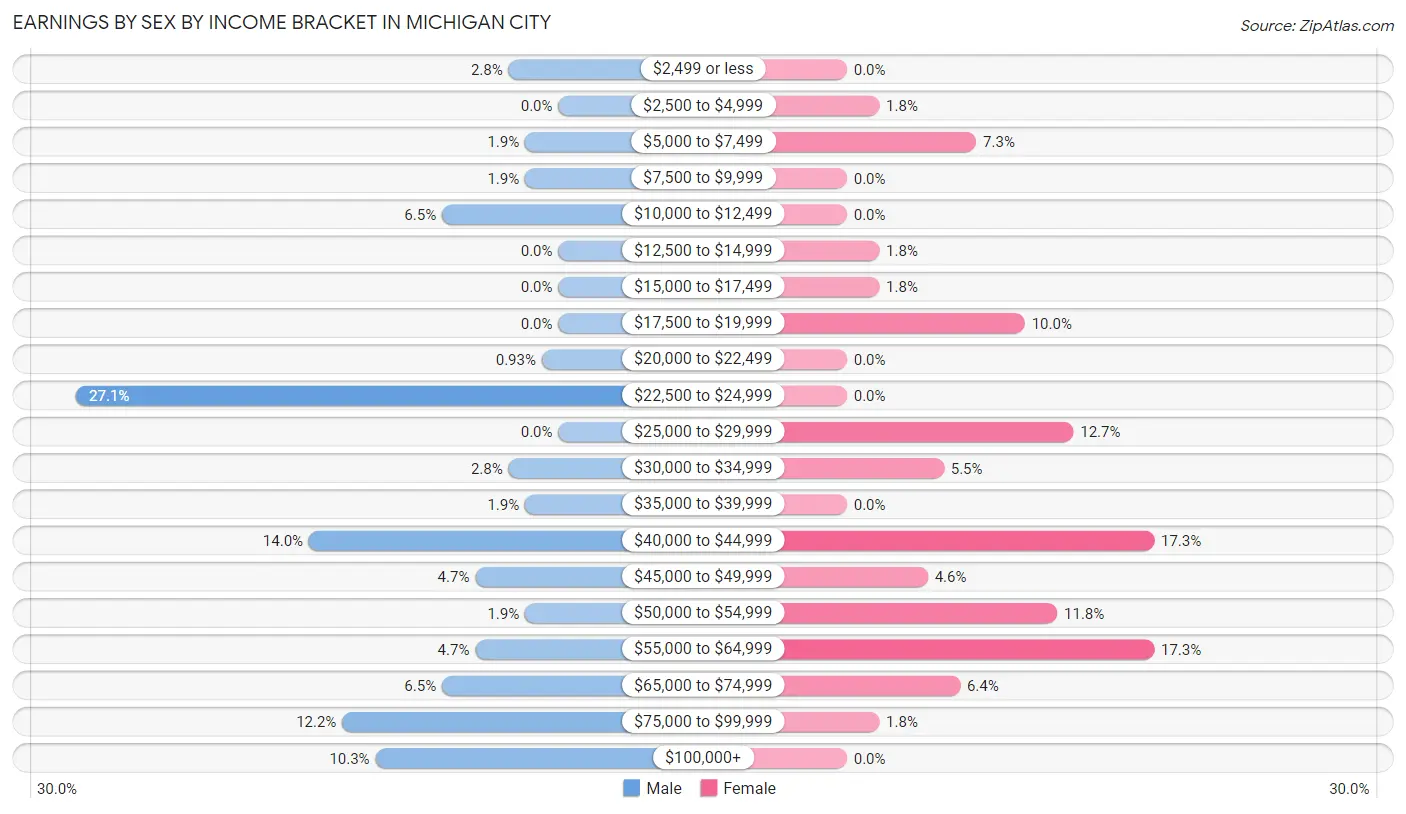
Earnings by Sex by Income Bracket in Michigan City
The most common earnings brackets in Michigan City are $22,500 to $24,999 for men (29 | 27.1%) and $40,000 to $44,999 for women (19 | 17.3%).
| Income | Male | Female |
| $2,499 or less | 3 (2.8%) | 0 (0.0%) |
| $2,500 to $4,999 | 0 (0.0%) | 2 (1.8%) |
| $5,000 to $7,499 | 2 (1.9%) | 8 (7.3%) |
| $7,500 to $9,999 | 2 (1.9%) | 0 (0.0%) |
| $10,000 to $12,499 | 7 (6.5%) | 0 (0.0%) |
| $12,500 to $14,999 | 0 (0.0%) | 2 (1.8%) |
| $15,000 to $17,499 | 0 (0.0%) | 2 (1.8%) |
| $17,500 to $19,999 | 0 (0.0%) | 11 (10.0%) |
| $20,000 to $22,499 | 1 (0.9%) | 0 (0.0%) |
| $22,500 to $24,999 | 29 (27.1%) | 0 (0.0%) |
| $25,000 to $29,999 | 0 (0.0%) | 14 (12.7%) |
| $30,000 to $34,999 | 3 (2.8%) | 6 (5.4%) |
| $35,000 to $39,999 | 2 (1.9%) | 0 (0.0%) |
| $40,000 to $44,999 | 15 (14.0%) | 19 (17.3%) |
| $45,000 to $49,999 | 5 (4.7%) | 5 (4.5%) |
| $50,000 to $54,999 | 2 (1.9%) | 13 (11.8%) |
| $55,000 to $64,999 | 5 (4.7%) | 19 (17.3%) |
| $65,000 to $74,999 | 7 (6.5%) | 7 (6.4%) |
| $75,000 to $99,999 | 13 (12.1%) | 2 (1.8%) |
| $100,000+ | 11 (10.3%) | 0 (0.0%) |
| Total | 107 (100.0%) | 110 (100.0%) |
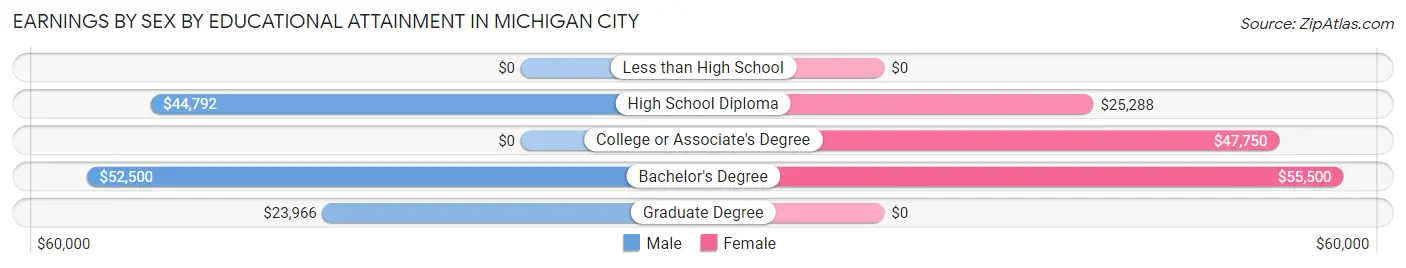
Earnings by Sex by Educational Attainment in Michigan City
Average earnings in Michigan City are $43,021 for men and $42,132 for women, a difference of 2.1%. Men with an educational attainment of bachelor's degree enjoy the highest average annual earnings of $52,500, while those with graduate degree education earn the least with $23,966. Women with an educational attainment of bachelor's degree earn the most with the average annual earnings of $55,500, while those with high school diploma education have the smallest earnings of $25,288.
| Educational Attainment | Male Income | Female Income |
| Less than High School | - | - |
| High School Diploma | $44,792 | $25,288 |
| College or Associate's Degree | - | - |
| Bachelor's Degree | $52,500 | $55,500 |
| Graduate Degree | $23,966 | $0 |
| Total | $43,021 | $42,132 |
Family Income in Michigan City
Family Income Brackets in Michigan City
According to the Michigan City family income data, there are 27 families falling into the $50,000 to $74,999 income range, which is the most common income bracket and makes up 33.8% of all families.
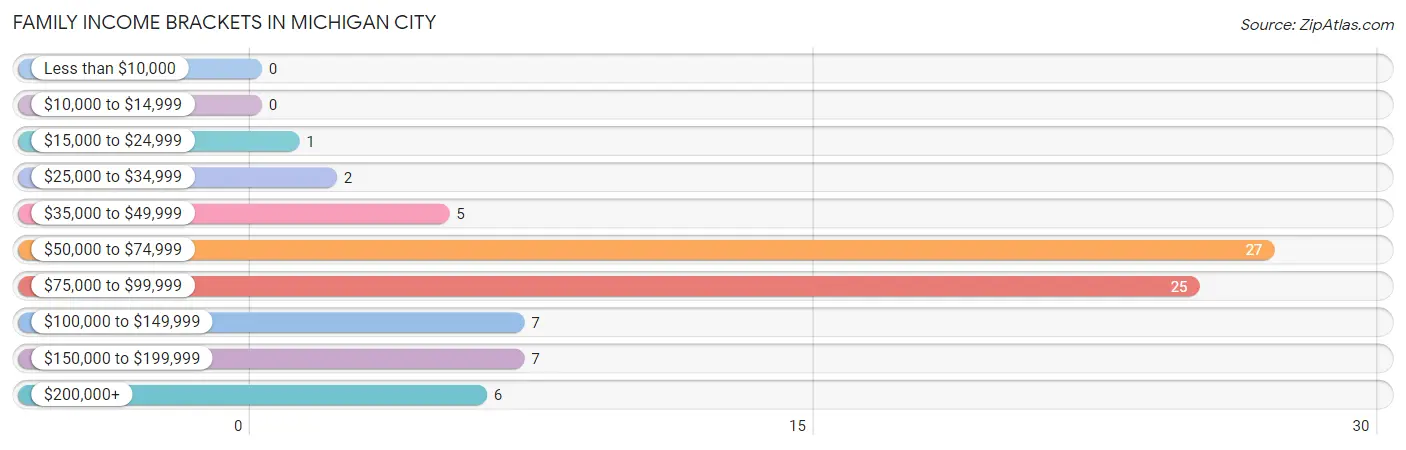
| Income Bracket | # Families | % Families |
| Less than $10,000 | 0 | 0.0% |
| $10,000 to $14,999 | 0 | 0.0% |
| $15,000 to $24,999 | 1 | 1.3% |
| $25,000 to $34,999 | 2 | 2.5% |
| $35,000 to $49,999 | 5 | 6.3% |
| $50,000 to $74,999 | 27 | 33.8% |
| $75,000 to $99,999 | 25 | 31.3% |
| $100,000 to $149,999 | 7 | 8.8% |
| $150,000 to $199,999 | 7 | 8.8% |
| $200,000+ | 6 | 7.5% |
Family Income by Famaliy Size in Michigan City
3-person families (7 | 8.7%) account for the highest median family income in Michigan City with $106,250 per family, while 2-person families (61 | 76.2%) have the highest median income of $37,383 per family member.
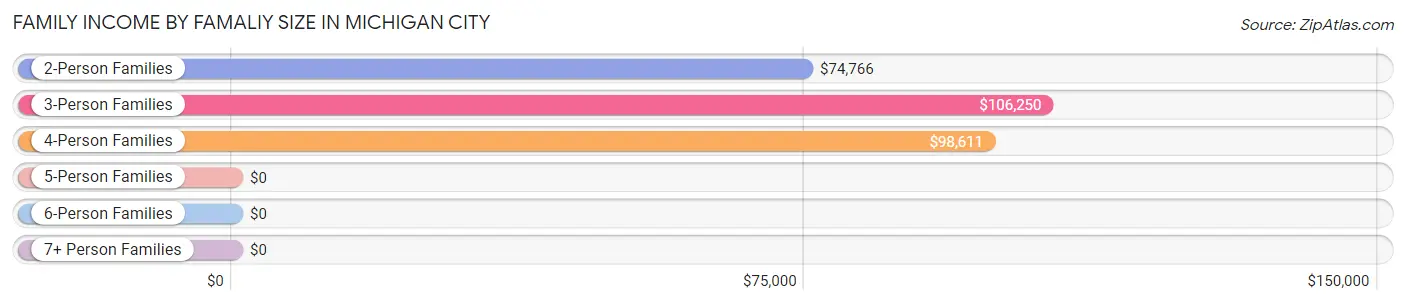
| Income Bracket | # Families | Median Income |
| 2-Person Families | 61 (76.2%) | $74,766 |
| 3-Person Families | 7 (8.7%) | $106,250 |
| 4-Person Families | 10 (12.5%) | $98,611 |
| 5-Person Families | 0 (0.0%) | $0 |
| 6-Person Families | 2 (2.5%) | $0 |
| 7+ Person Families | 0 (0.0%) | $0 |
| Total | 80 (100.0%) | $82,500 |
Family Income by Number of Earners in Michigan City
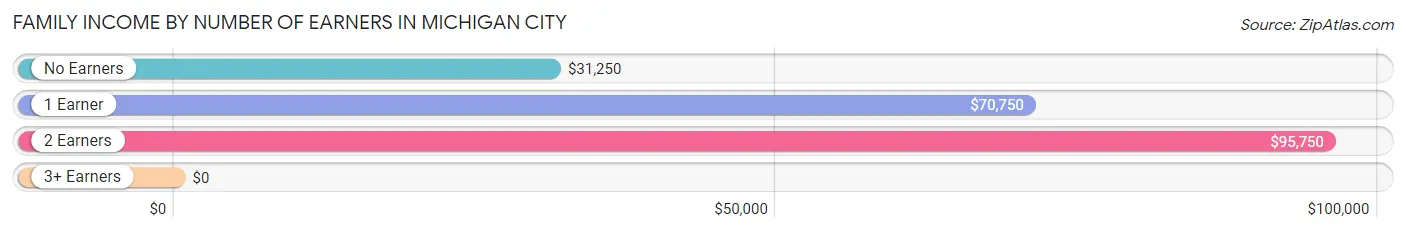
| Number of Earners | # Families | Median Income |
| No Earners | 4 (5.0%) | $31,250 |
| 1 Earner | 11 (13.8%) | $70,750 |
| 2 Earners | 65 (81.2%) | $95,750 |
| 3+ Earners | 0 (0.0%) | $0 |
| Total | 80 (100.0%) | $82,500 |
Household Income in Michigan City
Household Income Brackets in Michigan City
With 35 households falling in the category, the $75,000 to $99,999 income range is the most frequent in Michigan City, accounting for 24.1% of all households. In contrast, only 4 households (2.8%) fall into the less than $10,000 income bracket, making it the least populous group.
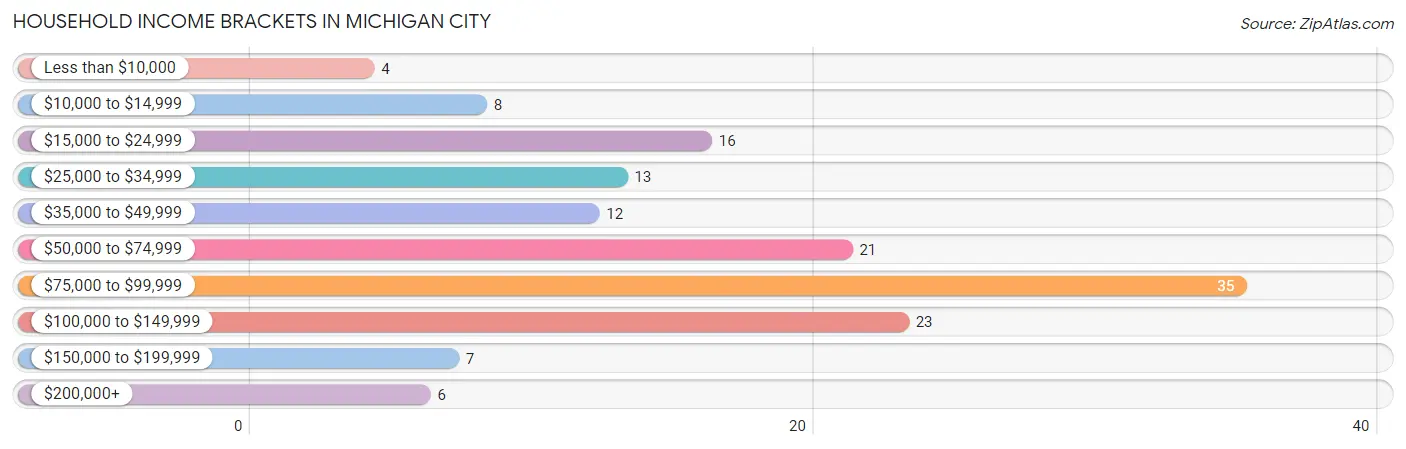
| Income Bracket | # Households | % Households |
| Less than $10,000 | 4 | 2.8% |
| $10,000 to $14,999 | 8 | 5.5% |
| $15,000 to $24,999 | 16 | 11.0% |
| $25,000 to $34,999 | 13 | 9.0% |
| $35,000 to $49,999 | 12 | 8.3% |
| $50,000 to $74,999 | 21 | 14.5% |
| $75,000 to $99,999 | 35 | 24.1% |
| $100,000 to $149,999 | 23 | 15.9% |
| $150,000 to $199,999 | 7 | 4.8% |
| $200,000+ | 6 | 4.1% |
Household Income by Householder Age in Michigan City
The median household income in Michigan City is $71,875, with the highest median household income of $107,083 found in the 25 to 44 years age bracket for the primary householder. A total of 37 households (25.5%) fall into this category. Meanwhile, the 15 to 24 years age bracket for the primary householder has the lowest median household income of $0, with 9 households (6.2%) in this group.
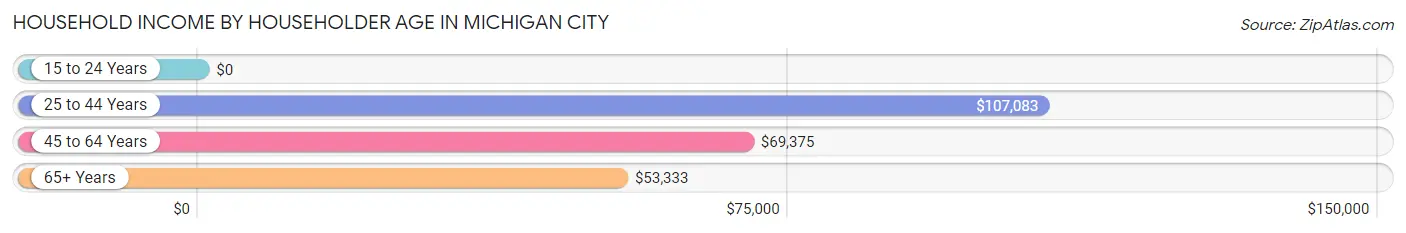
| Income Bracket | # Households | Median Income |
| 15 to 24 Years | 9 (6.2%) | $0 |
| 25 to 44 Years | 37 (25.5%) | $107,083 |
| 45 to 64 Years | 57 (39.3%) | $69,375 |
| 65+ Years | 42 (29.0%) | $53,333 |
| Total | 145 (100.0%) | $71,875 |
Poverty in Michigan City
Income Below Poverty by Sex and Age in Michigan City
With 1.4% poverty level for males and 7.6% for females among the residents of Michigan City, 15 year old males and 75 year old and over females are the most vulnerable to poverty, with 1 males (100.0%) and 6 females (50.0%) in their respective age groups living below the poverty level.
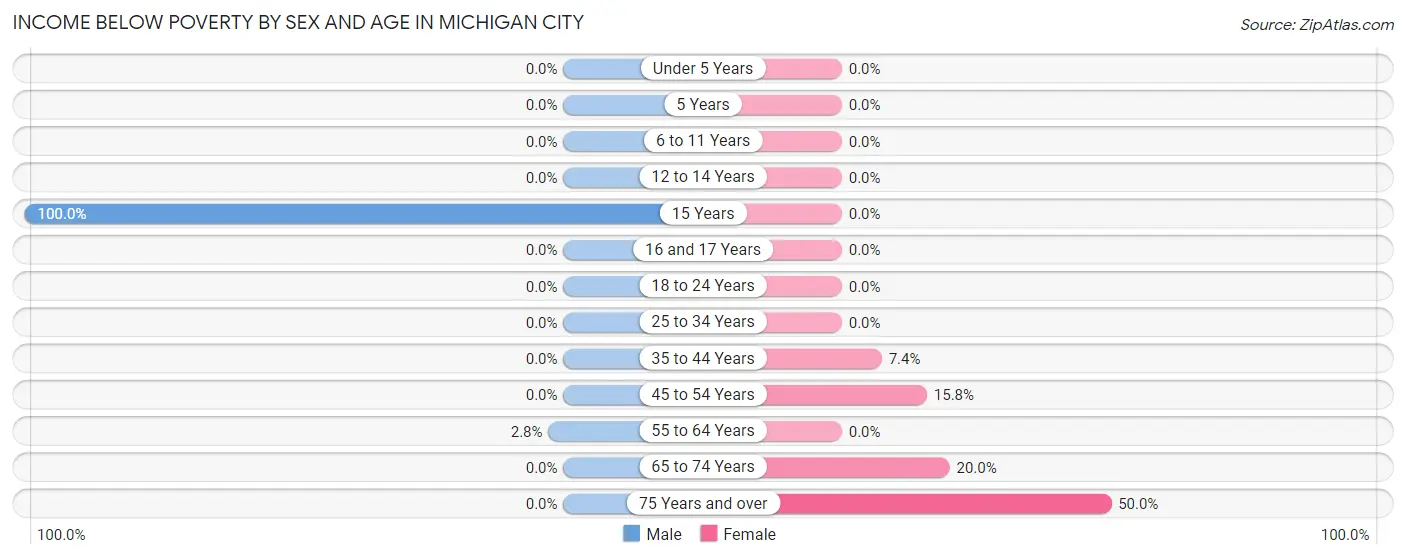
| Age Bracket | Male | Female |
| Under 5 Years | 0 (0.0%) | 0 (0.0%) |
| 5 Years | 0 (0.0%) | 0 (0.0%) |
| 6 to 11 Years | 0 (0.0%) | 0 (0.0%) |
| 12 to 14 Years | 0 (0.0%) | 0 (0.0%) |
| 15 Years | 1 (100.0%) | 0 (0.0%) |
| 16 and 17 Years | 0 (0.0%) | 0 (0.0%) |
| 18 to 24 Years | 0 (0.0%) | 0 (0.0%) |
| 25 to 34 Years | 0 (0.0%) | 0 (0.0%) |
| 35 to 44 Years | 0 (0.0%) | 2 (7.4%) |
| 45 to 54 Years | 0 (0.0%) | 3 (15.8%) |
| 55 to 64 Years | 1 (2.8%) | 0 (0.0%) |
| 65 to 74 Years | 0 (0.0%) | 2 (20.0%) |
| 75 Years and over | 0 (0.0%) | 6 (50.0%) |
| Total | 2 (1.4%) | 13 (7.6%) |
Income Above Poverty by Sex and Age in Michigan City
According to the poverty statistics in Michigan City, males aged under 5 years and females aged 6 to 11 years are the age groups that are most secure financially, with 100.0% of males and 100.0% of females in these age groups living above the poverty line.
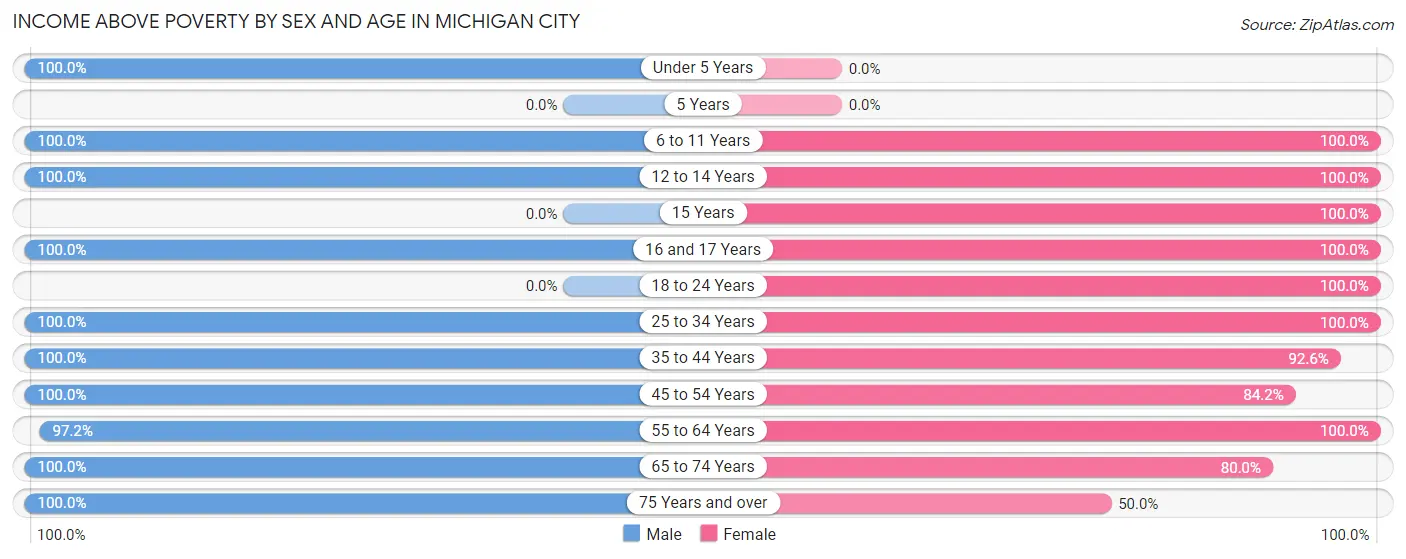
| Age Bracket | Male | Female |
| Under 5 Years | 2 (100.0%) | 0 (0.0%) |
| 5 Years | 0 (0.0%) | 0 (0.0%) |
| 6 to 11 Years | 4 (100.0%) | 4 (100.0%) |
| 12 to 14 Years | 3 (100.0%) | 3 (100.0%) |
| 15 Years | 0 (0.0%) | 13 (100.0%) |
| 16 and 17 Years | 2 (100.0%) | 14 (100.0%) |
| 18 to 24 Years | 0 (0.0%) | 9 (100.0%) |
| 25 to 34 Years | 31 (100.0%) | 11 (100.0%) |
| 35 to 44 Years | 17 (100.0%) | 25 (92.6%) |
| 45 to 54 Years | 15 (100.0%) | 16 (84.2%) |
| 55 to 64 Years | 35 (97.2%) | 50 (100.0%) |
| 65 to 74 Years | 23 (100.0%) | 8 (80.0%) |
| 75 Years and over | 6 (100.0%) | 6 (50.0%) |
| Total | 138 (98.6%) | 159 (92.4%) |
Income Below Poverty Among Married-Couple Families in Michigan City
The poverty statistics for married-couple families in Michigan City show that 1.6% or 1 of the total 61 families live below the poverty line. Families with 1 or 2 children have the highest poverty rate of 6.2%, comprising of 1 families. On the other hand, families with no children have the lowest poverty rate of 0.0%, which includes 0 families.
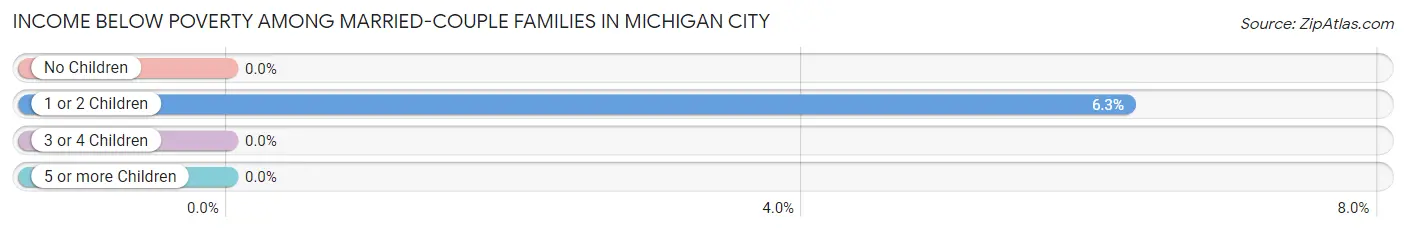
| Children | Above Poverty | Below Poverty |
| No Children | 43 (100.0%) | 0 (0.0%) |
| 1 or 2 Children | 15 (93.8%) | 1 (6.2%) |
| 3 or 4 Children | 2 (100.0%) | 0 (0.0%) |
| 5 or more Children | 0 (0.0%) | 0 (0.0%) |
| Total | 60 (98.4%) | 1 (1.6%) |
Income Below Poverty Among Single-Parent Households in Michigan City
| Children | Single Father | Single Mother |
| No Children | 0 (0.0%) | 0 (0.0%) |
| 1 or 2 Children | 0 (0.0%) | 0 (0.0%) |
| 3 or 4 Children | 0 (0.0%) | 0 (0.0%) |
| 5 or more Children | 0 (0.0%) | 0 (0.0%) |
| Total | 0 (0.0%) | 0 (0.0%) |
Income Below Poverty Among Married-Couple vs Single-Parent Households in Michigan City
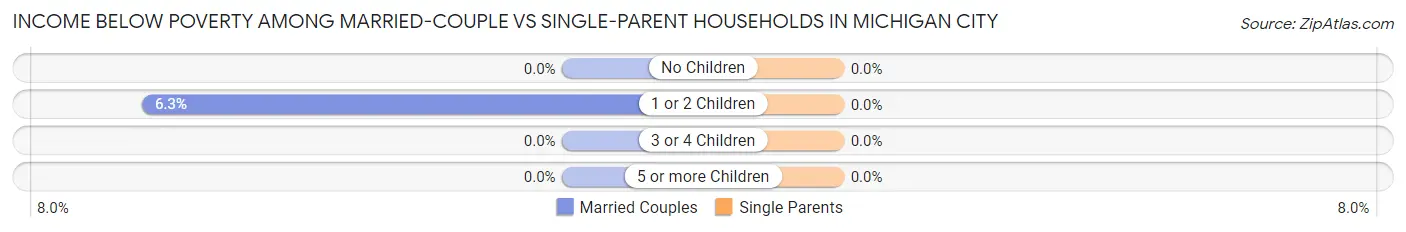
| Children | Married-Couple Families | Single-Parent Households |
| No Children | 0 (0.0%) | 0 (0.0%) |
| 1 or 2 Children | 1 (6.2%) | 0 (0.0%) |
| 3 or 4 Children | 0 (0.0%) | 0 (0.0%) |
| 5 or more Children | 0 (0.0%) | 0 (0.0%) |
| Total | 1 (1.6%) | 0 (0.0%) |
Race in Michigan City
The most populous races in Michigan City are White / Caucasian (254 | 81.4%), Hispanic or Latino (33 | 10.6%), and Two or more Races (33 | 10.6%).
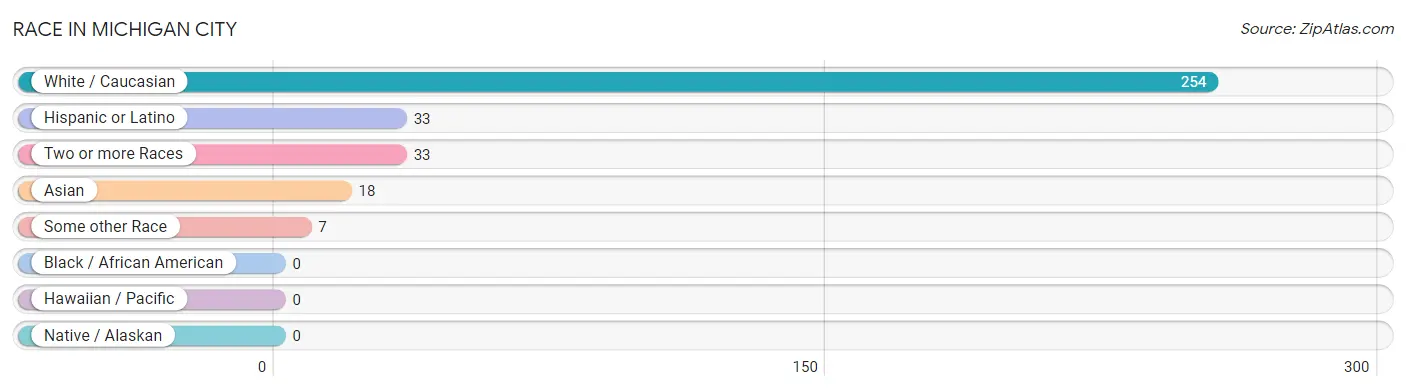
| Race | # Population | % Population |
| Asian | 18 | 5.8% |
| Black / African American | 0 | 0.0% |
| Hawaiian / Pacific | 0 | 0.0% |
| Hispanic or Latino | 33 | 10.6% |
| Native / Alaskan | 0 | 0.0% |
| White / Caucasian | 254 | 81.4% |
| Two or more Races | 33 | 10.6% |
| Some other Race | 7 | 2.2% |
| Total | 312 | 100.0% |
Ancestry in Michigan City
The most populous ancestries reported in Michigan City are Norwegian (82 | 26.3%), German (68 | 21.8%), Mexican (33 | 10.6%), Irish (30 | 9.6%), and British (25 | 8.0%), together accounting for 76.3% of all Michigan City residents.
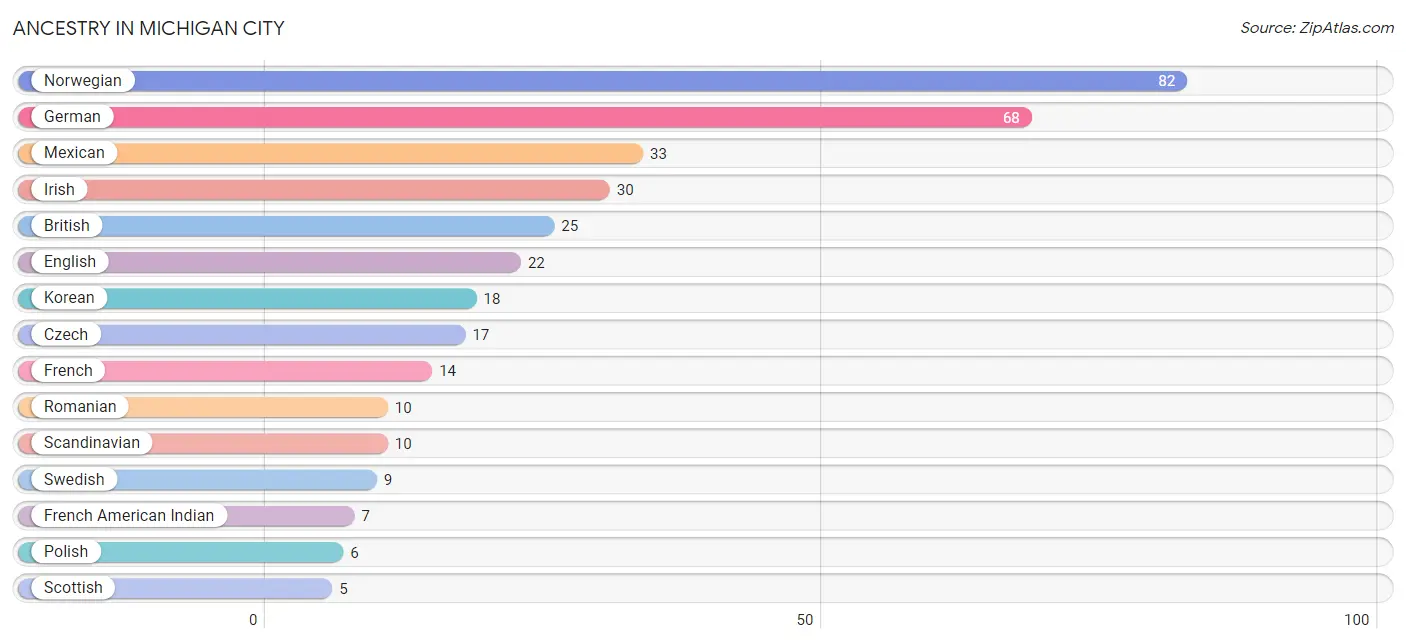
| Ancestry | # Population | % Population |
| American | 1 | 0.3% |
| British | 25 | 8.0% |
| Czech | 17 | 5.4% |
| English | 22 | 7.0% |
| Finnish | 2 | 0.6% |
| French | 14 | 4.5% |
| French American Indian | 7 | 2.2% |
| French Canadian | 4 | 1.3% |
| German | 68 | 21.8% |
| Irish | 30 | 9.6% |
| Korean | 18 | 5.8% |
| Mexican | 33 | 10.6% |
| Norwegian | 82 | 26.3% |
| Polish | 6 | 1.9% |
| Romanian | 10 | 3.2% |
| Scandinavian | 10 | 3.2% |
| Scottish | 5 | 1.6% |
| Swedish | 9 | 2.9% | View All 18 Rows |
Immigrants in Michigan City
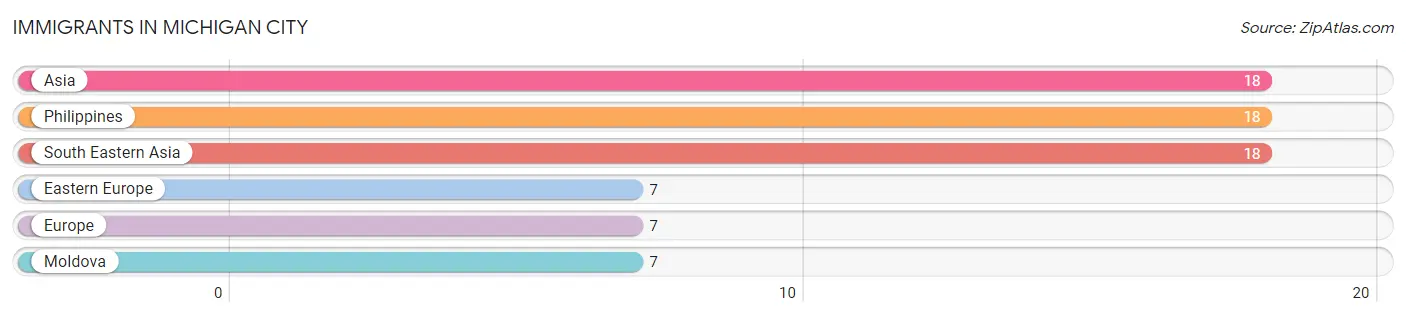
The most numerous immigrant groups reported in Michigan City came from Asia (18 | 5.8%), Philippines (18 | 5.8%), South Eastern Asia (18 | 5.8%), Eastern Europe (7 | 2.2%), and Europe (7 | 2.2%), together accounting for 21.8% of all Michigan City residents.
| Immigration Origin | # Population | % Population |
| Asia | 18 | 5.8% |
| Eastern Europe | 7 | 2.2% |
| Europe | 7 | 2.2% |
| Moldova | 7 | 2.2% |
| Philippines | 18 | 5.8% |
| South Eastern Asia | 18 | 5.8% | View All 6 Rows |
Sex and Age in Michigan City
Sex and Age in Michigan City
The most populous age groups in Michigan City are 25 to 29 Years (29 | 20.7%) for men and 60 to 64 Years (32 | 18.6%) for women.
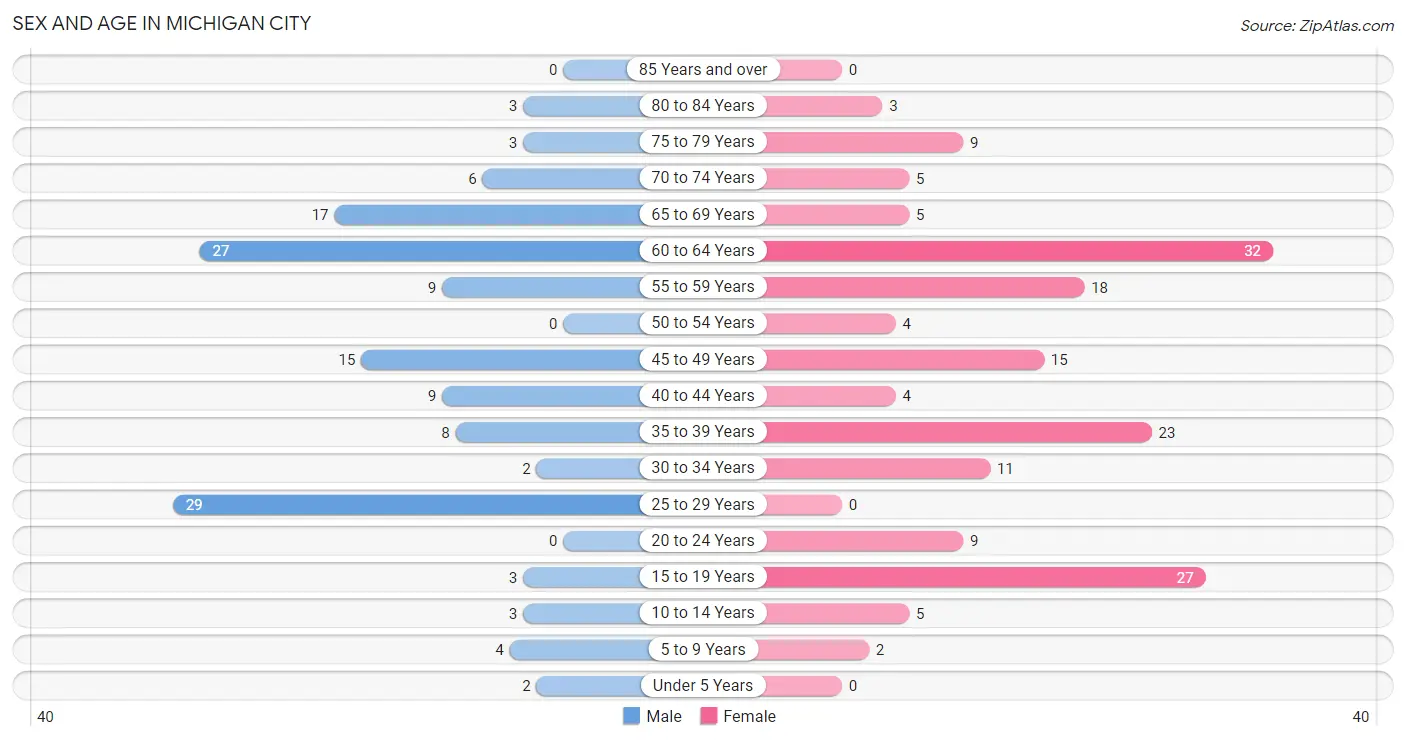
| Age Bracket | Male | Female |
| Under 5 Years | 2 (1.4%) | 0 (0.0%) |
| 5 to 9 Years | 4 (2.9%) | 2 (1.2%) |
| 10 to 14 Years | 3 (2.1%) | 5 (2.9%) |
| 15 to 19 Years | 3 (2.1%) | 27 (15.7%) |
| 20 to 24 Years | 0 (0.0%) | 9 (5.2%) |
| 25 to 29 Years | 29 (20.7%) | 0 (0.0%) |
| 30 to 34 Years | 2 (1.4%) | 11 (6.4%) |
| 35 to 39 Years | 8 (5.7%) | 23 (13.4%) |
| 40 to 44 Years | 9 (6.4%) | 4 (2.3%) |
| 45 to 49 Years | 15 (10.7%) | 15 (8.7%) |
| 50 to 54 Years | 0 (0.0%) | 4 (2.3%) |
| 55 to 59 Years | 9 (6.4%) | 18 (10.5%) |
| 60 to 64 Years | 27 (19.3%) | 32 (18.6%) |
| 65 to 69 Years | 17 (12.1%) | 5 (2.9%) |
| 70 to 74 Years | 6 (4.3%) | 5 (2.9%) |
| 75 to 79 Years | 3 (2.1%) | 9 (5.2%) |
| 80 to 84 Years | 3 (2.1%) | 3 (1.7%) |
| 85 Years and over | 0 (0.0%) | 0 (0.0%) |
| Total | 140 (100.0%) | 172 (100.0%) |
Families and Households in Michigan City
Median Family Size in Michigan City
The median family size in Michigan City is 2.83 persons per family, with single female/mother families (17 | 21.2%) accounting for the largest median family size of 2.88 persons per family. On the other hand, single male/father families (2 | 2.5%) represent the smallest median family size with 1.50 persons per family.
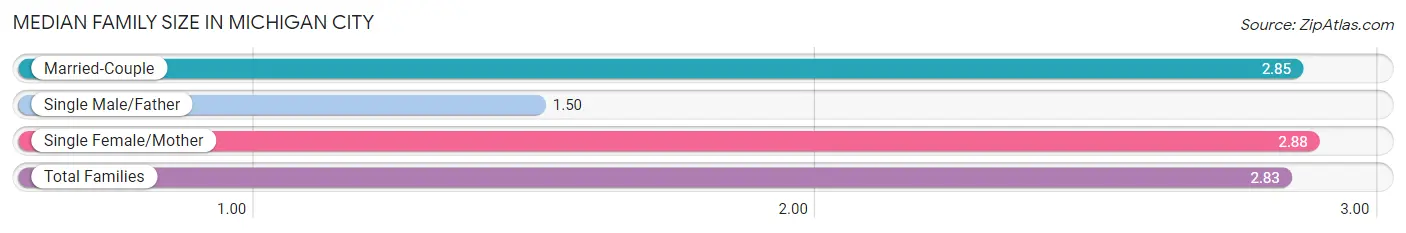
| Family Type | # Families | Family Size |
| Married-Couple | 61 (76.2%) | 2.85 |
| Single Male/Father | 2 (2.5%) | 1.50 |
| Single Female/Mother | 17 (21.2%) | 2.88 |
| Total Families | 80 (100.0%) | 2.83 |
Median Household Size in Michigan City
The median household size in Michigan City is 2.15 persons per household, with single female/mother households (17 | 11.7%) accounting for the largest median household size of 3.59 persons per household. non-family households (65 | 44.8%) represent the smallest median household size with 1.14 persons per household.
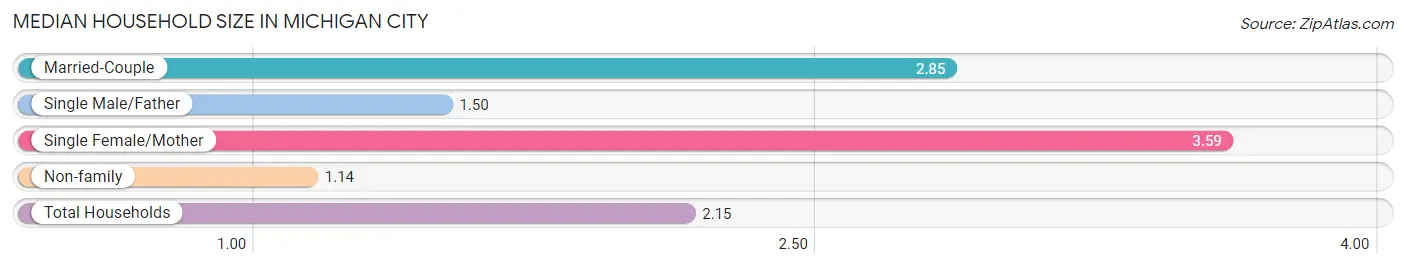
| Household Type | # Households | Household Size |
| Married-Couple | 61 (42.1%) | 2.85 |
| Single Male/Father | 2 (1.4%) | 1.50 |
| Single Female/Mother | 17 (11.7%) | 3.59 |
| Non-family | 65 (44.8%) | 1.14 |
| Total Households | 145 (100.0%) | 2.15 |
Household Size by Marriage Status in Michigan City
Out of a total of 145 households in Michigan City, 80 (55.2%) are family households, while 65 (44.8%) are nonfamily households. The most numerous type of family households are 2-person households, comprising 45, and the most common type of nonfamily households are 1-person households, comprising 60.
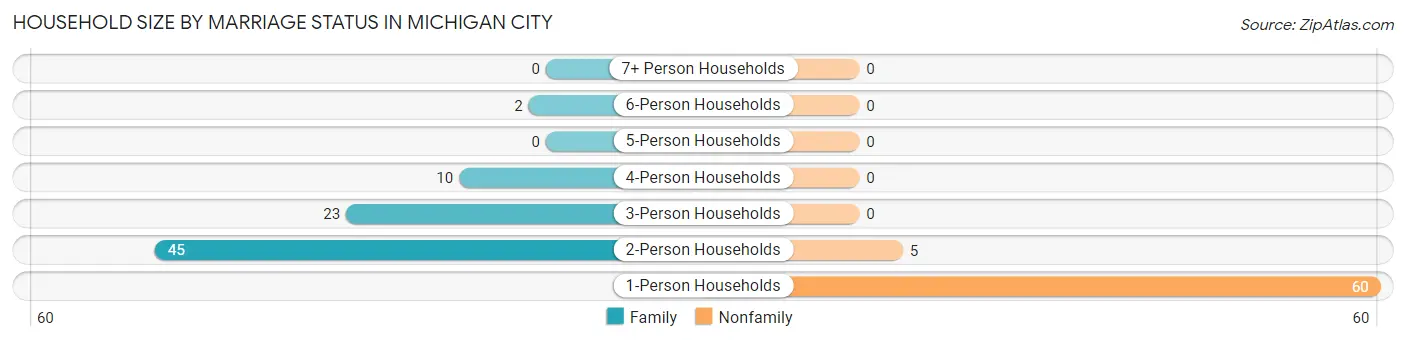
| Household Size | Family Households | Nonfamily Households |
| 1-Person Households | - | 60 (41.4%) |
| 2-Person Households | 45 (31.0%) | 5 (3.5%) |
| 3-Person Households | 23 (15.9%) | 0 (0.0%) |
| 4-Person Households | 10 (6.9%) | 0 (0.0%) |
| 5-Person Households | 0 (0.0%) | 0 (0.0%) |
| 6-Person Households | 2 (1.4%) | 0 (0.0%) |
| 7+ Person Households | 0 (0.0%) | 0 (0.0%) |
| Total | 80 (55.2%) | 65 (44.8%) |
Female Fertility in Michigan City
Fertility by Age in Michigan City
| Age Bracket | Women with Births | Births / 1,000 Women |
| 15 to 19 years | 0 (0.0%) | 0.0 |
| 20 to 34 years | 0 (0.0%) | 0.0 |
| 35 to 50 years | 0 (0.0%) | 0.0 |
| Total | 0 (0.0%) | 0.0 |
Fertility by Age by Marriage Status in Michigan City
| Age Bracket | Married | Unmarried |
| 15 to 19 years | 0 (0.0%) | 0 (0.0%) |
| 20 to 34 years | 0 (0.0%) | 0 (0.0%) |
| 35 to 50 years | 0 (0.0%) | 0 (0.0%) |
| Total | 0 (0.0%) | 0 (0.0%) |
Fertility by Education in Michigan City
| Educational Attainment | Women with Births | Births / 1,000 Women |
| Less than High School | 0 (0.0%) | 0.0 |
| High School Diploma | 0 (0.0%) | 0.0 |
| College or Associate's Degree | 0 (0.0%) | 0.0 |
| Bachelor's Degree | 0 (0.0%) | 0.0 |
| Graduate Degree | 0 (0.0%) | 0.0 |
| Total | 0 (0.0%) | 0.0 |
Fertility by Education by Marriage Status in Michigan City
| Educational Attainment | Married | Unmarried |
| Less than High School | 0 (0.0%) | 0 (0.0%) |
| High School Diploma | 0 (0.0%) | 0 (0.0%) |
| College or Associate's Degree | 0 (0.0%) | 0 (0.0%) |
| Bachelor's Degree | 0 (0.0%) | 0 (0.0%) |
| Graduate Degree | 0 (0.0%) | 0 (0.0%) |
| Total | 0 (0.0%) | 0 (0.0%) |
Employment Characteristics in Michigan City
Employment by Class of Employer in Michigan City
Among the 210 employed individuals in Michigan City, private company employees (162 | 77.1%), self-employed (not incorporated) (12 | 5.7%), and state government employees (12 | 5.7%) make up the most common classes of employment.
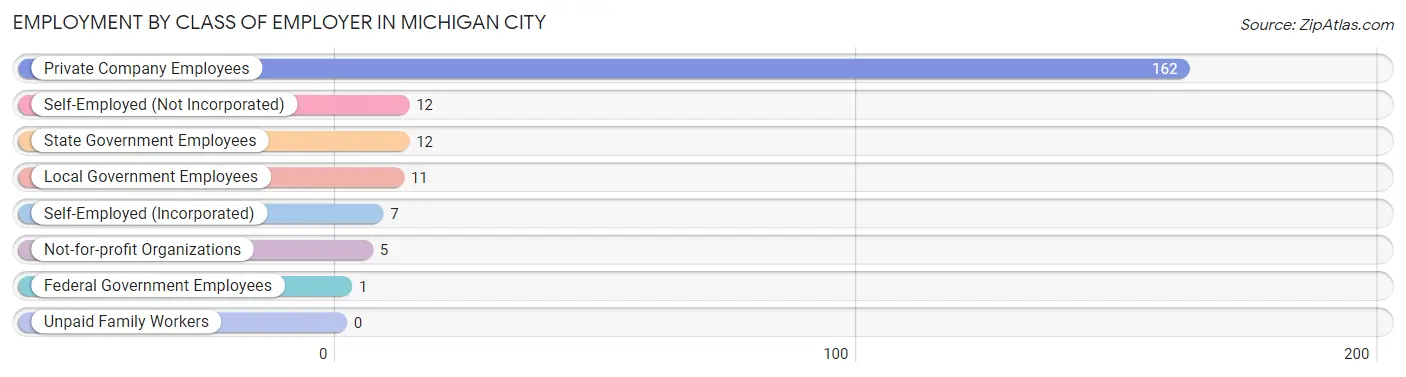
| Employer Class | # Employees | % Employees |
| Private Company Employees | 162 | 77.1% |
| Self-Employed (Incorporated) | 7 | 3.3% |
| Self-Employed (Not Incorporated) | 12 | 5.7% |
| Not-for-profit Organizations | 5 | 2.4% |
| Local Government Employees | 11 | 5.2% |
| State Government Employees | 12 | 5.7% |
| Federal Government Employees | 1 | 0.5% |
| Unpaid Family Workers | 0 | 0.0% |
| Total | 210 | 100.0% |
Employment Status by Age in Michigan City
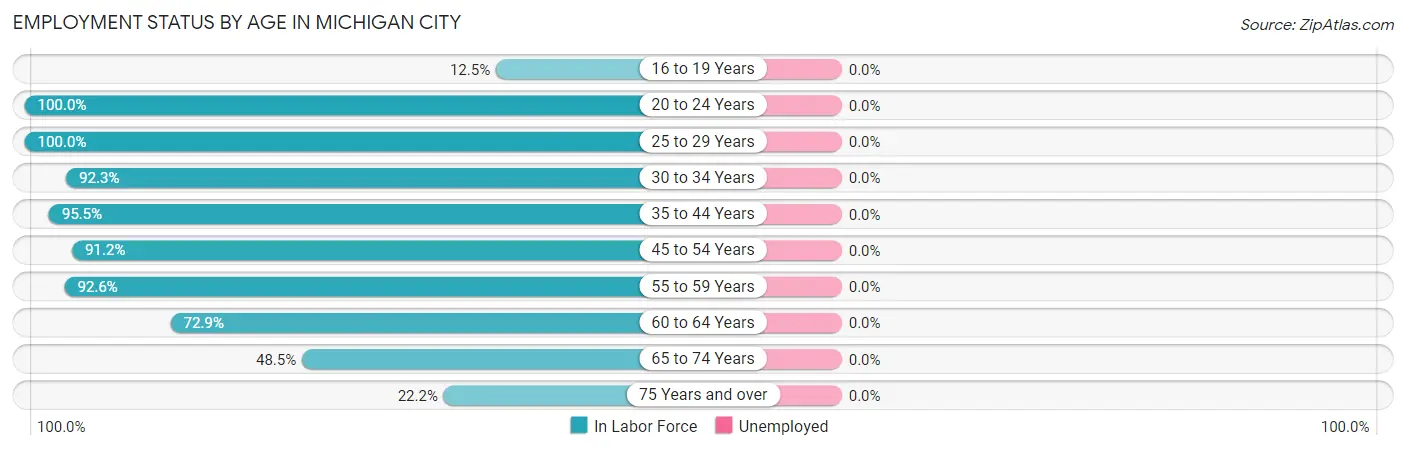
| Age Bracket | In Labor Force | Unemployed |
| 16 to 19 Years | 2 (12.5%) | 0 (0.0%) |
| 20 to 24 Years | 9 (100.0%) | 0 (0.0%) |
| 25 to 29 Years | 29 (100.0%) | 0 (0.0%) |
| 30 to 34 Years | 12 (92.3%) | 0 (0.0%) |
| 35 to 44 Years | 42 (95.5%) | 0 (0.0%) |
| 45 to 54 Years | 31 (91.2%) | 0 (0.0%) |
| 55 to 59 Years | 25 (92.6%) | 0 (0.0%) |
| 60 to 64 Years | 43 (72.9%) | 0 (0.0%) |
| 65 to 74 Years | 16 (48.5%) | 0 (0.0%) |
| 75 Years and over | 4 (22.2%) | 0 (0.0%) |
| Total | 213 (75.5%) | 0 (0.0%) |
Employment Status by Educational Attainment in Michigan City
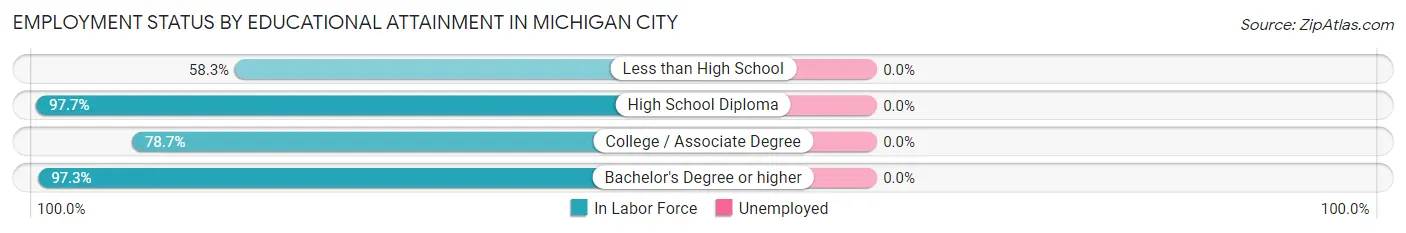
| Educational Attainment | In Labor Force | Unemployed |
| Less than High School | 7 (58.3%) | 0 (0.0%) |
| High School Diploma | 43 (97.7%) | 0 (0.0%) |
| College / Associate Degree | 59 (78.7%) | 0 (0.0%) |
| Bachelor's Degree or higher | 73 (97.3%) | 0 (0.0%) |
| Total | 182 (88.3%) | 0 (0.0%) |
Employment Occupations by Sex in Michigan City
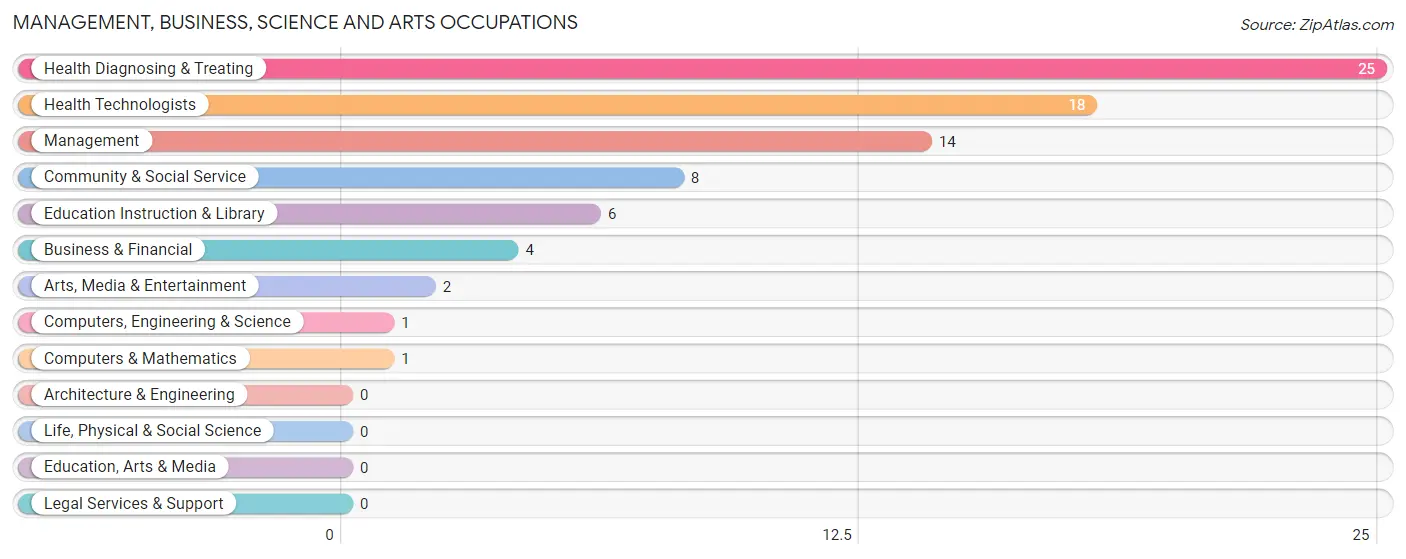
Management, Business, Science and Arts Occupations
The most common Management, Business, Science and Arts occupations in Michigan City are Health Diagnosing & Treating (25 | 11.7%), Health Technologists (18 | 8.5%), Management (14 | 6.6%), Community & Social Service (8 | 3.8%), and Education Instruction & Library (6 | 2.8%).
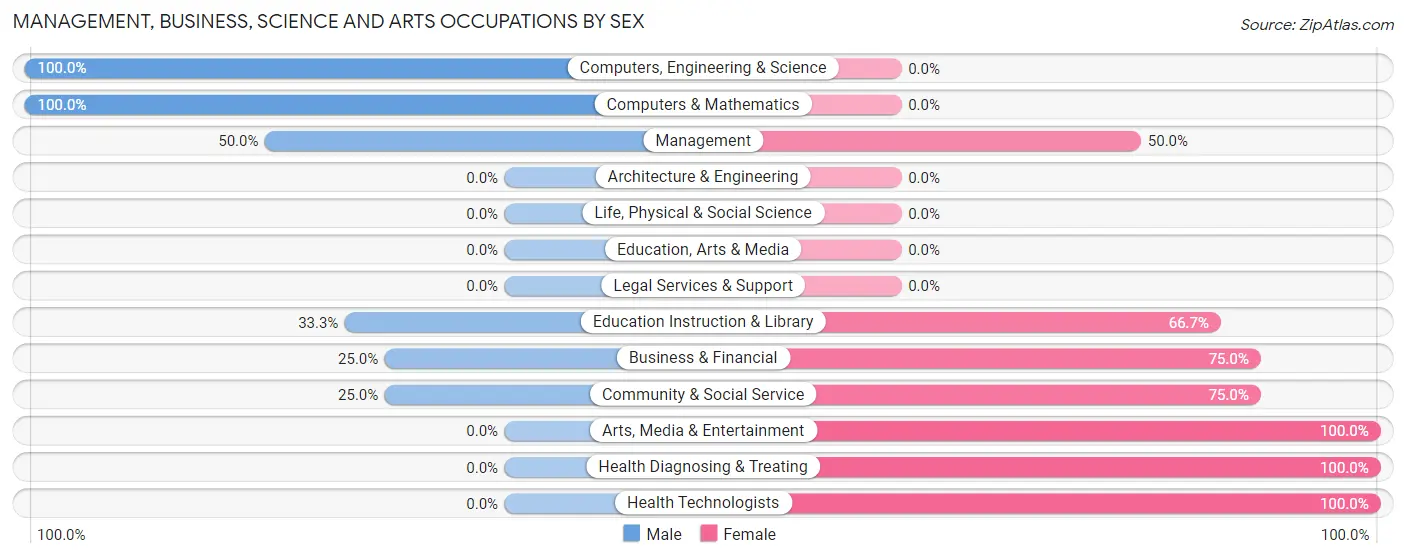
Management, Business, Science and Arts Occupations by Sex
Within the Management, Business, Science and Arts occupations in Michigan City, the most male-oriented occupations are Computers, Engineering & Science (100.0%), Computers & Mathematics (100.0%), and Management (50.0%), while the most female-oriented occupations are Arts, Media & Entertainment (100.0%), Health Diagnosing & Treating (100.0%), and Health Technologists (100.0%).
| Occupation | Male | Female |
| Management | 7 (50.0%) | 7 (50.0%) |
| Business & Financial | 1 (25.0%) | 3 (75.0%) |
| Computers, Engineering & Science | 1 (100.0%) | 0 (0.0%) |
| Computers & Mathematics | 1 (100.0%) | 0 (0.0%) |
| Architecture & Engineering | 0 (0.0%) | 0 (0.0%) |
| Life, Physical & Social Science | 0 (0.0%) | 0 (0.0%) |
| Community & Social Service | 2 (25.0%) | 6 (75.0%) |
| Education, Arts & Media | 0 (0.0%) | 0 (0.0%) |
| Legal Services & Support | 0 (0.0%) | 0 (0.0%) |
| Education Instruction & Library | 2 (33.3%) | 4 (66.7%) |
| Arts, Media & Entertainment | 0 (0.0%) | 2 (100.0%) |
| Health Diagnosing & Treating | 0 (0.0%) | 25 (100.0%) |
| Health Technologists | 0 (0.0%) | 18 (100.0%) |
| Total (Category) | 11 (21.1%) | 41 (78.8%) |
| Total (Overall) | 105 (49.3%) | 108 (50.7%) |
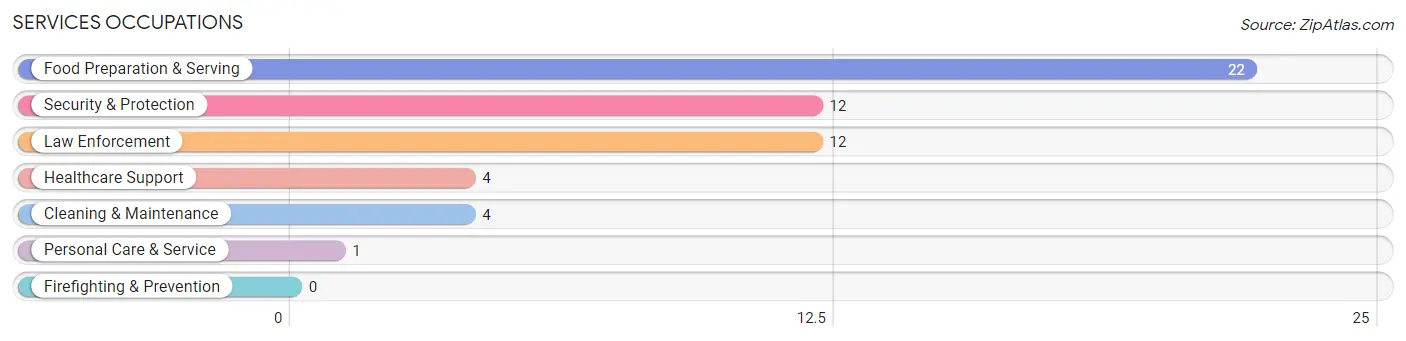
Services Occupations
The most common Services occupations in Michigan City are Food Preparation & Serving (22 | 10.3%), Security & Protection (12 | 5.6%), Law Enforcement (12 | 5.6%), Healthcare Support (4 | 1.9%), and Cleaning & Maintenance (4 | 1.9%).
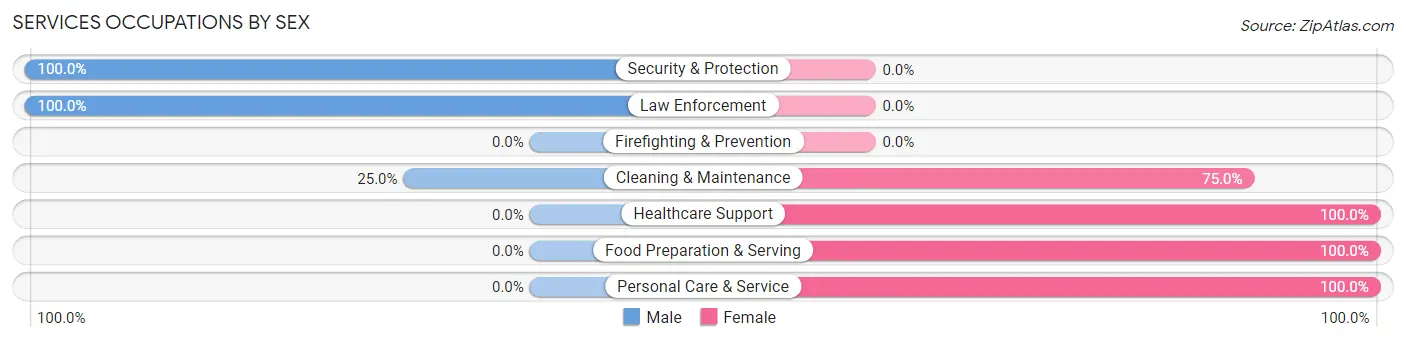
Services Occupations by Sex
Within the Services occupations in Michigan City, the most male-oriented occupations are Security & Protection (100.0%), Law Enforcement (100.0%), and Cleaning & Maintenance (25.0%), while the most female-oriented occupations are Healthcare Support (100.0%), Food Preparation & Serving (100.0%), and Personal Care & Service (100.0%).
| Occupation | Male | Female |
| Healthcare Support | 0 (0.0%) | 4 (100.0%) |
| Security & Protection | 12 (100.0%) | 0 (0.0%) |
| Firefighting & Prevention | 0 (0.0%) | 0 (0.0%) |
| Law Enforcement | 12 (100.0%) | 0 (0.0%) |
| Food Preparation & Serving | 0 (0.0%) | 22 (100.0%) |
| Cleaning & Maintenance | 1 (25.0%) | 3 (75.0%) |
| Personal Care & Service | 0 (0.0%) | 1 (100.0%) |
| Total (Category) | 13 (30.2%) | 30 (69.8%) |
| Total (Overall) | 105 (49.3%) | 108 (50.7%) |
Sales and Office Occupations
The most common Sales and Office occupations in Michigan City are Office & Administration (38 | 17.8%), and Sales & Related (33 | 15.5%).

Sales and Office Occupations by Sex

| Occupation | Male | Female |
| Sales & Related | 14 (42.4%) | 19 (57.6%) |
| Office & Administration | 34 (89.5%) | 4 (10.5%) |
| Total (Category) | 48 (67.6%) | 23 (32.4%) |
| Total (Overall) | 105 (49.3%) | 108 (50.7%) |
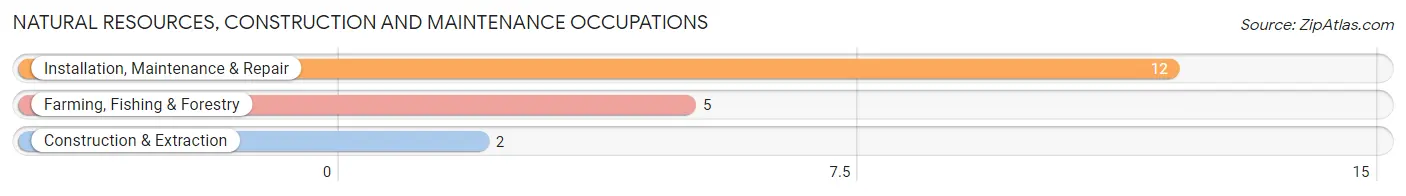
Natural Resources, Construction and Maintenance Occupations
The most common Natural Resources, Construction and Maintenance occupations in Michigan City are Installation, Maintenance & Repair (12 | 5.6%), Farming, Fishing & Forestry (5 | 2.4%), and Construction & Extraction (2 | 0.9%).
Natural Resources, Construction and Maintenance Occupations by Sex
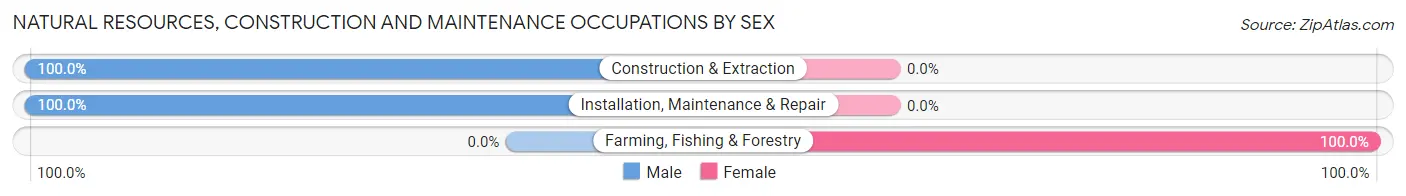
| Occupation | Male | Female |
| Farming, Fishing & Forestry | 0 (0.0%) | 5 (100.0%) |
| Construction & Extraction | 2 (100.0%) | 0 (0.0%) |
| Installation, Maintenance & Repair | 12 (100.0%) | 0 (0.0%) |
| Total (Category) | 14 (73.7%) | 5 (26.3%) |
| Total (Overall) | 105 (49.3%) | 108 (50.7%) |
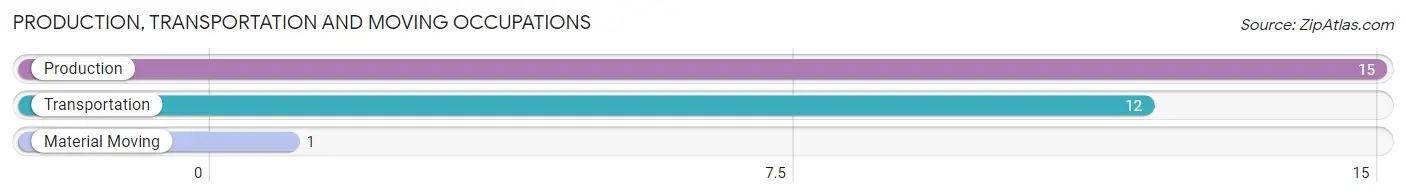
Production, Transportation and Moving Occupations
The most common Production, Transportation and Moving occupations in Michigan City are Production (15 | 7.0%), Transportation (12 | 5.6%), and Material Moving (1 | 0.5%).
Production, Transportation and Moving Occupations by Sex
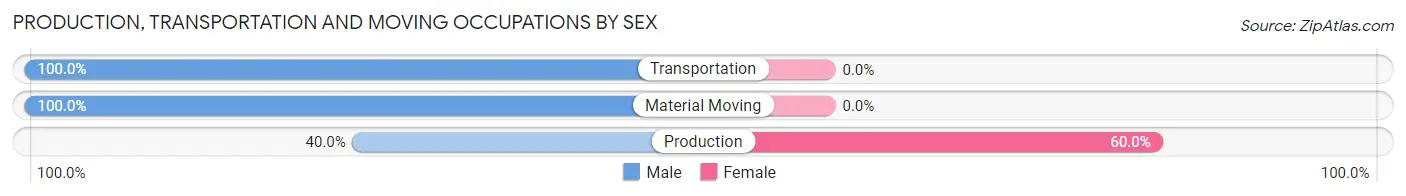
| Occupation | Male | Female |
| Production | 6 (40.0%) | 9 (60.0%) |
| Transportation | 12 (100.0%) | 0 (0.0%) |
| Material Moving | 1 (100.0%) | 0 (0.0%) |
| Total (Category) | 19 (67.9%) | 9 (32.1%) |
| Total (Overall) | 105 (49.3%) | 108 (50.7%) |
Employment Industries by Sex in Michigan City
Employment Industries in Michigan City
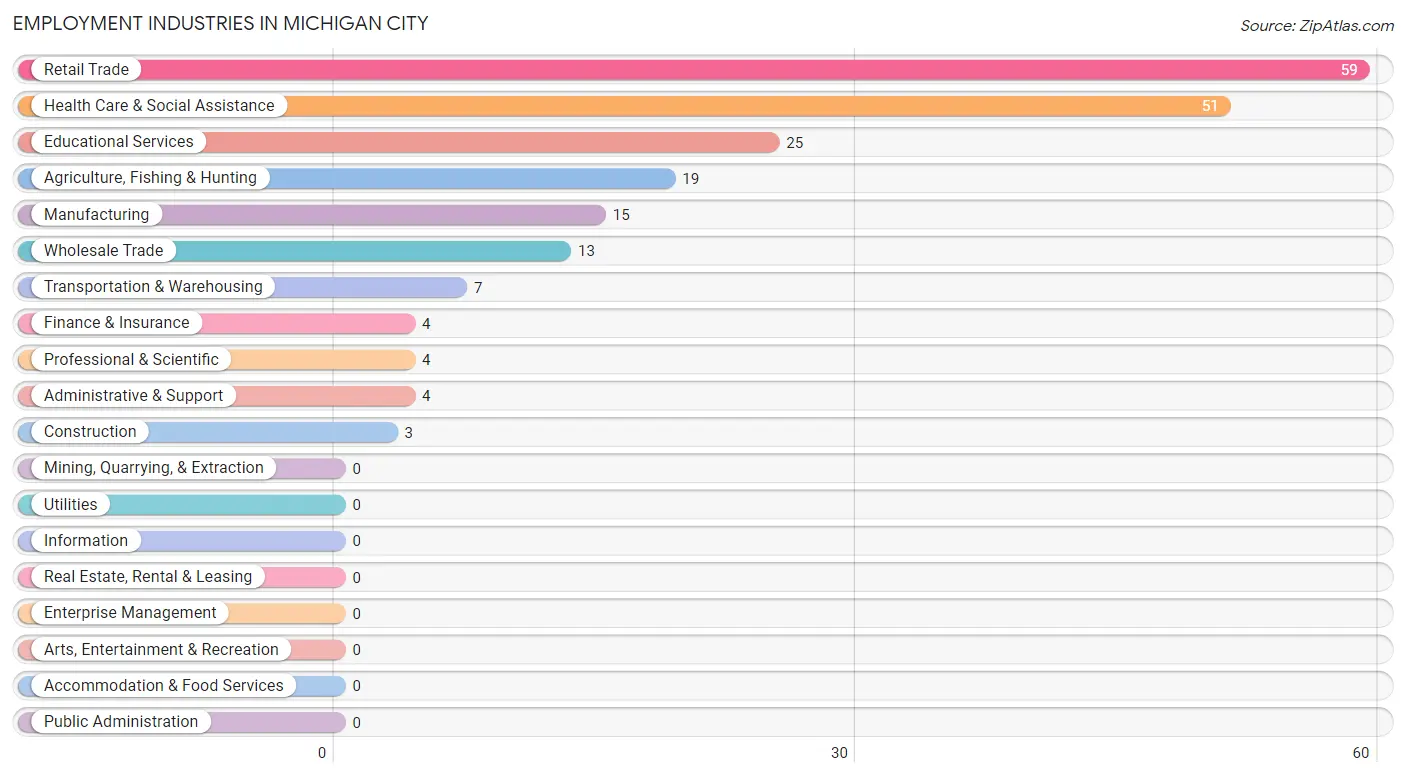
The major employment industries in Michigan City include Retail Trade (59 | 27.7%), Health Care & Social Assistance (51 | 23.9%), Educational Services (25 | 11.7%), Agriculture, Fishing & Hunting (19 | 8.9%), and Manufacturing (15 | 7.0%).
Employment Industries by Sex in Michigan City
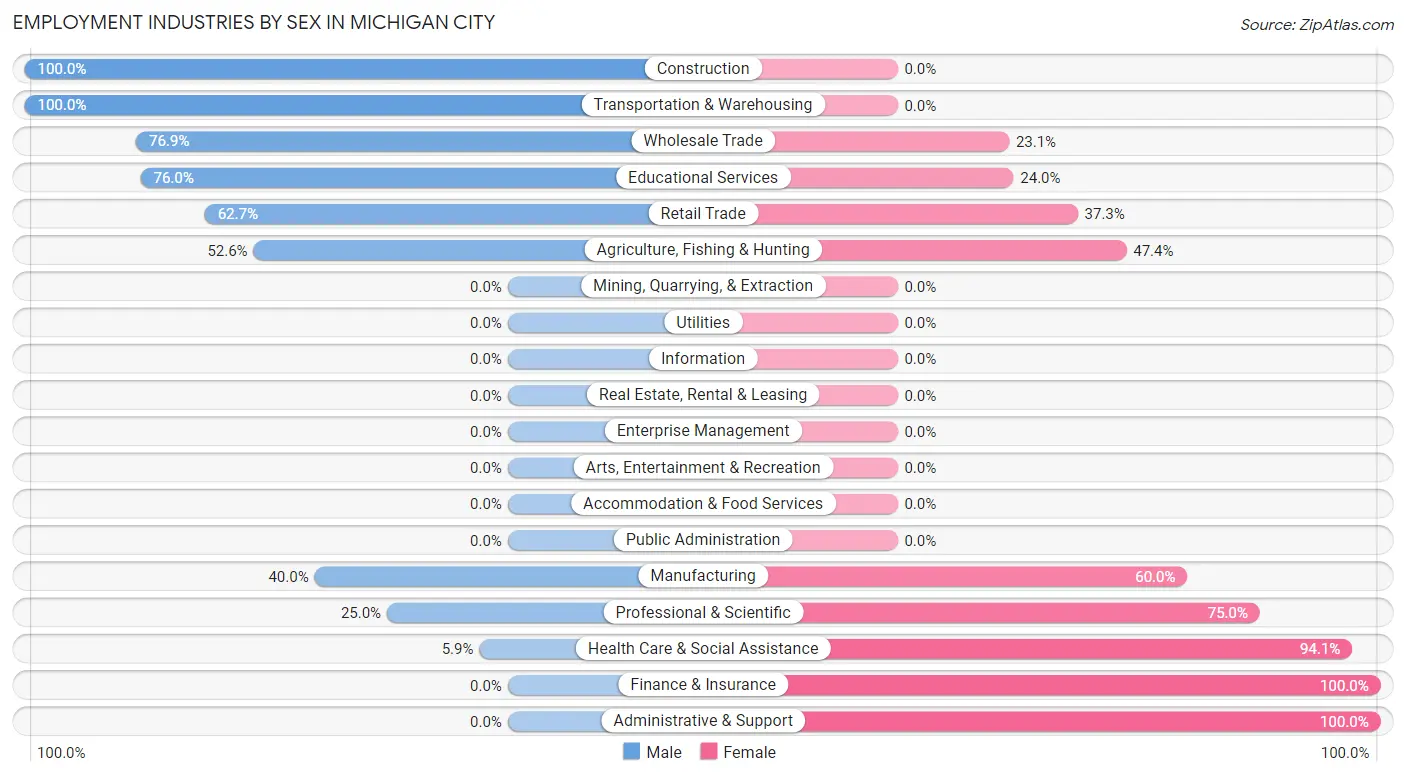
The Michigan City industries that see more men than women are Construction (100.0%), Transportation & Warehousing (100.0%), and Wholesale Trade (76.9%), whereas the industries that tend to have a higher number of women are Finance & Insurance (100.0%), Administrative & Support (100.0%), and Health Care & Social Assistance (94.1%).
| Industry | Male | Female |
| Agriculture, Fishing & Hunting | 10 (52.6%) | 9 (47.4%) |
| Mining, Quarrying, & Extraction | 0 (0.0%) | 0 (0.0%) |
| Construction | 3 (100.0%) | 0 (0.0%) |
| Manufacturing | 6 (40.0%) | 9 (60.0%) |
| Wholesale Trade | 10 (76.9%) | 3 (23.1%) |
| Retail Trade | 37 (62.7%) | 22 (37.3%) |
| Transportation & Warehousing | 7 (100.0%) | 0 (0.0%) |
| Utilities | 0 (0.0%) | 0 (0.0%) |
| Information | 0 (0.0%) | 0 (0.0%) |
| Finance & Insurance | 0 (0.0%) | 4 (100.0%) |
| Real Estate, Rental & Leasing | 0 (0.0%) | 0 (0.0%) |
| Professional & Scientific | 1 (25.0%) | 3 (75.0%) |
| Enterprise Management | 0 (0.0%) | 0 (0.0%) |
| Administrative & Support | 0 (0.0%) | 4 (100.0%) |
| Educational Services | 19 (76.0%) | 6 (24.0%) |
| Health Care & Social Assistance | 3 (5.9%) | 48 (94.1%) |
| Arts, Entertainment & Recreation | 0 (0.0%) | 0 (0.0%) |
| Accommodation & Food Services | 0 (0.0%) | 0 (0.0%) |
| Public Administration | 0 (0.0%) | 0 (0.0%) |
| Total | 105 (49.3%) | 108 (50.7%) |
Education in Michigan City
School Enrollment in Michigan City
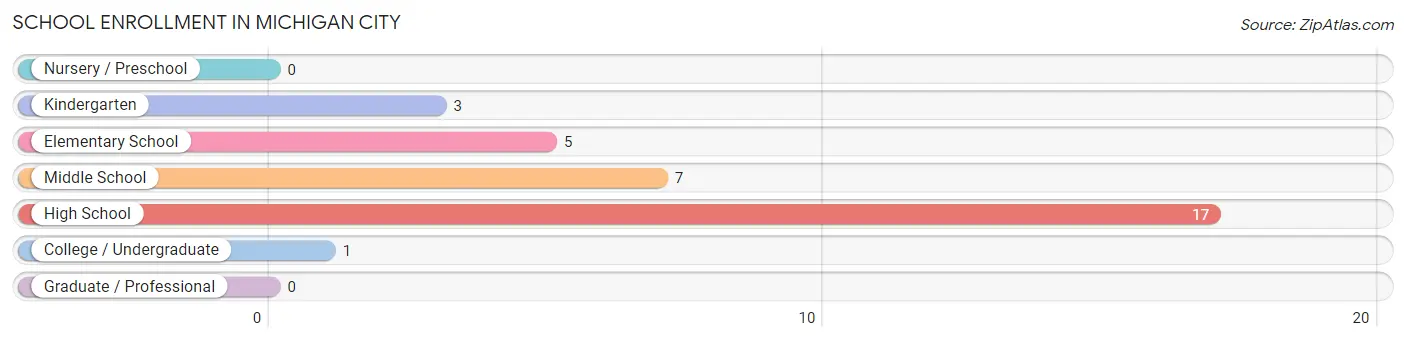
The most common levels of schooling among the 33 students in Michigan City are high school (17 | 51.5%), middle school (7 | 21.2%), and elementary school (5 | 15.1%).
| School Level | # Students | % Students |
| Nursery / Preschool | 0 | 0.0% |
| Kindergarten | 3 | 9.1% |
| Elementary School | 5 | 15.1% |
| Middle School | 7 | 21.2% |
| High School | 17 | 51.5% |
| College / Undergraduate | 1 | 3.0% |
| Graduate / Professional | 0 | 0.0% |
| Total | 33 | 100.0% |
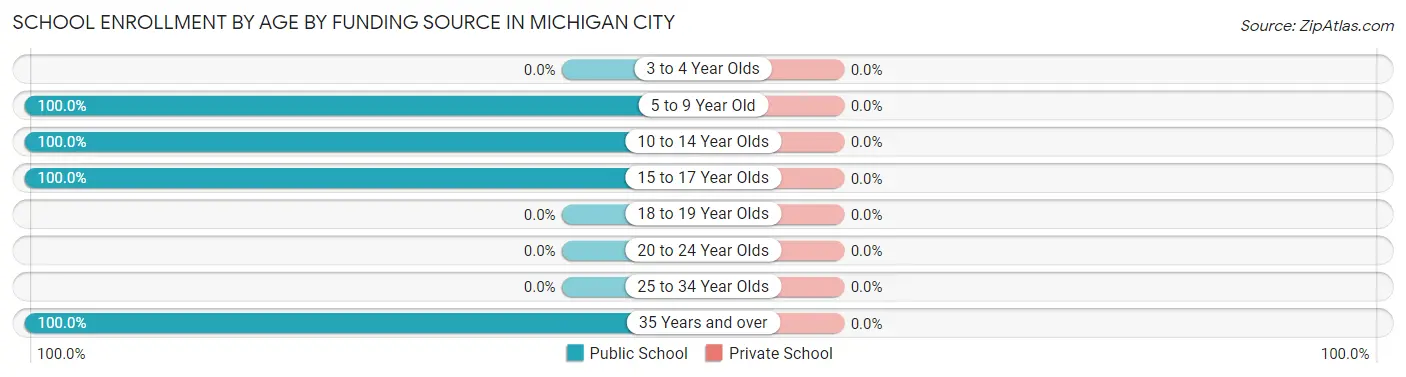
School Enrollment by Age by Funding Source in Michigan City
| Age Bracket | Public School | Private School |
| 3 to 4 Year Olds | 0 (0.0%) | 0 (0.0%) |
| 5 to 9 Year Old | 6 (100.0%) | 0 (0.0%) |
| 10 to 14 Year Olds | 8 (100.0%) | 0 (0.0%) |
| 15 to 17 Year Olds | 18 (100.0%) | 0 (0.0%) |
| 18 to 19 Year Olds | 0 (0.0%) | 0 (0.0%) |
| 20 to 24 Year Olds | 0 (0.0%) | 0 (0.0%) |
| 25 to 34 Year Olds | 0 (0.0%) | 0 (0.0%) |
| 35 Years and over | 1 (100.0%) | 0 (0.0%) |
| Total | 33 (100.0%) | 0 (0.0%) |
Educational Attainment by Field of Study in Michigan City
Science & technology (41 | 50.6%), business (14 | 17.3%), education (14 | 17.3%), visual & performing arts (6 | 7.4%), and engineering (3 | 3.7%) are the most common fields of study among 81 individuals in Michigan City who have obtained a bachelor's degree or higher.
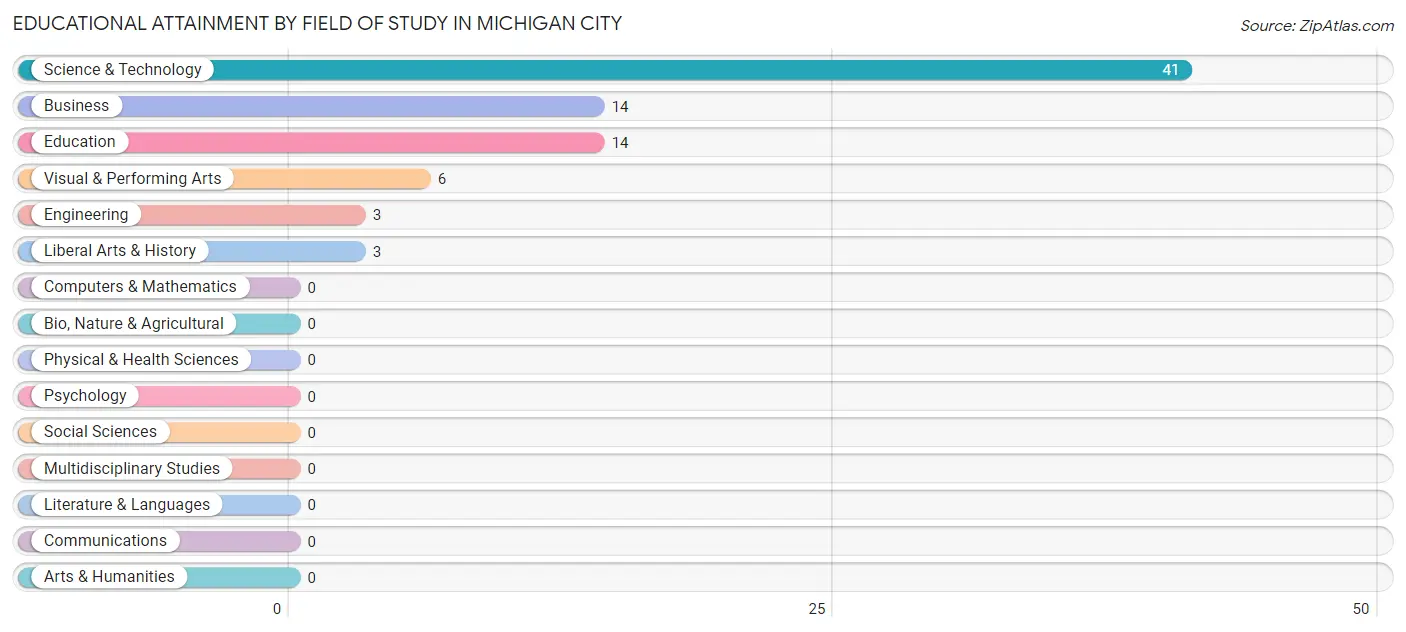
| Field of Study | # Graduates | % Graduates |
| Computers & Mathematics | 0 | 0.0% |
| Bio, Nature & Agricultural | 0 | 0.0% |
| Physical & Health Sciences | 0 | 0.0% |
| Psychology | 0 | 0.0% |
| Social Sciences | 0 | 0.0% |
| Engineering | 3 | 3.7% |
| Multidisciplinary Studies | 0 | 0.0% |
| Science & Technology | 41 | 50.6% |
| Business | 14 | 17.3% |
| Education | 14 | 17.3% |
| Literature & Languages | 0 | 0.0% |
| Liberal Arts & History | 3 | 3.7% |
| Visual & Performing Arts | 6 | 7.4% |
| Communications | 0 | 0.0% |
| Arts & Humanities | 0 | 0.0% |
| Total | 81 | 100.0% |
Transportation & Commute in Michigan City
Vehicle Availability by Sex in Michigan City
The most prevalent vehicle ownership categories in Michigan City are males with 5 or more vehicles (46, accounting for 43.8%) and females with 5 or more vehicles (21, making up 43.8%).
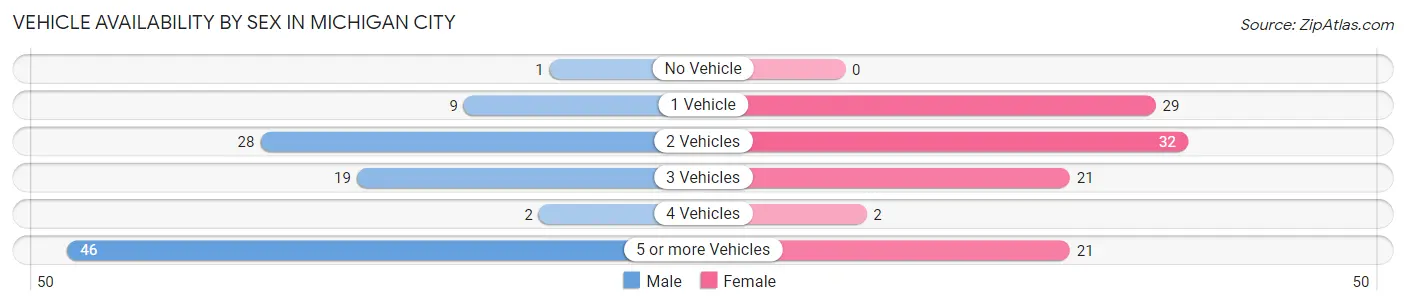
| Vehicles Available | Male | Female |
| No Vehicle | 1 (0.9%) | 0 (0.0%) |
| 1 Vehicle | 9 (8.6%) | 29 (27.6%) |
| 2 Vehicles | 28 (26.7%) | 32 (30.5%) |
| 3 Vehicles | 19 (18.1%) | 21 (20.0%) |
| 4 Vehicles | 2 (1.9%) | 2 (1.9%) |
| 5 or more Vehicles | 46 (43.8%) | 21 (20.0%) |
| Total | 105 (100.0%) | 105 (100.0%) |
Commute Time in Michigan City
The most frequently occuring commute durations in Michigan City are 5 to 9 minutes (48 commuters, 22.9%), less than 5 minutes (39 commuters, 18.6%), and 10 to 14 minutes (35 commuters, 16.7%).
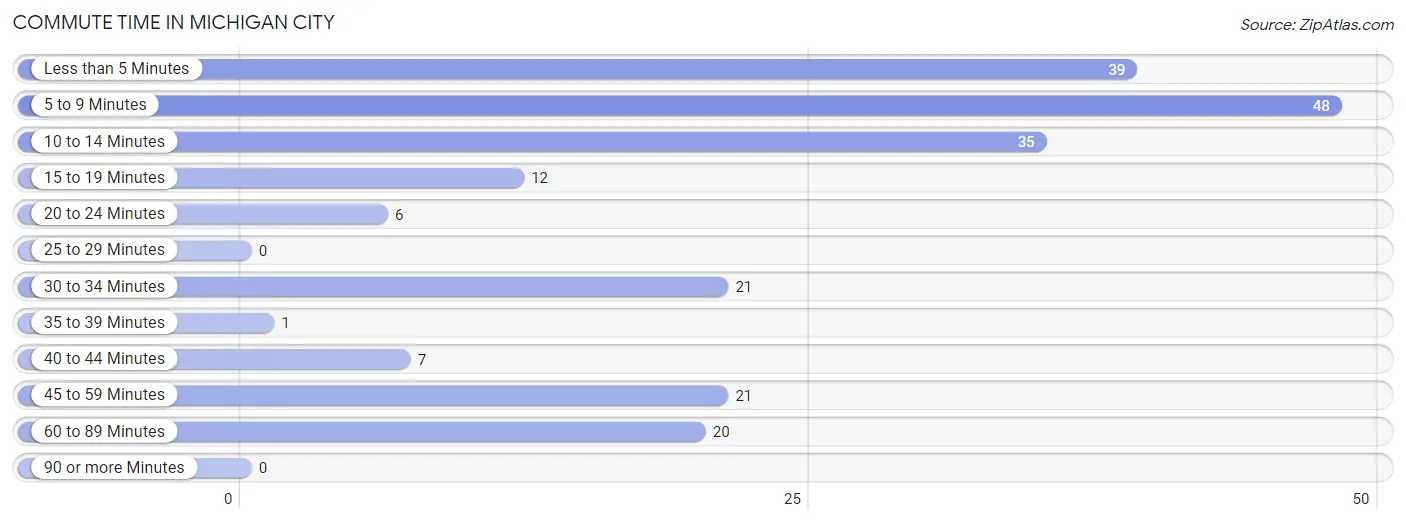
| Commute Time | # Commuters | % Commuters |
| Less than 5 Minutes | 39 | 18.6% |
| 5 to 9 Minutes | 48 | 22.9% |
| 10 to 14 Minutes | 35 | 16.7% |
| 15 to 19 Minutes | 12 | 5.7% |
| 20 to 24 Minutes | 6 | 2.9% |
| 25 to 29 Minutes | 0 | 0.0% |
| 30 to 34 Minutes | 21 | 10.0% |
| 35 to 39 Minutes | 1 | 0.5% |
| 40 to 44 Minutes | 7 | 3.3% |
| 45 to 59 Minutes | 21 | 10.0% |
| 60 to 89 Minutes | 20 | 9.5% |
| 90 or more Minutes | 0 | 0.0% |
Commute Time by Sex in Michigan City
The most common commute times in Michigan City are less than 5 minutes (32 commuters, 30.5%) for males and 10 to 14 minutes (29 commuters, 27.6%) for females.
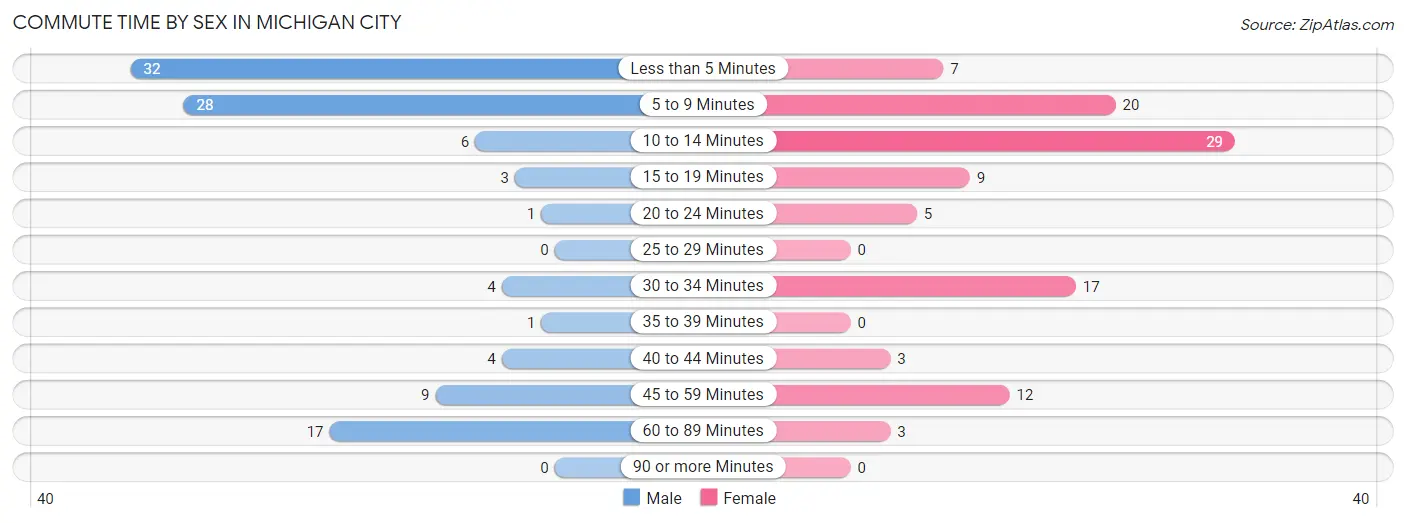
| Commute Time | Male | Female |
| Less than 5 Minutes | 32 (30.5%) | 7 (6.7%) |
| 5 to 9 Minutes | 28 (26.7%) | 20 (19.1%) |
| 10 to 14 Minutes | 6 (5.7%) | 29 (27.6%) |
| 15 to 19 Minutes | 3 (2.9%) | 9 (8.6%) |
| 20 to 24 Minutes | 1 (0.9%) | 5 (4.8%) |
| 25 to 29 Minutes | 0 (0.0%) | 0 (0.0%) |
| 30 to 34 Minutes | 4 (3.8%) | 17 (16.2%) |
| 35 to 39 Minutes | 1 (0.9%) | 0 (0.0%) |
| 40 to 44 Minutes | 4 (3.8%) | 3 (2.9%) |
| 45 to 59 Minutes | 9 (8.6%) | 12 (11.4%) |
| 60 to 89 Minutes | 17 (16.2%) | 3 (2.9%) |
| 90 or more Minutes | 0 (0.0%) | 0 (0.0%) |
Time of Departure to Work by Sex in Michigan City
The most frequent times of departure to work in Michigan City are 8:00 AM to 8:29 AM (34, 32.4%) for males and 12:00 AM to 4:59 AM (18, 17.1%) for females.
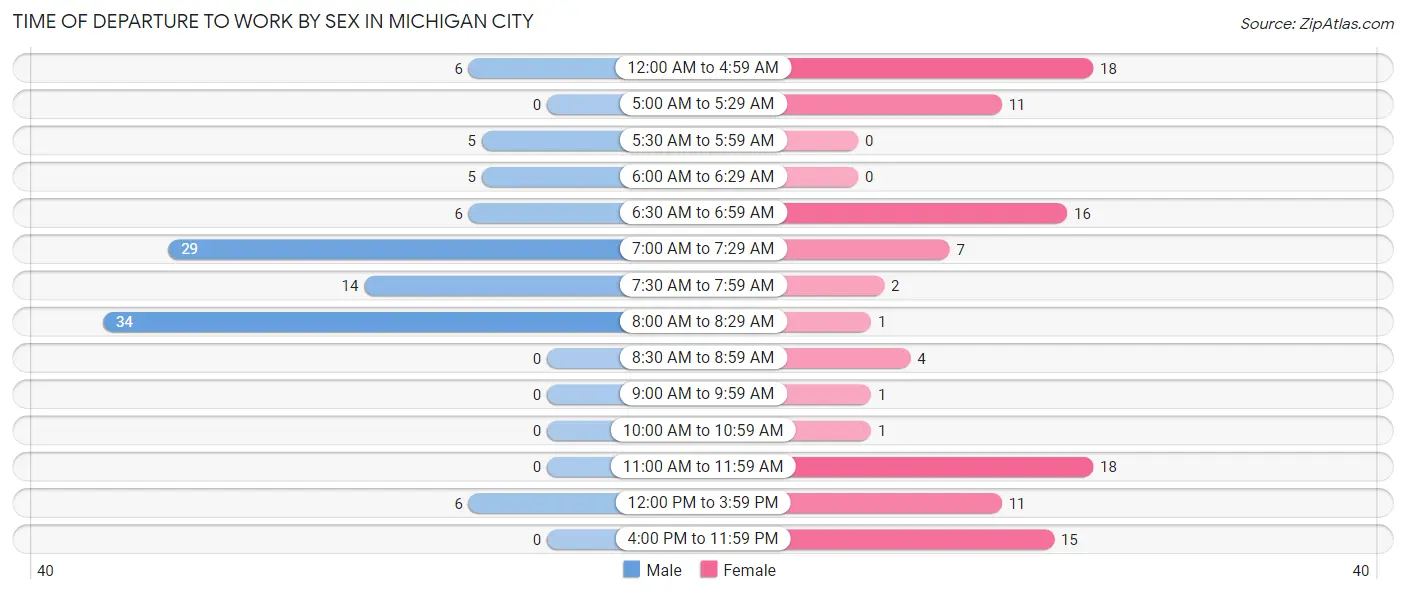
| Time of Departure | Male | Female |
| 12:00 AM to 4:59 AM | 6 (5.7%) | 18 (17.1%) |
| 5:00 AM to 5:29 AM | 0 (0.0%) | 11 (10.5%) |
| 5:30 AM to 5:59 AM | 5 (4.8%) | 0 (0.0%) |
| 6:00 AM to 6:29 AM | 5 (4.8%) | 0 (0.0%) |
| 6:30 AM to 6:59 AM | 6 (5.7%) | 16 (15.2%) |
| 7:00 AM to 7:29 AM | 29 (27.6%) | 7 (6.7%) |
| 7:30 AM to 7:59 AM | 14 (13.3%) | 2 (1.9%) |
| 8:00 AM to 8:29 AM | 34 (32.4%) | 1 (0.9%) |
| 8:30 AM to 8:59 AM | 0 (0.0%) | 4 (3.8%) |
| 9:00 AM to 9:59 AM | 0 (0.0%) | 1 (0.9%) |
| 10:00 AM to 10:59 AM | 0 (0.0%) | 1 (0.9%) |
| 11:00 AM to 11:59 AM | 0 (0.0%) | 18 (17.1%) |
| 12:00 PM to 3:59 PM | 6 (5.7%) | 11 (10.5%) |
| 4:00 PM to 11:59 PM | 0 (0.0%) | 15 (14.3%) |
| Total | 105 (100.0%) | 105 (100.0%) |
Housing Occupancy in Michigan City
Occupancy by Ownership in Michigan City
Of the total 145 dwellings in Michigan City, owner-occupied units account for 101 (69.7%), while renter-occupied units make up 44 (30.3%).
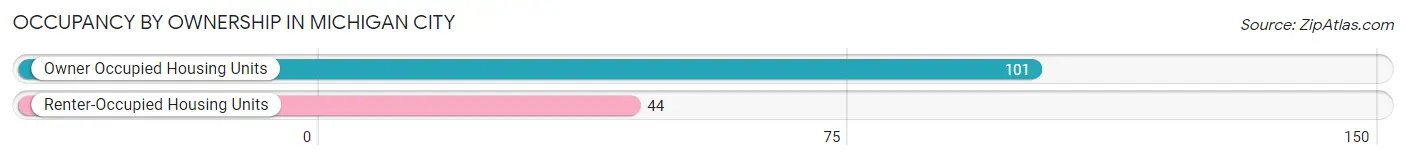
| Occupancy | # Housing Units | % Housing Units |
| Owner Occupied Housing Units | 101 | 69.7% |
| Renter-Occupied Housing Units | 44 | 30.3% |
| Total Occupied Housing Units | 145 | 100.0% |
Occupancy by Household Size in Michigan City
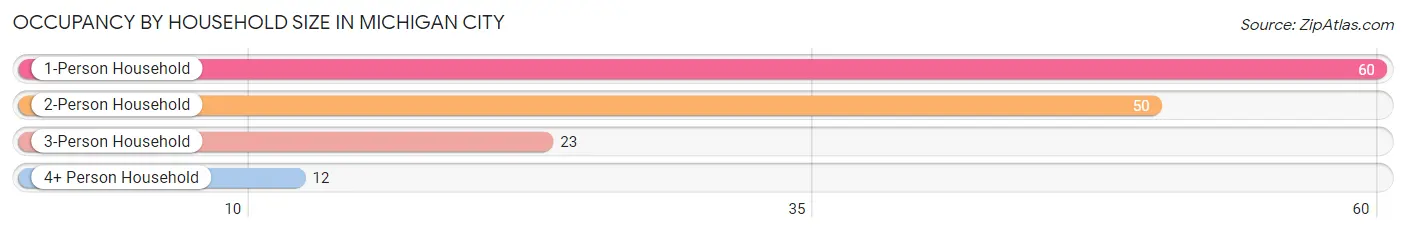
| Household Size | # Housing Units | % Housing Units |
| 1-Person Household | 60 | 41.4% |
| 2-Person Household | 50 | 34.5% |
| 3-Person Household | 23 | 15.9% |
| 4+ Person Household | 12 | 8.3% |
| Total Housing Units | 145 | 100.0% |
Occupancy by Ownership by Household Size in Michigan City
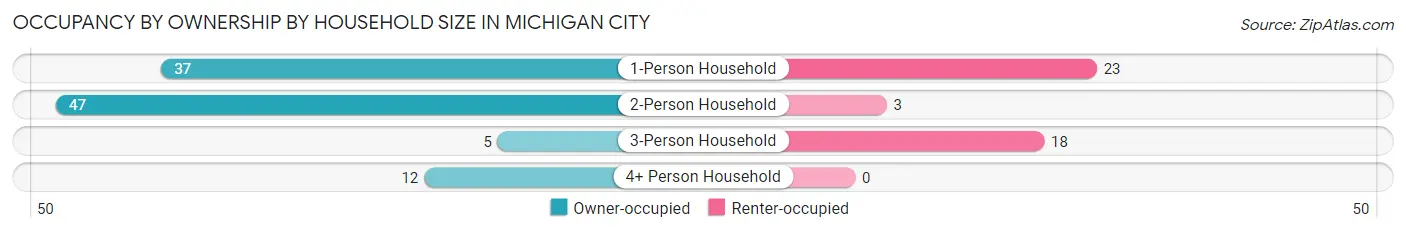
| Household Size | Owner-occupied | Renter-occupied |
| 1-Person Household | 37 (61.7%) | 23 (38.3%) |
| 2-Person Household | 47 (94.0%) | 3 (6.0%) |
| 3-Person Household | 5 (21.7%) | 18 (78.3%) |
| 4+ Person Household | 12 (100.0%) | 0 (0.0%) |
| Total Housing Units | 101 (69.7%) | 44 (30.3%) |
Occupancy by Educational Attainment in Michigan City
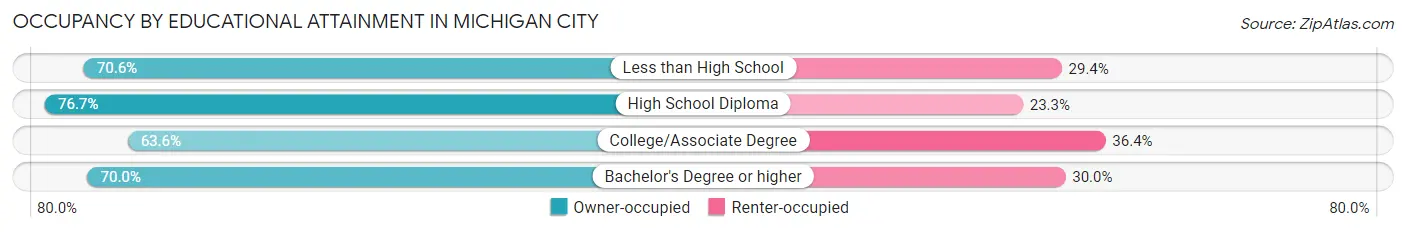
| Household Size | Owner-occupied | Renter-occupied |
| Less than High School | 12 (70.6%) | 5 (29.4%) |
| High School Diploma | 33 (76.7%) | 10 (23.3%) |
| College/Associate Degree | 35 (63.6%) | 20 (36.4%) |
| Bachelor's Degree or higher | 21 (70.0%) | 9 (30.0%) |
Occupancy by Age of Householder in Michigan City
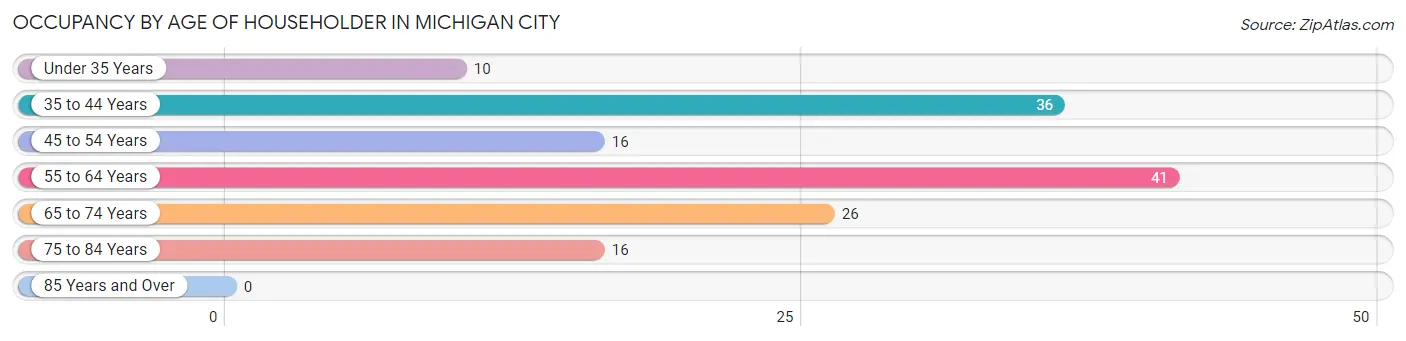
| Age Bracket | # Households | % Households |
| Under 35 Years | 10 | 6.9% |
| 35 to 44 Years | 36 | 24.8% |
| 45 to 54 Years | 16 | 11.0% |
| 55 to 64 Years | 41 | 28.3% |
| 65 to 74 Years | 26 | 17.9% |
| 75 to 84 Years | 16 | 11.0% |
| 85 Years and Over | 0 | 0.0% |
| Total | 145 | 100.0% |
Housing Finances in Michigan City
Median Income by Occupancy in Michigan City
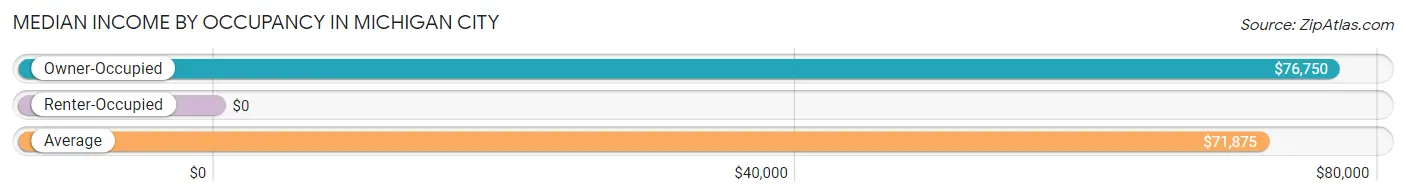
| Occupancy Type | # Households | Median Income |
| Owner-Occupied | 101 (69.7%) | $76,750 |
| Renter-Occupied | 44 (30.3%) | $0 |
| Average | 145 (100.0%) | $71,875 |
Occupancy by Householder Income Bracket in Michigan City
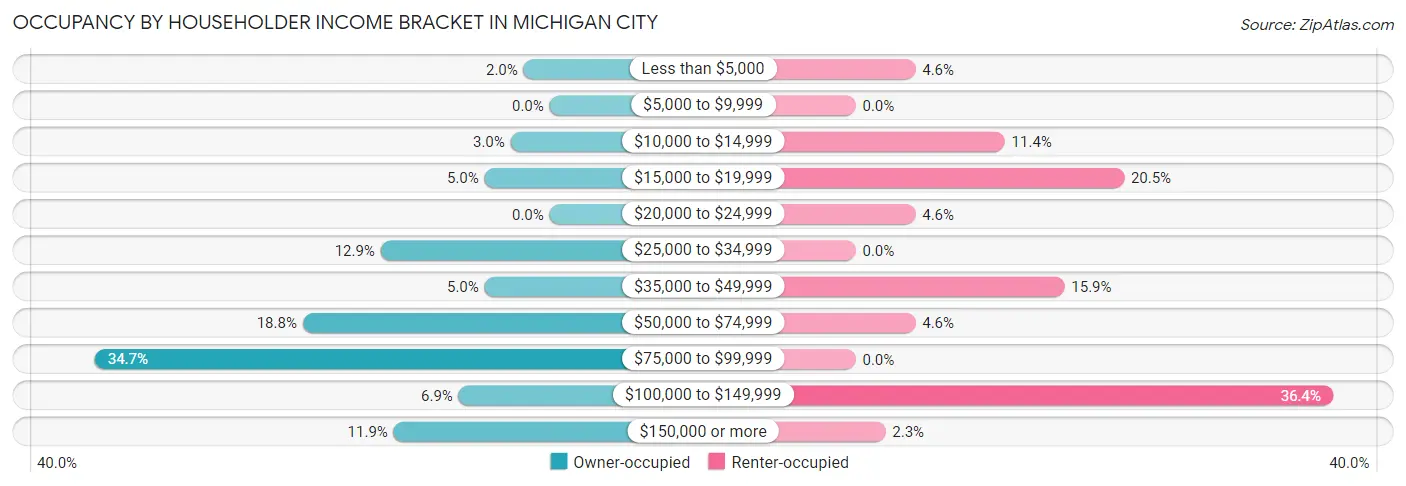
| Income Bracket | Owner-occupied | Renter-occupied |
| Less than $5,000 | 2 (2.0%) | 2 (4.5%) |
| $5,000 to $9,999 | 0 (0.0%) | 0 (0.0%) |
| $10,000 to $14,999 | 3 (3.0%) | 5 (11.4%) |
| $15,000 to $19,999 | 5 (5.0%) | 9 (20.4%) |
| $20,000 to $24,999 | 0 (0.0%) | 2 (4.5%) |
| $25,000 to $34,999 | 13 (12.9%) | 0 (0.0%) |
| $35,000 to $49,999 | 5 (5.0%) | 7 (15.9%) |
| $50,000 to $74,999 | 19 (18.8%) | 2 (4.5%) |
| $75,000 to $99,999 | 35 (34.6%) | 0 (0.0%) |
| $100,000 to $149,999 | 7 (6.9%) | 16 (36.4%) |
| $150,000 or more | 12 (11.9%) | 1 (2.3%) |
| Total | 101 (100.0%) | 44 (100.0%) |
Monthly Housing Cost Tiers in Michigan City
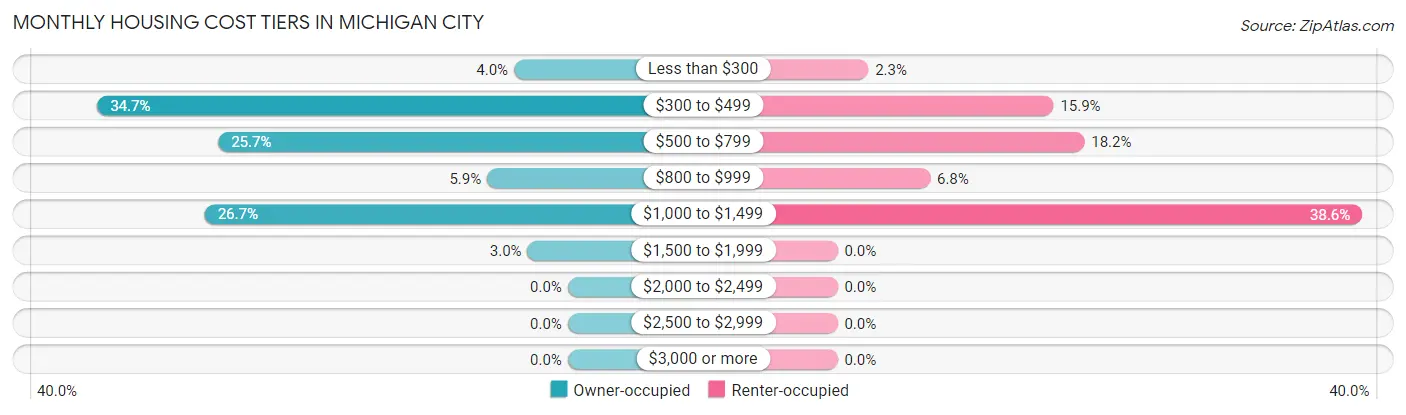
| Monthly Cost | Owner-occupied | Renter-occupied |
| Less than $300 | 4 (4.0%) | 1 (2.3%) |
| $300 to $499 | 35 (34.6%) | 7 (15.9%) |
| $500 to $799 | 26 (25.7%) | 8 (18.2%) |
| $800 to $999 | 6 (5.9%) | 3 (6.8%) |
| $1,000 to $1,499 | 27 (26.7%) | 17 (38.6%) |
| $1,500 to $1,999 | 3 (3.0%) | 0 (0.0%) |
| $2,000 to $2,499 | 0 (0.0%) | 0 (0.0%) |
| $2,500 to $2,999 | 0 (0.0%) | 0 (0.0%) |
| $3,000 or more | 0 (0.0%) | 0 (0.0%) |
| Total | 101 (100.0%) | 44 (100.0%) |
Physical Housing Characteristics in Michigan City
Housing Structures in Michigan City
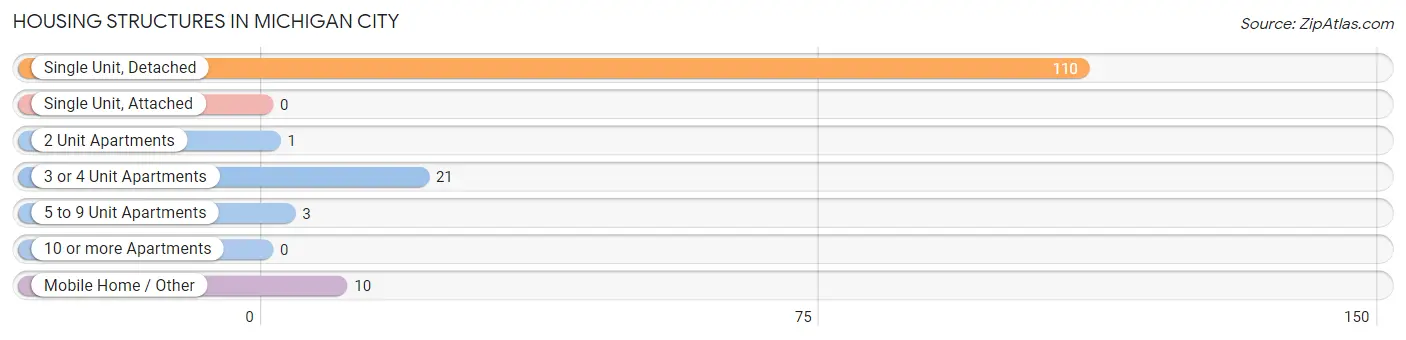
| Structure Type | # Housing Units | % Housing Units |
| Single Unit, Detached | 110 | 75.9% |
| Single Unit, Attached | 0 | 0.0% |
| 2 Unit Apartments | 1 | 0.7% |
| 3 or 4 Unit Apartments | 21 | 14.5% |
| 5 to 9 Unit Apartments | 3 | 2.1% |
| 10 or more Apartments | 0 | 0.0% |
| Mobile Home / Other | 10 | 6.9% |
| Total | 145 | 100.0% |
Housing Structures by Occupancy in Michigan City
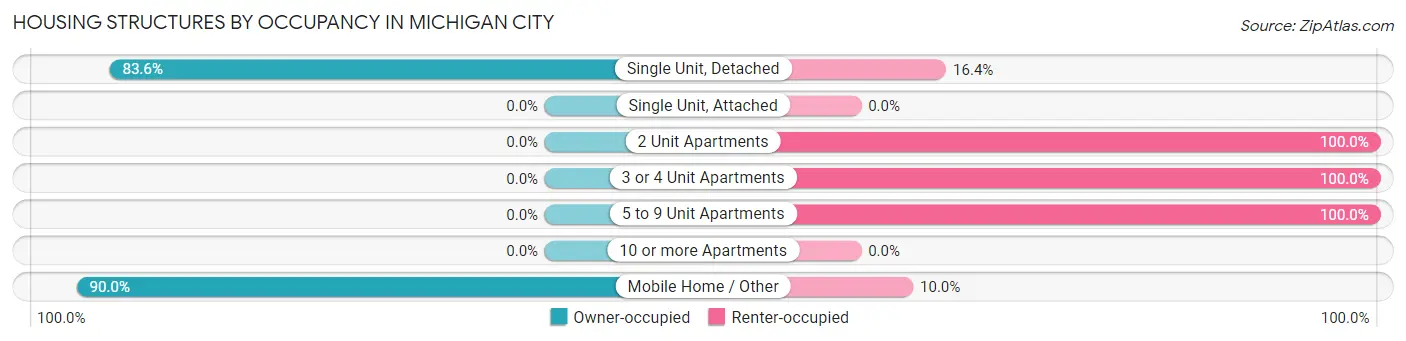
| Structure Type | Owner-occupied | Renter-occupied |
| Single Unit, Detached | 92 (83.6%) | 18 (16.4%) |
| Single Unit, Attached | 0 (0.0%) | 0 (0.0%) |
| 2 Unit Apartments | 0 (0.0%) | 1 (100.0%) |
| 3 or 4 Unit Apartments | 0 (0.0%) | 21 (100.0%) |
| 5 to 9 Unit Apartments | 0 (0.0%) | 3 (100.0%) |
| 10 or more Apartments | 0 (0.0%) | 0 (0.0%) |
| Mobile Home / Other | 9 (90.0%) | 1 (10.0%) |
| Total | 101 (69.7%) | 44 (30.3%) |
Housing Structures by Number of Rooms in Michigan City
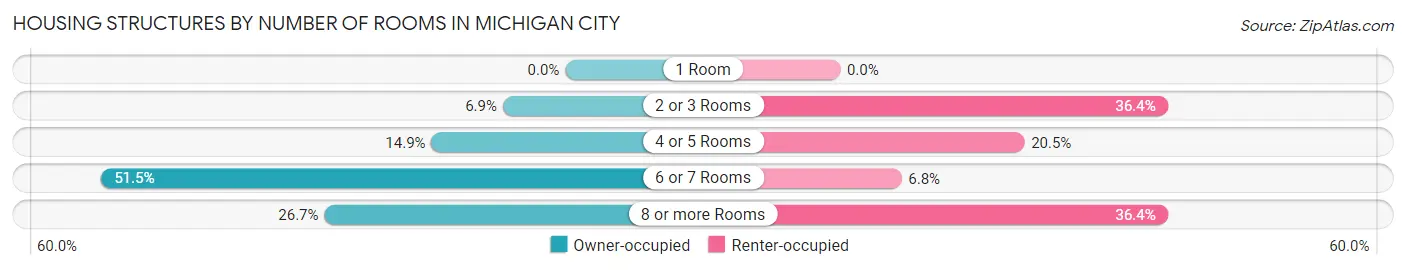
| Number of Rooms | Owner-occupied | Renter-occupied |
| 1 Room | 0 (0.0%) | 0 (0.0%) |
| 2 or 3 Rooms | 7 (6.9%) | 16 (36.4%) |
| 4 or 5 Rooms | 15 (14.8%) | 9 (20.4%) |
| 6 or 7 Rooms | 52 (51.5%) | 3 (6.8%) |
| 8 or more Rooms | 27 (26.7%) | 16 (36.4%) |
| Total | 101 (100.0%) | 44 (100.0%) |
Housing Structure by Heating Type in Michigan City
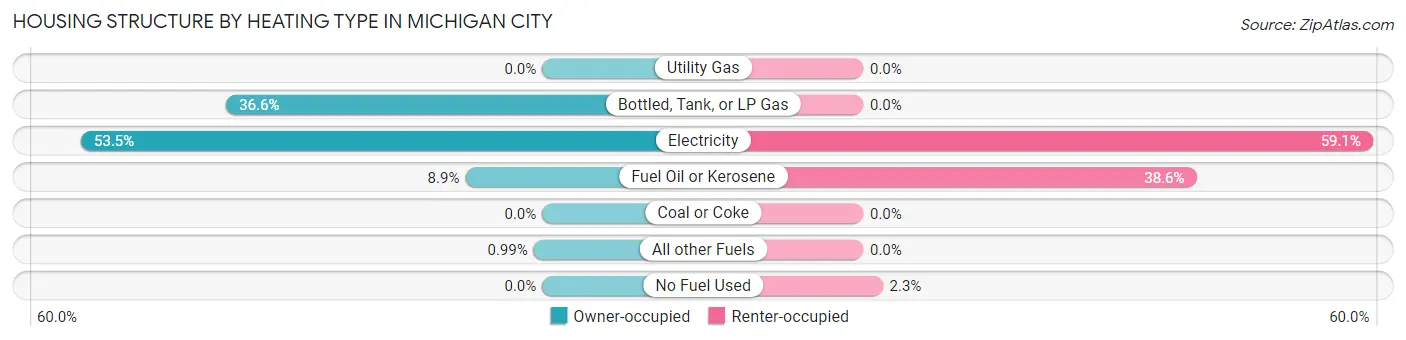
| Heating Type | Owner-occupied | Renter-occupied |
| Utility Gas | 0 (0.0%) | 0 (0.0%) |
| Bottled, Tank, or LP Gas | 37 (36.6%) | 0 (0.0%) |
| Electricity | 54 (53.5%) | 26 (59.1%) |
| Fuel Oil or Kerosene | 9 (8.9%) | 17 (38.6%) |
| Coal or Coke | 0 (0.0%) | 0 (0.0%) |
| All other Fuels | 1 (1.0%) | 0 (0.0%) |
| No Fuel Used | 0 (0.0%) | 1 (2.3%) |
| Total | 101 (100.0%) | 44 (100.0%) |
Household Vehicle Usage in Michigan City
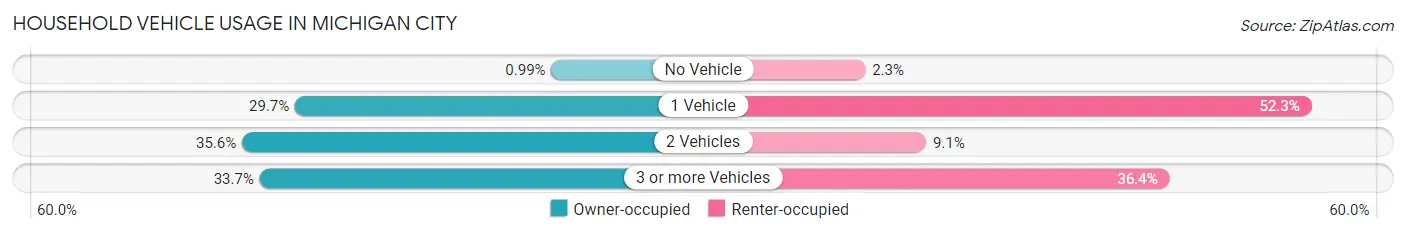
| Vehicles per Household | Owner-occupied | Renter-occupied |
| No Vehicle | 1 (1.0%) | 1 (2.3%) |
| 1 Vehicle | 30 (29.7%) | 23 (52.3%) |
| 2 Vehicles | 36 (35.6%) | 4 (9.1%) |
| 3 or more Vehicles | 34 (33.7%) | 16 (36.4%) |
| Total | 101 (100.0%) | 44 (100.0%) |
Real Estate & Mortgages in Michigan City
Real Estate and Mortgage Overview in Michigan City
| Characteristic | Without Mortgage | With Mortgage |
| Housing Units | 60 | 41 |
| Median Property Value | $53,800 | $119,600 |
| Median Household Income | $55,000 | $10 |
| Monthly Housing Costs | $436 | $0 |
| Real Estate Taxes | $569 | $0 |
Property Value by Mortgage Status in Michigan City
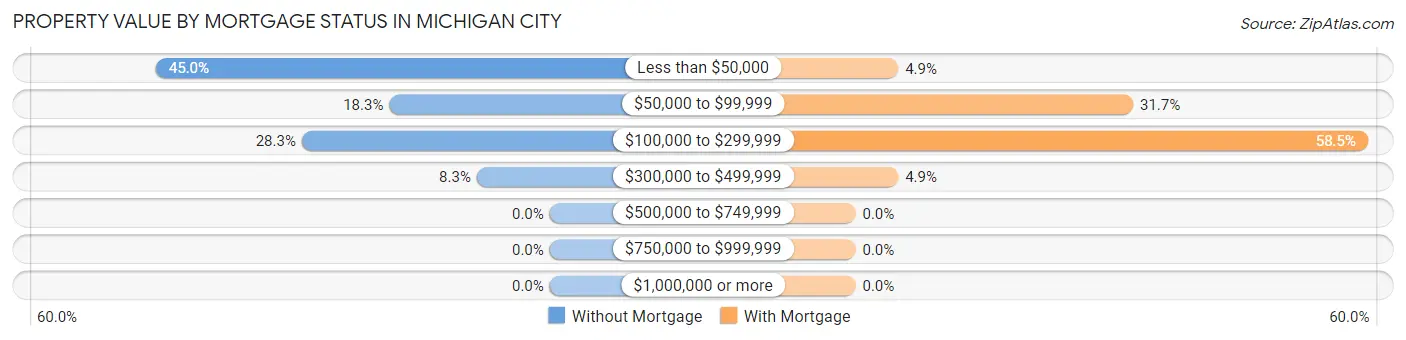
| Property Value | Without Mortgage | With Mortgage |
| Less than $50,000 | 27 (45.0%) | 2 (4.9%) |
| $50,000 to $99,999 | 11 (18.3%) | 13 (31.7%) |
| $100,000 to $299,999 | 17 (28.3%) | 24 (58.5%) |
| $300,000 to $499,999 | 5 (8.3%) | 2 (4.9%) |
| $500,000 to $749,999 | 0 (0.0%) | 0 (0.0%) |
| $750,000 to $999,999 | 0 (0.0%) | 0 (0.0%) |
| $1,000,000 or more | 0 (0.0%) | 0 (0.0%) |
| Total | 60 (100.0%) | 41 (100.0%) |
Household Income by Mortgage Status in Michigan City
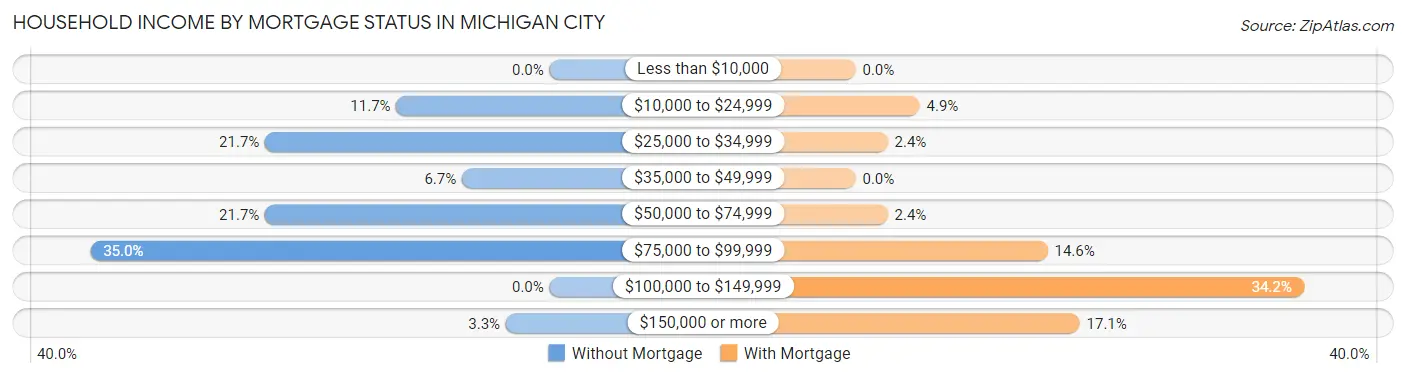
| Household Income | Without Mortgage | With Mortgage |
| Less than $10,000 | 0 (0.0%) | 0 (0.0%) |
| $10,000 to $24,999 | 7 (11.7%) | 2 (4.9%) |
| $25,000 to $34,999 | 13 (21.7%) | 1 (2.4%) |
| $35,000 to $49,999 | 4 (6.7%) | 0 (0.0%) |
| $50,000 to $74,999 | 13 (21.7%) | 1 (2.4%) |
| $75,000 to $99,999 | 21 (35.0%) | 6 (14.6%) |
| $100,000 to $149,999 | 0 (0.0%) | 14 (34.2%) |
| $150,000 or more | 2 (3.3%) | 7 (17.1%) |
| Total | 60 (100.0%) | 41 (100.0%) |
Property Value to Household Income Ratio in Michigan City
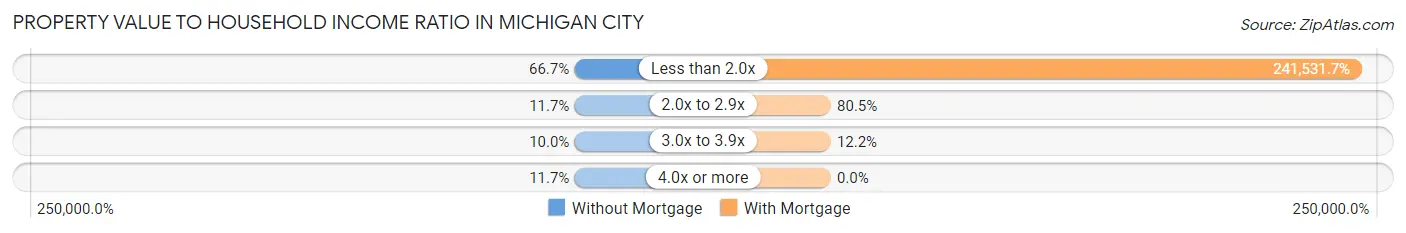
| Value-to-Income Ratio | Without Mortgage | With Mortgage |
| Less than 2.0x | 40 (66.7%) | 99,028 (241,531.7%) |
| 2.0x to 2.9x | 7 (11.7%) | 33 (80.5%) |
| 3.0x to 3.9x | 6 (10.0%) | 5 (12.2%) |
| 4.0x or more | 7 (11.7%) | 0 (0.0%) |
| Total | 60 (100.0%) | 41 (100.0%) |
Real Estate Taxes by Mortgage Status in Michigan City
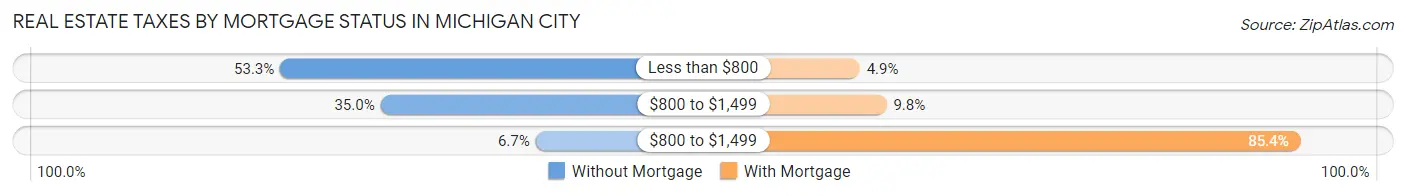
| Property Taxes | Without Mortgage | With Mortgage |
| Less than $800 | 32 (53.3%) | 2 (4.9%) |
| $800 to $1,499 | 21 (35.0%) | 4 (9.8%) |
| $800 to $1,499 | 4 (6.7%) | 35 (85.4%) |
| Total | 60 (100.0%) | 41 (100.0%) |
Health & Disability in Michigan City
Health Insurance Coverage by Age in Michigan City
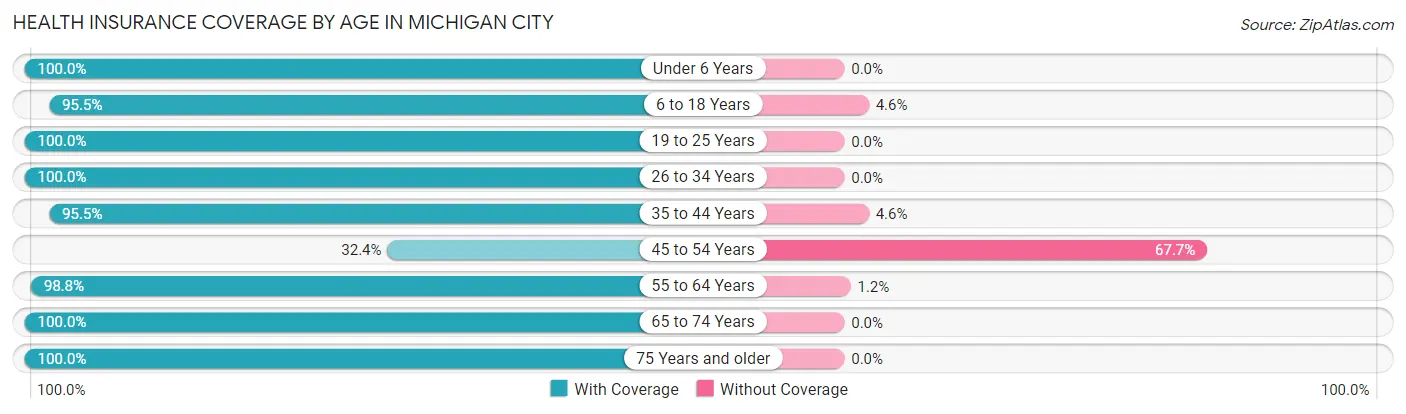
| Age Bracket | With Coverage | Without Coverage |
| Under 6 Years | 2 (100.0%) | 0 (0.0%) |
| 6 to 18 Years | 42 (95.5%) | 2 (4.5%) |
| 19 to 25 Years | 9 (100.0%) | 0 (0.0%) |
| 26 to 34 Years | 42 (100.0%) | 0 (0.0%) |
| 35 to 44 Years | 42 (95.5%) | 2 (4.5%) |
| 45 to 54 Years | 11 (32.4%) | 23 (67.6%) |
| 55 to 64 Years | 85 (98.8%) | 1 (1.2%) |
| 65 to 74 Years | 33 (100.0%) | 0 (0.0%) |
| 75 Years and older | 18 (100.0%) | 0 (0.0%) |
| Total | 284 (91.0%) | 28 (9.0%) |
Health Insurance Coverage by Citizenship Status in Michigan City
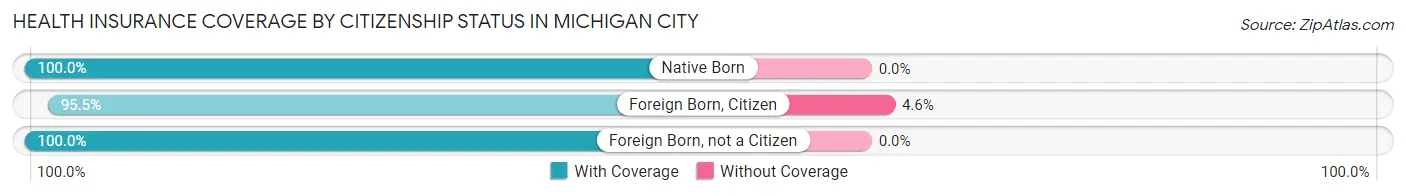
| Citizenship Status | With Coverage | Without Coverage |
| Native Born | 2 (100.0%) | 0 (0.0%) |
| Foreign Born, Citizen | 42 (95.5%) | 2 (4.5%) |
| Foreign Born, not a Citizen | 9 (100.0%) | 0 (0.0%) |
Health Insurance Coverage by Household Income in Michigan City
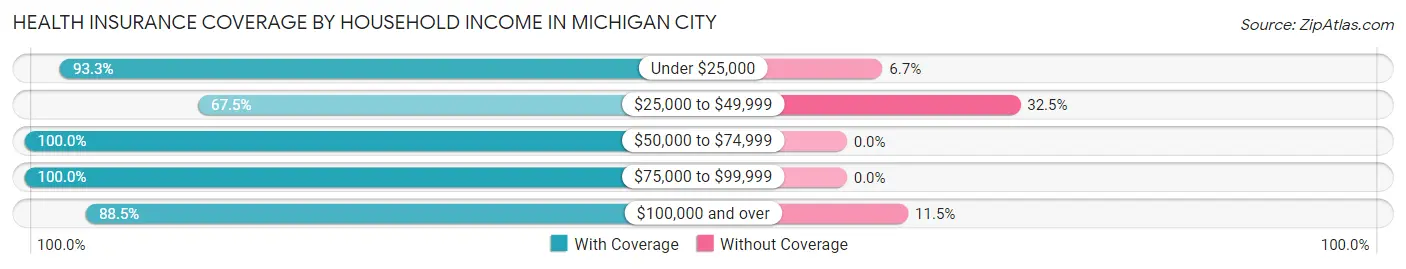
| Household Income | With Coverage | Without Coverage |
| Under $25,000 | 28 (93.3%) | 2 (6.7%) |
| $25,000 to $49,999 | 27 (67.5%) | 13 (32.5%) |
| $50,000 to $74,999 | 38 (100.0%) | 0 (0.0%) |
| $75,000 to $99,999 | 91 (100.0%) | 0 (0.0%) |
| $100,000 and over | 100 (88.5%) | 13 (11.5%) |
Public vs Private Health Insurance Coverage by Age in Michigan City
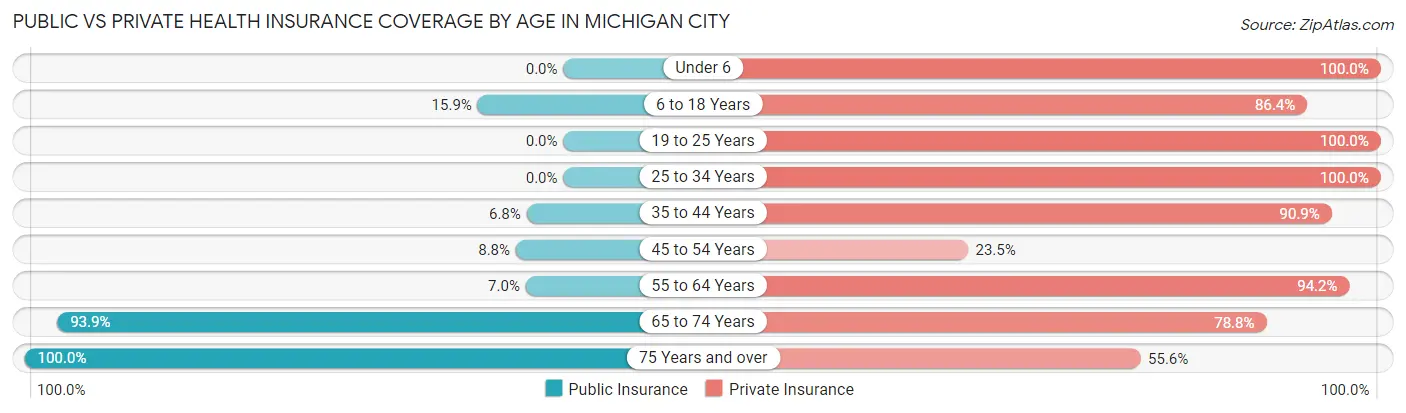
| Age Bracket | Public Insurance | Private Insurance |
| Under 6 | 0 (0.0%) | 2 (100.0%) |
| 6 to 18 Years | 7 (15.9%) | 38 (86.4%) |
| 19 to 25 Years | 0 (0.0%) | 9 (100.0%) |
| 25 to 34 Years | 0 (0.0%) | 42 (100.0%) |
| 35 to 44 Years | 3 (6.8%) | 40 (90.9%) |
| 45 to 54 Years | 3 (8.8%) | 8 (23.5%) |
| 55 to 64 Years | 6 (7.0%) | 81 (94.2%) |
| 65 to 74 Years | 31 (93.9%) | 26 (78.8%) |
| 75 Years and over | 18 (100.0%) | 10 (55.6%) |
| Total | 68 (21.8%) | 256 (82.1%) |
Disability Status by Sex by Age in Michigan City
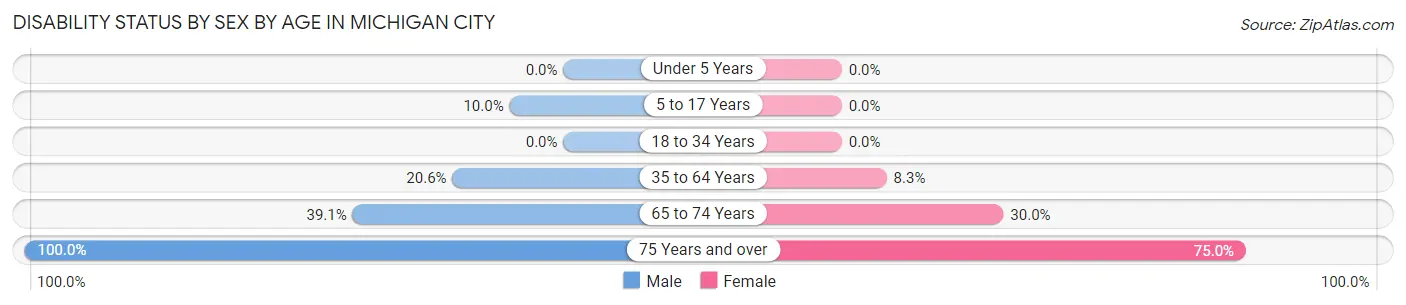
| Age Bracket | Male | Female |
| Under 5 Years | 0 (0.0%) | 0 (0.0%) |
| 5 to 17 Years | 1 (10.0%) | 0 (0.0%) |
| 18 to 34 Years | 0 (0.0%) | 0 (0.0%) |
| 35 to 64 Years | 14 (20.6%) | 8 (8.3%) |
| 65 to 74 Years | 9 (39.1%) | 3 (30.0%) |
| 75 Years and over | 6 (100.0%) | 9 (75.0%) |
Disability Class by Sex by Age in Michigan City
Disability Class: Hearing Difficulty
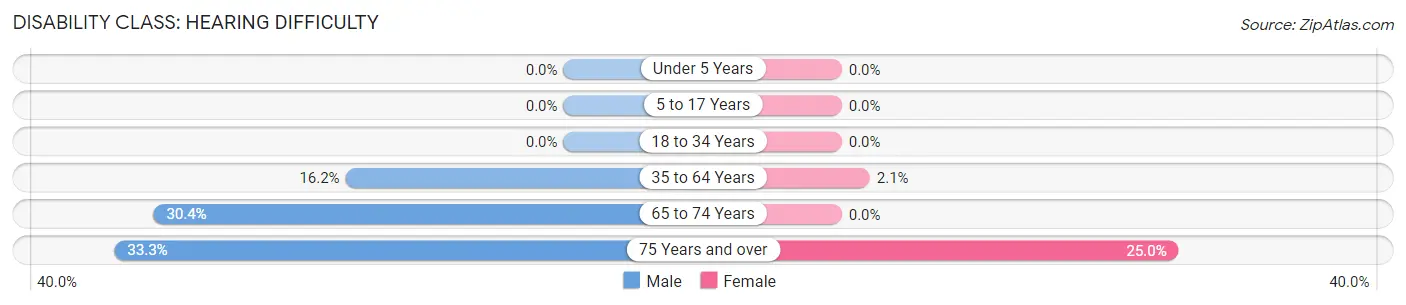
| Age Bracket | Male | Female |
| Under 5 Years | 0 (0.0%) | 0 (0.0%) |
| 5 to 17 Years | 0 (0.0%) | 0 (0.0%) |
| 18 to 34 Years | 0 (0.0%) | 0 (0.0%) |
| 35 to 64 Years | 11 (16.2%) | 2 (2.1%) |
| 65 to 74 Years | 7 (30.4%) | 0 (0.0%) |
| 75 Years and over | 2 (33.3%) | 3 (25.0%) |
Disability Class: Vision Difficulty
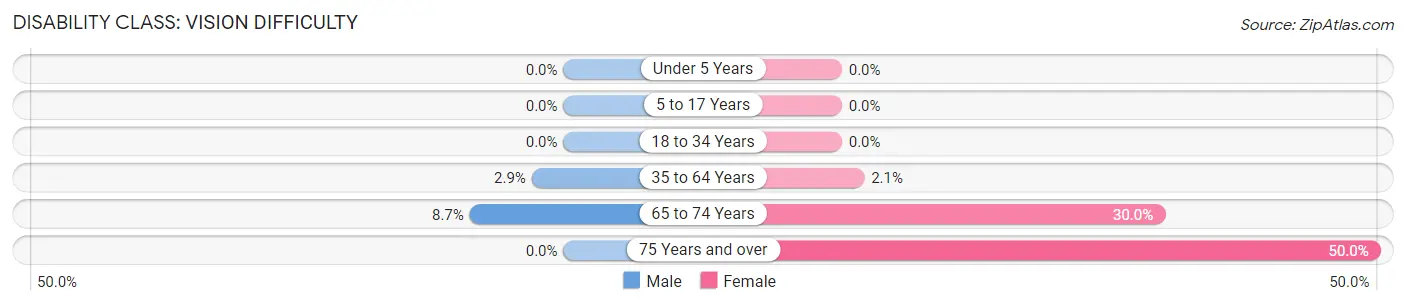
| Age Bracket | Male | Female |
| Under 5 Years | 0 (0.0%) | 0 (0.0%) |
| 5 to 17 Years | 0 (0.0%) | 0 (0.0%) |
| 18 to 34 Years | 0 (0.0%) | 0 (0.0%) |
| 35 to 64 Years | 2 (2.9%) | 2 (2.1%) |
| 65 to 74 Years | 2 (8.7%) | 3 (30.0%) |
| 75 Years and over | 0 (0.0%) | 6 (50.0%) |
Disability Class: Cognitive Difficulty
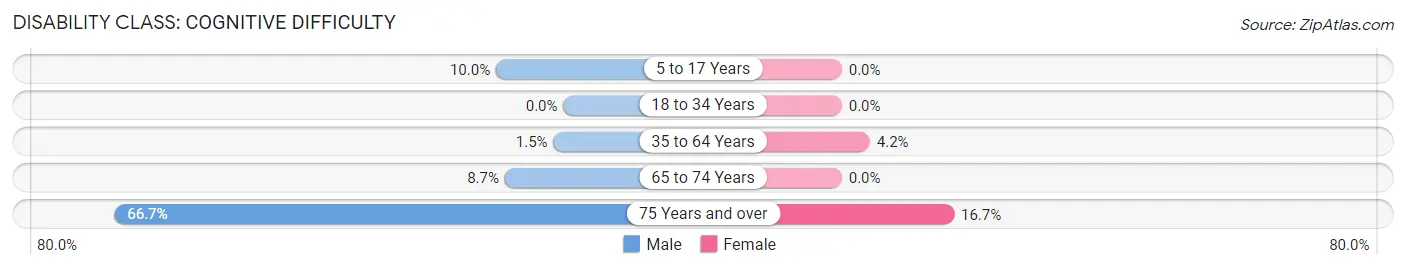
| Age Bracket | Male | Female |
| 5 to 17 Years | 1 (10.0%) | 0 (0.0%) |
| 18 to 34 Years | 0 (0.0%) | 0 (0.0%) |
| 35 to 64 Years | 1 (1.5%) | 4 (4.2%) |
| 65 to 74 Years | 2 (8.7%) | 0 (0.0%) |
| 75 Years and over | 4 (66.7%) | 2 (16.7%) |
Disability Class: Ambulatory Difficulty
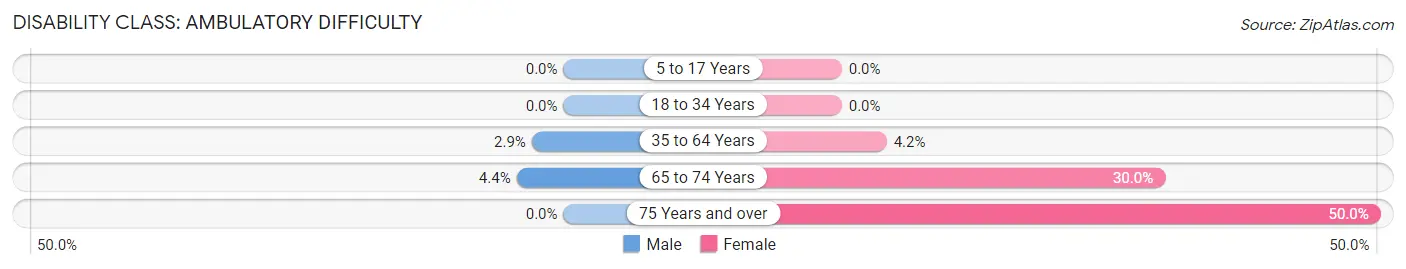
| Age Bracket | Male | Female |
| 5 to 17 Years | 0 (0.0%) | 0 (0.0%) |
| 18 to 34 Years | 0 (0.0%) | 0 (0.0%) |
| 35 to 64 Years | 2 (2.9%) | 4 (4.2%) |
| 65 to 74 Years | 1 (4.3%) | 3 (30.0%) |
| 75 Years and over | 0 (0.0%) | 6 (50.0%) |
Disability Class: Self-Care Difficulty
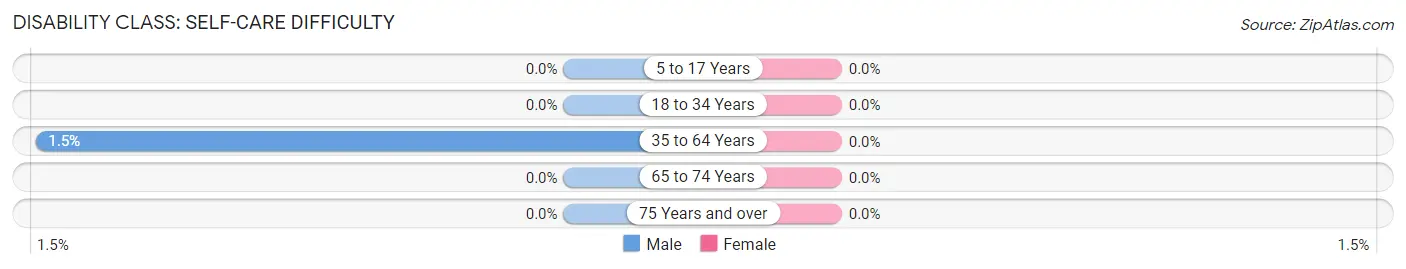
| Age Bracket | Male | Female |
| 5 to 17 Years | 0 (0.0%) | 0 (0.0%) |
| 18 to 34 Years | 0 (0.0%) | 0 (0.0%) |
| 35 to 64 Years | 1 (1.5%) | 0 (0.0%) |
| 65 to 74 Years | 0 (0.0%) | 0 (0.0%) |
| 75 Years and over | 0 (0.0%) | 0 (0.0%) |
Technology Access in Michigan City
Computing Device Access in Michigan City
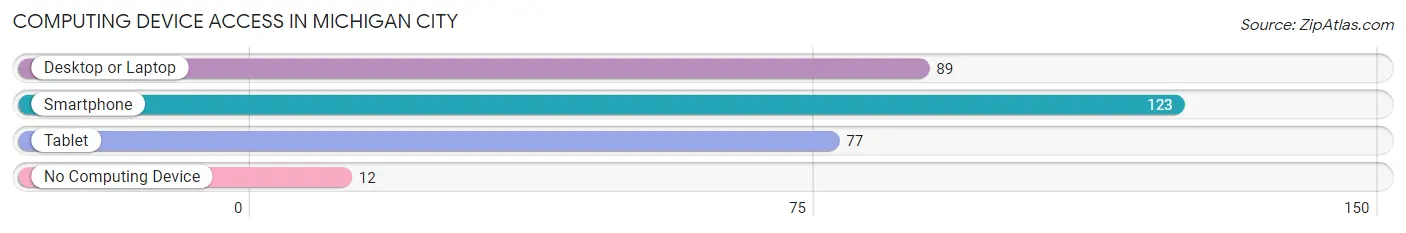
| Device Type | # Households | % Households |
| Desktop or Laptop | 89 | 61.4% |
| Smartphone | 123 | 84.8% |
| Tablet | 77 | 53.1% |
| No Computing Device | 12 | 8.3% |
| Total | 145 | 100.0% |
Internet Access in Michigan City
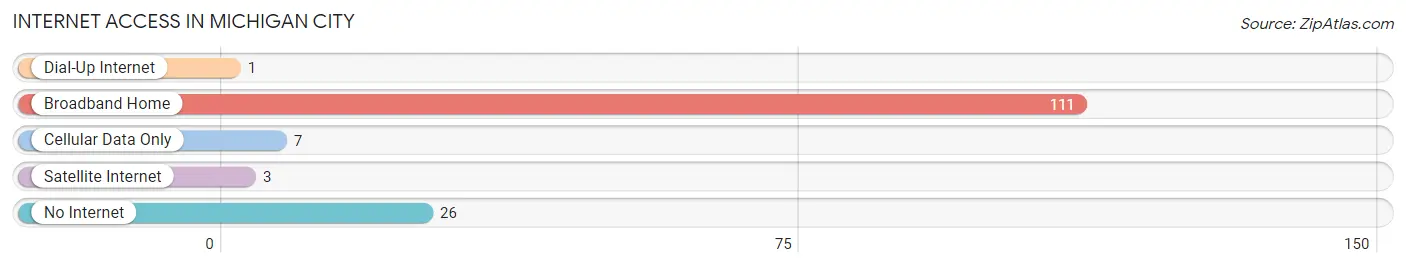
| Internet Type | # Households | % Households |
| Dial-Up Internet | 1 | 0.7% |
| Broadband Home | 111 | 76.5% |
| Cellular Data Only | 7 | 4.8% |
| Satellite Internet | 3 | 2.1% |
| No Internet | 26 | 17.9% |
| Total | 145 | 100.0% |
Michigan City Summary
Michigan City is a small city located in the state of North Dakota. It is located in the southeastern corner of the state, near the border with Minnesota. The city has a population of approximately 1,000 people and is the county seat of Traill County.
History
Michigan City was founded in 1881 by a group of settlers from Michigan. The city was named after the state of Michigan, and the settlers hoped to create a city that was similar to the one they had left behind. The city was incorporated in 1883 and quickly grew to become a thriving community.
The city was an important stop on the Great Northern Railway, which connected the city to the rest of the state and the country. The railway brought in new settlers and businesses, and the city quickly grew. By the early 1900s, Michigan City had become a bustling town with a variety of businesses, including a bank, a hotel, a newspaper, and a variety of stores.
Geography
Michigan City is located in the southeastern corner of North Dakota, near the border with Minnesota. The city is situated on the banks of the Red River, which flows through the city and provides a source of water for the area. The city is surrounded by rolling hills and farmland, and is located in the Red River Valley.
The climate in Michigan City is typical of the northern plains, with cold winters and hot summers. The average temperature in the winter is around 20 degrees Fahrenheit, and the average temperature in the summer is around 80 degrees Fahrenheit.
Economy
The economy of Michigan City is largely based on agriculture. The city is located in the heart of the Red River Valley, which is one of the most productive agricultural regions in the country. The city is home to a variety of farms, including dairy farms, grain farms, and livestock farms.
The city also has a variety of businesses, including a bank, a hotel, a newspaper, and a variety of stores. The city is also home to a number of manufacturing companies, including a furniture factory and a metal fabrication plant.
Demographics
As of the 2010 census, the population of Michigan City was 1,000 people. The racial makeup of the city was 97.2% White, 0.7% African American, 0.3% Native American, 0.2% Asian, and 1.6% from other races. The median household income was $37,500, and the median family income was $45,000.
Conclusion
Michigan City is a small city located in the southeastern corner of North Dakota. The city has a population of approximately 1,000 people and is the county seat of Traill County. The city was founded in 1881 by a group of settlers from Michigan, and was an important stop on the Great Northern Railway. The economy of Michigan City is largely based on agriculture, and the city is home to a variety of businesses. The racial makeup of the city is 97.2% White, 0.7% African American, 0.3% Native American, 0.2% Asian, and 1.6% from other races. The median household income was $37,500, and the median family income was $45,000.
Common Questions
What is Per Capita Income in Michigan City?
Per Capita income in Michigan City is $39,070.
What is the Median Family Income in Michigan City?
Median Family Income in Michigan City is $82,500.
What is the Median Household income in Michigan City?
Median Household Income in Michigan City is $71,875.
What is Income or Wage Gap in Michigan City?
Income or Wage Gap in Michigan City is 3.1%.
Women in Michigan City earn 96.9 cents for every dollar earned by a man.
What is Inequality or Gini Index in Michigan City?
Inequality or Gini Index in Michigan City is 0.39.
What is the Total Population of Michigan City?
Total Population of Michigan City is 312.
What is the Total Male Population of Michigan City?
Total Male Population of Michigan City is 140.
What is the Total Female Population of Michigan City?
Total Female Population of Michigan City is 172.
What is the Ratio of Males per 100 Females in Michigan City?
There are 81.40 Males per 100 Females in Michigan City.
What is the Ratio of Females per 100 Males in Michigan City?
There are 122.86 Females per 100 Males in Michigan City.
What is the Median Population Age in Michigan City?
Median Population Age in Michigan City is 45.9 Years.
What is the Average Family Size in Michigan City
Average Family Size in Michigan City is 2.8 People.
What is the Average Household Size in Michigan City
Average Household Size in Michigan City is 2.1 People.
How Large is the Labor Force in Michigan City?
There are 213 People in the Labor Forcein in Michigan City.
What is the Percentage of People in the Labor Force in Michigan City?
75.5% of People are in the Labor Force in Michigan City.