Napoleon, ND Map & Demographics
Napoleon Map
Napoleon Overview
$29,897
PER CAPITA INCOME
$72,768
AVG FAMILY INCOME
$59,318
AVG HOUSEHOLD INCOME
48.9%
WAGE / INCOME GAP [ % ]
51.1¢/ $1
WAGE / INCOME GAP [ $ ]
0.42
INEQUALITY / GINI INDEX
808
TOTAL POPULATION
375
MALE POPULATION
433
FEMALE POPULATION
86.61
MALES / 100 FEMALES
115.47
FEMALES / 100 MALES
44.3
MEDIAN AGE
3.0
AVG FAMILY SIZE
2.2
AVG HOUSEHOLD SIZE
395
LABOR FORCE [ PEOPLE ]
60.7%
PERCENT IN LABOR FORCE
0.5%
UNEMPLOYMENT RATE
Napoleon Zip Codes
Napoleon Area Codes
Income in Napoleon
Income Overview in Napoleon
Per Capita Income in Napoleon is $29,897, while median incomes of families and households are $72,768 and $59,318 respectively.
| Characteristic | Number | Measure |
| Per Capita Income | 808 | $29,897 |
| Median Family Income | 211 | $72,768 |
| Mean Family Income | 211 | $72,584 |
| Median Household Income | 348 | $59,318 |
| Mean Household Income | 348 | $67,399 |
| Income Deficit | 211 | $0 |
| Wage / Income Gap (%) | 808 | 48.92% |
| Wage / Income Gap ($) | 808 | 51.08¢ per $1 |
| Gini / Inequality Index | 808 | 0.42 |
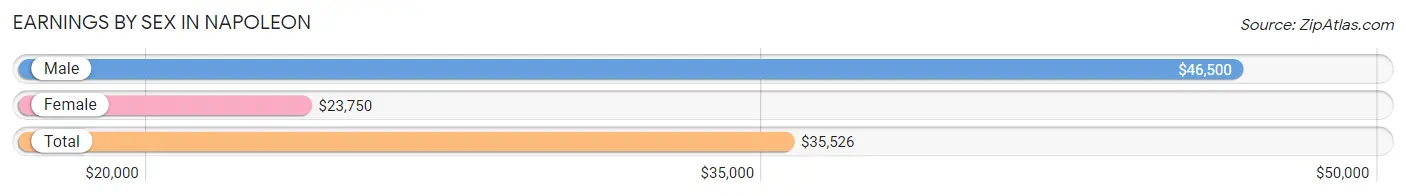
Earnings by Sex in Napoleon
Average Earnings in Napoleon are $35,526, $46,500 for men and $23,750 for women, a difference of 48.9%.
| Sex | Number | Average Earnings |
| Male | 236 (57.8%) | $46,500 |
| Female | 172 (42.2%) | $23,750 |
| Total | 408 (100.0%) | $35,526 |
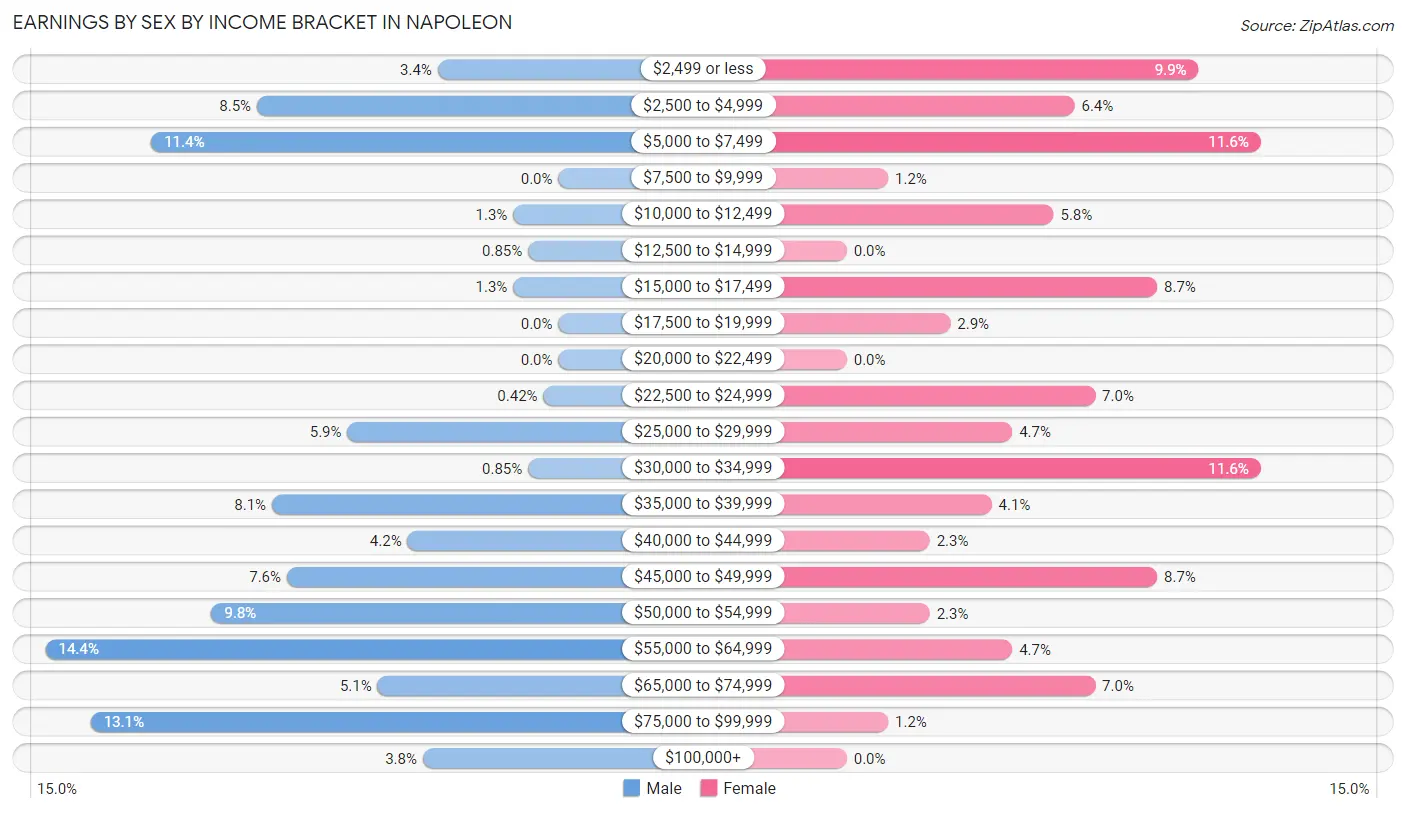
Earnings by Sex by Income Bracket in Napoleon
The most common earnings brackets in Napoleon are $55,000 to $64,999 for men (34 | 14.4%) and $5,000 to $7,499 for women (20 | 11.6%).
| Income | Male | Female |
| $2,499 or less | 8 (3.4%) | 17 (9.9%) |
| $2,500 to $4,999 | 20 (8.5%) | 11 (6.4%) |
| $5,000 to $7,499 | 27 (11.4%) | 20 (11.6%) |
| $7,500 to $9,999 | 0 (0.0%) | 2 (1.2%) |
| $10,000 to $12,499 | 3 (1.3%) | 10 (5.8%) |
| $12,500 to $14,999 | 2 (0.9%) | 0 (0.0%) |
| $15,000 to $17,499 | 3 (1.3%) | 15 (8.7%) |
| $17,500 to $19,999 | 0 (0.0%) | 5 (2.9%) |
| $20,000 to $22,499 | 0 (0.0%) | 0 (0.0%) |
| $22,500 to $24,999 | 1 (0.4%) | 12 (7.0%) |
| $25,000 to $29,999 | 14 (5.9%) | 8 (4.6%) |
| $30,000 to $34,999 | 2 (0.9%) | 20 (11.6%) |
| $35,000 to $39,999 | 19 (8.1%) | 7 (4.1%) |
| $40,000 to $44,999 | 10 (4.2%) | 4 (2.3%) |
| $45,000 to $49,999 | 18 (7.6%) | 15 (8.7%) |
| $50,000 to $54,999 | 23 (9.8%) | 4 (2.3%) |
| $55,000 to $64,999 | 34 (14.4%) | 8 (4.6%) |
| $65,000 to $74,999 | 12 (5.1%) | 12 (7.0%) |
| $75,000 to $99,999 | 31 (13.1%) | 2 (1.2%) |
| $100,000+ | 9 (3.8%) | 0 (0.0%) |
| Total | 236 (100.0%) | 172 (100.0%) |
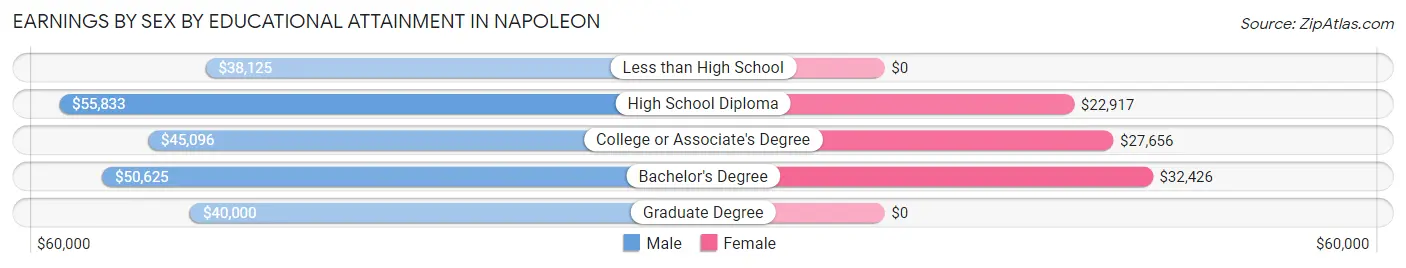
Earnings by Sex by Educational Attainment in Napoleon
Average earnings in Napoleon are $46,833 for men and $30,147 for women, a difference of 35.6%. Men with an educational attainment of high school diploma enjoy the highest average annual earnings of $55,833, while those with less than high school education earn the least with $38,125. Women with an educational attainment of bachelor's degree earn the most with the average annual earnings of $32,426, while those with high school diploma education have the smallest earnings of $22,917.
| Educational Attainment | Male Income | Female Income |
| Less than High School | $38,125 | $0 |
| High School Diploma | $55,833 | $22,917 |
| College or Associate's Degree | $45,096 | $27,656 |
| Bachelor's Degree | $50,625 | $32,426 |
| Graduate Degree | $40,000 | $0 |
| Total | $46,833 | $30,147 |
Family Income in Napoleon
Family Income Brackets in Napoleon
According to the Napoleon family income data, there are 55 families falling into the $75,000 to $99,999 income range, which is the most common income bracket and makes up 26.1% of all families.
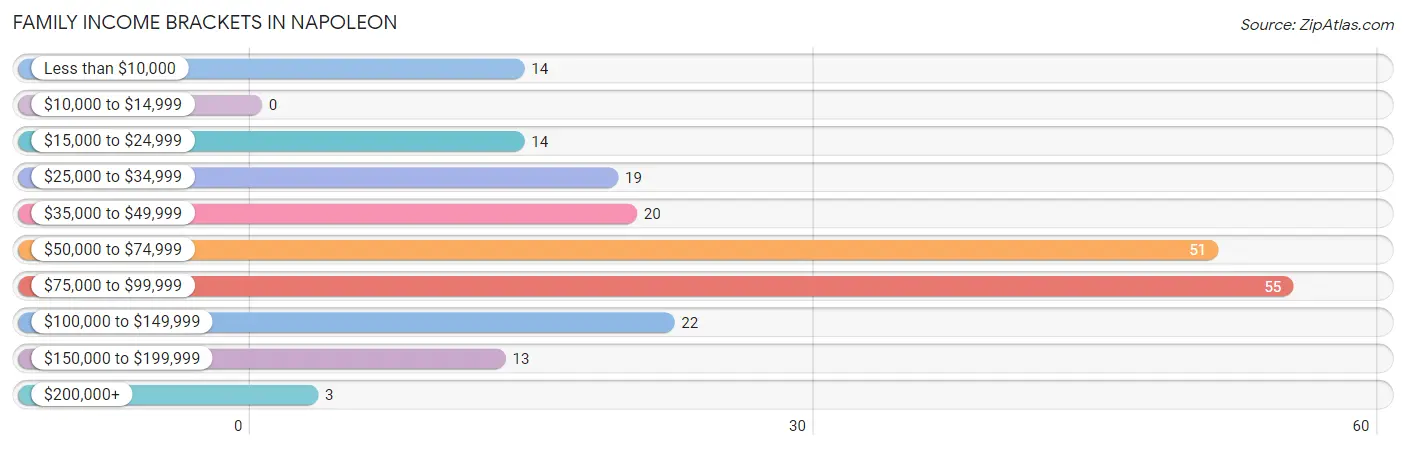
| Income Bracket | # Families | % Families |
| Less than $10,000 | 14 | 6.6% |
| $10,000 to $14,999 | 0 | 0.0% |
| $15,000 to $24,999 | 14 | 6.6% |
| $25,000 to $34,999 | 19 | 9.0% |
| $35,000 to $49,999 | 20 | 9.5% |
| $50,000 to $74,999 | 51 | 24.2% |
| $75,000 to $99,999 | 55 | 26.1% |
| $100,000 to $149,999 | 22 | 10.4% |
| $150,000 to $199,999 | 13 | 6.2% |
| $200,000+ | 3 | 1.4% |
Family Income by Famaliy Size in Napoleon
5-person families (22 | 10.4%) account for the highest median family income in Napoleon with $78,125 per family, while 2-person families (139 | 65.9%) have the highest median income of $34,375 per family member.
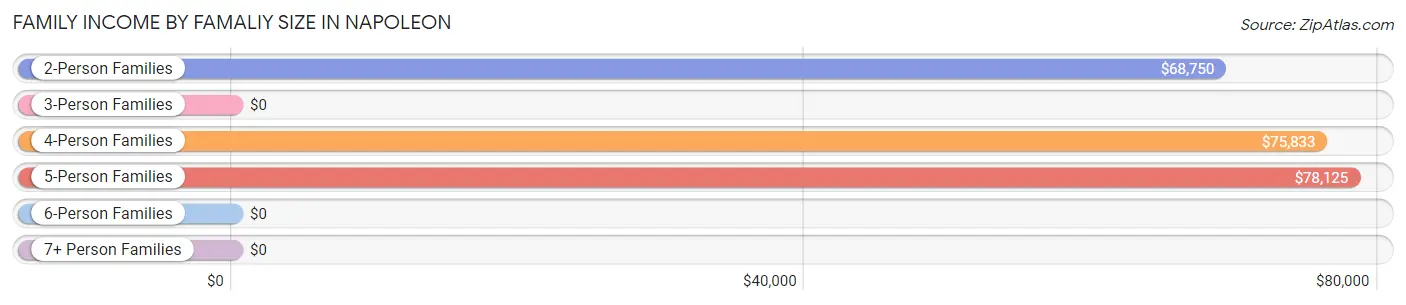
| Income Bracket | # Families | Median Income |
| 2-Person Families | 139 (65.9%) | $68,750 |
| 3-Person Families | 6 (2.8%) | $0 |
| 4-Person Families | 32 (15.2%) | $75,833 |
| 5-Person Families | 22 (10.4%) | $78,125 |
| 6-Person Families | 5 (2.4%) | $0 |
| 7+ Person Families | 7 (3.3%) | $0 |
| Total | 211 (100.0%) | $72,768 |
Family Income by Number of Earners in Napoleon
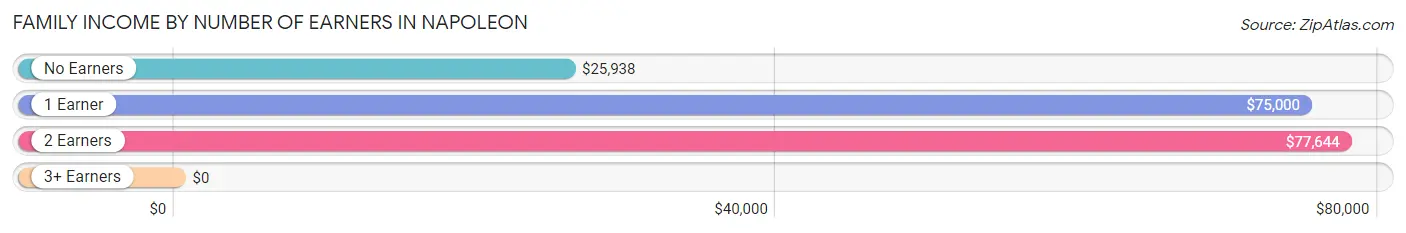
| Number of Earners | # Families | Median Income |
| No Earners | 49 (23.2%) | $25,938 |
| 1 Earner | 34 (16.1%) | $75,000 |
| 2 Earners | 117 (55.4%) | $77,644 |
| 3+ Earners | 11 (5.2%) | $0 |
| Total | 211 (100.0%) | $72,768 |
Household Income in Napoleon
Household Income Brackets in Napoleon
With 69 households falling in the category, the $50,000 to $74,999 income range is the most frequent in Napoleon, accounting for 19.8% of all households. In contrast, only 3 households (0.9%) fall into the $10,000 to $14,999 income bracket, making it the least populous group.
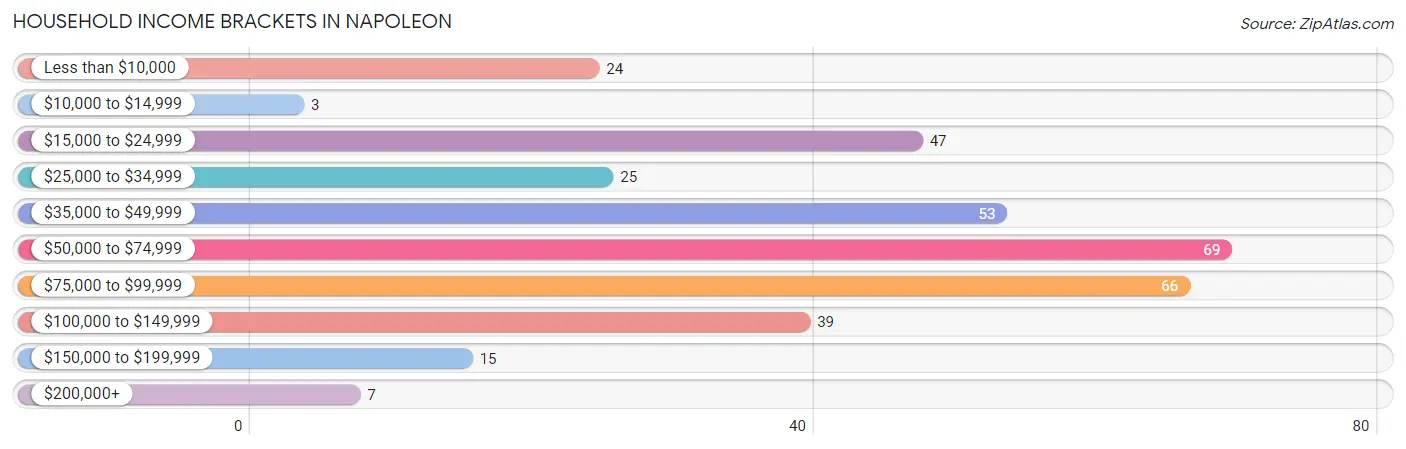
| Income Bracket | # Households | % Households |
| Less than $10,000 | 24 | 6.9% |
| $10,000 to $14,999 | 3 | 0.9% |
| $15,000 to $24,999 | 47 | 13.5% |
| $25,000 to $34,999 | 25 | 7.2% |
| $35,000 to $49,999 | 53 | 15.2% |
| $50,000 to $74,999 | 69 | 19.8% |
| $75,000 to $99,999 | 66 | 19.0% |
| $100,000 to $149,999 | 39 | 11.2% |
| $150,000 to $199,999 | 15 | 4.3% |
| $200,000+ | 7 | 2.0% |
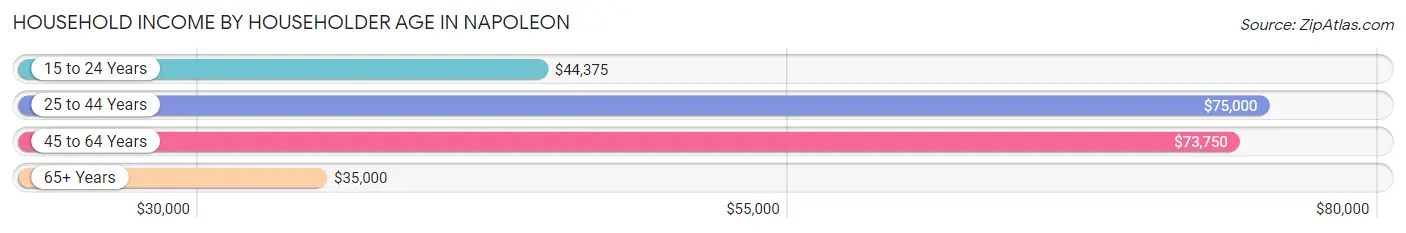
Household Income by Householder Age in Napoleon
The median household income in Napoleon is $59,318, with the highest median household income of $75,000 found in the 25 to 44 years age bracket for the primary householder. A total of 104 households (29.9%) fall into this category. Meanwhile, the 65+ years age bracket for the primary householder has the lowest median household income of $35,000, with 132 households (37.9%) in this group.
| Income Bracket | # Households | Median Income |
| 15 to 24 Years | 9 (2.6%) | $44,375 |
| 25 to 44 Years | 104 (29.9%) | $75,000 |
| 45 to 64 Years | 103 (29.6%) | $73,750 |
| 65+ Years | 132 (37.9%) | $35,000 |
| Total | 348 (100.0%) | $59,318 |
Poverty in Napoleon
Income Below Poverty by Sex and Age in Napoleon
With 4.9% poverty level for males and 9.5% for females among the residents of Napoleon, 18 to 24 year old males and 55 to 64 year old females are the most vulnerable to poverty, with 2 males (20.0%) and 11 females (21.1%) in their respective age groups living below the poverty level.
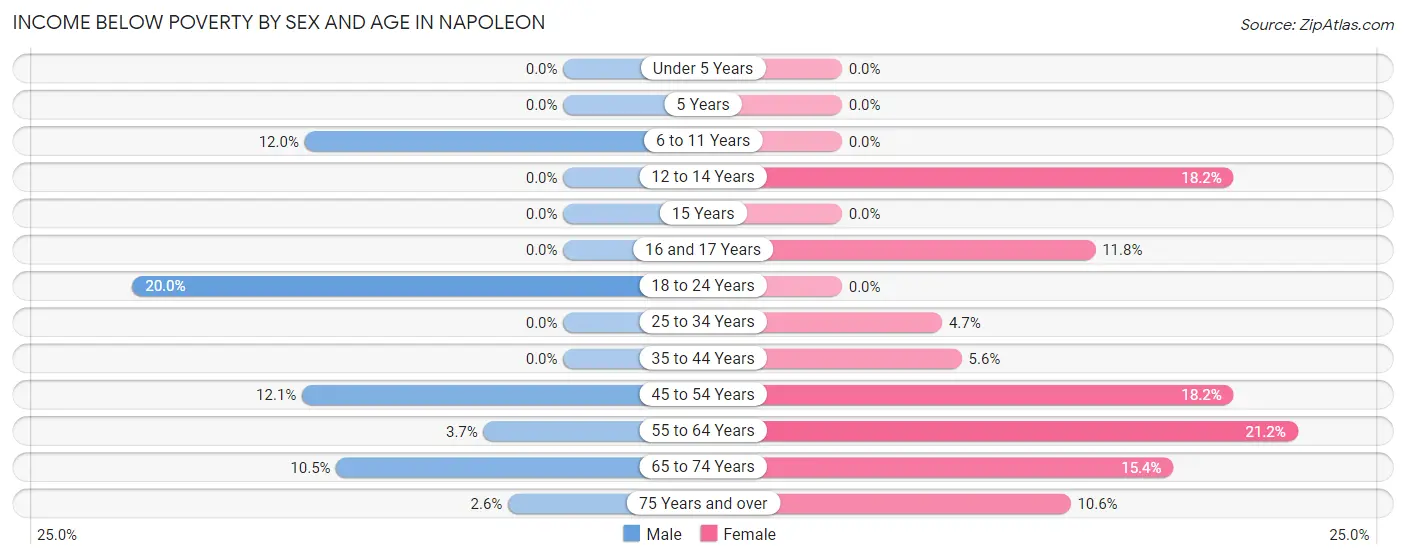
| Age Bracket | Male | Female |
| Under 5 Years | 0 (0.0%) | 0 (0.0%) |
| 5 Years | 0 (0.0%) | 0 (0.0%) |
| 6 to 11 Years | 3 (12.0%) | 0 (0.0%) |
| 12 to 14 Years | 0 (0.0%) | 2 (18.2%) |
| 15 Years | 0 (0.0%) | 0 (0.0%) |
| 16 and 17 Years | 0 (0.0%) | 4 (11.8%) |
| 18 to 24 Years | 2 (20.0%) | 0 (0.0%) |
| 25 to 34 Years | 0 (0.0%) | 2 (4.6%) |
| 35 to 44 Years | 0 (0.0%) | 2 (5.6%) |
| 45 to 54 Years | 4 (12.1%) | 6 (18.2%) |
| 55 to 64 Years | 2 (3.7%) | 11 (21.1%) |
| 65 to 74 Years | 6 (10.5%) | 4 (15.4%) |
| 75 Years and over | 1 (2.6%) | 7 (10.6%) |
| Total | 18 (4.9%) | 38 (9.5%) |
Income Above Poverty by Sex and Age in Napoleon
According to the poverty statistics in Napoleon, males aged under 5 years and females aged under 5 years are the age groups that are most secure financially, with 100.0% of males and 100.0% of females in these age groups living above the poverty line.
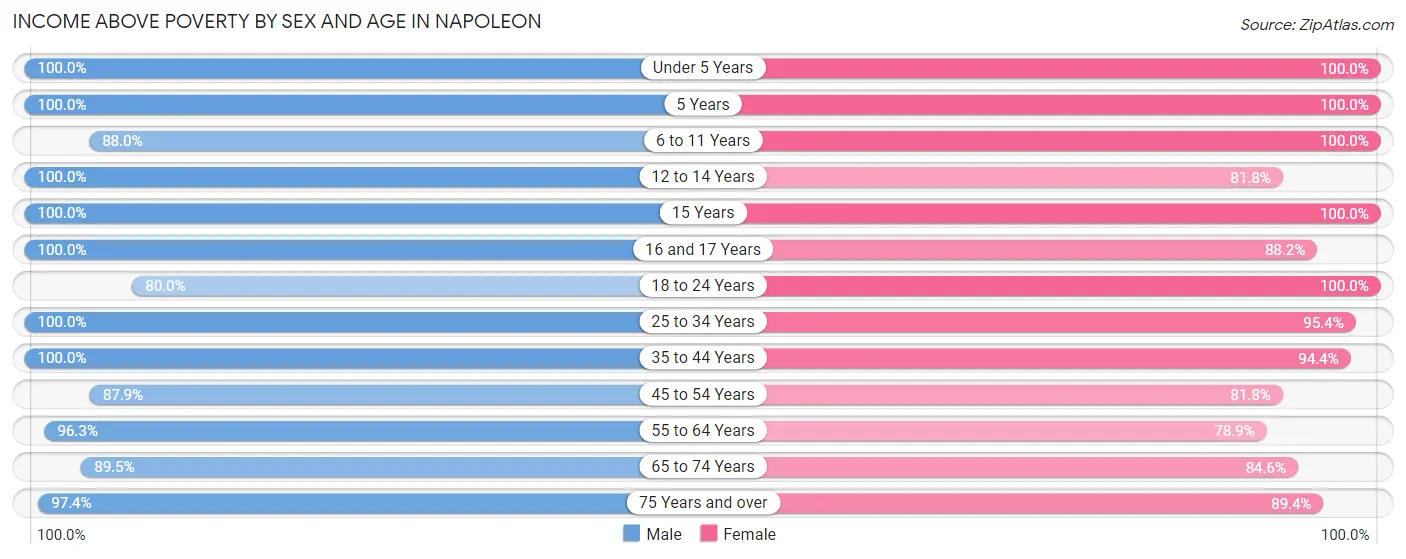
| Age Bracket | Male | Female |
| Under 5 Years | 22 (100.0%) | 26 (100.0%) |
| 5 Years | 4 (100.0%) | 6 (100.0%) |
| 6 to 11 Years | 22 (88.0%) | 24 (100.0%) |
| 12 to 14 Years | 8 (100.0%) | 9 (81.8%) |
| 15 Years | 5 (100.0%) | 26 (100.0%) |
| 16 and 17 Years | 2 (100.0%) | 30 (88.2%) |
| 18 to 24 Years | 8 (80.0%) | 17 (100.0%) |
| 25 to 34 Years | 46 (100.0%) | 41 (95.4%) |
| 35 to 44 Years | 61 (100.0%) | 34 (94.4%) |
| 45 to 54 Years | 29 (87.9%) | 27 (81.8%) |
| 55 to 64 Years | 52 (96.3%) | 41 (78.8%) |
| 65 to 74 Years | 51 (89.5%) | 22 (84.6%) |
| 75 Years and over | 38 (97.4%) | 59 (89.4%) |
| Total | 348 (95.1%) | 362 (90.5%) |
Income Below Poverty Among Married-Couple Families in Napoleon
The poverty statistics for married-couple families in Napoleon show that 7.1% or 14 of the total 198 families live below the poverty line. Families with no children have the highest poverty rate of 9.4%, comprising of 12 families. On the other hand, families with 3 or 4 children have the lowest poverty rate of 0.0%, which includes 0 families.
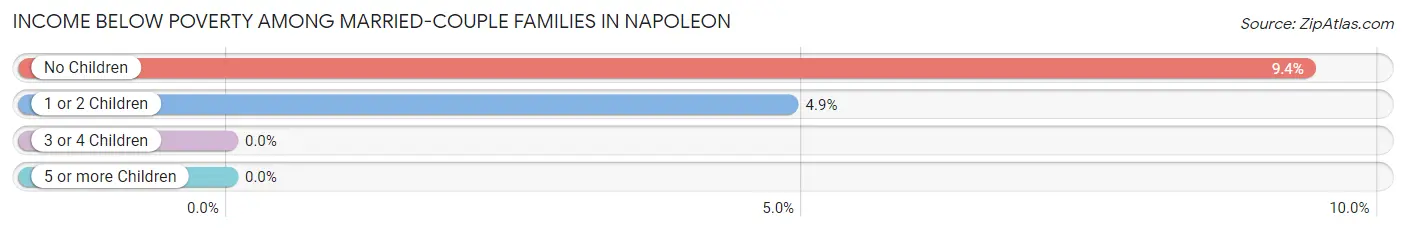
| Children | Above Poverty | Below Poverty |
| No Children | 116 (90.6%) | 12 (9.4%) |
| 1 or 2 Children | 39 (95.1%) | 2 (4.9%) |
| 3 or 4 Children | 27 (100.0%) | 0 (0.0%) |
| 5 or more Children | 2 (100.0%) | 0 (0.0%) |
| Total | 184 (92.9%) | 14 (7.1%) |
Income Below Poverty Among Single-Parent Households in Napoleon
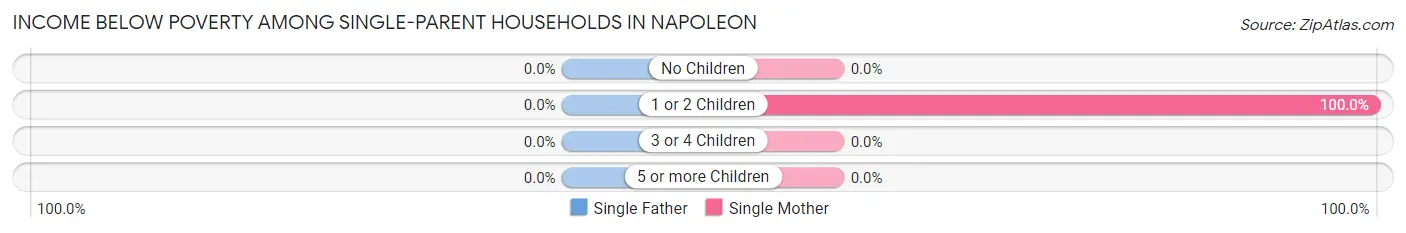
| Children | Single Father | Single Mother |
| No Children | 0 (0.0%) | 0 (0.0%) |
| 1 or 2 Children | 0 (0.0%) | 4 (100.0%) |
| 3 or 4 Children | 0 (0.0%) | 0 (0.0%) |
| 5 or more Children | 0 (0.0%) | 0 (0.0%) |
| Total | 0 (0.0%) | 4 (40.0%) |
Income Below Poverty Among Married-Couple vs Single-Parent Households in Napoleon
The poverty data for Napoleon shows that 14 of the married-couple family households (7.1%) and 4 of the single-parent households (30.8%) are living below the poverty level. Within the married-couple family households, those with no children have the highest poverty rate, with 12 households (9.4%) falling below the poverty line. Among the single-parent households, those with 1 or 2 children have the highest poverty rate, with 4 household (57.1%) living below poverty.
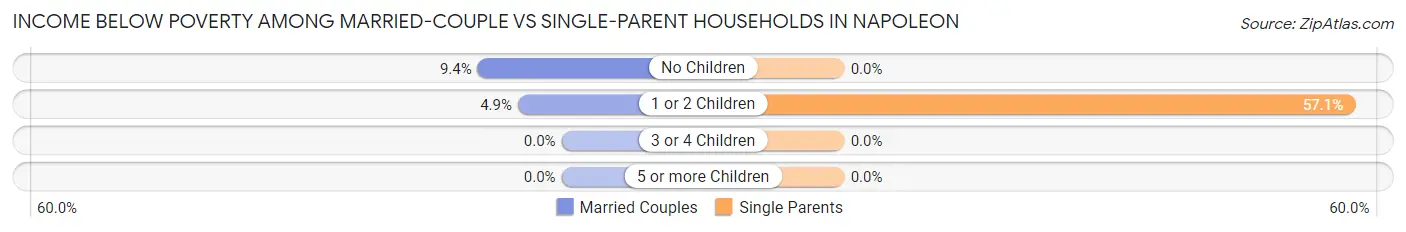
| Children | Married-Couple Families | Single-Parent Households |
| No Children | 12 (9.4%) | 0 (0.0%) |
| 1 or 2 Children | 2 (4.9%) | 4 (57.1%) |
| 3 or 4 Children | 0 (0.0%) | 0 (0.0%) |
| 5 or more Children | 0 (0.0%) | 0 (0.0%) |
| Total | 14 (7.1%) | 4 (30.8%) |
Race in Napoleon
The most populous races in Napoleon are White / Caucasian (805 | 99.6%), Two or more Races (2 | 0.3%), and Asian (1 | 0.1%).
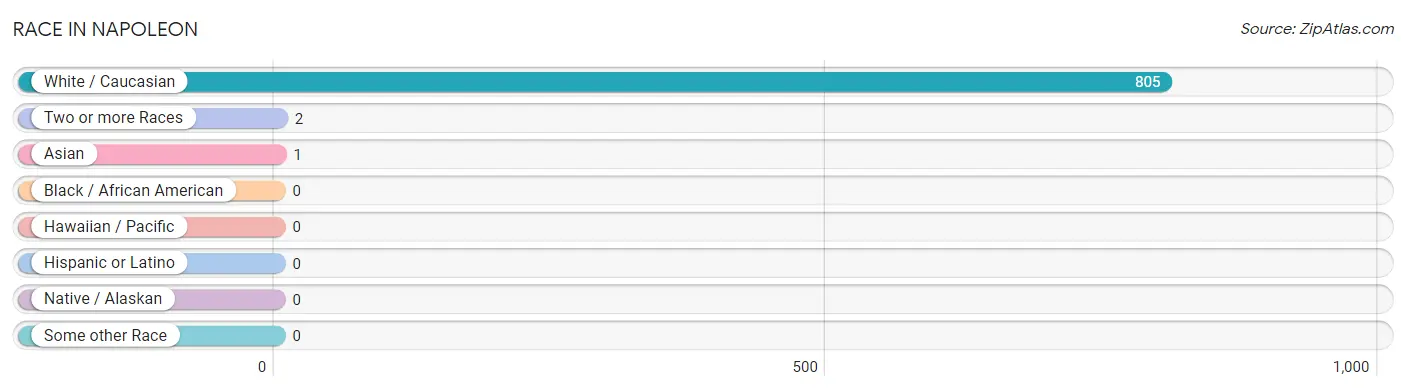
| Race | # Population | % Population |
| Asian | 1 | 0.1% |
| Black / African American | 0 | 0.0% |
| Hawaiian / Pacific | 0 | 0.0% |
| Hispanic or Latino | 0 | 0.0% |
| Native / Alaskan | 0 | 0.0% |
| White / Caucasian | 805 | 99.6% |
| Two or more Races | 2 | 0.3% |
| Some other Race | 0 | 0.0% |
| Total | 808 | 100.0% |
Ancestry in Napoleon
The most populous ancestries reported in Napoleon are German (461 | 57.1%), Russian (131 | 16.2%), Norwegian (82 | 10.2%), Irish (50 | 6.2%), and German Russian (43 | 5.3%), together accounting for 94.9% of all Napoleon residents.
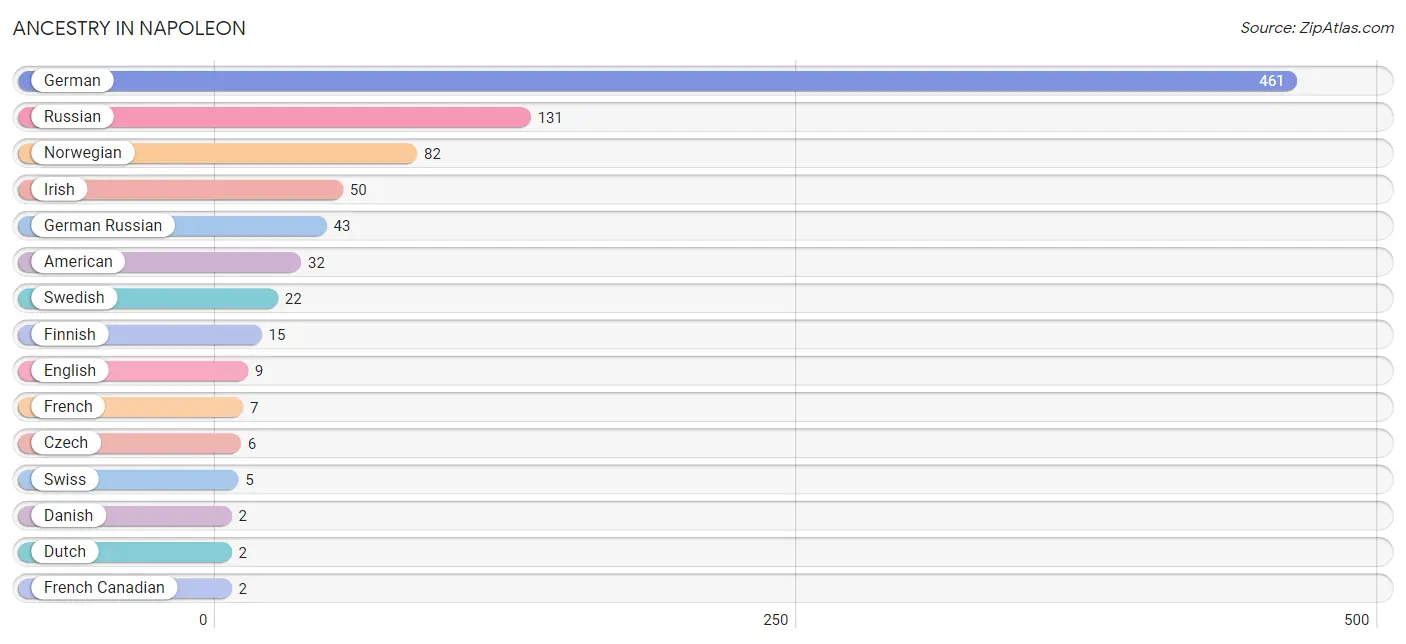
| Ancestry | # Population | % Population |
| American | 32 | 4.0% |
| Czech | 6 | 0.7% |
| Danish | 2 | 0.3% |
| Dutch | 2 | 0.3% |
| English | 9 | 1.1% |
| Finnish | 15 | 1.9% |
| French | 7 | 0.9% |
| French Canadian | 2 | 0.3% |
| German | 461 | 57.1% |
| German Russian | 43 | 5.3% |
| Indian (Asian) | 1 | 0.1% |
| Irish | 50 | 6.2% |
| Italian | 2 | 0.3% |
| Norwegian | 82 | 10.2% |
| Polish | 2 | 0.3% |
| Russian | 131 | 16.2% |
| Swedish | 22 | 2.7% |
| Swiss | 5 | 0.6% | View All 18 Rows |
Immigrants in Napoleon
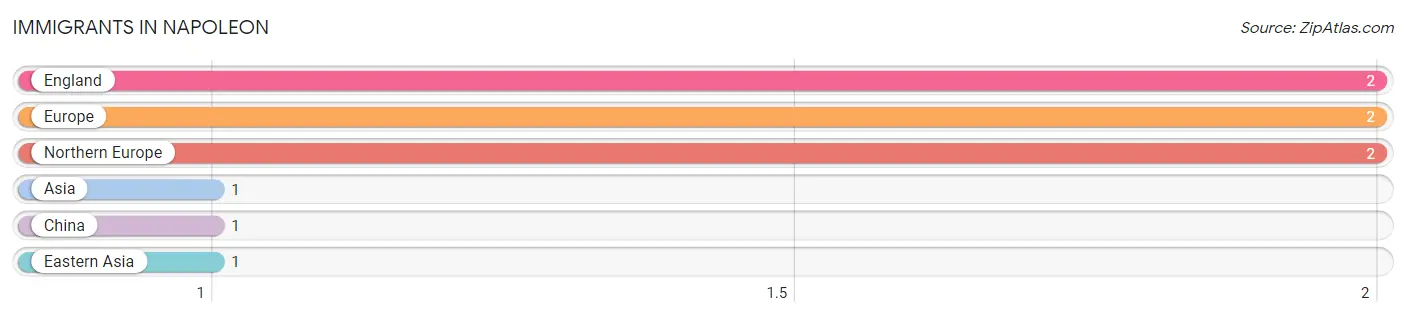
The most numerous immigrant groups reported in Napoleon came from England (2 | 0.3%), Europe (2 | 0.3%), Northern Europe (2 | 0.3%), Asia (1 | 0.1%), and China (1 | 0.1%), together accounting for 1.0% of all Napoleon residents.
| Immigration Origin | # Population | % Population |
| Asia | 1 | 0.1% |
| China | 1 | 0.1% |
| Eastern Asia | 1 | 0.1% |
| England | 2 | 0.3% |
| Europe | 2 | 0.3% |
| Northern Europe | 2 | 0.3% | View All 6 Rows |
Sex and Age in Napoleon
Sex and Age in Napoleon
The most populous age groups in Napoleon are 35 to 39 Years (52 | 13.9%) for men and 15 to 19 Years (71 | 16.4%) for women.
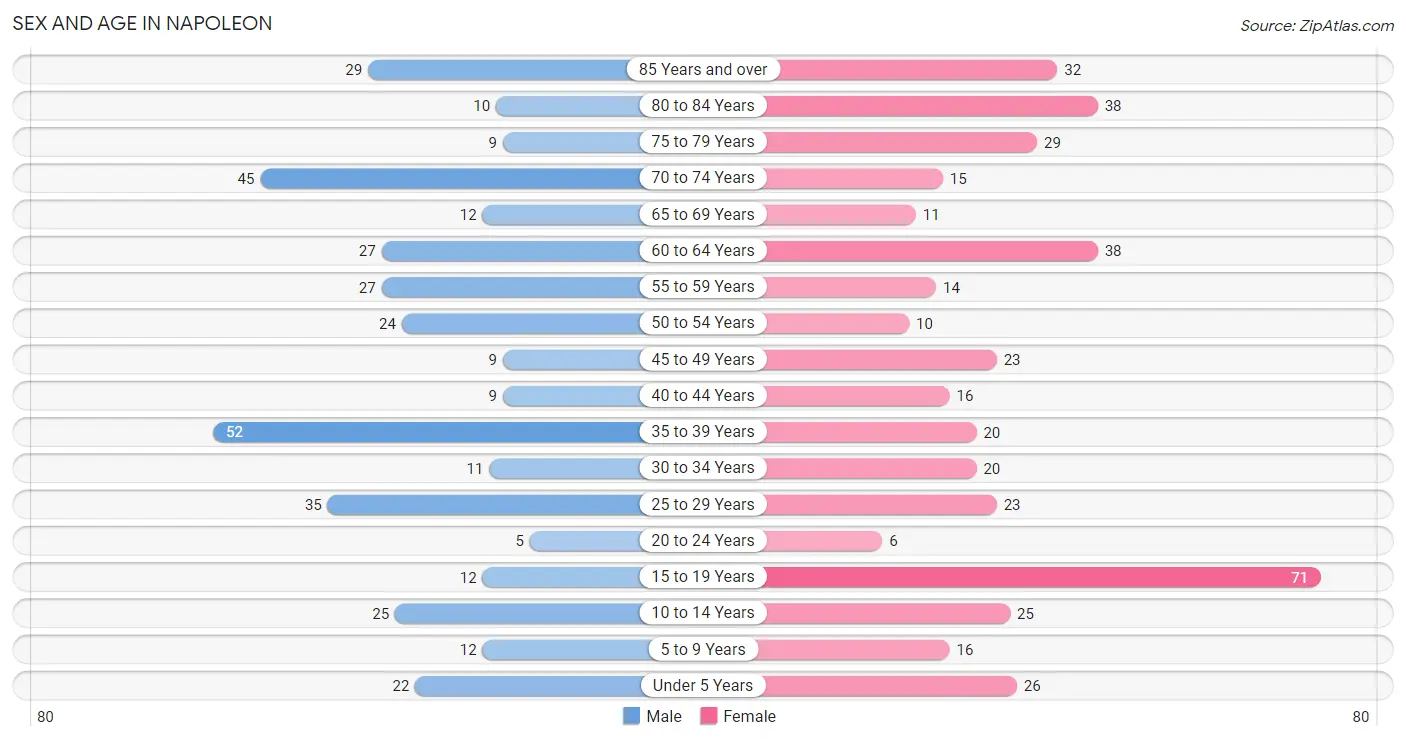
| Age Bracket | Male | Female |
| Under 5 Years | 22 (5.9%) | 26 (6.0%) |
| 5 to 9 Years | 12 (3.2%) | 16 (3.7%) |
| 10 to 14 Years | 25 (6.7%) | 25 (5.8%) |
| 15 to 19 Years | 12 (3.2%) | 71 (16.4%) |
| 20 to 24 Years | 5 (1.3%) | 6 (1.4%) |
| 25 to 29 Years | 35 (9.3%) | 23 (5.3%) |
| 30 to 34 Years | 11 (2.9%) | 20 (4.6%) |
| 35 to 39 Years | 52 (13.9%) | 20 (4.6%) |
| 40 to 44 Years | 9 (2.4%) | 16 (3.7%) |
| 45 to 49 Years | 9 (2.4%) | 23 (5.3%) |
| 50 to 54 Years | 24 (6.4%) | 10 (2.3%) |
| 55 to 59 Years | 27 (7.2%) | 14 (3.2%) |
| 60 to 64 Years | 27 (7.2%) | 38 (8.8%) |
| 65 to 69 Years | 12 (3.2%) | 11 (2.5%) |
| 70 to 74 Years | 45 (12.0%) | 15 (3.5%) |
| 75 to 79 Years | 9 (2.4%) | 29 (6.7%) |
| 80 to 84 Years | 10 (2.7%) | 38 (8.8%) |
| 85 Years and over | 29 (7.7%) | 32 (7.4%) |
| Total | 375 (100.0%) | 433 (100.0%) |
Families and Households in Napoleon
Median Family Size in Napoleon
The median family size in Napoleon is 2.95 persons per family, with married-couple families (198 | 93.8%) accounting for the largest median family size of 2.97 persons per family. On the other hand, single male/father families (3 | 1.4%) represent the smallest median family size with 2.33 persons per family.
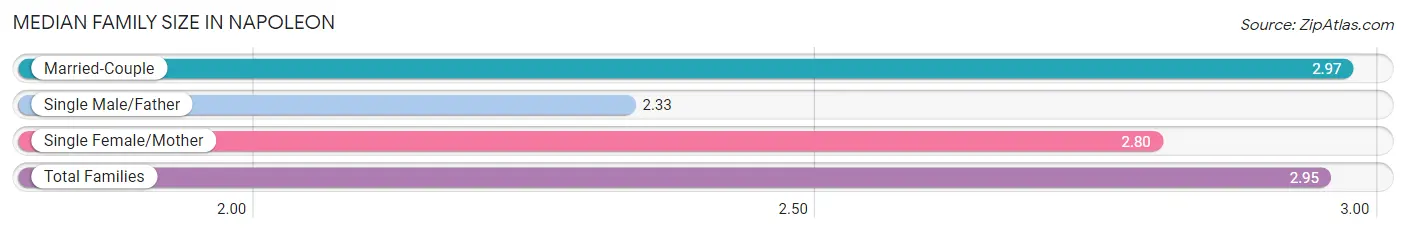
| Family Type | # Families | Family Size |
| Married-Couple | 198 (93.8%) | 2.97 |
| Single Male/Father | 3 (1.4%) | 2.33 |
| Single Female/Mother | 10 (4.7%) | 2.80 |
| Total Families | 211 (100.0%) | 2.95 |
Median Household Size in Napoleon
The median household size in Napoleon is 2.20 persons per household, with single male/father households (3 | 0.9%) accounting for the largest median household size of 3 persons per household. non-family households (137 | 39.4%) represent the smallest median household size with 1.01 persons per household.
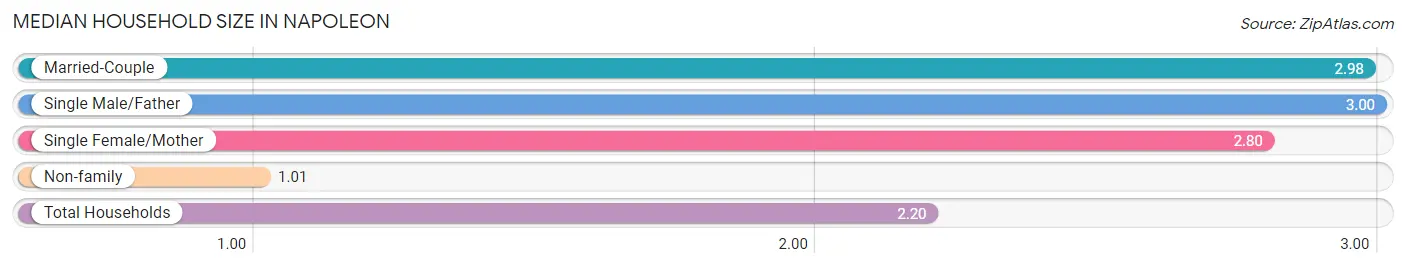
| Household Type | # Households | Household Size |
| Married-Couple | 198 (56.9%) | 2.98 |
| Single Male/Father | 3 (0.9%) | 3.00 |
| Single Female/Mother | 10 (2.9%) | 2.80 |
| Non-family | 137 (39.4%) | 1.01 |
| Total Households | 348 (100.0%) | 2.20 |
Household Size by Marriage Status in Napoleon
Out of a total of 348 households in Napoleon, 211 (60.6%) are family households, while 137 (39.4%) are nonfamily households. The most numerous type of family households are 2-person households, comprising 134, and the most common type of nonfamily households are 1-person households, comprising 136.
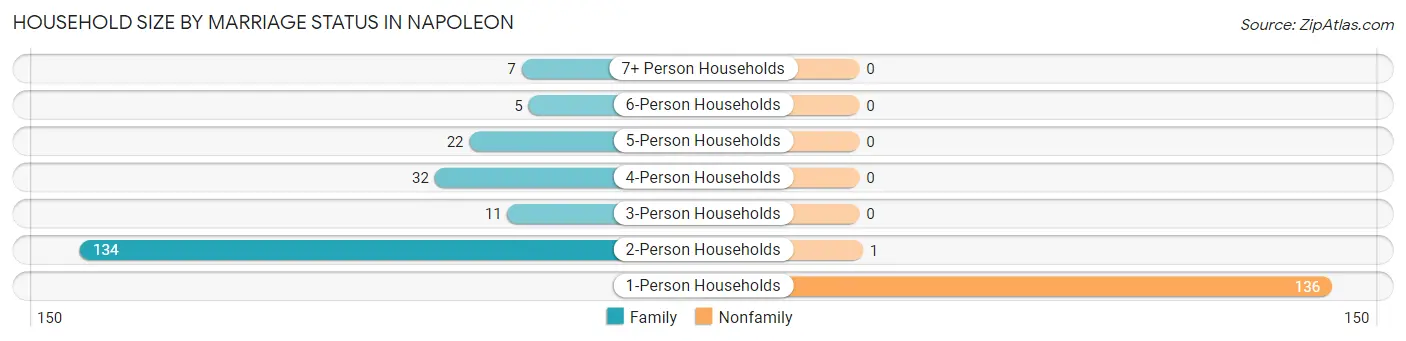
| Household Size | Family Households | Nonfamily Households |
| 1-Person Households | - | 136 (39.1%) |
| 2-Person Households | 134 (38.5%) | 1 (0.3%) |
| 3-Person Households | 11 (3.2%) | 0 (0.0%) |
| 4-Person Households | 32 (9.2%) | 0 (0.0%) |
| 5-Person Households | 22 (6.3%) | 0 (0.0%) |
| 6-Person Households | 5 (1.4%) | 0 (0.0%) |
| 7+ Person Households | 7 (2.0%) | 0 (0.0%) |
| Total | 211 (60.6%) | 137 (39.4%) |
Female Fertility in Napoleon
Fertility by Age in Napoleon
Average fertility rate in Napoleon is 88.0 births per 1,000 women. Women in the age bracket of 20 to 34 years have the highest fertility rate with 224.0 births per 1,000 women. Women in the age bracket of 20 to 34 years acount for 68.8% of all women with births.
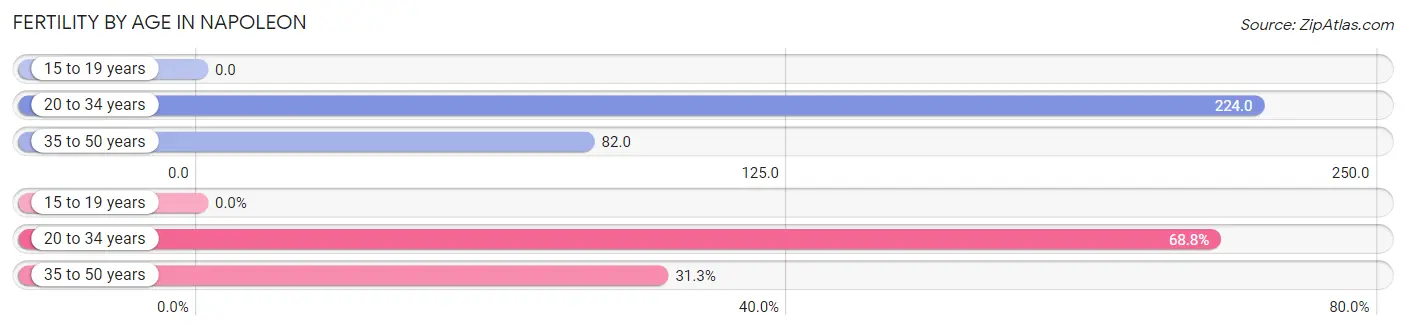
| Age Bracket | Women with Births | Births / 1,000 Women |
| 15 to 19 years | 0 (0.0%) | 0.0 |
| 20 to 34 years | 11 (68.8%) | 224.0 |
| 35 to 50 years | 5 (31.2%) | 82.0 |
| Total | 16 (100.0%) | 88.0 |
Fertility by Age by Marriage Status in Napoleon
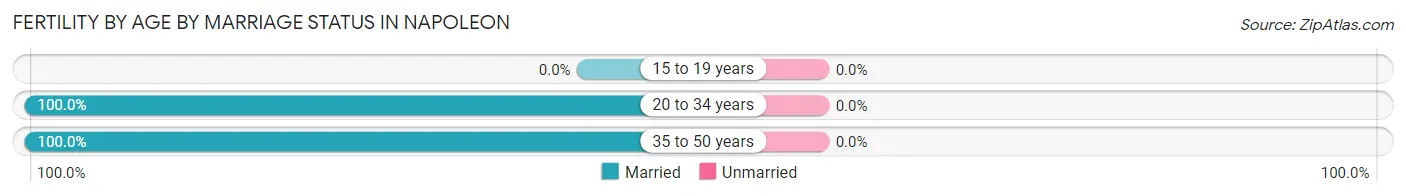
| Age Bracket | Married | Unmarried |
| 15 to 19 years | 0 (0.0%) | 0 (0.0%) |
| 20 to 34 years | 11 (100.0%) | 0 (0.0%) |
| 35 to 50 years | 5 (100.0%) | 0 (0.0%) |
| Total | 16 (100.0%) | 0 (0.0%) |
Fertility by Education in Napoleon
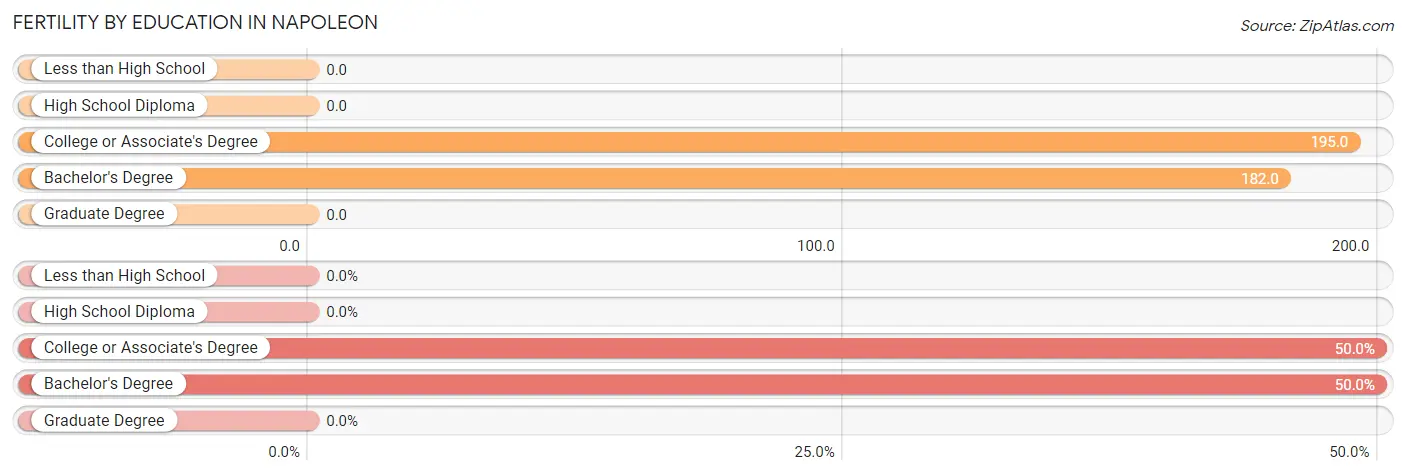
| Educational Attainment | Women with Births | Births / 1,000 Women |
| Less than High School | 0 (0.0%) | 0.0 |
| High School Diploma | 0 (0.0%) | 0.0 |
| College or Associate's Degree | 8 (50.0%) | 195.0 |
| Bachelor's Degree | 8 (50.0%) | 182.0 |
| Graduate Degree | 0 (0.0%) | 0.0 |
| Total | 16 (100.0%) | 88.0 |
Fertility by Education by Marriage Status in Napoleon
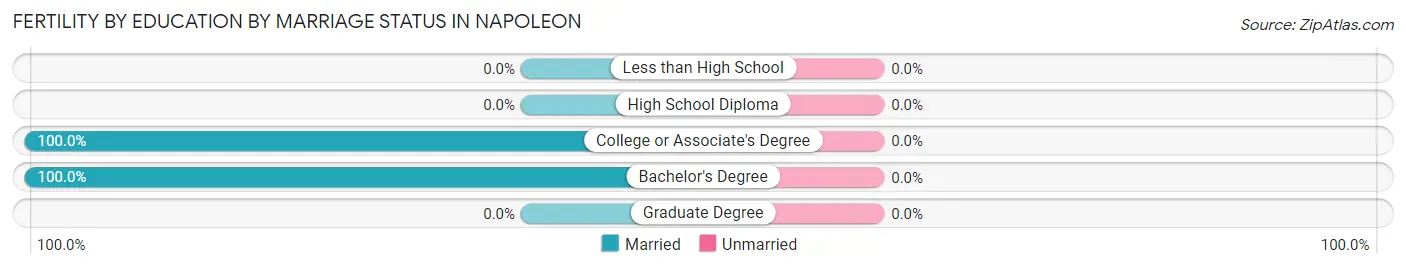
| Educational Attainment | Married | Unmarried |
| Less than High School | 0 (0.0%) | 0 (0.0%) |
| High School Diploma | 0 (0.0%) | 0 (0.0%) |
| College or Associate's Degree | 8 (100.0%) | 0 (0.0%) |
| Bachelor's Degree | 8 (100.0%) | 0 (0.0%) |
| Graduate Degree | 0 (0.0%) | 0 (0.0%) |
| Total | 16 (100.0%) | 0 (0.0%) |
Employment Characteristics in Napoleon
Employment by Class of Employer in Napoleon
Among the 393 employed individuals in Napoleon, private company employees (192 | 48.8%), local government employees (60 | 15.3%), and self-employed (not incorporated) (50 | 12.7%) make up the most common classes of employment.
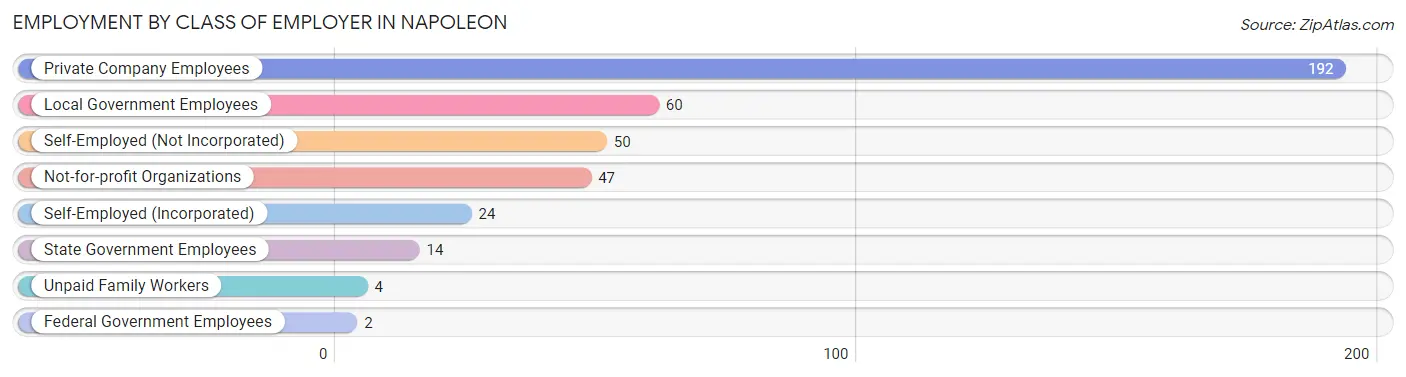
| Employer Class | # Employees | % Employees |
| Private Company Employees | 192 | 48.8% |
| Self-Employed (Incorporated) | 24 | 6.1% |
| Self-Employed (Not Incorporated) | 50 | 12.7% |
| Not-for-profit Organizations | 47 | 12.0% |
| Local Government Employees | 60 | 15.3% |
| State Government Employees | 14 | 3.6% |
| Federal Government Employees | 2 | 0.5% |
| Unpaid Family Workers | 4 | 1.0% |
| Total | 393 | 100.0% |
Employment Status by Age in Napoleon
According to the labor force statistics for Napoleon, out of the total population over 16 years of age (651), 60.7% or 395 individuals are in the labor force, with 0.5% or 2 of them unemployed. The age group with the highest labor force participation rate is 20 to 24 years, with 100.0% or 11 individuals in the labor force. Within the labor force, the 35 to 44 years age range has the highest percentage of unemployed individuals, with 2.1% or 2 of them being unemployed.
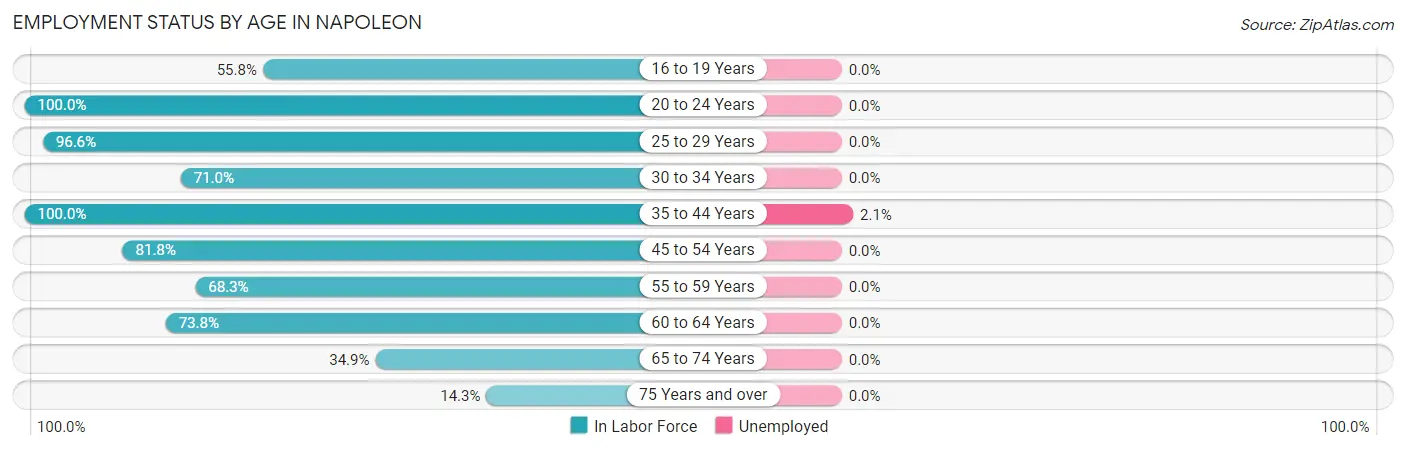
| Age Bracket | In Labor Force | Unemployed |
| 16 to 19 Years | 29 (55.8%) | 0 (0.0%) |
| 20 to 24 Years | 11 (100.0%) | 0 (0.0%) |
| 25 to 29 Years | 56 (96.6%) | 0 (0.0%) |
| 30 to 34 Years | 22 (71.0%) | 0 (0.0%) |
| 35 to 44 Years | 97 (100.0%) | 2 (2.1%) |
| 45 to 54 Years | 54 (81.8%) | 0 (0.0%) |
| 55 to 59 Years | 28 (68.3%) | 0 (0.0%) |
| 60 to 64 Years | 48 (73.8%) | 0 (0.0%) |
| 65 to 74 Years | 29 (34.9%) | 0 (0.0%) |
| 75 Years and over | 21 (14.3%) | 0 (0.0%) |
| Total | 395 (60.7%) | 2 (0.5%) |
Employment Status by Educational Attainment in Napoleon
According to labor force statistics for Napoleon, 85.2% of individuals (305) out of the total population between 25 and 64 years of age (358) are in the labor force, with 0.7% or 2 of them being unemployed. The group with the highest labor force participation rate are those with the educational attainment of bachelor's degree or higher, with 93.6% or 88 individuals in the labor force. Within the labor force, individuals with less than high school education have the highest percentage of unemployment, with 25.0% or 2 of them being unemployed.
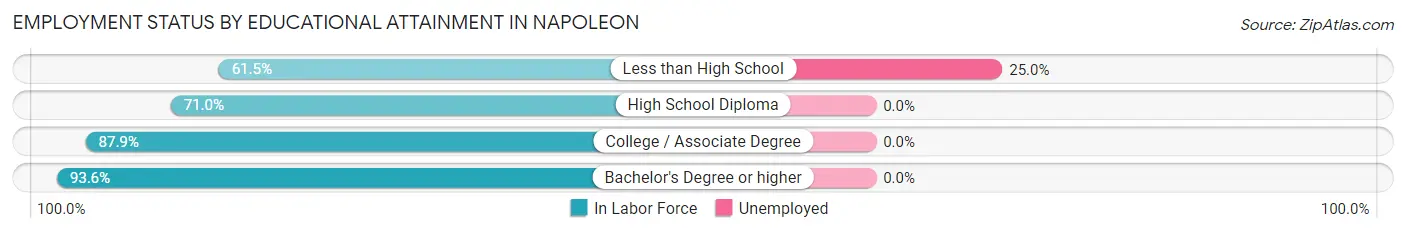
| Educational Attainment | In Labor Force | Unemployed |
| Less than High School | 8 (61.5%) | 3 (25.0%) |
| High School Diploma | 49 (71.0%) | 0 (0.0%) |
| College / Associate Degree | 160 (87.9%) | 0 (0.0%) |
| Bachelor's Degree or higher | 88 (93.6%) | 0 (0.0%) |
| Total | 305 (85.2%) | 3 (0.7%) |
Employment Occupations by Sex in Napoleon
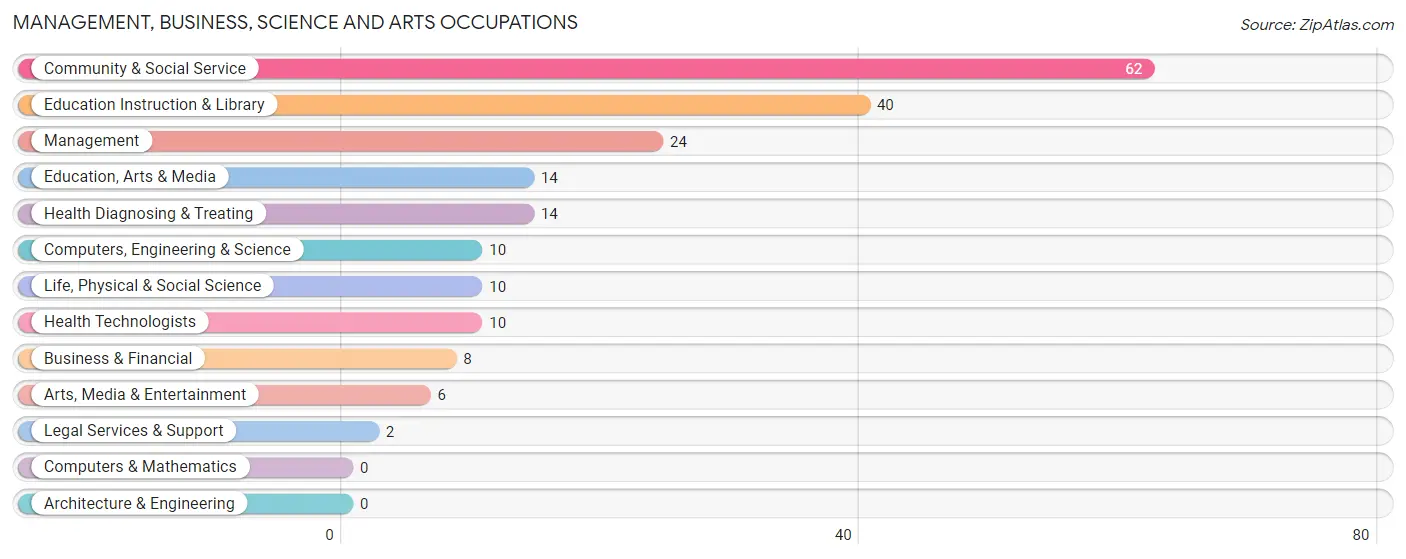
Management, Business, Science and Arts Occupations
The most common Management, Business, Science and Arts occupations in Napoleon are Community & Social Service (62 | 15.8%), Education Instruction & Library (40 | 10.2%), Management (24 | 6.1%), Education, Arts & Media (14 | 3.6%), and Health Diagnosing & Treating (14 | 3.6%).
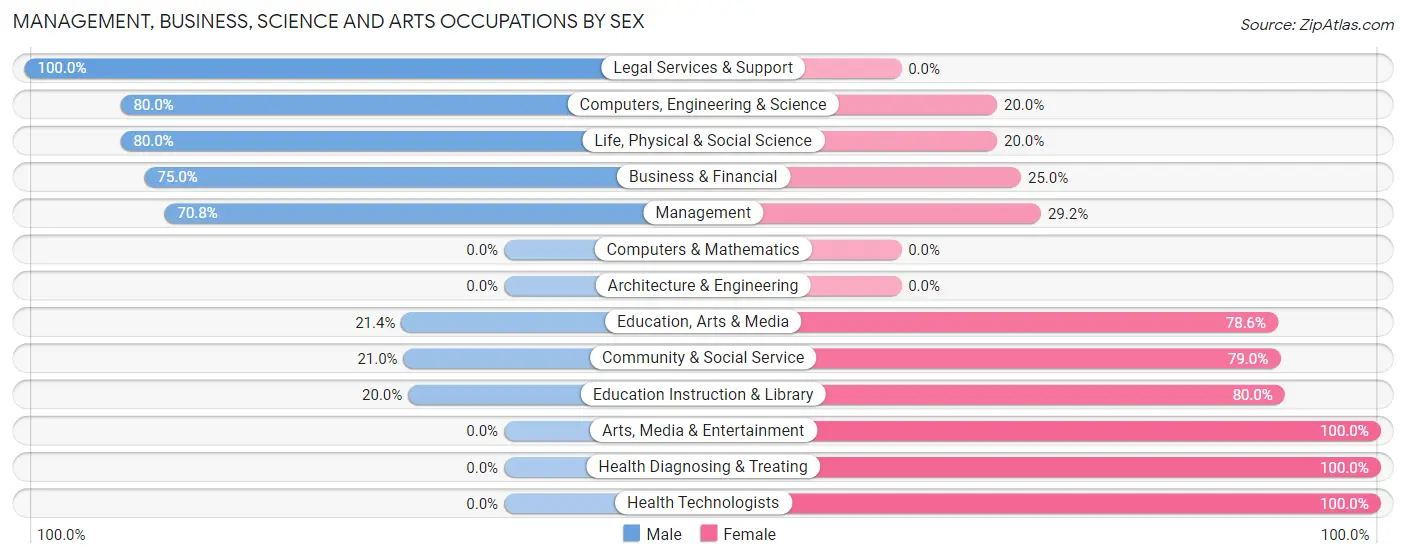
Management, Business, Science and Arts Occupations by Sex
Within the Management, Business, Science and Arts occupations in Napoleon, the most male-oriented occupations are Legal Services & Support (100.0%), Computers, Engineering & Science (80.0%), and Life, Physical & Social Science (80.0%), while the most female-oriented occupations are Arts, Media & Entertainment (100.0%), Health Diagnosing & Treating (100.0%), and Health Technologists (100.0%).
| Occupation | Male | Female |
| Management | 17 (70.8%) | 7 (29.2%) |
| Business & Financial | 6 (75.0%) | 2 (25.0%) |
| Computers, Engineering & Science | 8 (80.0%) | 2 (20.0%) |
| Computers & Mathematics | 0 (0.0%) | 0 (0.0%) |
| Architecture & Engineering | 0 (0.0%) | 0 (0.0%) |
| Life, Physical & Social Science | 8 (80.0%) | 2 (20.0%) |
| Community & Social Service | 13 (21.0%) | 49 (79.0%) |
| Education, Arts & Media | 3 (21.4%) | 11 (78.6%) |
| Legal Services & Support | 2 (100.0%) | 0 (0.0%) |
| Education Instruction & Library | 8 (20.0%) | 32 (80.0%) |
| Arts, Media & Entertainment | 0 (0.0%) | 6 (100.0%) |
| Health Diagnosing & Treating | 0 (0.0%) | 14 (100.0%) |
| Health Technologists | 0 (0.0%) | 10 (100.0%) |
| Total (Category) | 44 (37.3%) | 74 (62.7%) |
| Total (Overall) | 227 (57.8%) | 166 (42.2%) |
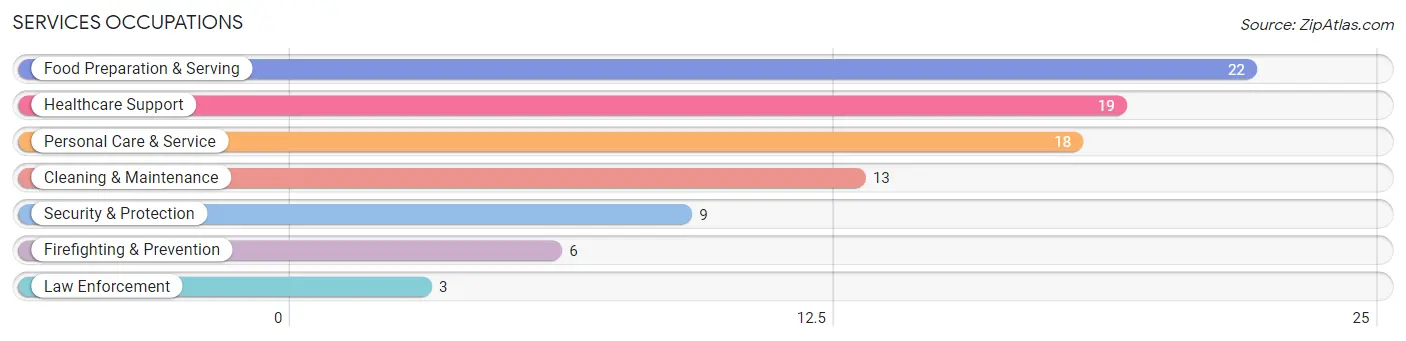
Services Occupations
The most common Services occupations in Napoleon are Food Preparation & Serving (22 | 5.6%), Healthcare Support (19 | 4.8%), Personal Care & Service (18 | 4.6%), Cleaning & Maintenance (13 | 3.3%), and Security & Protection (9 | 2.3%).
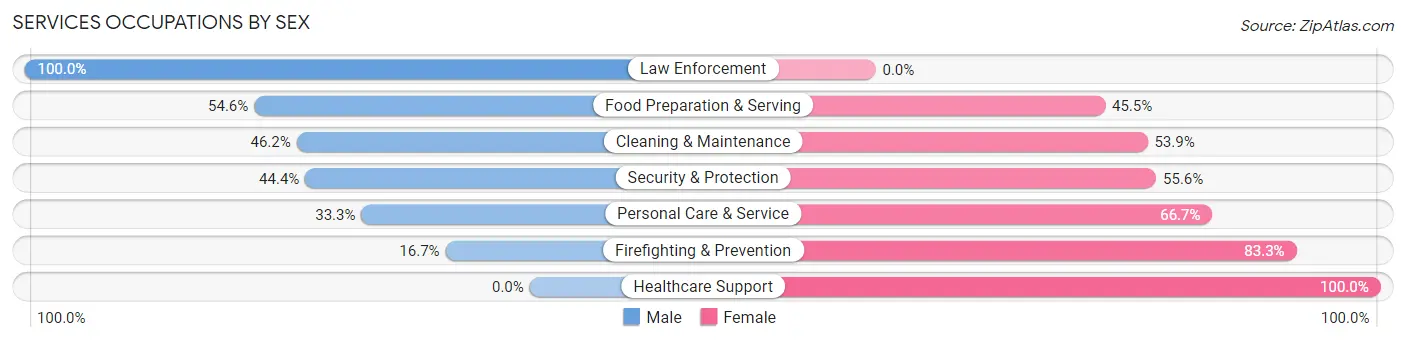
Services Occupations by Sex
Within the Services occupations in Napoleon, the most male-oriented occupations are Law Enforcement (100.0%), Food Preparation & Serving (54.5%), and Cleaning & Maintenance (46.2%), while the most female-oriented occupations are Healthcare Support (100.0%), Firefighting & Prevention (83.3%), and Personal Care & Service (66.7%).
| Occupation | Male | Female |
| Healthcare Support | 0 (0.0%) | 19 (100.0%) |
| Security & Protection | 4 (44.4%) | 5 (55.6%) |
| Firefighting & Prevention | 1 (16.7%) | 5 (83.3%) |
| Law Enforcement | 3 (100.0%) | 0 (0.0%) |
| Food Preparation & Serving | 12 (54.5%) | 10 (45.5%) |
| Cleaning & Maintenance | 6 (46.2%) | 7 (53.8%) |
| Personal Care & Service | 6 (33.3%) | 12 (66.7%) |
| Total (Category) | 28 (34.6%) | 53 (65.4%) |
| Total (Overall) | 227 (57.8%) | 166 (42.2%) |
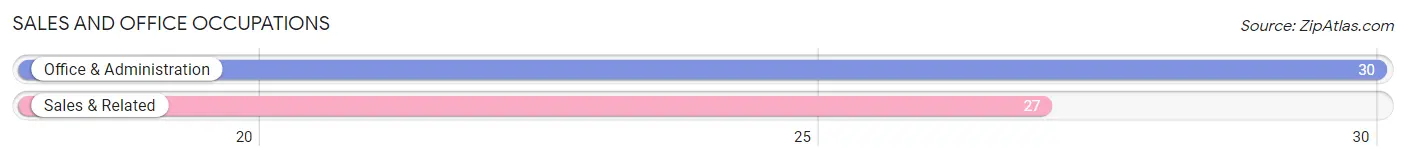
Sales and Office Occupations
The most common Sales and Office occupations in Napoleon are Office & Administration (30 | 7.6%), and Sales & Related (27 | 6.9%).
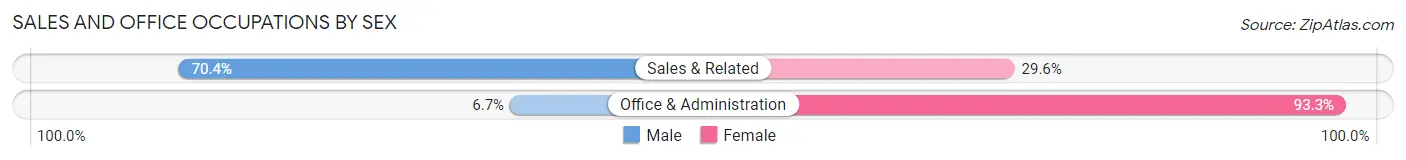
Sales and Office Occupations by Sex
| Occupation | Male | Female |
| Sales & Related | 19 (70.4%) | 8 (29.6%) |
| Office & Administration | 2 (6.7%) | 28 (93.3%) |
| Total (Category) | 21 (36.8%) | 36 (63.2%) |
| Total (Overall) | 227 (57.8%) | 166 (42.2%) |
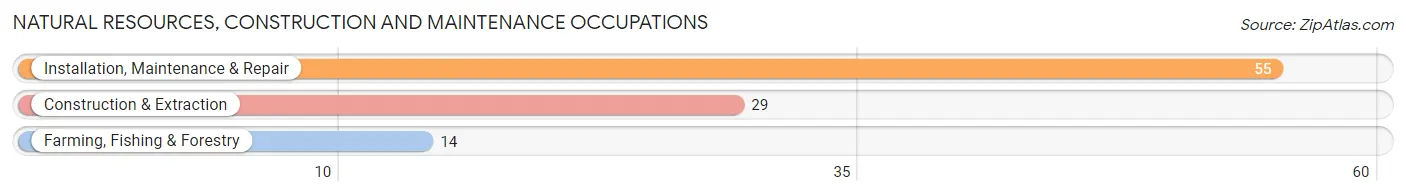
Natural Resources, Construction and Maintenance Occupations
The most common Natural Resources, Construction and Maintenance occupations in Napoleon are Installation, Maintenance & Repair (55 | 14.0%), Construction & Extraction (29 | 7.4%), and Farming, Fishing & Forestry (14 | 3.6%).
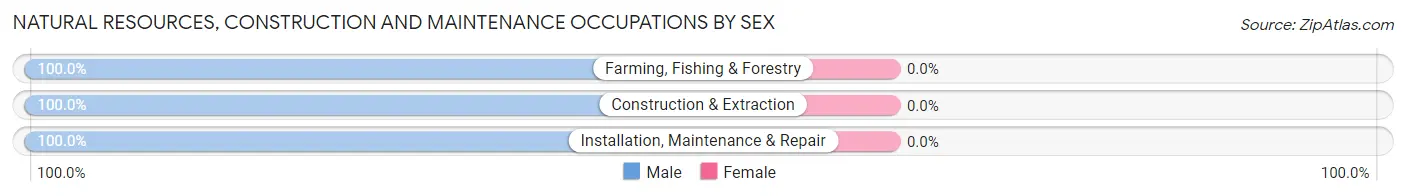
Natural Resources, Construction and Maintenance Occupations by Sex
| Occupation | Male | Female |
| Farming, Fishing & Forestry | 14 (100.0%) | 0 (0.0%) |
| Construction & Extraction | 29 (100.0%) | 0 (0.0%) |
| Installation, Maintenance & Repair | 55 (100.0%) | 0 (0.0%) |
| Total (Category) | 98 (100.0%) | 0 (0.0%) |
| Total (Overall) | 227 (57.8%) | 166 (42.2%) |
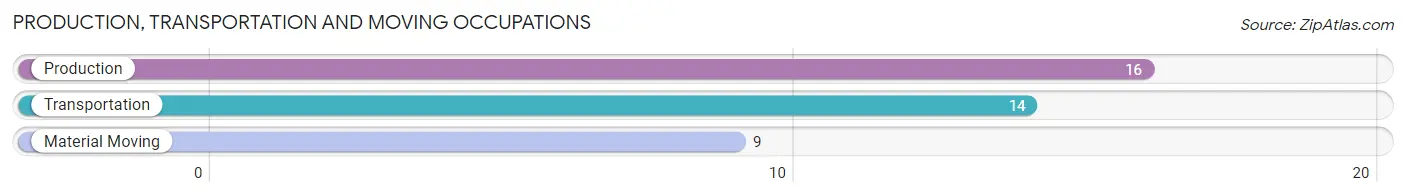
Production, Transportation and Moving Occupations
The most common Production, Transportation and Moving occupations in Napoleon are Production (16 | 4.1%), Transportation (14 | 3.6%), and Material Moving (9 | 2.3%).
Production, Transportation and Moving Occupations by Sex
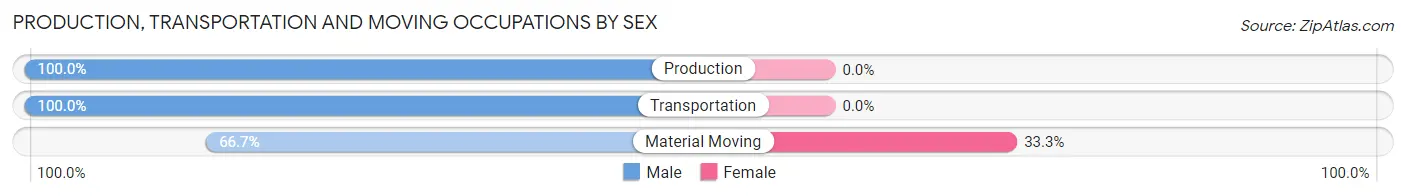
| Occupation | Male | Female |
| Production | 16 (100.0%) | 0 (0.0%) |
| Transportation | 14 (100.0%) | 0 (0.0%) |
| Material Moving | 6 (66.7%) | 3 (33.3%) |
| Total (Category) | 36 (92.3%) | 3 (7.7%) |
| Total (Overall) | 227 (57.8%) | 166 (42.2%) |
Employment Industries by Sex in Napoleon
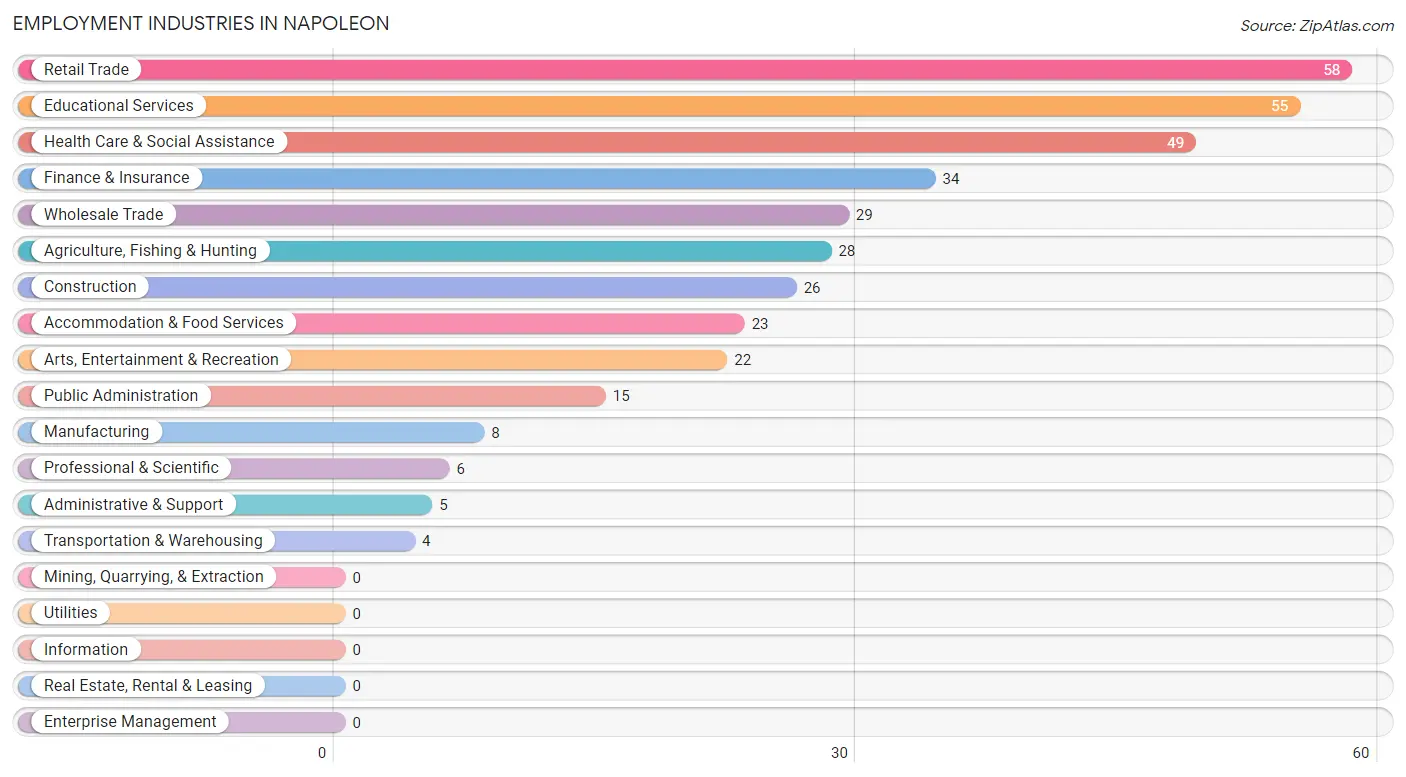
Employment Industries in Napoleon
The major employment industries in Napoleon include Retail Trade (58 | 14.8%), Educational Services (55 | 14.0%), Health Care & Social Assistance (49 | 12.5%), Finance & Insurance (34 | 8.6%), and Wholesale Trade (29 | 7.4%).
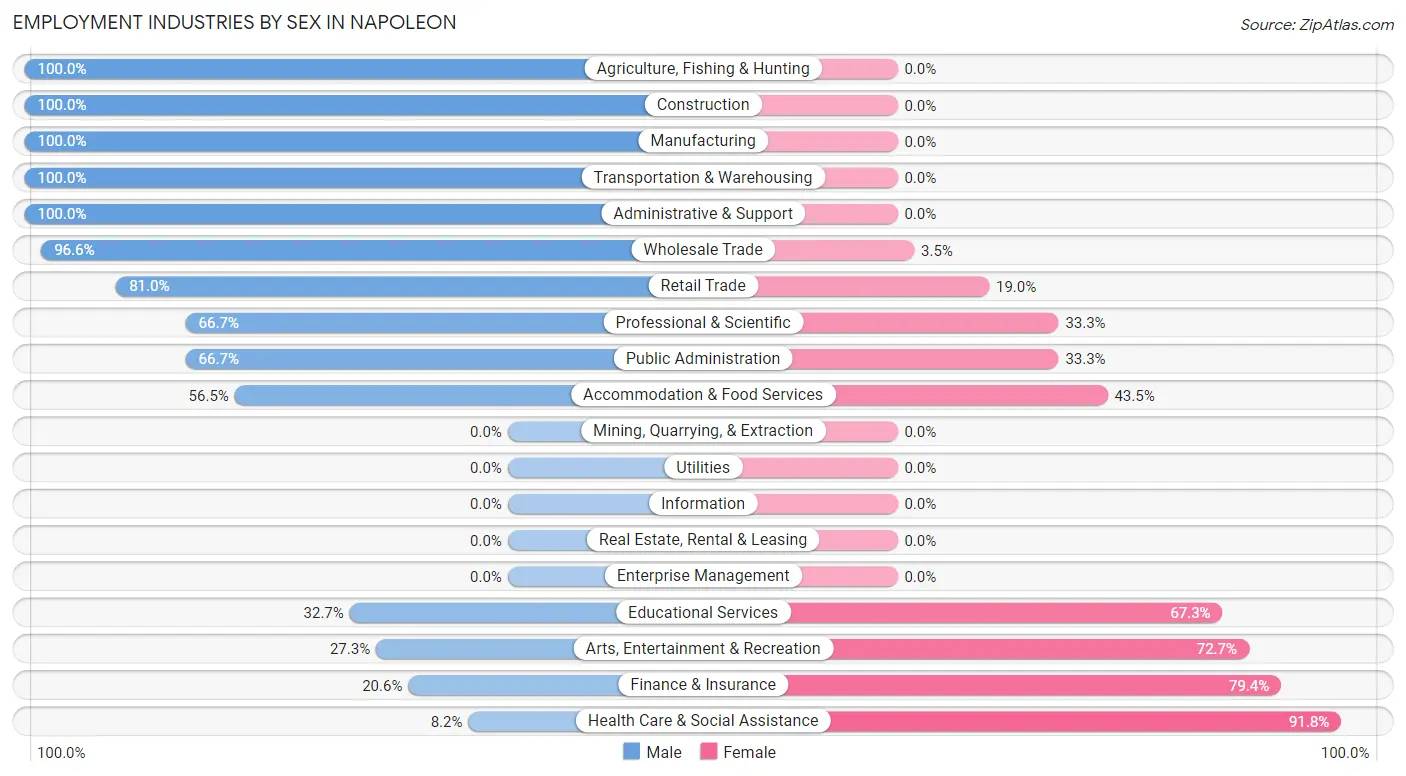
Employment Industries by Sex in Napoleon
The Napoleon industries that see more men than women are Agriculture, Fishing & Hunting (100.0%), Construction (100.0%), and Manufacturing (100.0%), whereas the industries that tend to have a higher number of women are Health Care & Social Assistance (91.8%), Finance & Insurance (79.4%), and Arts, Entertainment & Recreation (72.7%).
| Industry | Male | Female |
| Agriculture, Fishing & Hunting | 28 (100.0%) | 0 (0.0%) |
| Mining, Quarrying, & Extraction | 0 (0.0%) | 0 (0.0%) |
| Construction | 26 (100.0%) | 0 (0.0%) |
| Manufacturing | 8 (100.0%) | 0 (0.0%) |
| Wholesale Trade | 28 (96.6%) | 1 (3.5%) |
| Retail Trade | 47 (81.0%) | 11 (19.0%) |
| Transportation & Warehousing | 4 (100.0%) | 0 (0.0%) |
| Utilities | 0 (0.0%) | 0 (0.0%) |
| Information | 0 (0.0%) | 0 (0.0%) |
| Finance & Insurance | 7 (20.6%) | 27 (79.4%) |
| Real Estate, Rental & Leasing | 0 (0.0%) | 0 (0.0%) |
| Professional & Scientific | 4 (66.7%) | 2 (33.3%) |
| Enterprise Management | 0 (0.0%) | 0 (0.0%) |
| Administrative & Support | 5 (100.0%) | 0 (0.0%) |
| Educational Services | 18 (32.7%) | 37 (67.3%) |
| Health Care & Social Assistance | 4 (8.2%) | 45 (91.8%) |
| Arts, Entertainment & Recreation | 6 (27.3%) | 16 (72.7%) |
| Accommodation & Food Services | 13 (56.5%) | 10 (43.5%) |
| Public Administration | 10 (66.7%) | 5 (33.3%) |
| Total | 227 (57.8%) | 166 (42.2%) |
Education in Napoleon
School Enrollment in Napoleon
The most common levels of schooling among the 176 students in Napoleon are high school (76 | 43.2%), middle school (54 | 30.7%), and elementary school (26 | 14.8%).
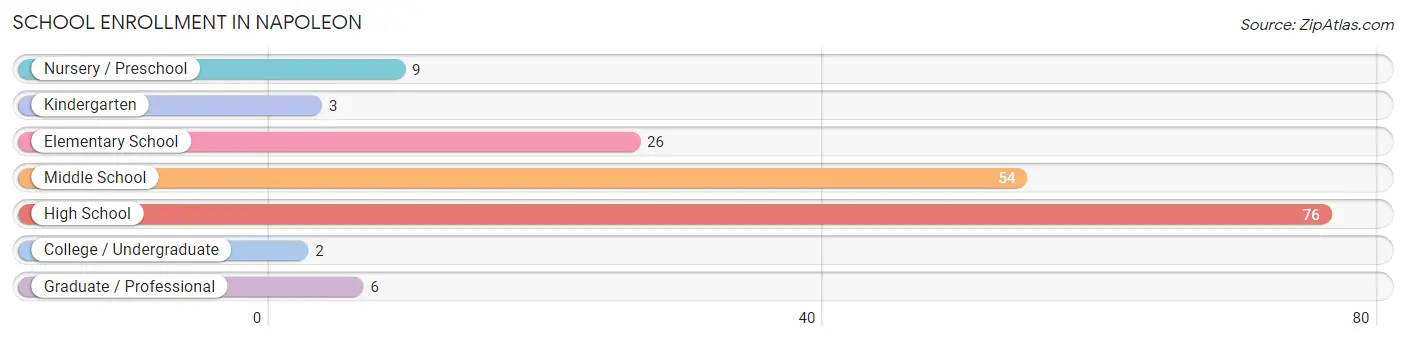
| School Level | # Students | % Students |
| Nursery / Preschool | 9 | 5.1% |
| Kindergarten | 3 | 1.7% |
| Elementary School | 26 | 14.8% |
| Middle School | 54 | 30.7% |
| High School | 76 | 43.2% |
| College / Undergraduate | 2 | 1.1% |
| Graduate / Professional | 6 | 3.4% |
| Total | 176 | 100.0% |
School Enrollment by Age by Funding Source in Napoleon
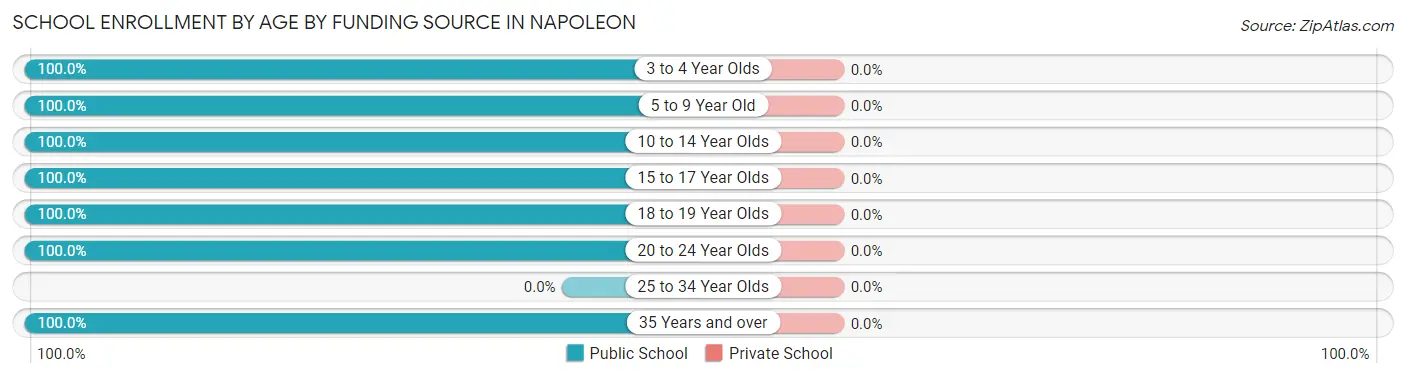
| Age Bracket | Public School | Private School |
| 3 to 4 Year Olds | 5 (100.0%) | 0 (0.0%) |
| 5 to 9 Year Old | 22 (100.0%) | 0 (0.0%) |
| 10 to 14 Year Olds | 50 (100.0%) | 0 (0.0%) |
| 15 to 17 Year Olds | 67 (100.0%) | 0 (0.0%) |
| 18 to 19 Year Olds | 16 (100.0%) | 0 (0.0%) |
| 20 to 24 Year Olds | 3 (100.0%) | 0 (0.0%) |
| 25 to 34 Year Olds | 0 (0.0%) | 0 (0.0%) |
| 35 Years and over | 13 (100.0%) | 0 (0.0%) |
| Total | 176 (100.0%) | 0 (0.0%) |
Educational Attainment by Field of Study in Napoleon
Education (42 | 33.9%), science & technology (23 | 18.5%), visual & performing arts (19 | 15.3%), business (17 | 13.7%), and bio, nature & agricultural (7 | 5.7%) are the most common fields of study among 124 individuals in Napoleon who have obtained a bachelor's degree or higher.
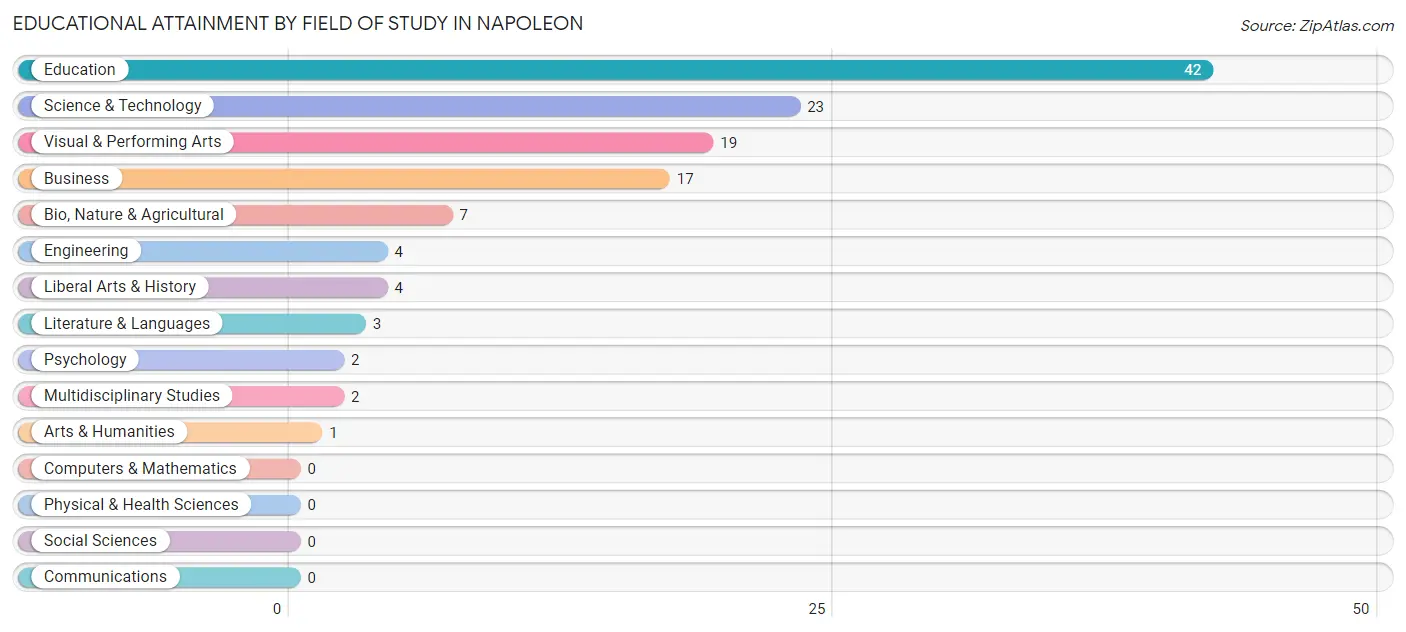
| Field of Study | # Graduates | % Graduates |
| Computers & Mathematics | 0 | 0.0% |
| Bio, Nature & Agricultural | 7 | 5.7% |
| Physical & Health Sciences | 0 | 0.0% |
| Psychology | 2 | 1.6% |
| Social Sciences | 0 | 0.0% |
| Engineering | 4 | 3.2% |
| Multidisciplinary Studies | 2 | 1.6% |
| Science & Technology | 23 | 18.5% |
| Business | 17 | 13.7% |
| Education | 42 | 33.9% |
| Literature & Languages | 3 | 2.4% |
| Liberal Arts & History | 4 | 3.2% |
| Visual & Performing Arts | 19 | 15.3% |
| Communications | 0 | 0.0% |
| Arts & Humanities | 1 | 0.8% |
| Total | 124 | 100.0% |
Transportation & Commute in Napoleon
Vehicle Availability by Sex in Napoleon
The most prevalent vehicle ownership categories in Napoleon are males with 2 vehicles (123, accounting for 54.2%) and females with 2 vehicles (75, making up 74.1%).
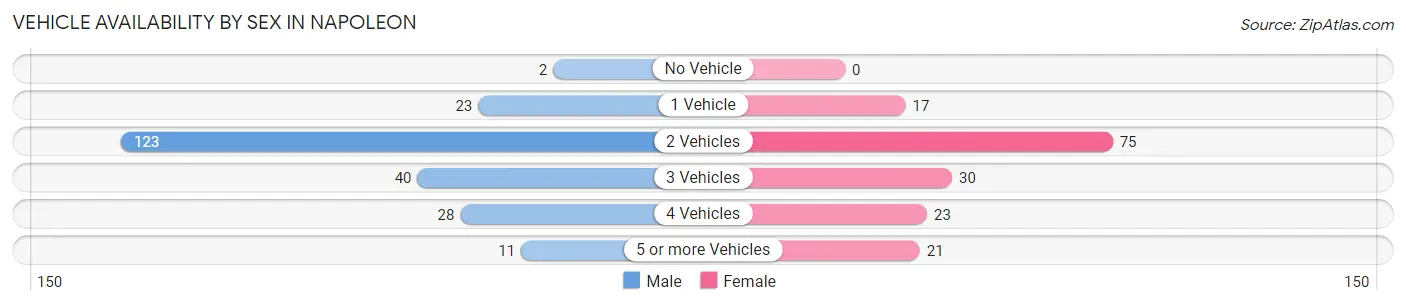
| Vehicles Available | Male | Female |
| No Vehicle | 2 (0.9%) | 0 (0.0%) |
| 1 Vehicle | 23 (10.1%) | 17 (10.2%) |
| 2 Vehicles | 123 (54.2%) | 75 (45.2%) |
| 3 Vehicles | 40 (17.6%) | 30 (18.1%) |
| 4 Vehicles | 28 (12.3%) | 23 (13.9%) |
| 5 or more Vehicles | 11 (4.9%) | 21 (12.7%) |
| Total | 227 (100.0%) | 166 (100.0%) |
Commute Time in Napoleon
The most frequently occuring commute durations in Napoleon are less than 5 minutes (163 commuters, 42.7%), 5 to 9 minutes (128 commuters, 33.5%), and 45 to 59 minutes (27 commuters, 7.1%).
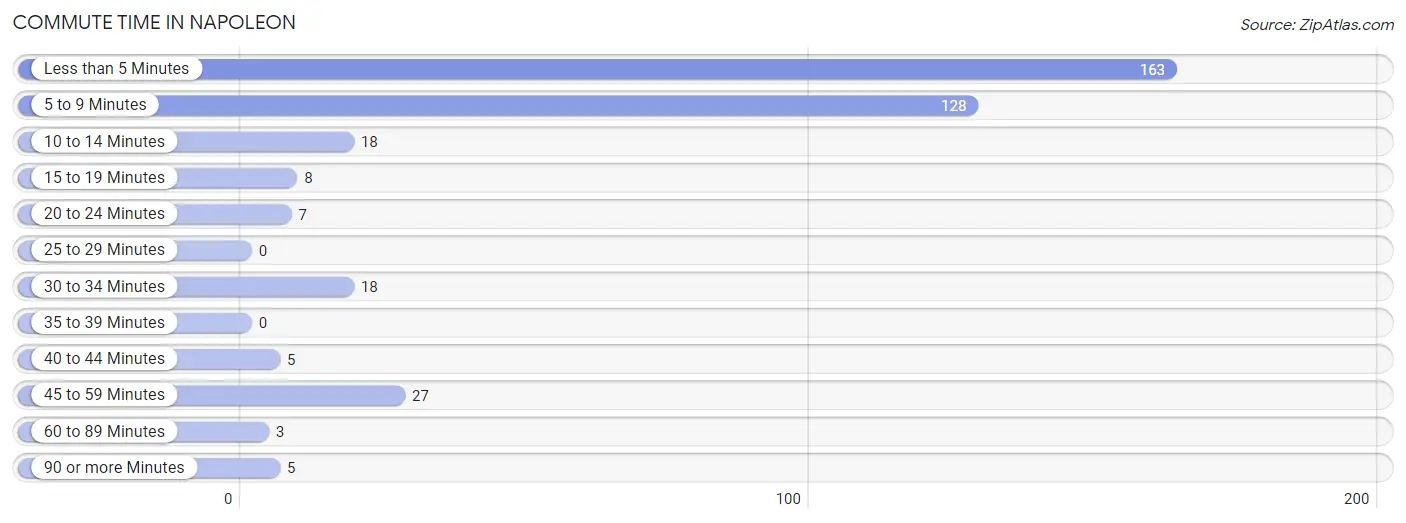
| Commute Time | # Commuters | % Commuters |
| Less than 5 Minutes | 163 | 42.7% |
| 5 to 9 Minutes | 128 | 33.5% |
| 10 to 14 Minutes | 18 | 4.7% |
| 15 to 19 Minutes | 8 | 2.1% |
| 20 to 24 Minutes | 7 | 1.8% |
| 25 to 29 Minutes | 0 | 0.0% |
| 30 to 34 Minutes | 18 | 4.7% |
| 35 to 39 Minutes | 0 | 0.0% |
| 40 to 44 Minutes | 5 | 1.3% |
| 45 to 59 Minutes | 27 | 7.1% |
| 60 to 89 Minutes | 3 | 0.8% |
| 90 or more Minutes | 5 | 1.3% |
Commute Time by Sex in Napoleon
The most common commute times in Napoleon are 5 to 9 minutes (85 commuters, 38.1%) for males and less than 5 minutes (82 commuters, 51.6%) for females.
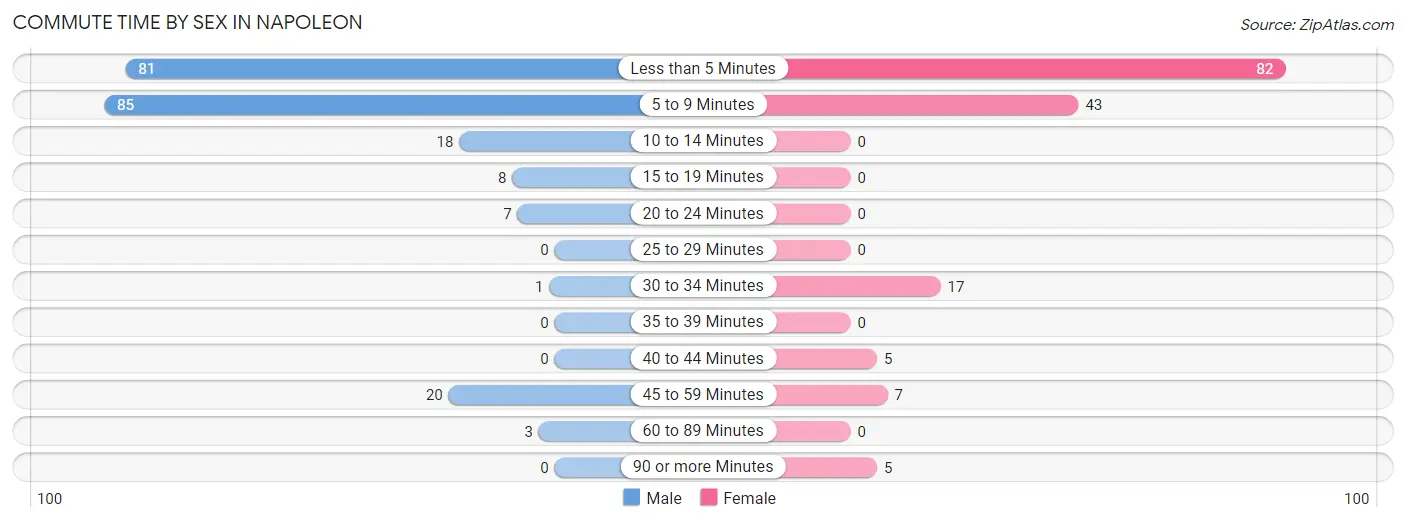
| Commute Time | Male | Female |
| Less than 5 Minutes | 81 (36.3%) | 82 (51.6%) |
| 5 to 9 Minutes | 85 (38.1%) | 43 (27.0%) |
| 10 to 14 Minutes | 18 (8.1%) | 0 (0.0%) |
| 15 to 19 Minutes | 8 (3.6%) | 0 (0.0%) |
| 20 to 24 Minutes | 7 (3.1%) | 0 (0.0%) |
| 25 to 29 Minutes | 0 (0.0%) | 0 (0.0%) |
| 30 to 34 Minutes | 1 (0.4%) | 17 (10.7%) |
| 35 to 39 Minutes | 0 (0.0%) | 0 (0.0%) |
| 40 to 44 Minutes | 0 (0.0%) | 5 (3.1%) |
| 45 to 59 Minutes | 20 (9.0%) | 7 (4.4%) |
| 60 to 89 Minutes | 3 (1.3%) | 0 (0.0%) |
| 90 or more Minutes | 0 (0.0%) | 5 (3.1%) |
Time of Departure to Work by Sex in Napoleon
The most frequent times of departure to work in Napoleon are 7:30 AM to 7:59 AM (69, 30.9%) for males and 8:00 AM to 8:29 AM (28, 17.6%) for females.
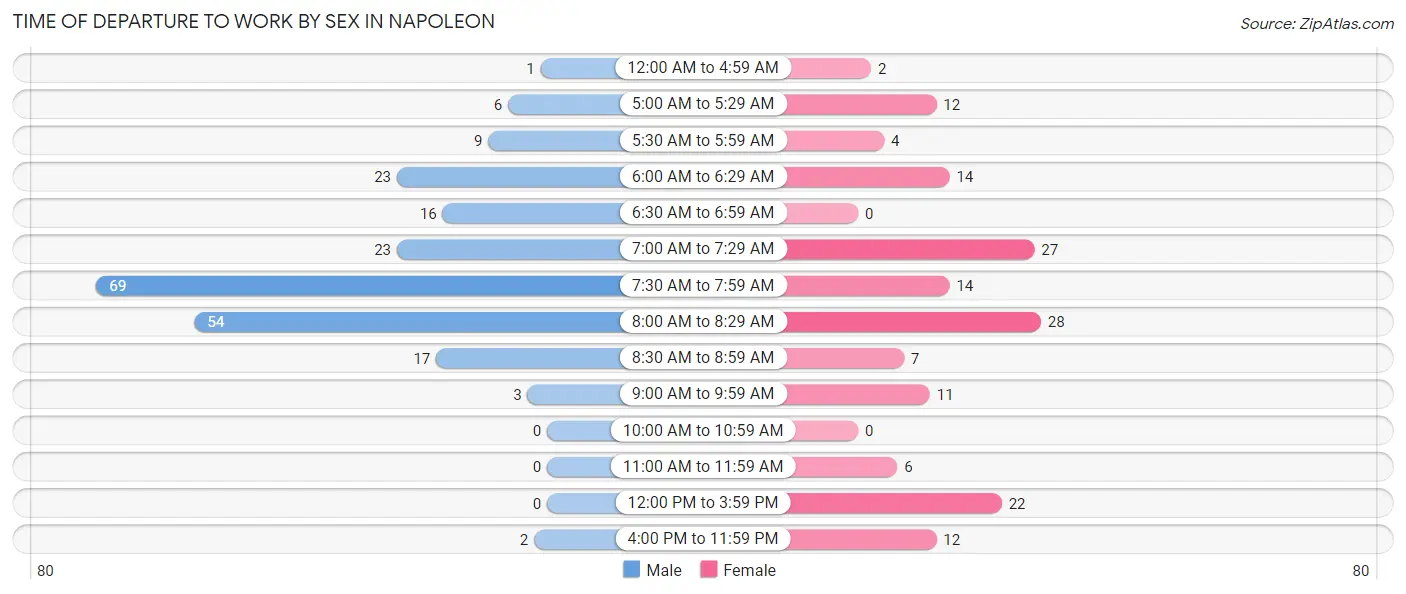
| Time of Departure | Male | Female |
| 12:00 AM to 4:59 AM | 1 (0.4%) | 2 (1.3%) |
| 5:00 AM to 5:29 AM | 6 (2.7%) | 12 (7.5%) |
| 5:30 AM to 5:59 AM | 9 (4.0%) | 4 (2.5%) |
| 6:00 AM to 6:29 AM | 23 (10.3%) | 14 (8.8%) |
| 6:30 AM to 6:59 AM | 16 (7.2%) | 0 (0.0%) |
| 7:00 AM to 7:29 AM | 23 (10.3%) | 27 (17.0%) |
| 7:30 AM to 7:59 AM | 69 (30.9%) | 14 (8.8%) |
| 8:00 AM to 8:29 AM | 54 (24.2%) | 28 (17.6%) |
| 8:30 AM to 8:59 AM | 17 (7.6%) | 7 (4.4%) |
| 9:00 AM to 9:59 AM | 3 (1.3%) | 11 (6.9%) |
| 10:00 AM to 10:59 AM | 0 (0.0%) | 0 (0.0%) |
| 11:00 AM to 11:59 AM | 0 (0.0%) | 6 (3.8%) |
| 12:00 PM to 3:59 PM | 0 (0.0%) | 22 (13.8%) |
| 4:00 PM to 11:59 PM | 2 (0.9%) | 12 (7.5%) |
| Total | 223 (100.0%) | 159 (100.0%) |
Housing Occupancy in Napoleon
Occupancy by Ownership in Napoleon
Of the total 348 dwellings in Napoleon, owner-occupied units account for 284 (81.6%), while renter-occupied units make up 64 (18.4%).
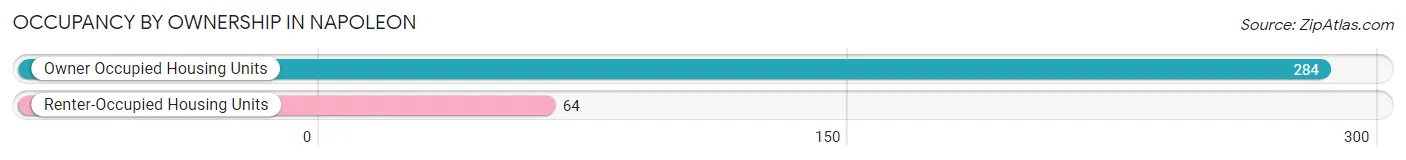
| Occupancy | # Housing Units | % Housing Units |
| Owner Occupied Housing Units | 284 | 81.6% |
| Renter-Occupied Housing Units | 64 | 18.4% |
| Total Occupied Housing Units | 348 | 100.0% |
Occupancy by Household Size in Napoleon
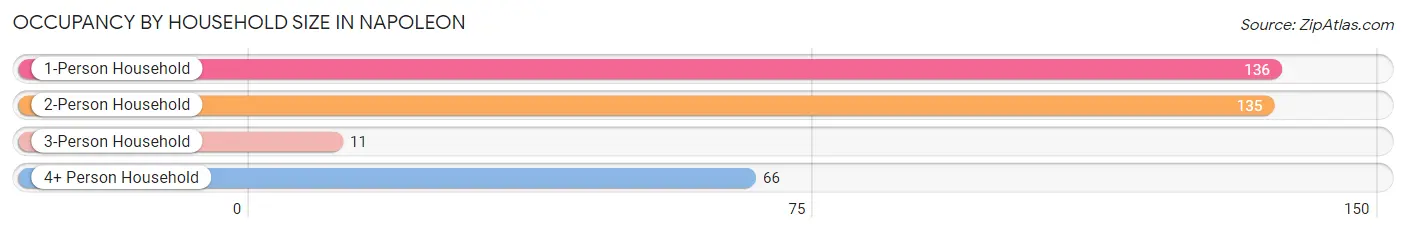
| Household Size | # Housing Units | % Housing Units |
| 1-Person Household | 136 | 39.1% |
| 2-Person Household | 135 | 38.8% |
| 3-Person Household | 11 | 3.2% |
| 4+ Person Household | 66 | 19.0% |
| Total Housing Units | 348 | 100.0% |
Occupancy by Ownership by Household Size in Napoleon
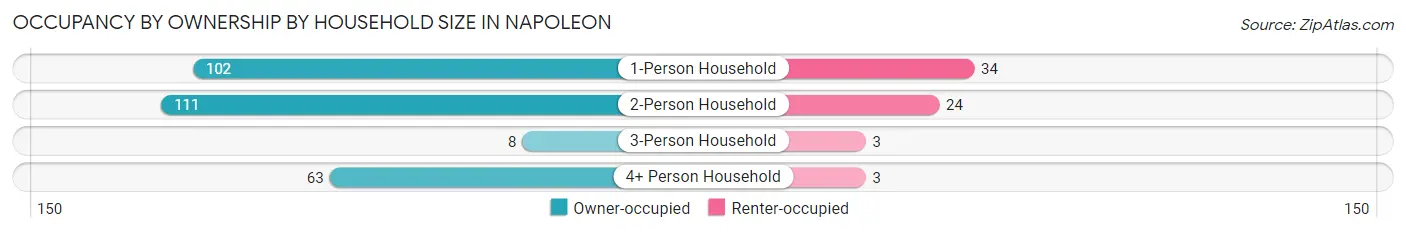
| Household Size | Owner-occupied | Renter-occupied |
| 1-Person Household | 102 (75.0%) | 34 (25.0%) |
| 2-Person Household | 111 (82.2%) | 24 (17.8%) |
| 3-Person Household | 8 (72.7%) | 3 (27.3%) |
| 4+ Person Household | 63 (95.5%) | 3 (4.5%) |
| Total Housing Units | 284 (81.6%) | 64 (18.4%) |
Occupancy by Educational Attainment in Napoleon
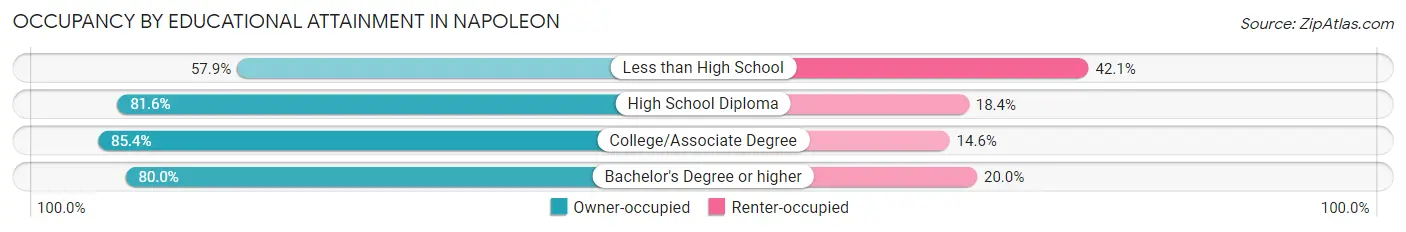
| Household Size | Owner-occupied | Renter-occupied |
| Less than High School | 11 (57.9%) | 8 (42.1%) |
| High School Diploma | 80 (81.6%) | 18 (18.4%) |
| College/Associate Degree | 129 (85.4%) | 22 (14.6%) |
| Bachelor's Degree or higher | 64 (80.0%) | 16 (20.0%) |
Occupancy by Age of Householder in Napoleon
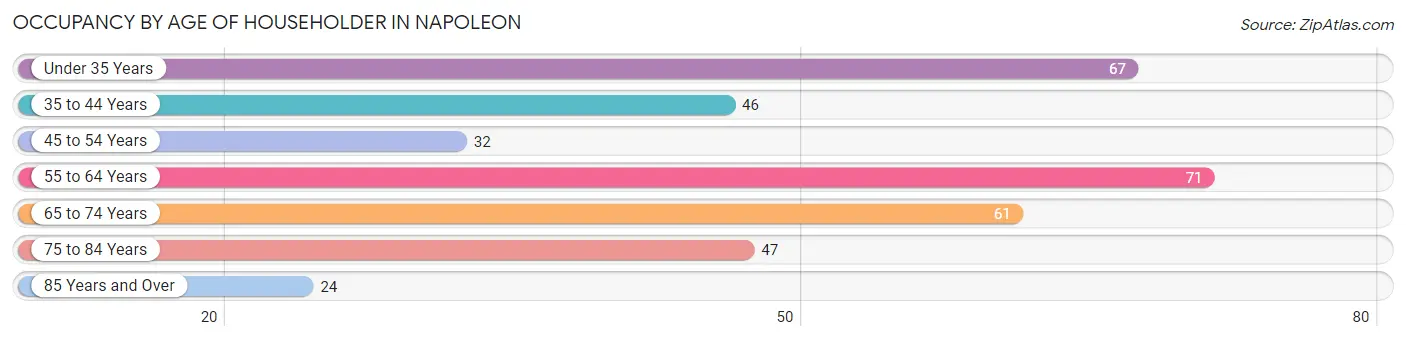
| Age Bracket | # Households | % Households |
| Under 35 Years | 67 | 19.3% |
| 35 to 44 Years | 46 | 13.2% |
| 45 to 54 Years | 32 | 9.2% |
| 55 to 64 Years | 71 | 20.4% |
| 65 to 74 Years | 61 | 17.5% |
| 75 to 84 Years | 47 | 13.5% |
| 85 Years and Over | 24 | 6.9% |
| Total | 348 | 100.0% |
Housing Finances in Napoleon
Median Income by Occupancy in Napoleon
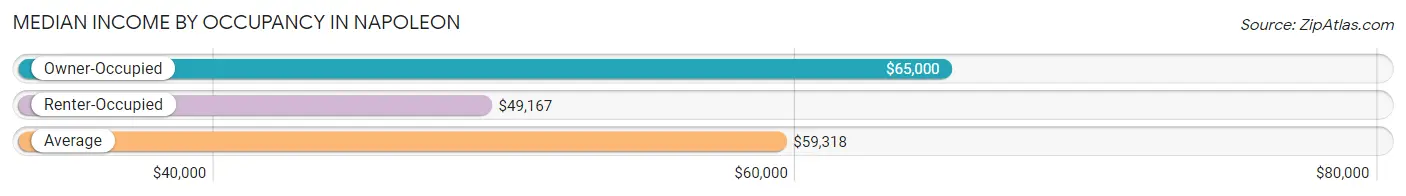
| Occupancy Type | # Households | Median Income |
| Owner-Occupied | 284 (81.6%) | $65,000 |
| Renter-Occupied | 64 (18.4%) | $49,167 |
| Average | 348 (100.0%) | $59,318 |
Occupancy by Householder Income Bracket in Napoleon
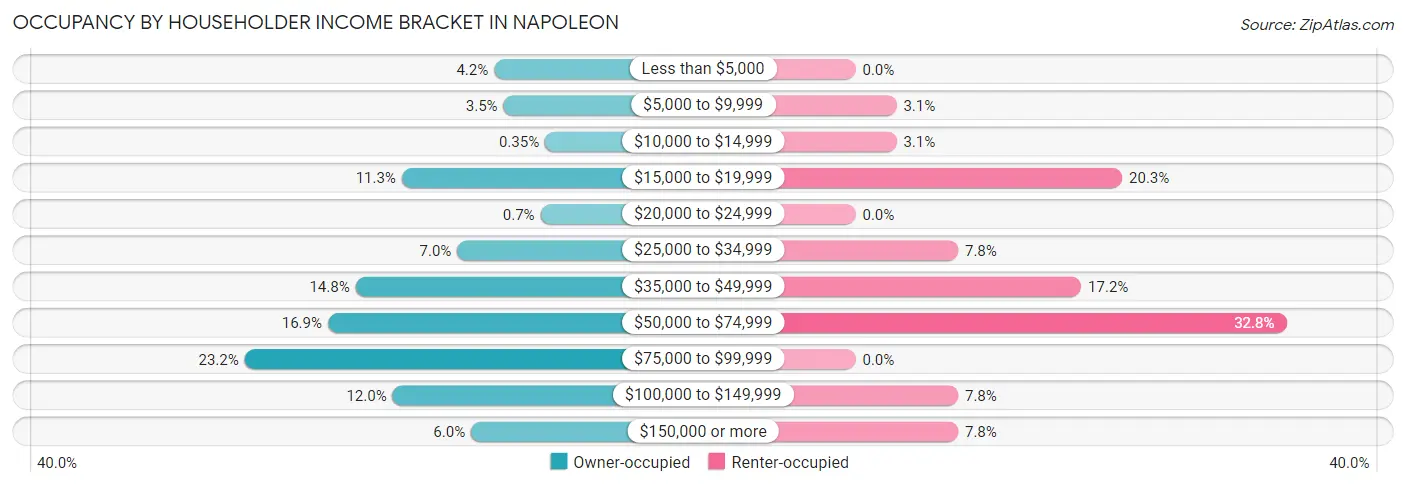
| Income Bracket | Owner-occupied | Renter-occupied |
| Less than $5,000 | 12 (4.2%) | 0 (0.0%) |
| $5,000 to $9,999 | 10 (3.5%) | 2 (3.1%) |
| $10,000 to $14,999 | 1 (0.4%) | 2 (3.1%) |
| $15,000 to $19,999 | 32 (11.3%) | 13 (20.3%) |
| $20,000 to $24,999 | 2 (0.7%) | 0 (0.0%) |
| $25,000 to $34,999 | 20 (7.0%) | 5 (7.8%) |
| $35,000 to $49,999 | 42 (14.8%) | 11 (17.2%) |
| $50,000 to $74,999 | 48 (16.9%) | 21 (32.8%) |
| $75,000 to $99,999 | 66 (23.2%) | 0 (0.0%) |
| $100,000 to $149,999 | 34 (12.0%) | 5 (7.8%) |
| $150,000 or more | 17 (6.0%) | 5 (7.8%) |
| Total | 284 (100.0%) | 64 (100.0%) |
Monthly Housing Cost Tiers in Napoleon
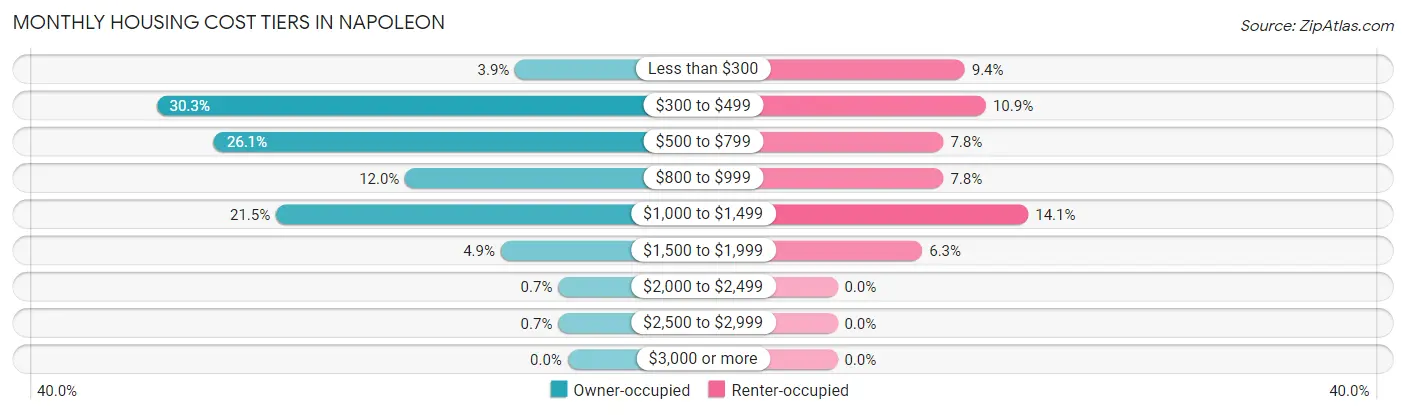
| Monthly Cost | Owner-occupied | Renter-occupied |
| Less than $300 | 11 (3.9%) | 6 (9.4%) |
| $300 to $499 | 86 (30.3%) | 7 (10.9%) |
| $500 to $799 | 74 (26.1%) | 5 (7.8%) |
| $800 to $999 | 34 (12.0%) | 5 (7.8%) |
| $1,000 to $1,499 | 61 (21.5%) | 9 (14.1%) |
| $1,500 to $1,999 | 14 (4.9%) | 4 (6.2%) |
| $2,000 to $2,499 | 2 (0.7%) | 0 (0.0%) |
| $2,500 to $2,999 | 2 (0.7%) | 0 (0.0%) |
| $3,000 or more | 0 (0.0%) | 0 (0.0%) |
| Total | 284 (100.0%) | 64 (100.0%) |
Physical Housing Characteristics in Napoleon
Housing Structures in Napoleon
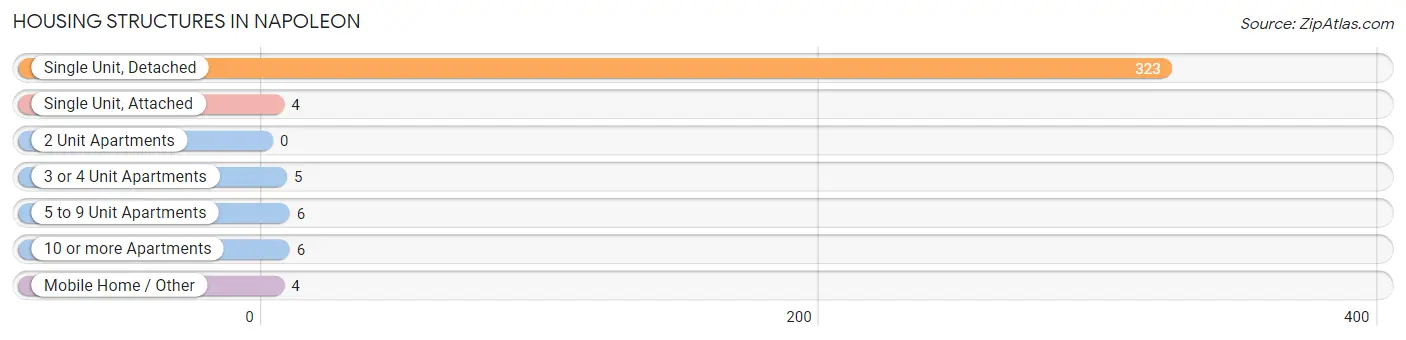
| Structure Type | # Housing Units | % Housing Units |
| Single Unit, Detached | 323 | 92.8% |
| Single Unit, Attached | 4 | 1.1% |
| 2 Unit Apartments | 0 | 0.0% |
| 3 or 4 Unit Apartments | 5 | 1.4% |
| 5 to 9 Unit Apartments | 6 | 1.7% |
| 10 or more Apartments | 6 | 1.7% |
| Mobile Home / Other | 4 | 1.1% |
| Total | 348 | 100.0% |
Housing Structures by Occupancy in Napoleon
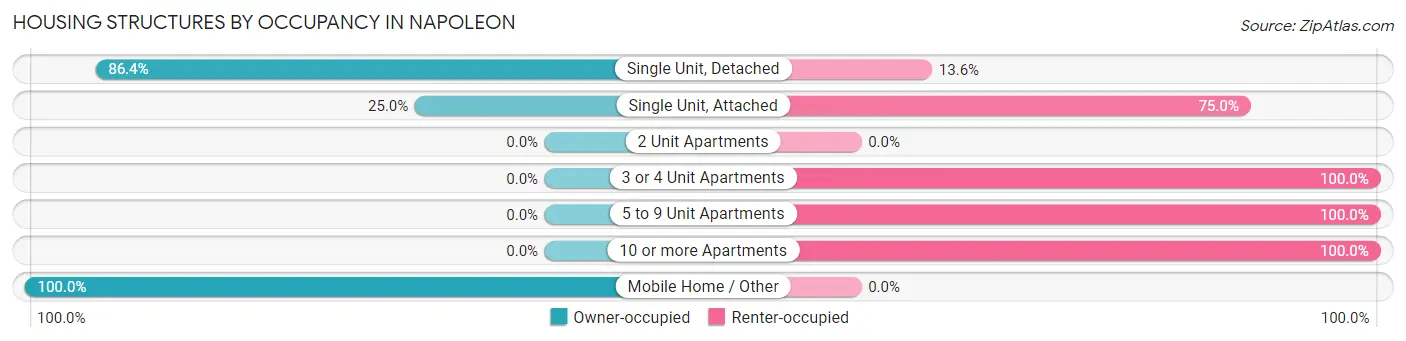
| Structure Type | Owner-occupied | Renter-occupied |
| Single Unit, Detached | 279 (86.4%) | 44 (13.6%) |
| Single Unit, Attached | 1 (25.0%) | 3 (75.0%) |
| 2 Unit Apartments | 0 (0.0%) | 0 (0.0%) |
| 3 or 4 Unit Apartments | 0 (0.0%) | 5 (100.0%) |
| 5 to 9 Unit Apartments | 0 (0.0%) | 6 (100.0%) |
| 10 or more Apartments | 0 (0.0%) | 6 (100.0%) |
| Mobile Home / Other | 4 (100.0%) | 0 (0.0%) |
| Total | 284 (81.6%) | 64 (18.4%) |
Housing Structures by Number of Rooms in Napoleon
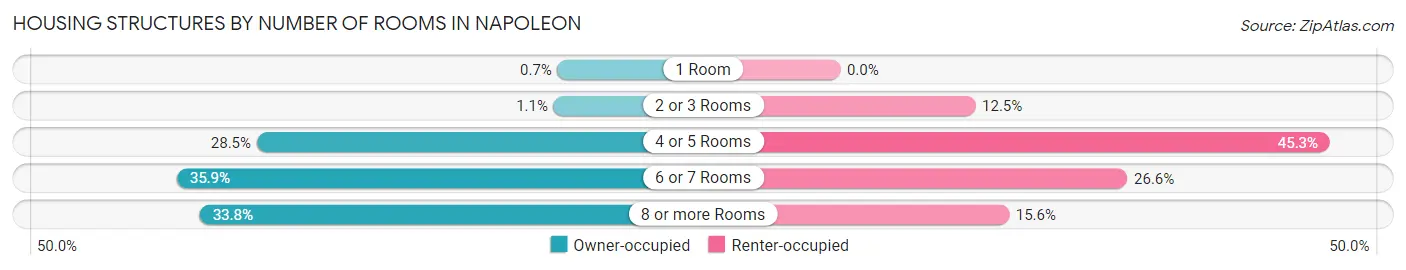
| Number of Rooms | Owner-occupied | Renter-occupied |
| 1 Room | 2 (0.7%) | 0 (0.0%) |
| 2 or 3 Rooms | 3 (1.1%) | 8 (12.5%) |
| 4 or 5 Rooms | 81 (28.5%) | 29 (45.3%) |
| 6 or 7 Rooms | 102 (35.9%) | 17 (26.6%) |
| 8 or more Rooms | 96 (33.8%) | 10 (15.6%) |
| Total | 284 (100.0%) | 64 (100.0%) |
Housing Structure by Heating Type in Napoleon
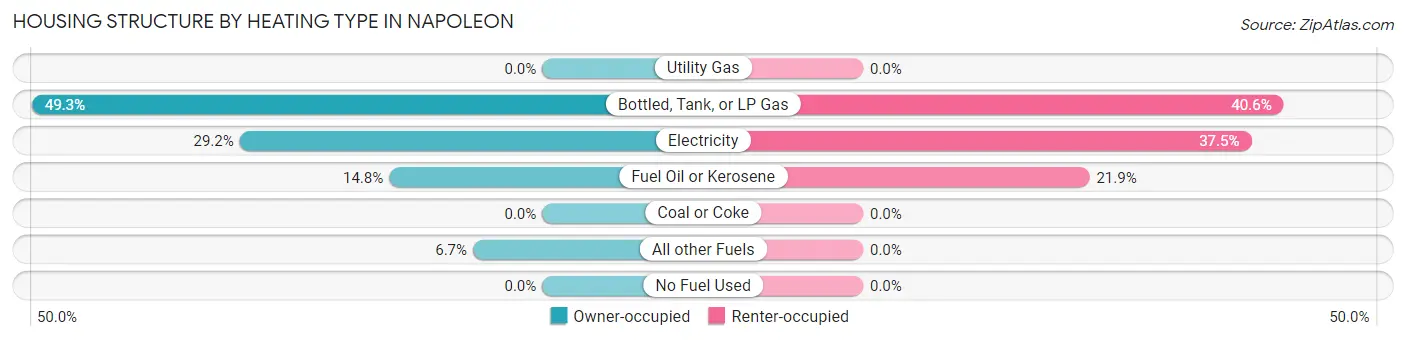
| Heating Type | Owner-occupied | Renter-occupied |
| Utility Gas | 0 (0.0%) | 0 (0.0%) |
| Bottled, Tank, or LP Gas | 140 (49.3%) | 26 (40.6%) |
| Electricity | 83 (29.2%) | 24 (37.5%) |
| Fuel Oil or Kerosene | 42 (14.8%) | 14 (21.9%) |
| Coal or Coke | 0 (0.0%) | 0 (0.0%) |
| All other Fuels | 19 (6.7%) | 0 (0.0%) |
| No Fuel Used | 0 (0.0%) | 0 (0.0%) |
| Total | 284 (100.0%) | 64 (100.0%) |
Household Vehicle Usage in Napoleon
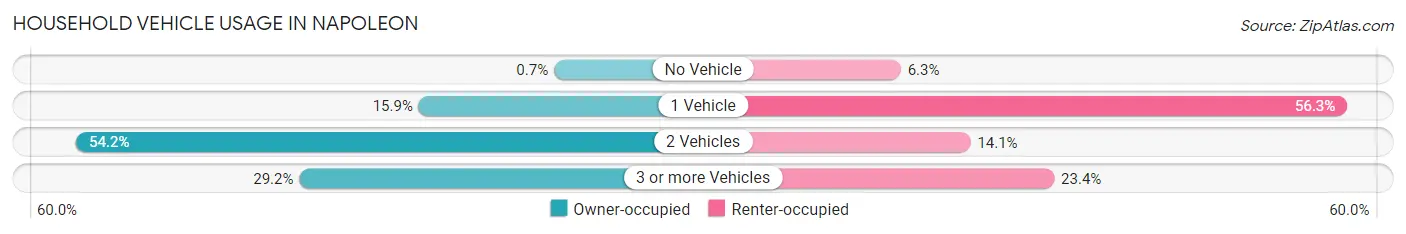
| Vehicles per Household | Owner-occupied | Renter-occupied |
| No Vehicle | 2 (0.7%) | 4 (6.2%) |
| 1 Vehicle | 45 (15.9%) | 36 (56.2%) |
| 2 Vehicles | 154 (54.2%) | 9 (14.1%) |
| 3 or more Vehicles | 83 (29.2%) | 15 (23.4%) |
| Total | 284 (100.0%) | 64 (100.0%) |
Real Estate & Mortgages in Napoleon
Real Estate and Mortgage Overview in Napoleon
| Characteristic | Without Mortgage | With Mortgage |
| Housing Units | 177 | 107 |
| Median Property Value | $79,500 | $82,900 |
| Median Household Income | $47,750 | $7 |
| Monthly Housing Costs | $487 | $0 |
| Real Estate Taxes | $1,210 | $0 |
Property Value by Mortgage Status in Napoleon
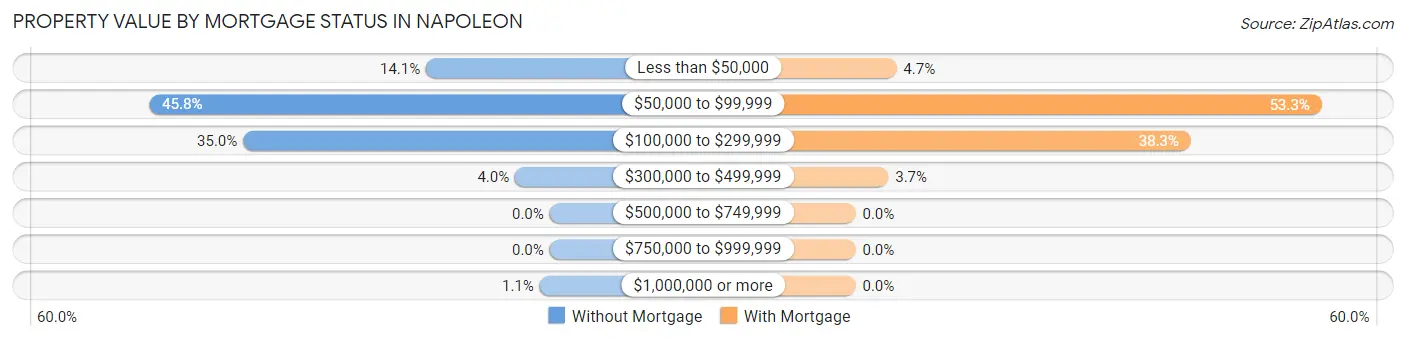
| Property Value | Without Mortgage | With Mortgage |
| Less than $50,000 | 25 (14.1%) | 5 (4.7%) |
| $50,000 to $99,999 | 81 (45.8%) | 57 (53.3%) |
| $100,000 to $299,999 | 62 (35.0%) | 41 (38.3%) |
| $300,000 to $499,999 | 7 (4.0%) | 4 (3.7%) |
| $500,000 to $749,999 | 0 (0.0%) | 0 (0.0%) |
| $750,000 to $999,999 | 0 (0.0%) | 0 (0.0%) |
| $1,000,000 or more | 2 (1.1%) | 0 (0.0%) |
| Total | 177 (100.0%) | 107 (100.0%) |
Household Income by Mortgage Status in Napoleon
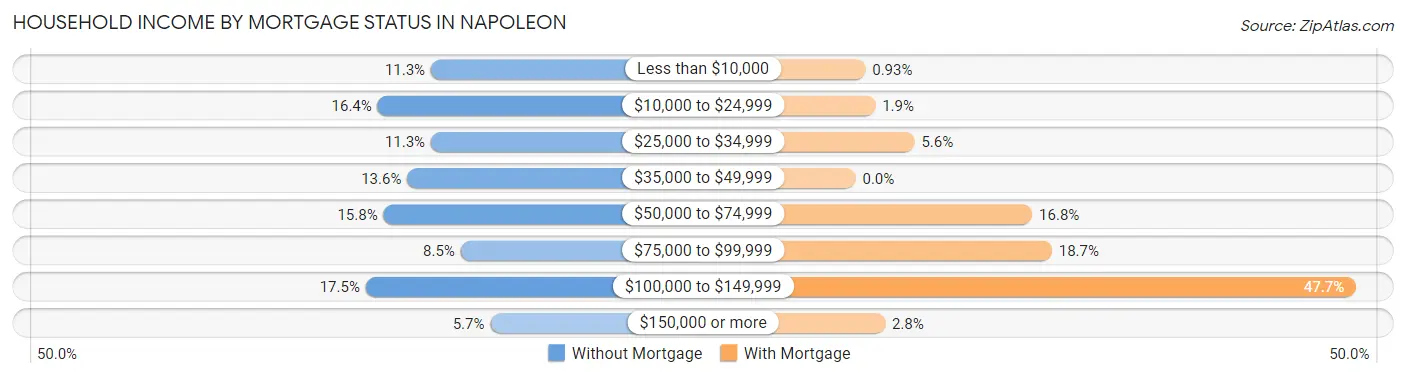
| Household Income | Without Mortgage | With Mortgage |
| Less than $10,000 | 20 (11.3%) | 1 (0.9%) |
| $10,000 to $24,999 | 29 (16.4%) | 2 (1.9%) |
| $25,000 to $34,999 | 20 (11.3%) | 6 (5.6%) |
| $35,000 to $49,999 | 24 (13.6%) | 0 (0.0%) |
| $50,000 to $74,999 | 28 (15.8%) | 18 (16.8%) |
| $75,000 to $99,999 | 15 (8.5%) | 20 (18.7%) |
| $100,000 to $149,999 | 31 (17.5%) | 51 (47.7%) |
| $150,000 or more | 10 (5.7%) | 3 (2.8%) |
| Total | 177 (100.0%) | 107 (100.0%) |
Property Value to Household Income Ratio in Napoleon
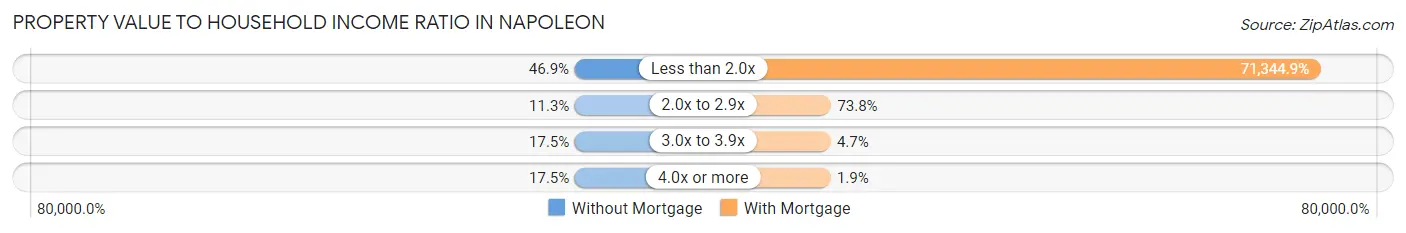
| Value-to-Income Ratio | Without Mortgage | With Mortgage |
| Less than 2.0x | 83 (46.9%) | 76,339 (71,344.9%) |
| 2.0x to 2.9x | 20 (11.3%) | 79 (73.8%) |
| 3.0x to 3.9x | 31 (17.5%) | 5 (4.7%) |
| 4.0x or more | 31 (17.5%) | 2 (1.9%) |
| Total | 177 (100.0%) | 107 (100.0%) |
Real Estate Taxes by Mortgage Status in Napoleon
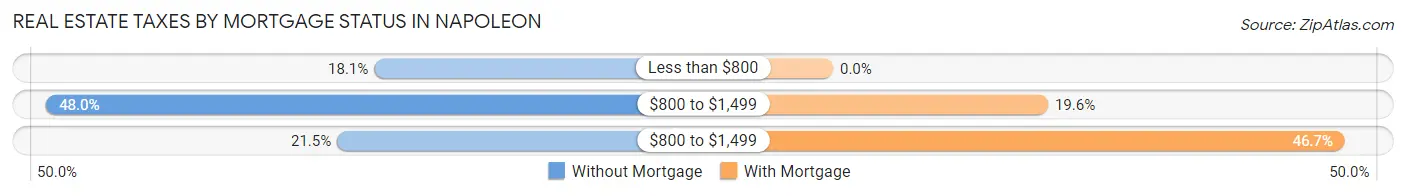
| Property Taxes | Without Mortgage | With Mortgage |
| Less than $800 | 32 (18.1%) | 0 (0.0%) |
| $800 to $1,499 | 85 (48.0%) | 21 (19.6%) |
| $800 to $1,499 | 38 (21.5%) | 50 (46.7%) |
| Total | 177 (100.0%) | 107 (100.0%) |
Health & Disability in Napoleon
Health Insurance Coverage by Age in Napoleon
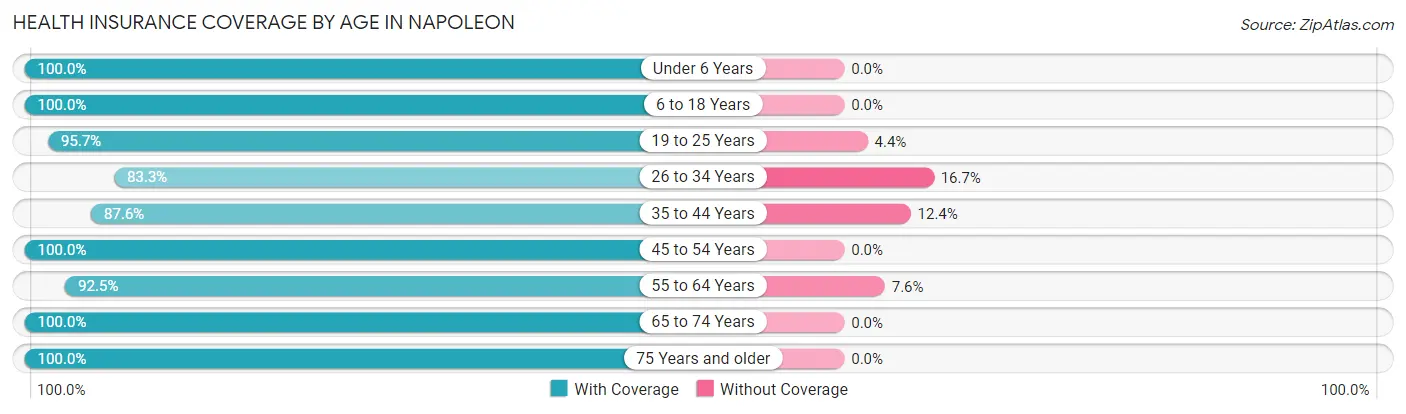
| Age Bracket | With Coverage | Without Coverage |
| Under 6 Years | 58 (100.0%) | 0 (0.0%) |
| 6 to 18 Years | 151 (100.0%) | 0 (0.0%) |
| 19 to 25 Years | 44 (95.7%) | 2 (4.3%) |
| 26 to 34 Years | 45 (83.3%) | 9 (16.7%) |
| 35 to 44 Years | 85 (87.6%) | 12 (12.4%) |
| 45 to 54 Years | 66 (100.0%) | 0 (0.0%) |
| 55 to 64 Years | 98 (92.4%) | 8 (7.5%) |
| 65 to 74 Years | 83 (100.0%) | 0 (0.0%) |
| 75 Years and older | 105 (100.0%) | 0 (0.0%) |
| Total | 735 (96.0%) | 31 (4.1%) |
Health Insurance Coverage by Citizenship Status in Napoleon
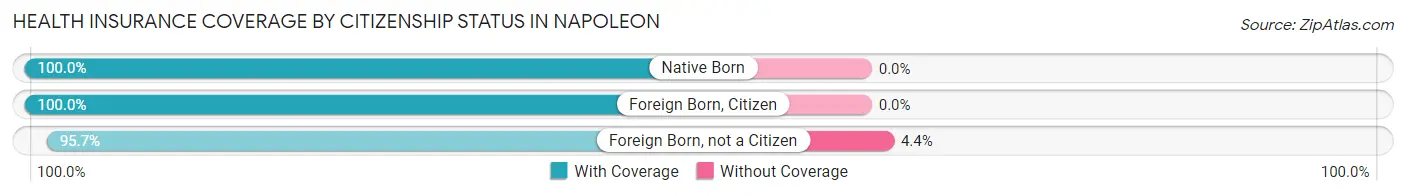
| Citizenship Status | With Coverage | Without Coverage |
| Native Born | 58 (100.0%) | 0 (0.0%) |
| Foreign Born, Citizen | 151 (100.0%) | 0 (0.0%) |
| Foreign Born, not a Citizen | 44 (95.7%) | 2 (4.3%) |
Health Insurance Coverage by Household Income in Napoleon
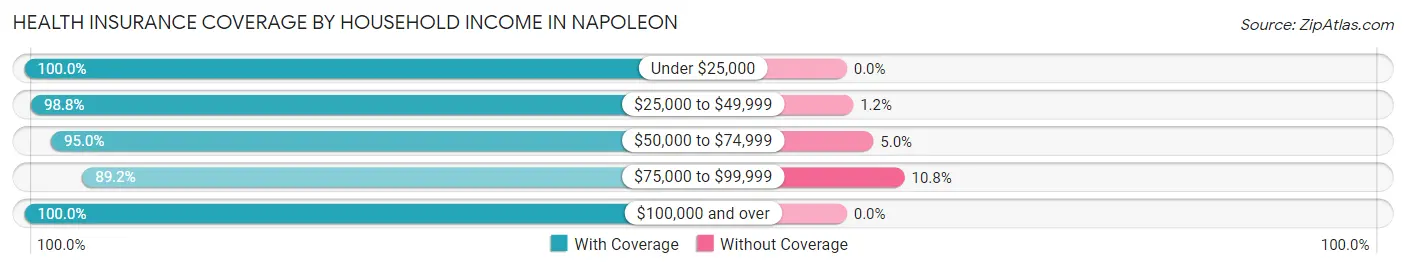
| Household Income | With Coverage | Without Coverage |
| Under $25,000 | 101 (100.0%) | 0 (0.0%) |
| $25,000 to $49,999 | 163 (98.8%) | 2 (1.2%) |
| $50,000 to $74,999 | 153 (95.0%) | 8 (5.0%) |
| $75,000 to $99,999 | 173 (89.2%) | 21 (10.8%) |
| $100,000 and over | 145 (100.0%) | 0 (0.0%) |
Public vs Private Health Insurance Coverage by Age in Napoleon
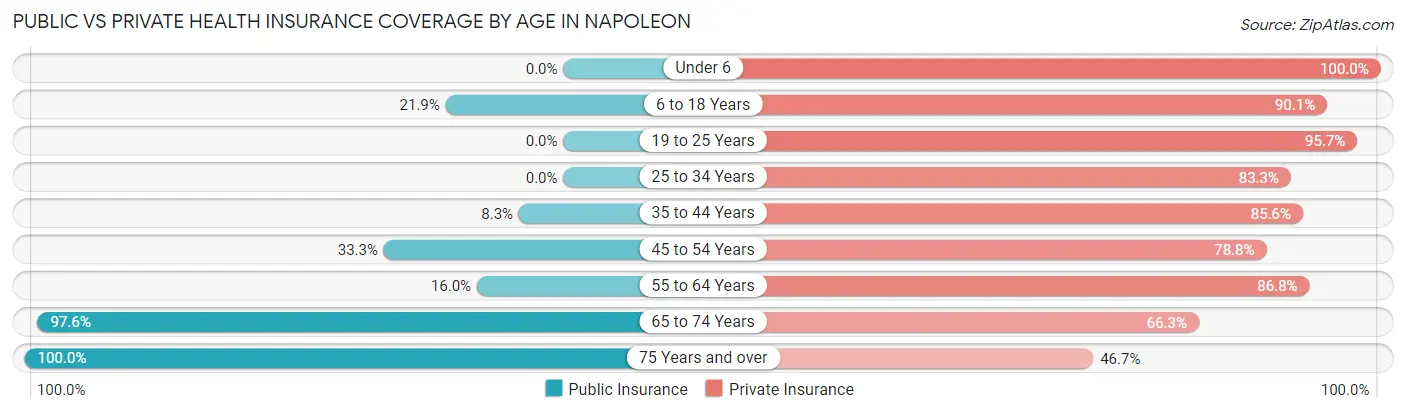
| Age Bracket | Public Insurance | Private Insurance |
| Under 6 | 0 (0.0%) | 58 (100.0%) |
| 6 to 18 Years | 33 (21.8%) | 136 (90.1%) |
| 19 to 25 Years | 0 (0.0%) | 44 (95.7%) |
| 25 to 34 Years | 0 (0.0%) | 45 (83.3%) |
| 35 to 44 Years | 8 (8.3%) | 83 (85.6%) |
| 45 to 54 Years | 22 (33.3%) | 52 (78.8%) |
| 55 to 64 Years | 17 (16.0%) | 92 (86.8%) |
| 65 to 74 Years | 81 (97.6%) | 55 (66.3%) |
| 75 Years and over | 105 (100.0%) | 49 (46.7%) |
| Total | 266 (34.7%) | 614 (80.2%) |
Disability Status by Sex by Age in Napoleon
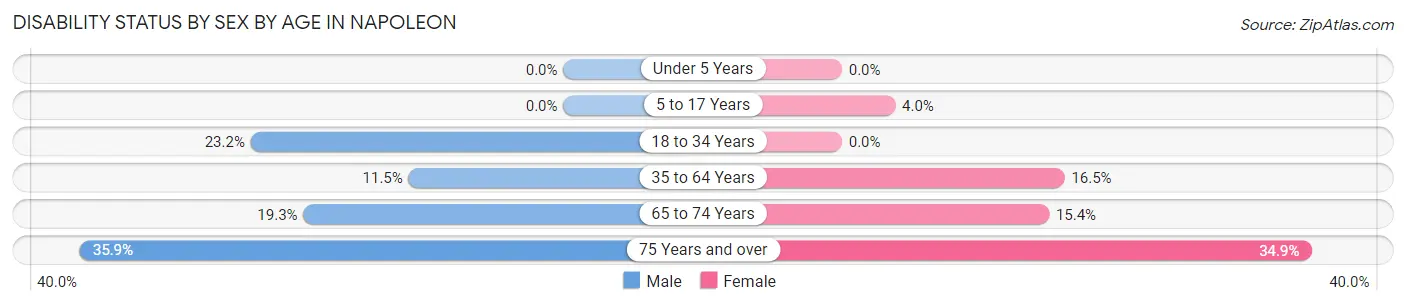
| Age Bracket | Male | Female |
| Under 5 Years | 0 (0.0%) | 0 (0.0%) |
| 5 to 17 Years | 0 (0.0%) | 4 (4.0%) |
| 18 to 34 Years | 13 (23.2%) | 0 (0.0%) |
| 35 to 64 Years | 17 (11.5%) | 20 (16.5%) |
| 65 to 74 Years | 11 (19.3%) | 4 (15.4%) |
| 75 Years and over | 14 (35.9%) | 23 (34.8%) |
Disability Class by Sex by Age in Napoleon
Disability Class: Hearing Difficulty
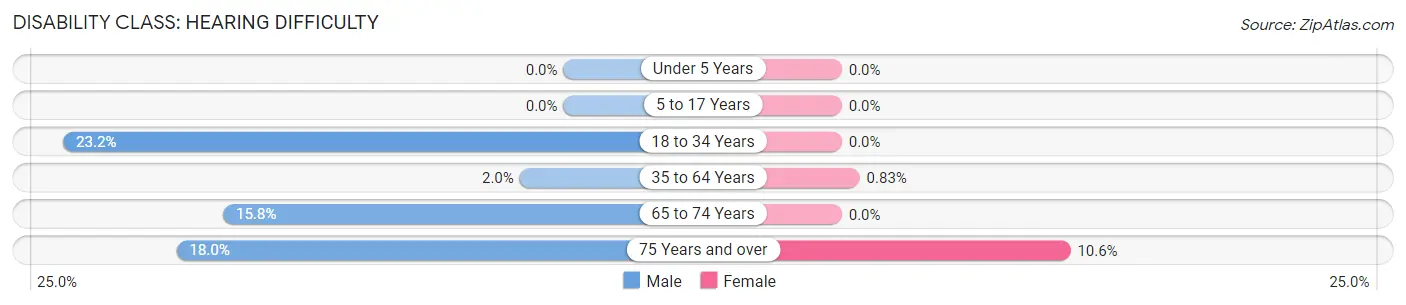
| Age Bracket | Male | Female |
| Under 5 Years | 0 (0.0%) | 0 (0.0%) |
| 5 to 17 Years | 0 (0.0%) | 0 (0.0%) |
| 18 to 34 Years | 13 (23.2%) | 0 (0.0%) |
| 35 to 64 Years | 3 (2.0%) | 1 (0.8%) |
| 65 to 74 Years | 9 (15.8%) | 0 (0.0%) |
| 75 Years and over | 7 (17.9%) | 7 (10.6%) |
Disability Class: Vision Difficulty
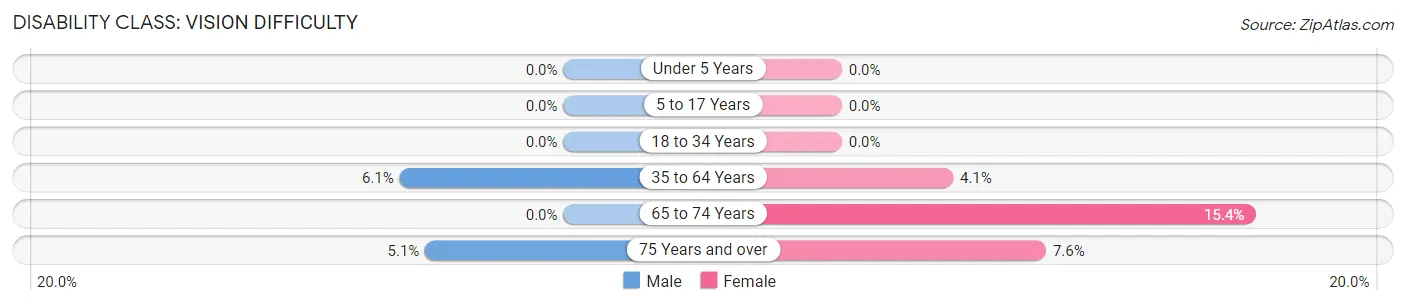
| Age Bracket | Male | Female |
| Under 5 Years | 0 (0.0%) | 0 (0.0%) |
| 5 to 17 Years | 0 (0.0%) | 0 (0.0%) |
| 18 to 34 Years | 0 (0.0%) | 0 (0.0%) |
| 35 to 64 Years | 9 (6.1%) | 5 (4.1%) |
| 65 to 74 Years | 0 (0.0%) | 4 (15.4%) |
| 75 Years and over | 2 (5.1%) | 5 (7.6%) |
Disability Class: Cognitive Difficulty
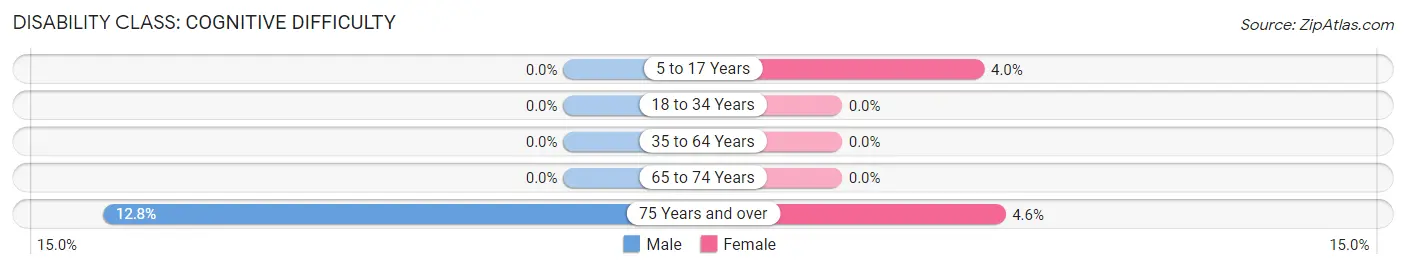
| Age Bracket | Male | Female |
| 5 to 17 Years | 0 (0.0%) | 4 (4.0%) |
| 18 to 34 Years | 0 (0.0%) | 0 (0.0%) |
| 35 to 64 Years | 0 (0.0%) | 0 (0.0%) |
| 65 to 74 Years | 0 (0.0%) | 0 (0.0%) |
| 75 Years and over | 5 (12.8%) | 3 (4.5%) |
Disability Class: Ambulatory Difficulty
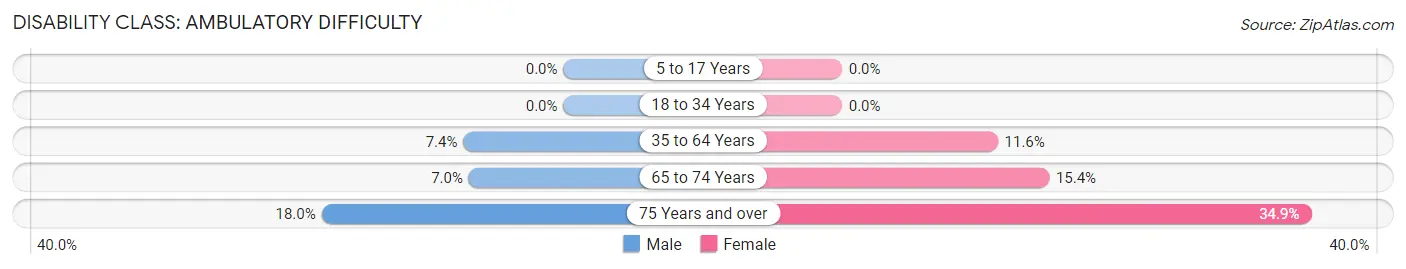
| Age Bracket | Male | Female |
| 5 to 17 Years | 0 (0.0%) | 0 (0.0%) |
| 18 to 34 Years | 0 (0.0%) | 0 (0.0%) |
| 35 to 64 Years | 11 (7.4%) | 14 (11.6%) |
| 65 to 74 Years | 4 (7.0%) | 4 (15.4%) |
| 75 Years and over | 7 (17.9%) | 23 (34.8%) |
Disability Class: Self-Care Difficulty
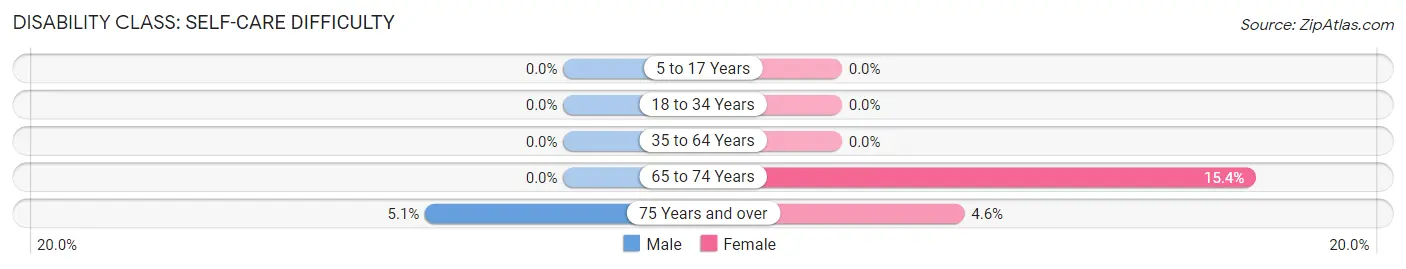
| Age Bracket | Male | Female |
| 5 to 17 Years | 0 (0.0%) | 0 (0.0%) |
| 18 to 34 Years | 0 (0.0%) | 0 (0.0%) |
| 35 to 64 Years | 0 (0.0%) | 0 (0.0%) |
| 65 to 74 Years | 0 (0.0%) | 4 (15.4%) |
| 75 Years and over | 2 (5.1%) | 3 (4.5%) |
Technology Access in Napoleon
Computing Device Access in Napoleon
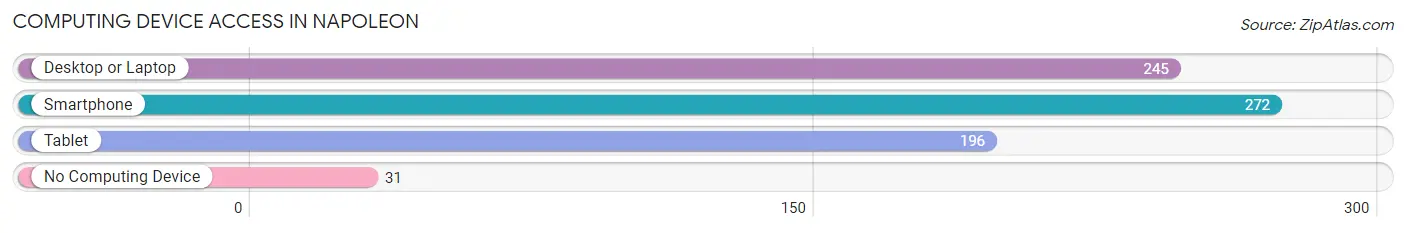
| Device Type | # Households | % Households |
| Desktop or Laptop | 245 | 70.4% |
| Smartphone | 272 | 78.2% |
| Tablet | 196 | 56.3% |
| No Computing Device | 31 | 8.9% |
| Total | 348 | 100.0% |
Internet Access in Napoleon
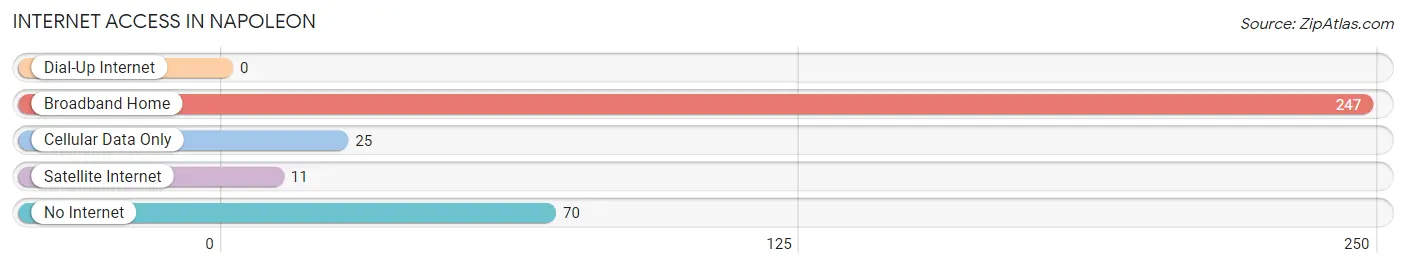
| Internet Type | # Households | % Households |
| Dial-Up Internet | 0 | 0.0% |
| Broadband Home | 247 | 71.0% |
| Cellular Data Only | 25 | 7.2% |
| Satellite Internet | 11 | 3.2% |
| No Internet | 70 | 20.1% |
| Total | 348 | 100.0% |
Napoleon Summary
Napoleon, North Dakota is a small city located in the south-central region of the state. It is the county seat of Logan County and is situated on the banks of the Missouri River. The city has a population of 1,845 as of the 2020 census, making it the second-largest city in the county.
History
Napoleon was founded in 1883 by German immigrants who had come to the area to farm. The city was named after Napoleon Bonaparte, the French emperor. The city was incorporated in 1885 and quickly grew to become a thriving agricultural center. The city was also home to a number of businesses, including a flour mill, a creamery, a brewery, and a brickyard.
Geography
Napoleon is located in the south-central region of North Dakota, about 50 miles south of Bismarck. The city is situated on the banks of the Missouri River and is surrounded by rolling hills and prairies. The city has a total area of 1.3 square miles, all of which is land.
Economy
Napoleon’s economy is largely based on agriculture. The city is home to a number of farms and ranches, as well as a number of businesses related to agriculture, such as feed stores, grain elevators, and agricultural equipment dealers. The city is also home to a number of manufacturing businesses, including a furniture factory and a plastics factory.
Demographics
As of the 2020 census, the population of Napoleon was 1,845. The racial makeup of the city was 95.2% White, 0.7% African American, 0.3% Native American, 0.2% Asian, 0.1% Pacific Islander, and 3.5% from other races. The median household income was $45,938, and the median family income was $51,938.
Conclusion
Napoleon, North Dakota is a small city located in the south-central region of the state. It is the county seat of Logan County and is situated on the banks of the Missouri River. The city has a population of 1,845 as of the 2020 census, making it the second-largest city in the county. The city’s economy is largely based on agriculture, and it is home to a number of businesses related to agriculture, as well as a number of manufacturing businesses. The racial makeup of the city is predominantly White, with a small percentage of African American, Native American, Asian, and Pacific Islander residents. The median household income is $45,938, and the median family income is $51,938.
Common Questions
What is Per Capita Income in Napoleon?
Per Capita income in Napoleon is $29,897.
What is the Median Family Income in Napoleon?
Median Family Income in Napoleon is $72,768.
What is the Median Household income in Napoleon?
Median Household Income in Napoleon is $59,318.
What is Income or Wage Gap in Napoleon?
Income or Wage Gap in Napoleon is 48.9%.
Women in Napoleon earn 51.1 cents for every dollar earned by a man.
What is Inequality or Gini Index in Napoleon?
Inequality or Gini Index in Napoleon is 0.42.
What is the Total Population of Napoleon?
Total Population of Napoleon is 808.
What is the Total Male Population of Napoleon?
Total Male Population of Napoleon is 375.
What is the Total Female Population of Napoleon?
Total Female Population of Napoleon is 433.
What is the Ratio of Males per 100 Females in Napoleon?
There are 86.61 Males per 100 Females in Napoleon.
What is the Ratio of Females per 100 Males in Napoleon?
There are 115.47 Females per 100 Males in Napoleon.
What is the Median Population Age in Napoleon?
Median Population Age in Napoleon is 44.3 Years.
What is the Average Family Size in Napoleon
Average Family Size in Napoleon is 3.0 People.
What is the Average Household Size in Napoleon
Average Household Size in Napoleon is 2.2 People.
How Large is the Labor Force in Napoleon?
There are 395 People in the Labor Forcein in Napoleon.
What is the Percentage of People in the Labor Force in Napoleon?
60.7% of People are in the Labor Force in Napoleon.
What is the Unemployment Rate in Napoleon?
Unemployment Rate in Napoleon is 0.5%.