Alamo, ND Map & Demographics
Alamo Map
Alamo Overview
$38,413
PER CAPITA INCOME
$76,667
AVG FAMILY INCOME
17.1%
WAGE / INCOME GAP [ % ]
82.9¢/ $1
WAGE / INCOME GAP [ $ ]
0.37
INEQUALITY / GINI INDEX
70
TOTAL POPULATION
47
MALE POPULATION
23
FEMALE POPULATION
204.35
MALES / 100 FEMALES
48.94
FEMALES / 100 MALES
57.4
MEDIAN AGE
2.3
AVG FAMILY SIZE
2.1
AVG HOUSEHOLD SIZE
40
LABOR FORCE [ PEOPLE ]
65.6%
PERCENT IN LABOR FORCE
15.0%
UNEMPLOYMENT RATE
Alamo Zip Codes
Alamo Area Codes
Income in Alamo
Income Overview in Alamo
| Characteristic | Number | Measure |
| Per Capita Income | 70 | $38,413 |
| Median Family Income | 28 | $76,667 |
| Mean Family Income | 28 | $90,650 |
| Median Household Income | 34 | $0 |
| Mean Household Income | 34 | $77,438 |
| Income Deficit | 28 | $0 |
| Wage / Income Gap (%) | 70 | 17.14% |
| Wage / Income Gap ($) | 70 | 82.86¢ per $1 |
| Gini / Inequality Index | 70 | 0.37 |
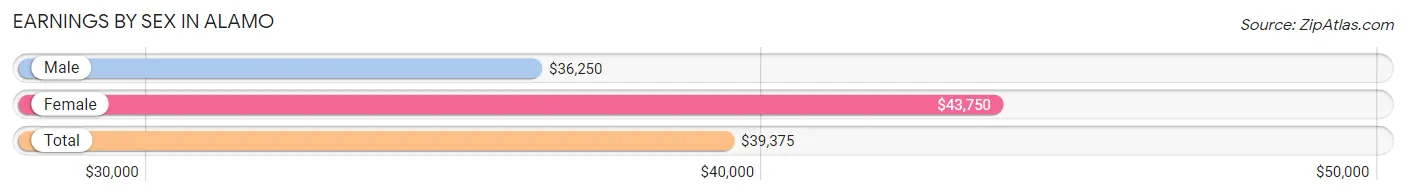
Earnings by Sex in Alamo
Average Earnings in Alamo are $39,375, $36,250 for men and $43,750 for women, a difference of 17.1%.
| Sex | Number | Average Earnings |
| Male | 35 (77.8%) | $36,250 |
| Female | 10 (22.2%) | $43,750 |
| Total | 45 (100.0%) | $39,375 |
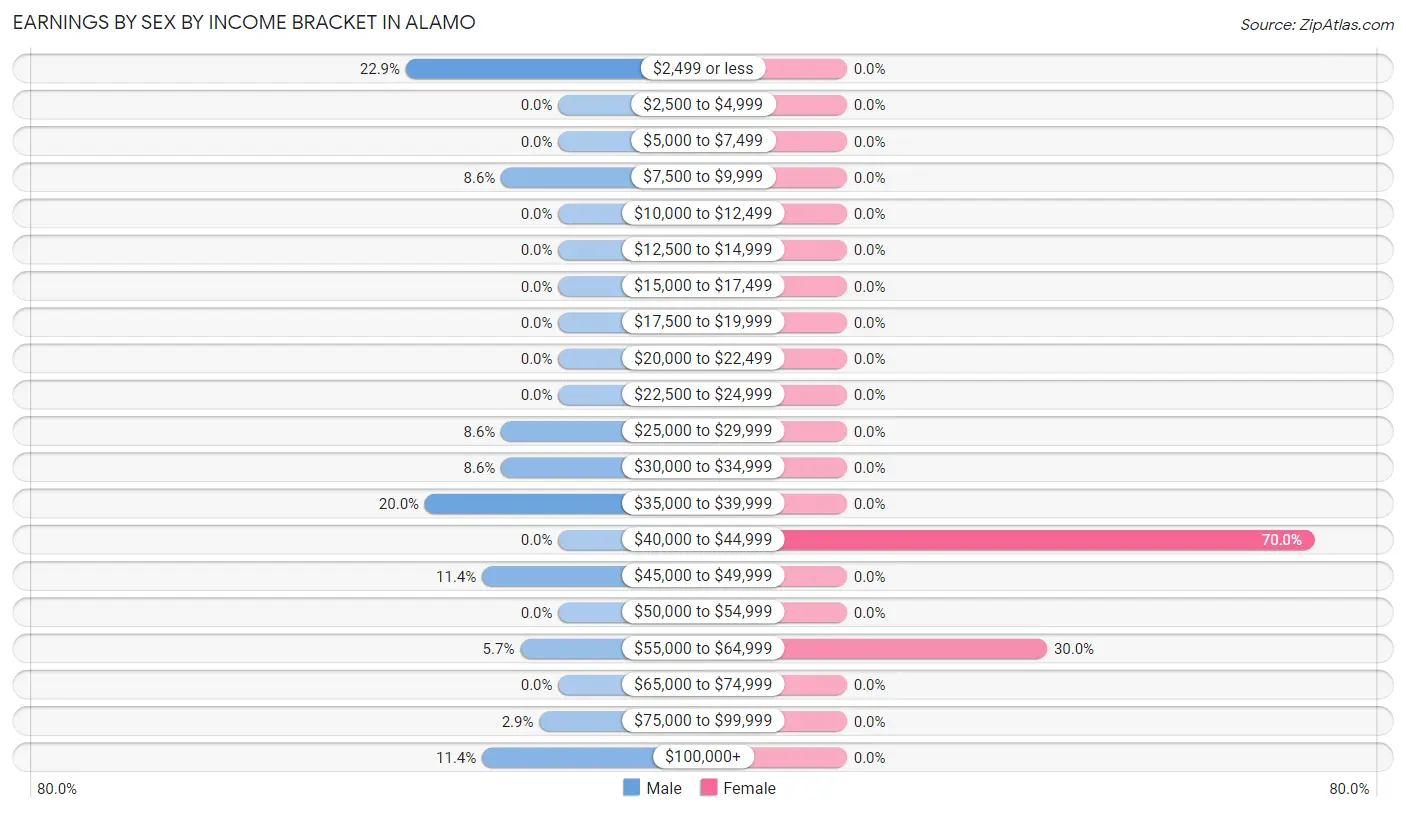
Earnings by Sex by Income Bracket in Alamo
The most common earnings brackets in Alamo are $2,499 or less for men (8 | 22.9%) and $40,000 to $44,999 for women (7 | 70.0%).
| Income | Male | Female |
| $2,499 or less | 8 (22.9%) | 0 (0.0%) |
| $2,500 to $4,999 | 0 (0.0%) | 0 (0.0%) |
| $5,000 to $7,499 | 0 (0.0%) | 0 (0.0%) |
| $7,500 to $9,999 | 3 (8.6%) | 0 (0.0%) |
| $10,000 to $12,499 | 0 (0.0%) | 0 (0.0%) |
| $12,500 to $14,999 | 0 (0.0%) | 0 (0.0%) |
| $15,000 to $17,499 | 0 (0.0%) | 0 (0.0%) |
| $17,500 to $19,999 | 0 (0.0%) | 0 (0.0%) |
| $20,000 to $22,499 | 0 (0.0%) | 0 (0.0%) |
| $22,500 to $24,999 | 0 (0.0%) | 0 (0.0%) |
| $25,000 to $29,999 | 3 (8.6%) | 0 (0.0%) |
| $30,000 to $34,999 | 3 (8.6%) | 0 (0.0%) |
| $35,000 to $39,999 | 7 (20.0%) | 0 (0.0%) |
| $40,000 to $44,999 | 0 (0.0%) | 7 (70.0%) |
| $45,000 to $49,999 | 4 (11.4%) | 0 (0.0%) |
| $50,000 to $54,999 | 0 (0.0%) | 0 (0.0%) |
| $55,000 to $64,999 | 2 (5.7%) | 3 (30.0%) |
| $65,000 to $74,999 | 0 (0.0%) | 0 (0.0%) |
| $75,000 to $99,999 | 1 (2.9%) | 0 (0.0%) |
| $100,000+ | 4 (11.4%) | 0 (0.0%) |
| Total | 35 (100.0%) | 10 (100.0%) |
Earnings by Sex by Educational Attainment in Alamo
| Educational Attainment | Male Income | Female Income |
| Less than High School | - | - |
| High School Diploma | - | - |
| College or Associate's Degree | - | - |
| Bachelor's Degree | - | - |
| Graduate Degree | - | - |
| Total | $36,250 | $43,750 |
Family Income in Alamo
Family Income Brackets in Alamo
According to the Alamo family income data, there are 12 families falling into the $75,000 to $99,999 income range, which is the most common income bracket and makes up 42.9% of all families.
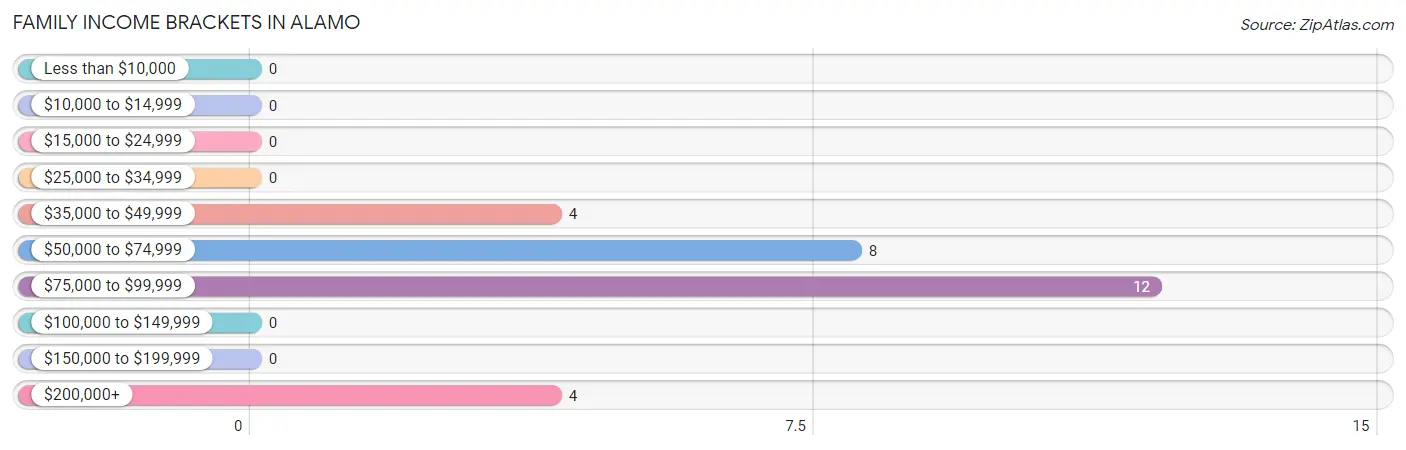
| Income Bracket | # Families | % Families |
| Less than $10,000 | 0 | 0.0% |
| $10,000 to $14,999 | 0 | 0.0% |
| $15,000 to $24,999 | 0 | 0.0% |
| $25,000 to $34,999 | 0 | 0.0% |
| $35,000 to $49,999 | 4 | 14.3% |
| $50,000 to $74,999 | 8 | 28.6% |
| $75,000 to $99,999 | 12 | 42.9% |
| $100,000 to $149,999 | 0 | 0.0% |
| $150,000 to $199,999 | 0 | 0.0% |
| $200,000+ | 4 | 14.3% |
Family Income by Famaliy Size in Alamo
2-person families (24 | 85.7%) account for the highest median family income in Alamo with $71,250 per family, while 2-person families (24 | 85.7%) have the highest median income of $35,625 per family member.
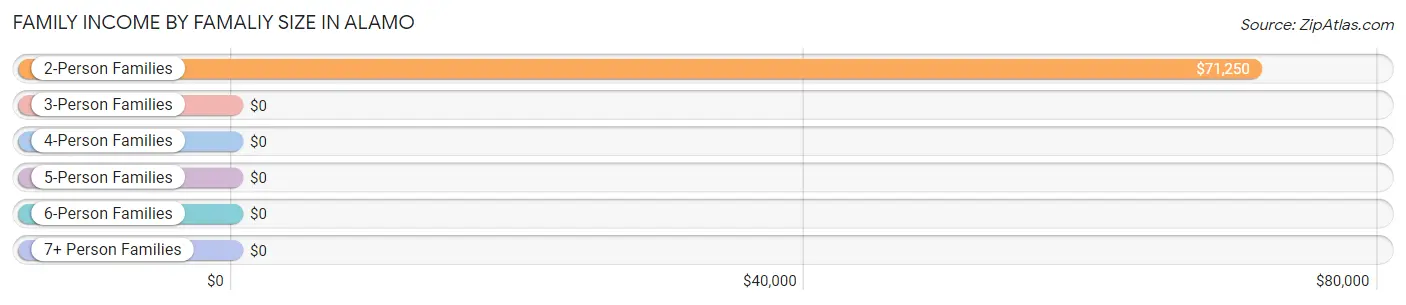
| Income Bracket | # Families | Median Income |
| 2-Person Families | 24 (85.7%) | $71,250 |
| 3-Person Families | 3 (10.7%) | $0 |
| 4-Person Families | 1 (3.6%) | $0 |
| 5-Person Families | 0 (0.0%) | $0 |
| 6-Person Families | 0 (0.0%) | $0 |
| 7+ Person Families | 0 (0.0%) | $0 |
| Total | 28 (100.0%) | $76,667 |
Family Income by Number of Earners in Alamo
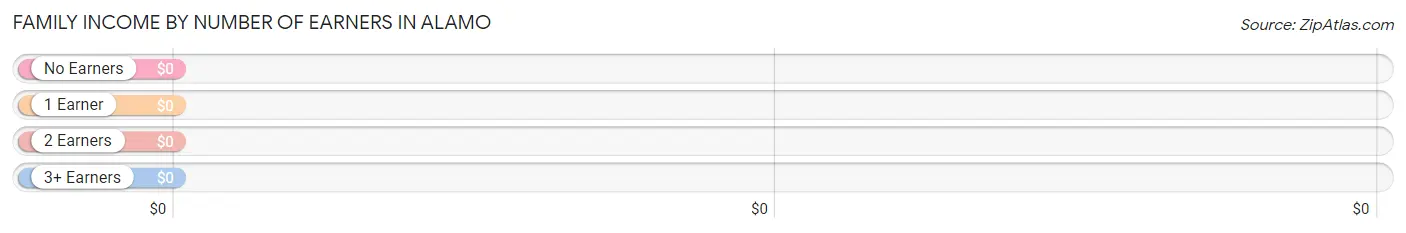
| Number of Earners | # Families | Median Income |
| No Earners | 0 (0.0%) | $0 |
| 1 Earner | 13 (46.4%) | $0 |
| 2 Earners | 12 (42.9%) | $0 |
| 3+ Earners | 3 (10.7%) | $0 |
| Total | 28 (100.0%) | $76,667 |
Household Income in Alamo
Household Income Brackets in Alamo
With 12 households falling in the category, the $75,000 to $99,999 income range is the most frequent in Alamo, accounting for 35.3% of all households.
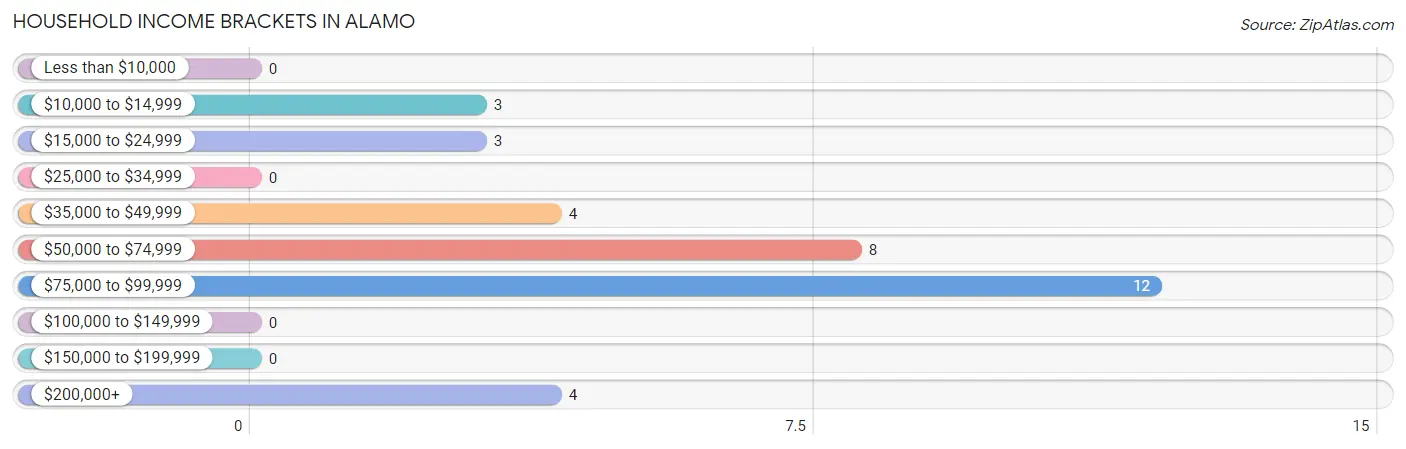
| Income Bracket | # Households | % Households |
| Less than $10,000 | 0 | 0.0% |
| $10,000 to $14,999 | 3 | 8.8% |
| $15,000 to $24,999 | 3 | 8.8% |
| $25,000 to $34,999 | 0 | 0.0% |
| $35,000 to $49,999 | 4 | 11.8% |
| $50,000 to $74,999 | 8 | 23.5% |
| $75,000 to $99,999 | 12 | 35.3% |
| $100,000 to $149,999 | 0 | 0.0% |
| $150,000 to $199,999 | 0 | 0.0% |
| $200,000+ | 4 | 11.8% |
Household Income by Householder Age in Alamo
The median household income in Alamo is $0, with the highest median household income of $89,063 found in the 45 to 64 years age bracket for the primary householder. A total of 19 households (55.9%) fall into this category.
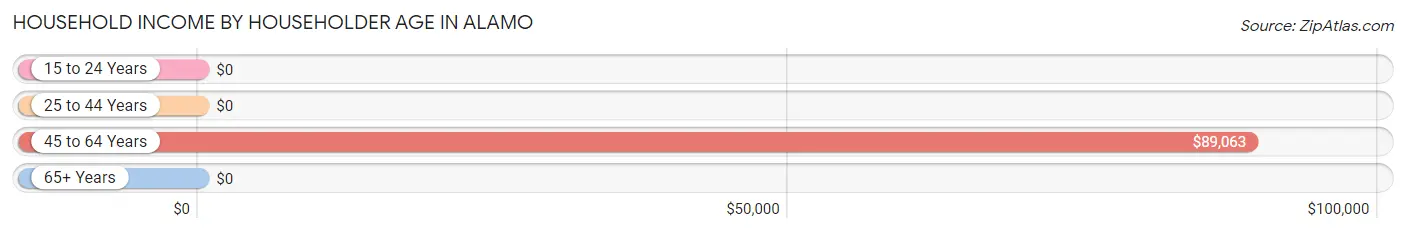
| Income Bracket | # Households | Median Income |
| 15 to 24 Years | 0 (0.0%) | $0 |
| 25 to 44 Years | 4 (11.8%) | $0 |
| 45 to 64 Years | 19 (55.9%) | $89,063 |
| 65+ Years | 11 (32.4%) | $0 |
| Total | 34 (100.0%) | $0 |
Poverty in Alamo
Income Below Poverty by Sex and Age in Alamo
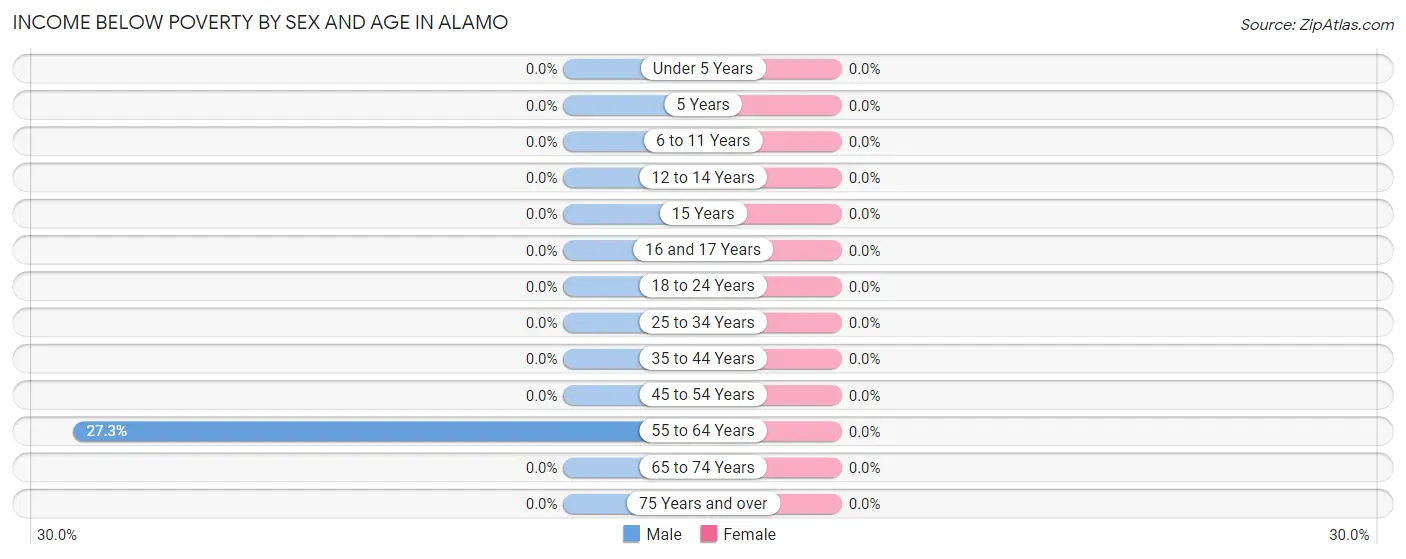
| Age Bracket | Male | Female |
| Under 5 Years | 0 (0.0%) | 0 (0.0%) |
| 5 Years | 0 (0.0%) | 0 (0.0%) |
| 6 to 11 Years | 0 (0.0%) | 0 (0.0%) |
| 12 to 14 Years | 0 (0.0%) | 0 (0.0%) |
| 15 Years | 0 (0.0%) | 0 (0.0%) |
| 16 and 17 Years | 0 (0.0%) | 0 (0.0%) |
| 18 to 24 Years | 0 (0.0%) | 0 (0.0%) |
| 25 to 34 Years | 0 (0.0%) | 0 (0.0%) |
| 35 to 44 Years | 0 (0.0%) | 0 (0.0%) |
| 45 to 54 Years | 0 (0.0%) | 0 (0.0%) |
| 55 to 64 Years | 3 (27.3%) | 0 (0.0%) |
| 65 to 74 Years | 0 (0.0%) | 0 (0.0%) |
| 75 Years and over | 0 (0.0%) | 0 (0.0%) |
| Total | 3 (6.4%) | 0 (0.0%) |
Income Above Poverty by Sex and Age in Alamo
According to the poverty statistics in Alamo, males aged 12 to 14 years and females aged under 5 years are the age groups that are most secure financially, with 100.0% of males and 100.0% of females in these age groups living above the poverty line.
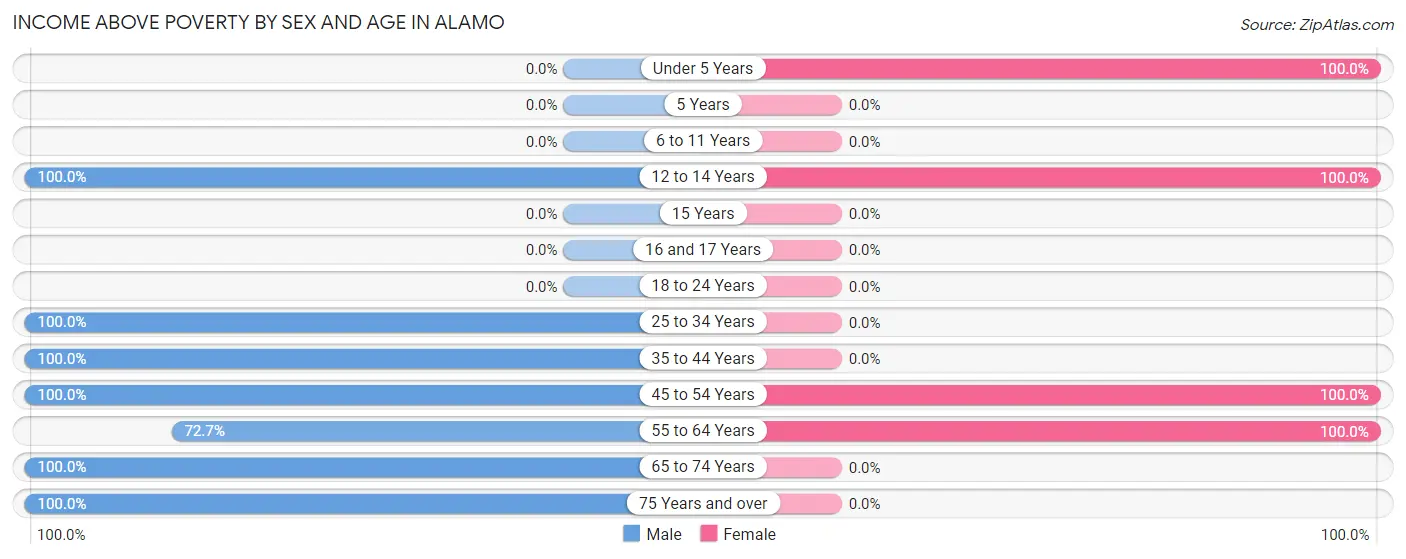
| Age Bracket | Male | Female |
| Under 5 Years | 0 (0.0%) | 4 (100.0%) |
| 5 Years | 0 (0.0%) | 0 (0.0%) |
| 6 to 11 Years | 0 (0.0%) | 0 (0.0%) |
| 12 to 14 Years | 2 (100.0%) | 3 (100.0%) |
| 15 Years | 0 (0.0%) | 0 (0.0%) |
| 16 and 17 Years | 0 (0.0%) | 0 (0.0%) |
| 18 to 24 Years | 0 (0.0%) | 0 (0.0%) |
| 25 to 34 Years | 5 (100.0%) | 0 (0.0%) |
| 35 to 44 Years | 5 (100.0%) | 0 (0.0%) |
| 45 to 54 Years | 9 (100.0%) | 4 (100.0%) |
| 55 to 64 Years | 8 (72.7%) | 12 (100.0%) |
| 65 to 74 Years | 12 (100.0%) | 0 (0.0%) |
| 75 Years and over | 3 (100.0%) | 0 (0.0%) |
| Total | 44 (93.6%) | 23 (100.0%) |
Income Below Poverty Among Married-Couple Families in Alamo
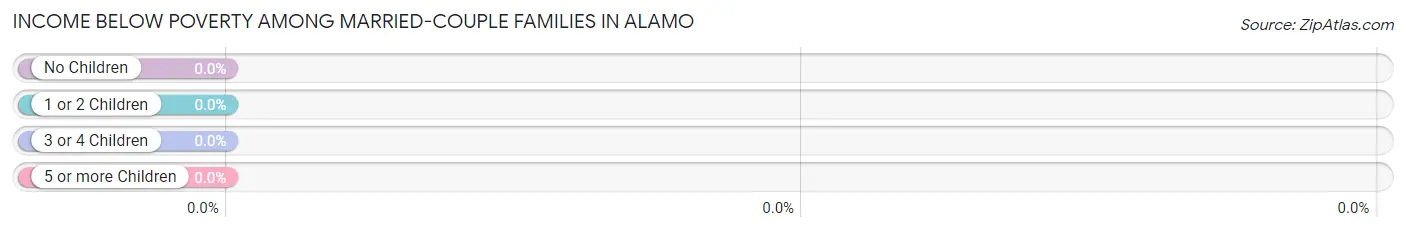
| Children | Above Poverty | Below Poverty |
| No Children | 14 (100.0%) | 0 (0.0%) |
| 1 or 2 Children | 1 (100.0%) | 0 (0.0%) |
| 3 or 4 Children | 0 (0.0%) | 0 (0.0%) |
| 5 or more Children | 0 (0.0%) | 0 (0.0%) |
| Total | 15 (100.0%) | 0 (0.0%) |
Income Below Poverty Among Single-Parent Households in Alamo
| Children | Single Father | Single Mother |
| No Children | 0 (0.0%) | 0 (0.0%) |
| 1 or 2 Children | 0 (0.0%) | 0 (0.0%) |
| 3 or 4 Children | 0 (0.0%) | 0 (0.0%) |
| 5 or more Children | 0 (0.0%) | 0 (0.0%) |
| Total | 0 (0.0%) | 0 (0.0%) |
Income Below Poverty Among Married-Couple vs Single-Parent Households in Alamo
| Children | Married-Couple Families | Single-Parent Households |
| No Children | 0 (0.0%) | 0 (0.0%) |
| 1 or 2 Children | 0 (0.0%) | 0 (0.0%) |
| 3 or 4 Children | 0 (0.0%) | 0 (0.0%) |
| 5 or more Children | 0 (0.0%) | 0 (0.0%) |
| Total | 0 (0.0%) | 0 (0.0%) |
Race in Alamo
The most populous races in Alamo are , and White / Caucasian (70 | 100.0%).
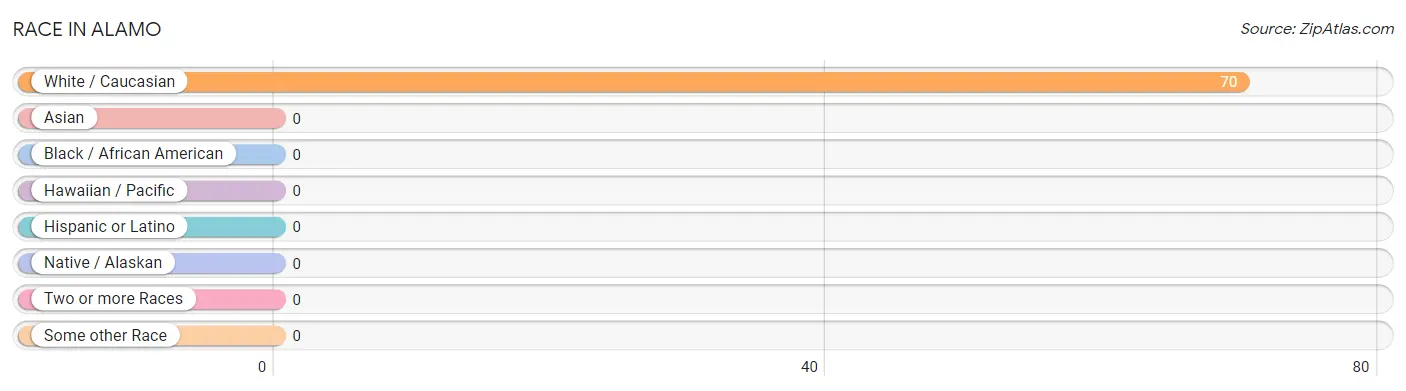
| Race | # Population | % Population |
| Asian | 0 | 0.0% |
| Black / African American | 0 | 0.0% |
| Hawaiian / Pacific | 0 | 0.0% |
| Hispanic or Latino | 0 | 0.0% |
| Native / Alaskan | 0 | 0.0% |
| White / Caucasian | 70 | 100.0% |
| Two or more Races | 0 | 0.0% |
| Some other Race | 0 | 0.0% |
| Total | 70 | 100.0% |
Ancestry in Alamo
The most populous ancestries reported in Alamo are Norwegian (27 | 38.6%), German (8 | 11.4%), Danish (4 | 5.7%), French (4 | 5.7%), and Irish (4 | 5.7%), together accounting for 67.1% of all Alamo residents.
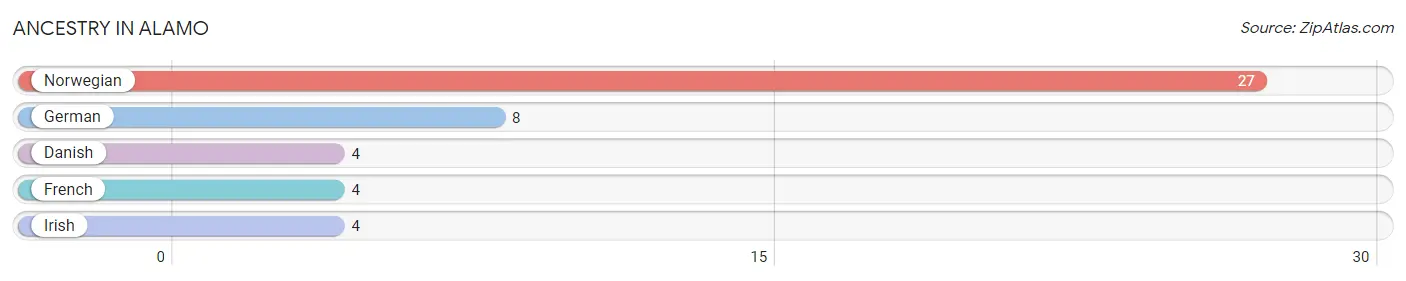
| Ancestry | # Population | % Population |
| Danish | 4 | 5.7% |
| French | 4 | 5.7% |
| German | 8 | 11.4% |
| Irish | 4 | 5.7% |
| Norwegian | 27 | 38.6% | View All 5 Rows |
Immigrants in Alamo
The most numerous immigrant groups reported in Alamo came from , and Canada (3 | 4.3%), together accounting for 4.3% of all Alamo residents.

| Immigration Origin | # Population | % Population |
| Canada | 3 | 4.3% | View All 1 Rows |
Sex and Age in Alamo
Sex and Age in Alamo
The most populous age groups in Alamo are 70 to 74 Years (12 | 25.5%) for men and 55 to 59 Years (8 | 34.8%) for women.
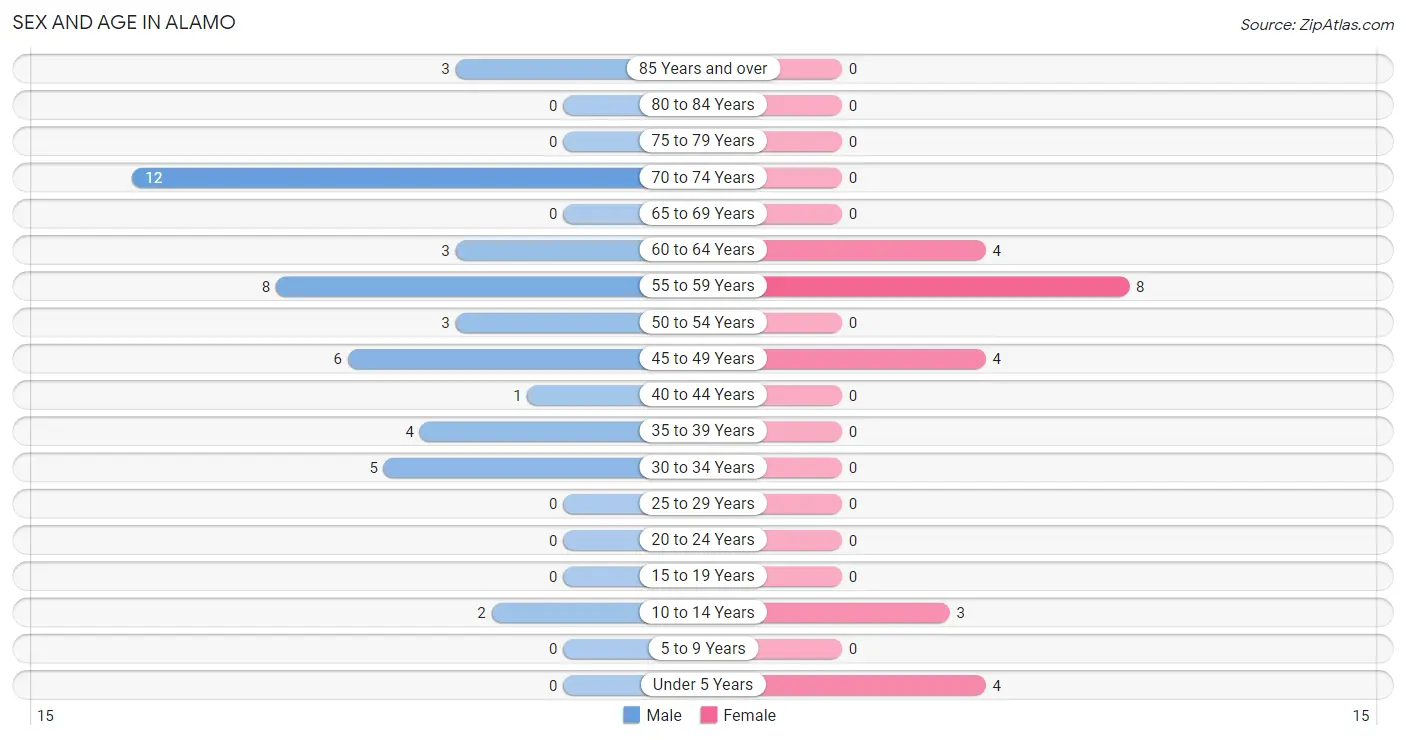
| Age Bracket | Male | Female |
| Under 5 Years | 0 (0.0%) | 4 (17.4%) |
| 5 to 9 Years | 0 (0.0%) | 0 (0.0%) |
| 10 to 14 Years | 2 (4.3%) | 3 (13.0%) |
| 15 to 19 Years | 0 (0.0%) | 0 (0.0%) |
| 20 to 24 Years | 0 (0.0%) | 0 (0.0%) |
| 25 to 29 Years | 0 (0.0%) | 0 (0.0%) |
| 30 to 34 Years | 5 (10.6%) | 0 (0.0%) |
| 35 to 39 Years | 4 (8.5%) | 0 (0.0%) |
| 40 to 44 Years | 1 (2.1%) | 0 (0.0%) |
| 45 to 49 Years | 6 (12.8%) | 4 (17.4%) |
| 50 to 54 Years | 3 (6.4%) | 0 (0.0%) |
| 55 to 59 Years | 8 (17.0%) | 8 (34.8%) |
| 60 to 64 Years | 3 (6.4%) | 4 (17.4%) |
| 65 to 69 Years | 0 (0.0%) | 0 (0.0%) |
| 70 to 74 Years | 12 (25.5%) | 0 (0.0%) |
| 75 to 79 Years | 0 (0.0%) | 0 (0.0%) |
| 80 to 84 Years | 0 (0.0%) | 0 (0.0%) |
| 85 Years and over | 3 (6.4%) | 0 (0.0%) |
| Total | 47 (100.0%) | 23 (100.0%) |
Families and Households in Alamo
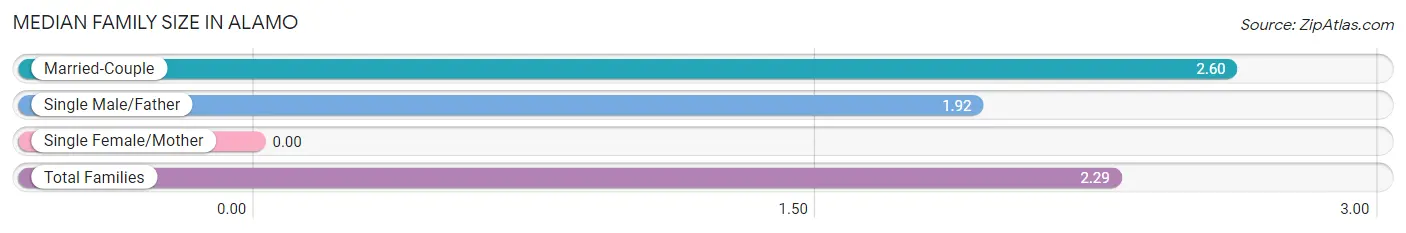
Median Family Size in Alamo
| Family Type | # Families | Family Size |
| Married-Couple | 15 (53.6%) | 2.60 |
| Single Male/Father | 13 (46.4%) | 1.92 |
| Single Female/Mother | 0 (0.0%) | - |
| Total Families | 28 (100.0%) | 2.29 |
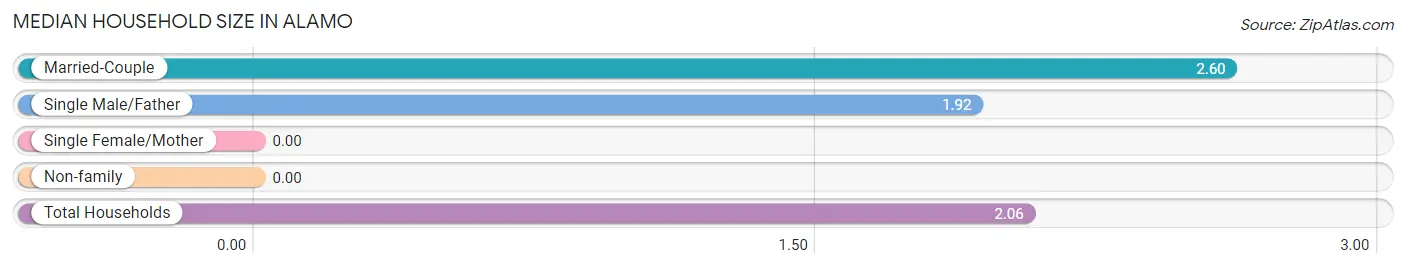
Median Household Size in Alamo
| Household Type | # Households | Household Size |
| Married-Couple | 15 (44.1%) | 2.60 |
| Single Male/Father | 13 (38.2%) | 1.92 |
| Single Female/Mother | 0 (0.0%) | - |
| Non-family | 6 (17.6%) | - |
| Total Households | 34 (100.0%) | 2.06 |
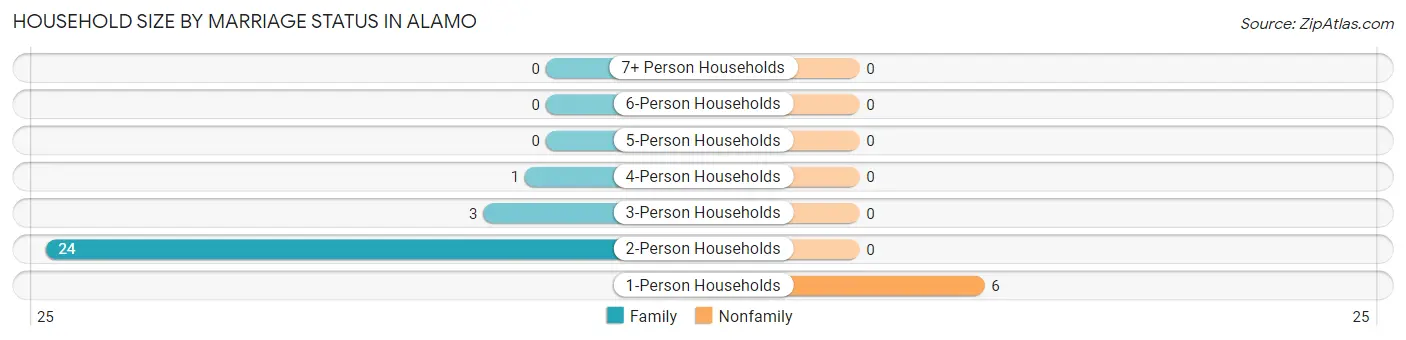
Household Size by Marriage Status in Alamo
Out of a total of 34 households in Alamo, 28 (82.4%) are family households, while 6 (17.6%) are nonfamily households. The most numerous type of family households are 2-person households, comprising 24, and the most common type of nonfamily households are 1-person households, comprising 6.
| Household Size | Family Households | Nonfamily Households |
| 1-Person Households | - | 6 (17.6%) |
| 2-Person Households | 24 (70.6%) | 0 (0.0%) |
| 3-Person Households | 3 (8.8%) | 0 (0.0%) |
| 4-Person Households | 1 (2.9%) | 0 (0.0%) |
| 5-Person Households | 0 (0.0%) | 0 (0.0%) |
| 6-Person Households | 0 (0.0%) | 0 (0.0%) |
| 7+ Person Households | 0 (0.0%) | 0 (0.0%) |
| Total | 28 (82.4%) | 6 (17.6%) |
Female Fertility in Alamo
Fertility by Age in Alamo
| Age Bracket | Women with Births | Births / 1,000 Women |
| 15 to 19 years | 0 (0.0%) | 0.0 |
| 20 to 34 years | 0 (0.0%) | 0.0 |
| 35 to 50 years | 0 (0.0%) | 0.0 |
| Total | 0 (0.0%) | 0.0 |
Fertility by Age by Marriage Status in Alamo
| Age Bracket | Married | Unmarried |
| 15 to 19 years | 0 (0.0%) | 0 (0.0%) |
| 20 to 34 years | 0 (0.0%) | 0 (0.0%) |
| 35 to 50 years | 0 (0.0%) | 0 (0.0%) |
| Total | 0 (0.0%) | 0 (0.0%) |
Fertility by Education in Alamo
| Educational Attainment | Women with Births | Births / 1,000 Women |
| Less than High School | 0 (0.0%) | 0.0 |
| High School Diploma | 0 (0.0%) | 0.0 |
| College or Associate's Degree | 0 (0.0%) | 0.0 |
| Bachelor's Degree | 0 (0.0%) | 0.0 |
| Graduate Degree | 0 (0.0%) | 0.0 |
| Total | 0 (0.0%) | 0.0 |
Fertility by Education by Marriage Status in Alamo
| Educational Attainment | Married | Unmarried |
| Less than High School | 0 (0.0%) | 0 (0.0%) |
| High School Diploma | 0 (0.0%) | 0 (0.0%) |
| College or Associate's Degree | 0 (0.0%) | 0 (0.0%) |
| Bachelor's Degree | 0 (0.0%) | 0 (0.0%) |
| Graduate Degree | 0 (0.0%) | 0 (0.0%) |
| Total | 0 (0.0%) | 0 (0.0%) |
Employment Characteristics in Alamo
Employment by Class of Employer in Alamo
Among the 34 employed individuals in Alamo, private company employees (10 | 29.4%), self-employed (not incorporated) (8 | 23.5%), and not-for-profit organizations (7 | 20.6%) make up the most common classes of employment.
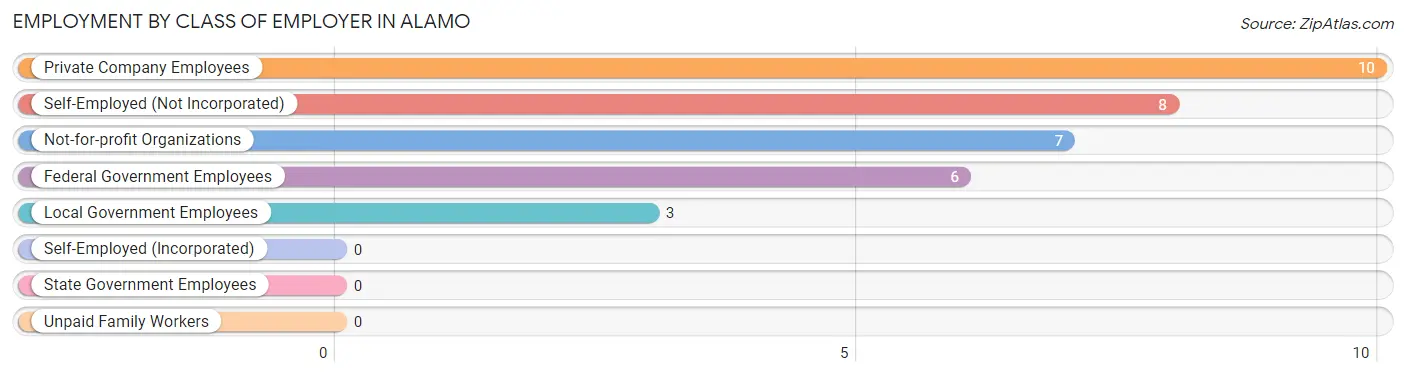
| Employer Class | # Employees | % Employees |
| Private Company Employees | 10 | 29.4% |
| Self-Employed (Incorporated) | 0 | 0.0% |
| Self-Employed (Not Incorporated) | 8 | 23.5% |
| Not-for-profit Organizations | 7 | 20.6% |
| Local Government Employees | 3 | 8.8% |
| State Government Employees | 0 | 0.0% |
| Federal Government Employees | 6 | 17.6% |
| Unpaid Family Workers | 0 | 0.0% |
| Total | 34 | 100.0% |
Employment Status by Age in Alamo
According to the labor force statistics for Alamo, out of the total population over 16 years of age (61), 65.6% or 40 individuals are in the labor force, with 15.0% or 6 of them unemployed. The age group with the highest labor force participation rate is 30 to 34 years, with 100.0% or 5 individuals in the labor force. Within the labor force, the 60 to 64 years age range has the highest percentage of unemployed individuals, with 42.9% or 3 of them being unemployed.
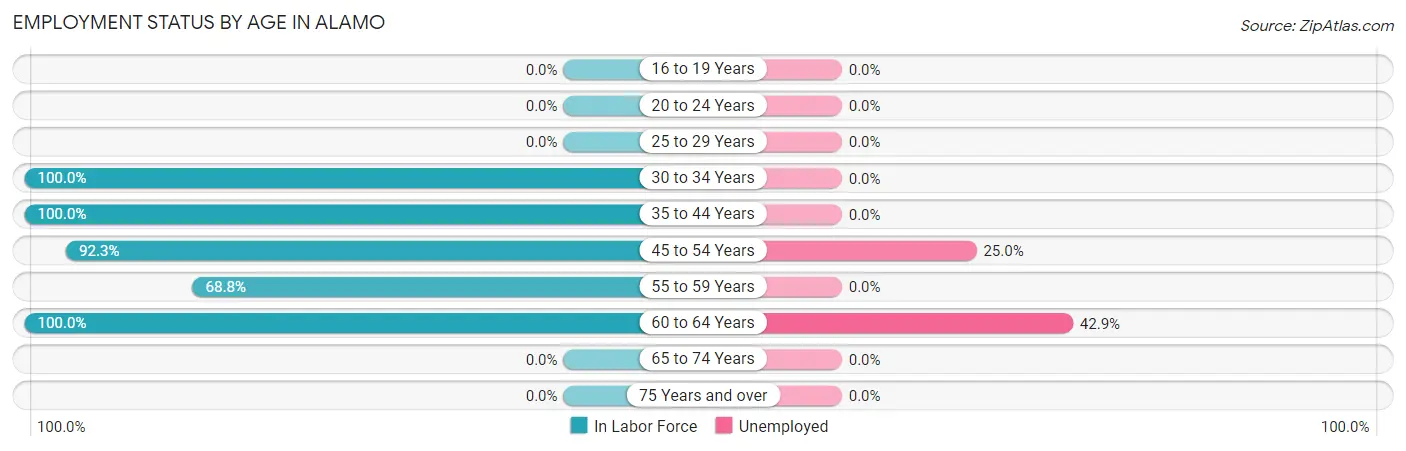
| Age Bracket | In Labor Force | Unemployed |
| 16 to 19 Years | 0 (0.0%) | 0 (0.0%) |
| 20 to 24 Years | 0 (0.0%) | 0 (0.0%) |
| 25 to 29 Years | 0 (0.0%) | 0 (0.0%) |
| 30 to 34 Years | 5 (100.0%) | 0 (0.0%) |
| 35 to 44 Years | 5 (100.0%) | 0 (0.0%) |
| 45 to 54 Years | 12 (92.3%) | 3 (25.0%) |
| 55 to 59 Years | 11 (68.8%) | 0 (0.0%) |
| 60 to 64 Years | 7 (100.0%) | 3 (42.9%) |
| 65 to 74 Years | 0 (0.0%) | 0 (0.0%) |
| 75 Years and over | 0 (0.0%) | 0 (0.0%) |
| Total | 40 (65.6%) | 6 (15.0%) |
Employment Status by Educational Attainment in Alamo
According to labor force statistics for Alamo, 87.0% of individuals (40) out of the total population between 25 and 64 years of age (46) are in the labor force, with 15.0% or 6 of them being unemployed. The group with the highest labor force participation rate are those with the educational attainment of less than high school, with 100.0% or 6 individuals in the labor force. Within the labor force, individuals with less than high school education have the highest percentage of unemployment, with 100.0% or 6 of them being unemployed.
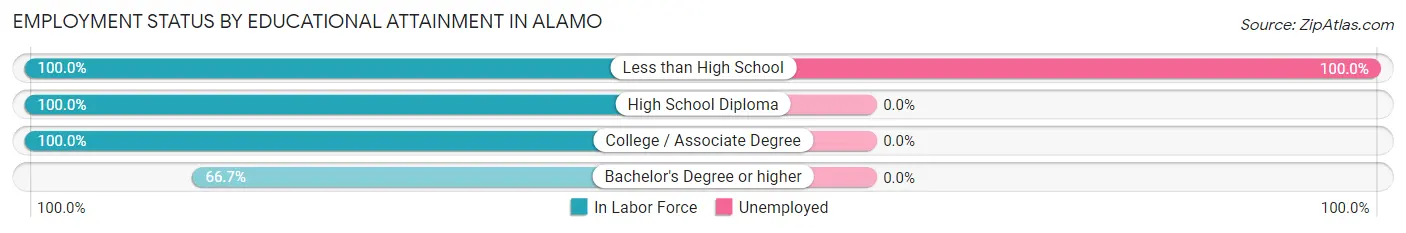
| Educational Attainment | In Labor Force | Unemployed |
| Less than High School | 6 (100.0%) | 6 (100.0%) |
| High School Diploma | 5 (100.0%) | 0 (0.0%) |
| College / Associate Degree | 17 (100.0%) | 0 (0.0%) |
| Bachelor's Degree or higher | 12 (66.7%) | 0 (0.0%) |
| Total | 40 (87.0%) | 7 (15.0%) |
Employment Occupations by Sex in Alamo
Management, Business, Science and Arts Occupations
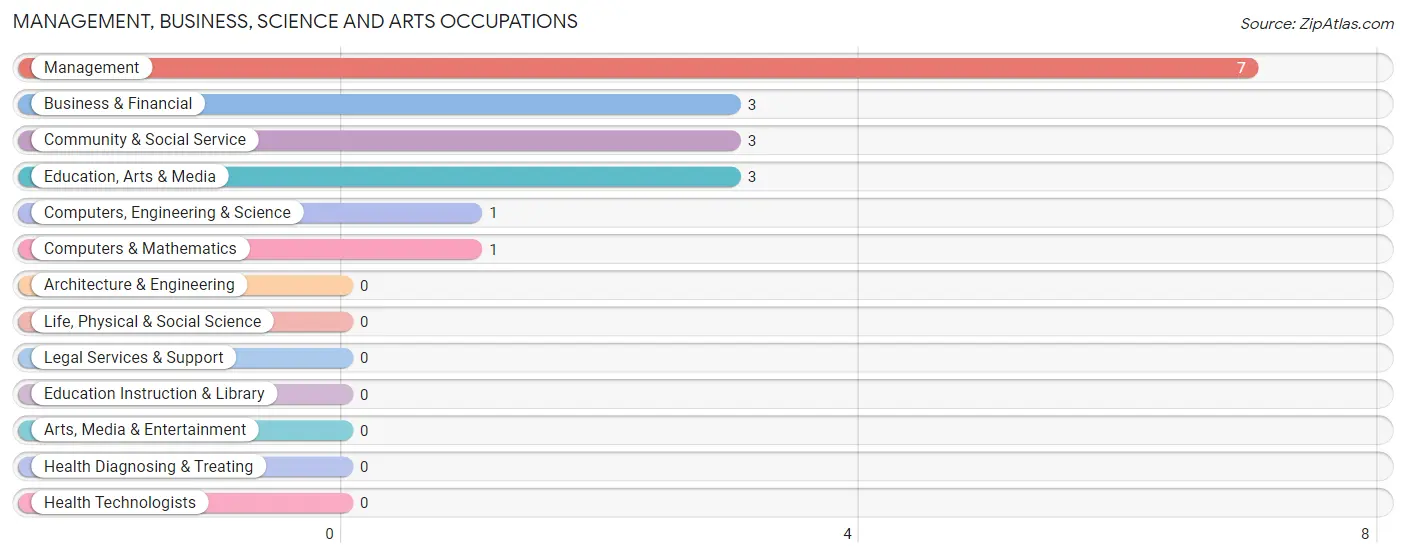
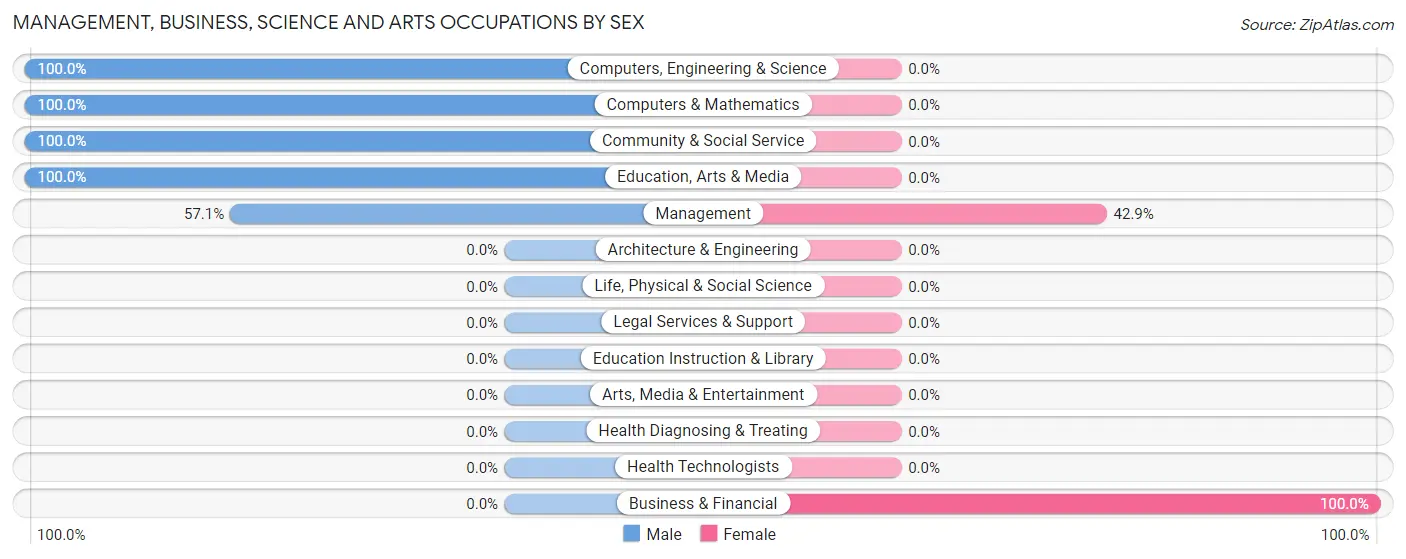
The most common Management, Business, Science and Arts occupations in Alamo are Management (7 | 20.6%), Business & Financial (3 | 8.8%), Community & Social Service (3 | 8.8%), Education, Arts & Media (3 | 8.8%), and Computers, Engineering & Science (1 | 2.9%).
Management, Business, Science and Arts Occupations by Sex
Within the Management, Business, Science and Arts occupations in Alamo, the most male-oriented occupations are Computers, Engineering & Science (100.0%), Computers & Mathematics (100.0%), and Community & Social Service (100.0%), while the most female-oriented occupations are Business & Financial (100.0%), and Management (42.9%).
| Occupation | Male | Female |
| Management | 4 (57.1%) | 3 (42.9%) |
| Business & Financial | 0 (0.0%) | 3 (100.0%) |
| Computers, Engineering & Science | 1 (100.0%) | 0 (0.0%) |
| Computers & Mathematics | 1 (100.0%) | 0 (0.0%) |
| Architecture & Engineering | 0 (0.0%) | 0 (0.0%) |
| Life, Physical & Social Science | 0 (0.0%) | 0 (0.0%) |
| Community & Social Service | 3 (100.0%) | 0 (0.0%) |
| Education, Arts & Media | 3 (100.0%) | 0 (0.0%) |
| Legal Services & Support | 0 (0.0%) | 0 (0.0%) |
| Education Instruction & Library | 0 (0.0%) | 0 (0.0%) |
| Arts, Media & Entertainment | 0 (0.0%) | 0 (0.0%) |
| Health Diagnosing & Treating | 0 (0.0%) | 0 (0.0%) |
| Health Technologists | 0 (0.0%) | 0 (0.0%) |
| Total (Category) | 8 (57.1%) | 6 (42.9%) |
| Total (Overall) | 24 (70.6%) | 10 (29.4%) |
Services Occupations
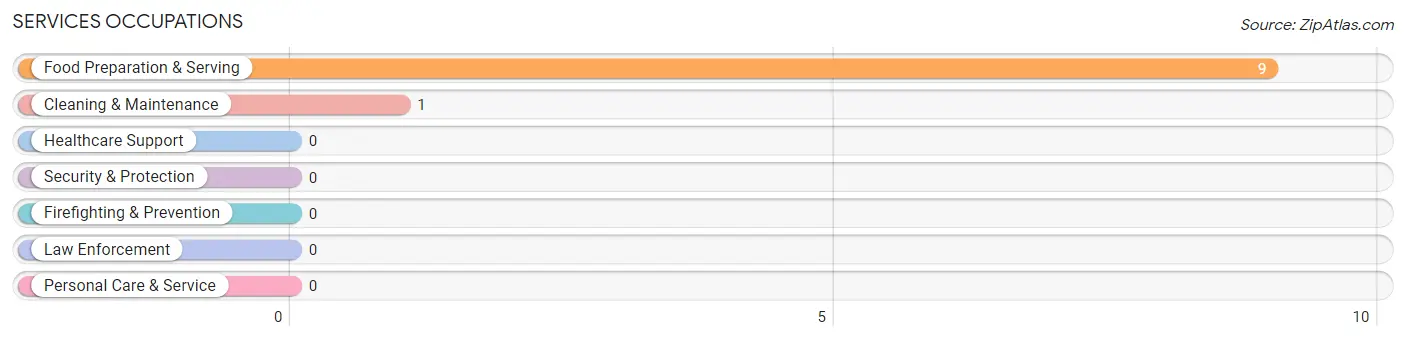
The most common Services occupations in Alamo are Food Preparation & Serving (9 | 26.5%), and Cleaning & Maintenance (1 | 2.9%).
Services Occupations by Sex
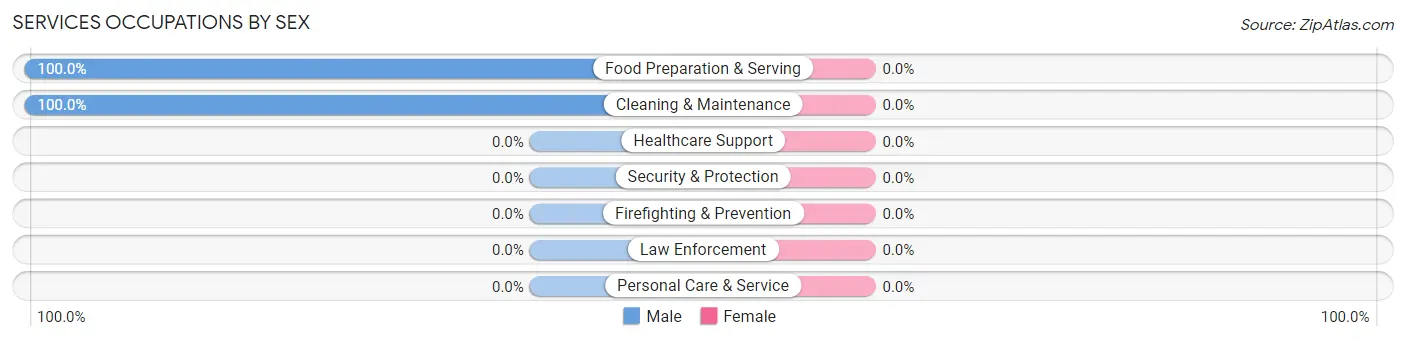
| Occupation | Male | Female |
| Healthcare Support | 0 (0.0%) | 0 (0.0%) |
| Security & Protection | 0 (0.0%) | 0 (0.0%) |
| Firefighting & Prevention | 0 (0.0%) | 0 (0.0%) |
| Law Enforcement | 0 (0.0%) | 0 (0.0%) |
| Food Preparation & Serving | 9 (100.0%) | 0 (0.0%) |
| Cleaning & Maintenance | 1 (100.0%) | 0 (0.0%) |
| Personal Care & Service | 0 (0.0%) | 0 (0.0%) |
| Total (Category) | 10 (100.0%) | 0 (0.0%) |
| Total (Overall) | 24 (70.6%) | 10 (29.4%) |
Sales and Office Occupations
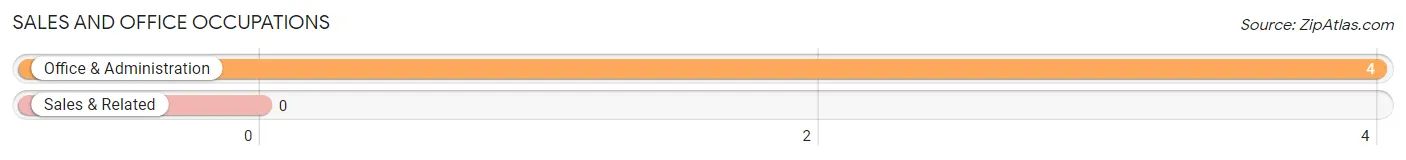
The most common Sales and Office occupations in Alamo are , and Office & Administration (4 | 11.8%).
Sales and Office Occupations by Sex
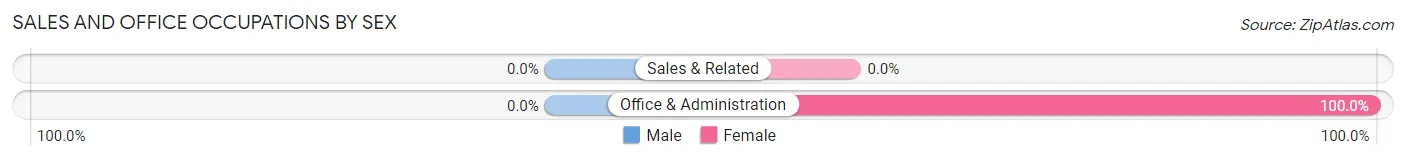
| Occupation | Male | Female |
| Sales & Related | 0 (0.0%) | 0 (0.0%) |
| Office & Administration | 0 (0.0%) | 4 (100.0%) |
| Total (Category) | 0 (0.0%) | 4 (100.0%) |
| Total (Overall) | 24 (70.6%) | 10 (29.4%) |
Natural Resources, Construction and Maintenance Occupations
The most common Natural Resources, Construction and Maintenance occupations in Alamo are , and Farming, Fishing & Forestry (2 | 5.9%).
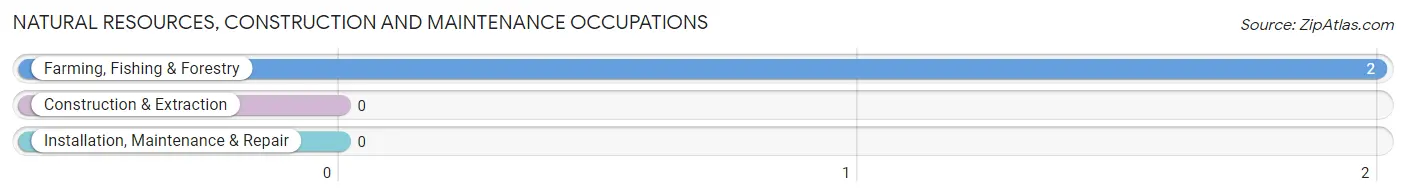
Natural Resources, Construction and Maintenance Occupations by Sex
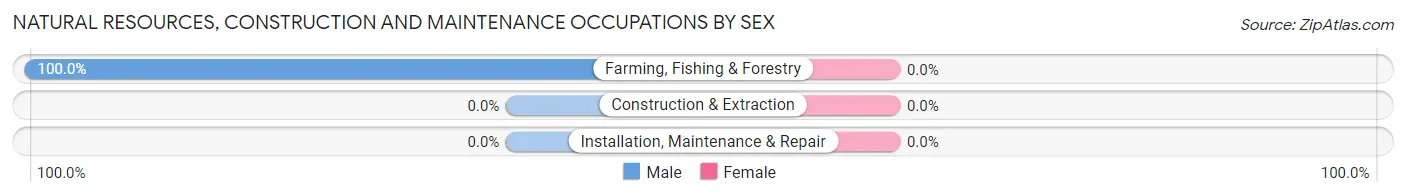
| Occupation | Male | Female |
| Farming, Fishing & Forestry | 2 (100.0%) | 0 (0.0%) |
| Construction & Extraction | 0 (0.0%) | 0 (0.0%) |
| Installation, Maintenance & Repair | 0 (0.0%) | 0 (0.0%) |
| Total (Category) | 2 (100.0%) | 0 (0.0%) |
| Total (Overall) | 24 (70.6%) | 10 (29.4%) |
Production, Transportation and Moving Occupations
The most common Production, Transportation and Moving occupations in Alamo are , and Transportation (4 | 11.8%).
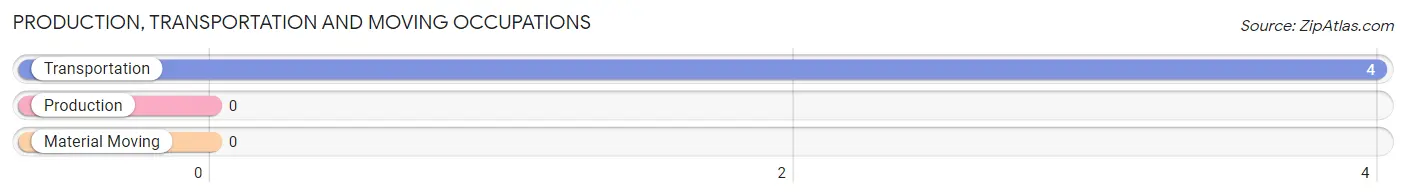
Production, Transportation and Moving Occupations by Sex
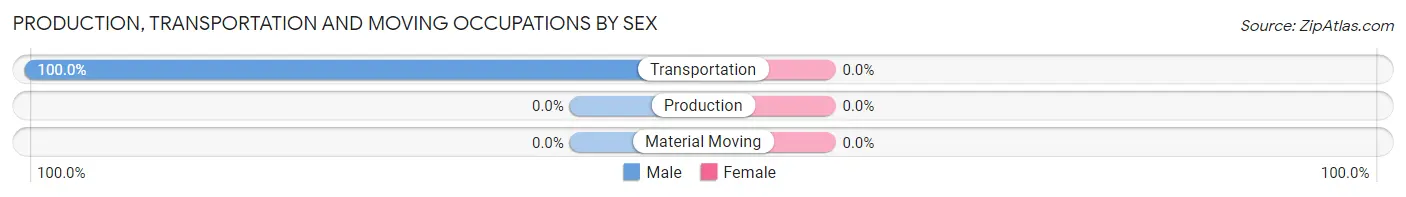
| Occupation | Male | Female |
| Production | 0 (0.0%) | 0 (0.0%) |
| Transportation | 4 (100.0%) | 0 (0.0%) |
| Material Moving | 0 (0.0%) | 0 (0.0%) |
| Total (Category) | 4 (100.0%) | 0 (0.0%) |
| Total (Overall) | 24 (70.6%) | 10 (29.4%) |
Employment Industries by Sex in Alamo
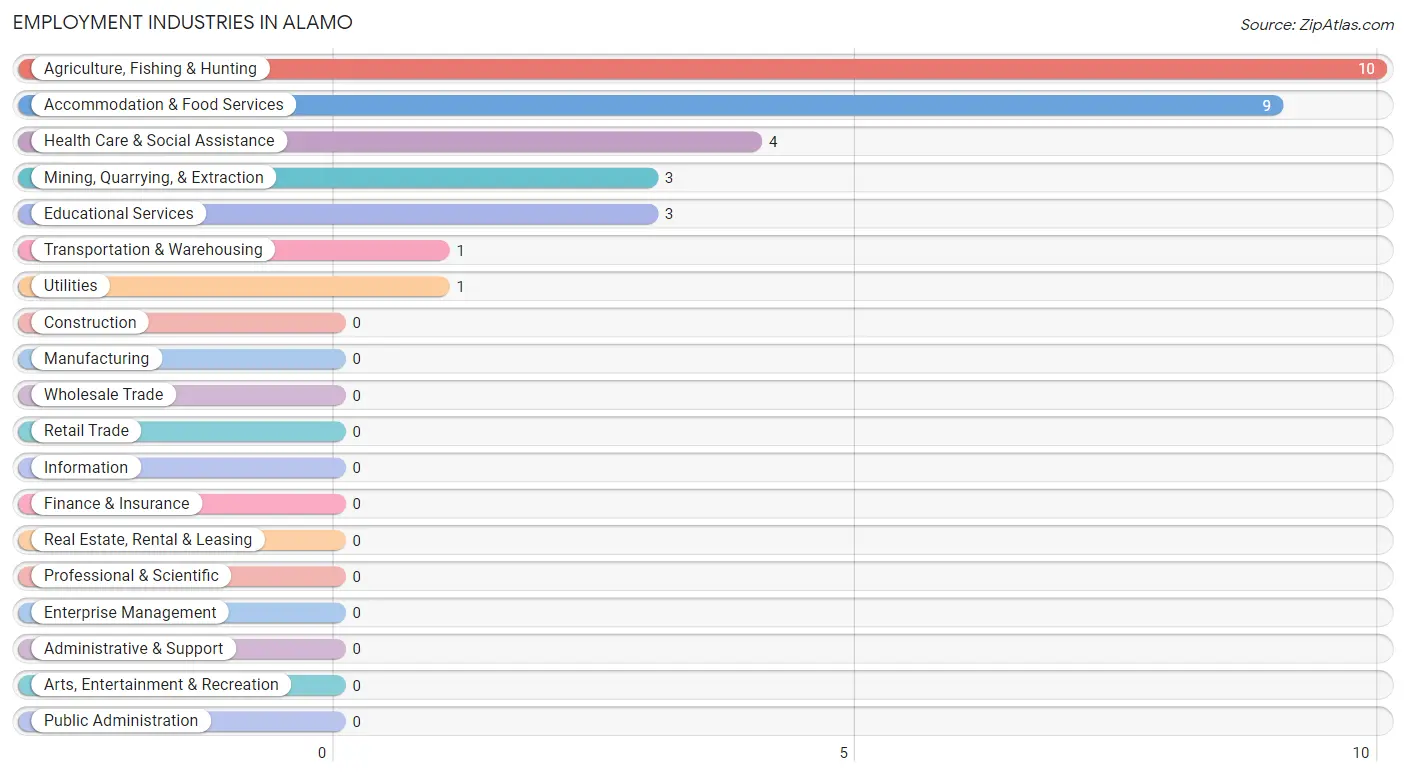
Employment Industries in Alamo
The major employment industries in Alamo include Agriculture, Fishing & Hunting (10 | 29.4%), Accommodation & Food Services (9 | 26.5%), Health Care & Social Assistance (4 | 11.8%), Mining, Quarrying, & Extraction (3 | 8.8%), and Educational Services (3 | 8.8%).
Employment Industries by Sex in Alamo
The Alamo industries that see more men than women are Agriculture, Fishing & Hunting (100.0%), Transportation & Warehousing (100.0%), and Utilities (100.0%), whereas the industries that tend to have a higher number of women are Mining, Quarrying, & Extraction (100.0%), Educational Services (100.0%), and Health Care & Social Assistance (100.0%).
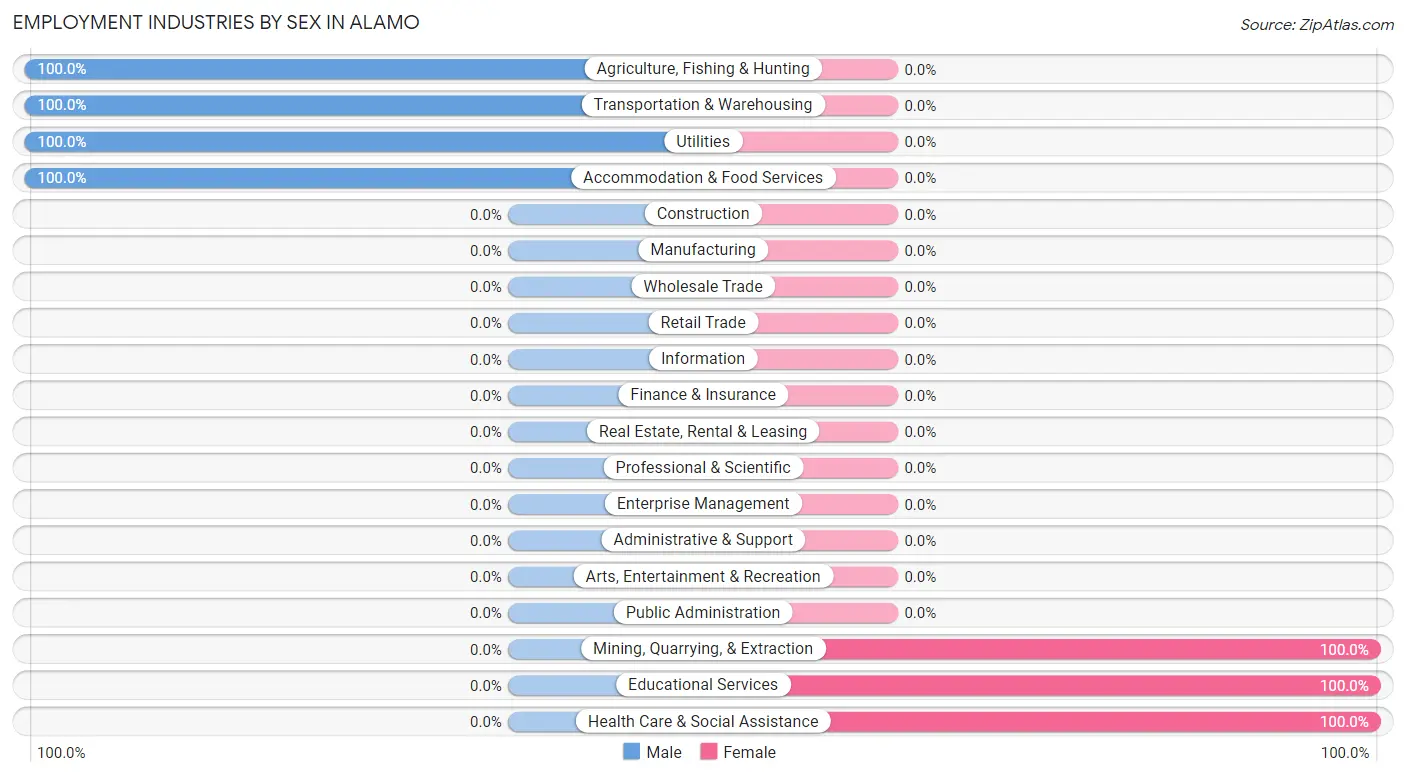
| Industry | Male | Female |
| Agriculture, Fishing & Hunting | 10 (100.0%) | 0 (0.0%) |
| Mining, Quarrying, & Extraction | 0 (0.0%) | 3 (100.0%) |
| Construction | 0 (0.0%) | 0 (0.0%) |
| Manufacturing | 0 (0.0%) | 0 (0.0%) |
| Wholesale Trade | 0 (0.0%) | 0 (0.0%) |
| Retail Trade | 0 (0.0%) | 0 (0.0%) |
| Transportation & Warehousing | 1 (100.0%) | 0 (0.0%) |
| Utilities | 1 (100.0%) | 0 (0.0%) |
| Information | 0 (0.0%) | 0 (0.0%) |
| Finance & Insurance | 0 (0.0%) | 0 (0.0%) |
| Real Estate, Rental & Leasing | 0 (0.0%) | 0 (0.0%) |
| Professional & Scientific | 0 (0.0%) | 0 (0.0%) |
| Enterprise Management | 0 (0.0%) | 0 (0.0%) |
| Administrative & Support | 0 (0.0%) | 0 (0.0%) |
| Educational Services | 0 (0.0%) | 3 (100.0%) |
| Health Care & Social Assistance | 0 (0.0%) | 4 (100.0%) |
| Arts, Entertainment & Recreation | 0 (0.0%) | 0 (0.0%) |
| Accommodation & Food Services | 9 (100.0%) | 0 (0.0%) |
| Public Administration | 0 (0.0%) | 0 (0.0%) |
| Total | 24 (70.6%) | 10 (29.4%) |
Education in Alamo
School Enrollment in Alamo
The most common levels of schooling among the 9 students in Alamo are middle school (5 | 55.6%), and nursery / preschool (4 | 44.4%).
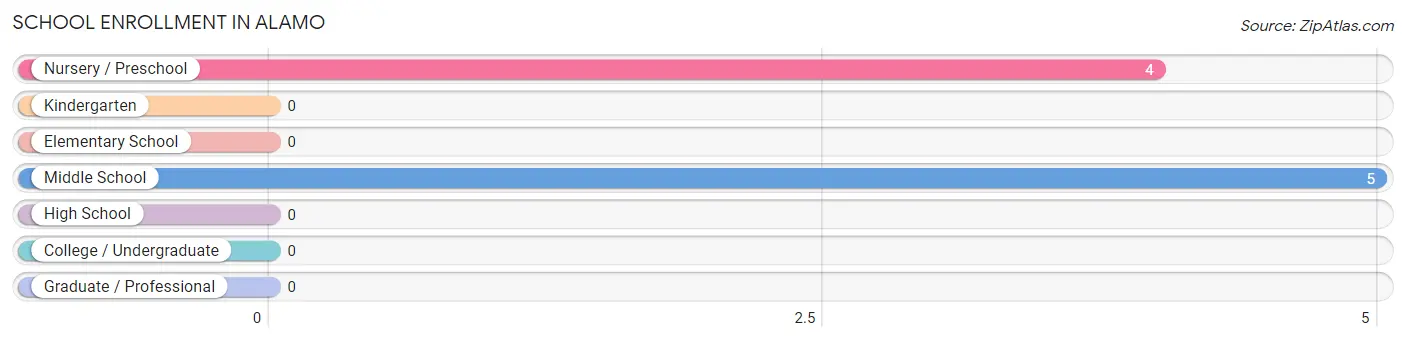
| School Level | # Students | % Students |
| Nursery / Preschool | 4 | 44.4% |
| Kindergarten | 0 | 0.0% |
| Elementary School | 0 | 0.0% |
| Middle School | 5 | 55.6% |
| High School | 0 | 0.0% |
| College / Undergraduate | 0 | 0.0% |
| Graduate / Professional | 0 | 0.0% |
| Total | 9 | 100.0% |
School Enrollment by Age by Funding Source in Alamo
Out of a total of 9 students who are enrolled in schools in Alamo, 5 (55.6%) attend a private institution, while the remaining 4 (44.4%) are enrolled in public schools. The age group of 10 to 14 year olds has the highest likelihood of being enrolled in private schools, with 5 (100.0% in the age bracket) enrolled. Conversely, the age group of 3 to 4 year olds has the lowest likelihood of being enrolled in a private school, with 4 (100.0% in the age bracket) attending a public institution.
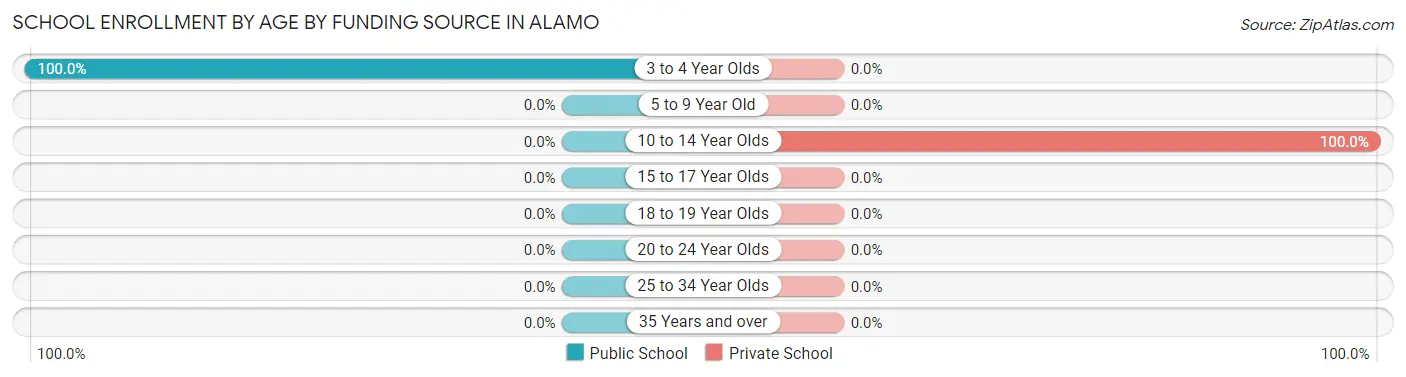
| Age Bracket | Public School | Private School |
| 3 to 4 Year Olds | 4 (100.0%) | 0 (0.0%) |
| 5 to 9 Year Old | 0 (0.0%) | 0 (0.0%) |
| 10 to 14 Year Olds | 0 (0.0%) | 5 (100.0%) |
| 15 to 17 Year Olds | 0 (0.0%) | 0 (0.0%) |
| 18 to 19 Year Olds | 0 (0.0%) | 0 (0.0%) |
| 20 to 24 Year Olds | 0 (0.0%) | 0 (0.0%) |
| 25 to 34 Year Olds | 0 (0.0%) | 0 (0.0%) |
| 35 Years and over | 0 (0.0%) | 0 (0.0%) |
| Total | 4 (44.4%) | 5 (55.6%) |
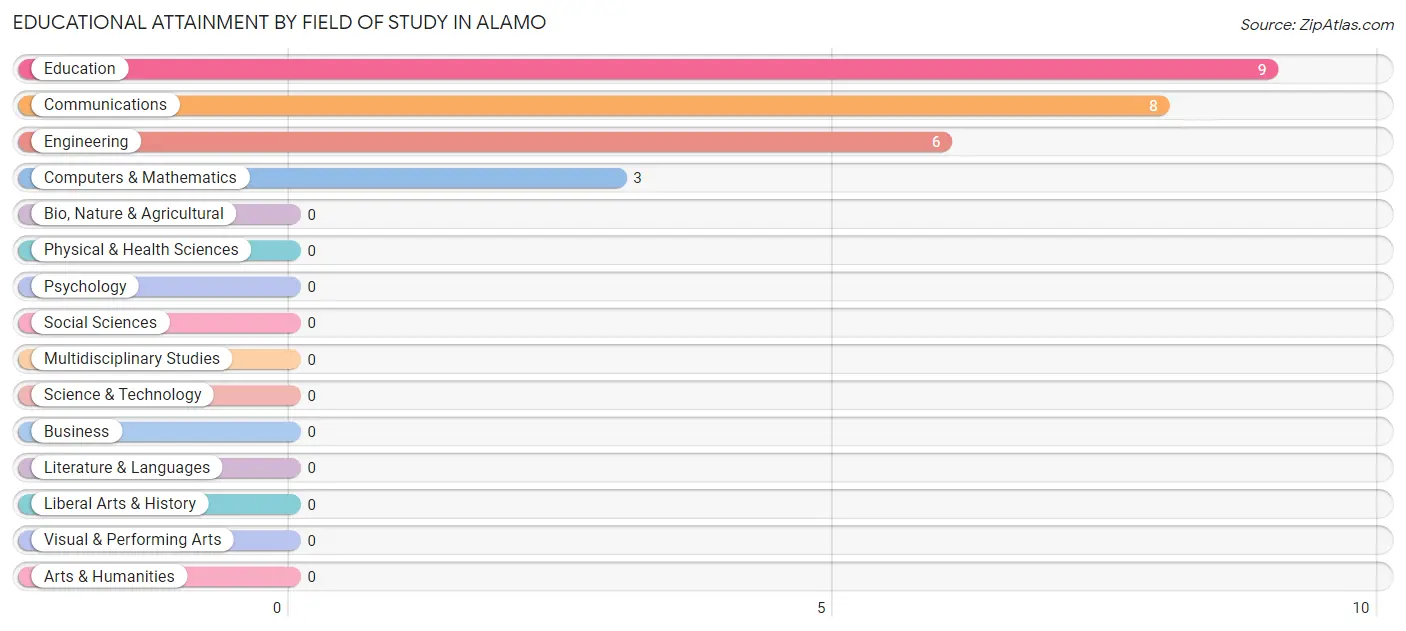
Educational Attainment by Field of Study in Alamo
Education (9 | 34.6%), communications (8 | 30.8%), engineering (6 | 23.1%), and computers & mathematics (3 | 11.5%) are the most common fields of study among 26 individuals in Alamo who have obtained a bachelor's degree or higher.
| Field of Study | # Graduates | % Graduates |
| Computers & Mathematics | 3 | 11.5% |
| Bio, Nature & Agricultural | 0 | 0.0% |
| Physical & Health Sciences | 0 | 0.0% |
| Psychology | 0 | 0.0% |
| Social Sciences | 0 | 0.0% |
| Engineering | 6 | 23.1% |
| Multidisciplinary Studies | 0 | 0.0% |
| Science & Technology | 0 | 0.0% |
| Business | 0 | 0.0% |
| Education | 9 | 34.6% |
| Literature & Languages | 0 | 0.0% |
| Liberal Arts & History | 0 | 0.0% |
| Visual & Performing Arts | 0 | 0.0% |
| Communications | 8 | 30.8% |
| Arts & Humanities | 0 | 0.0% |
| Total | 26 | 100.0% |
Transportation & Commute in Alamo
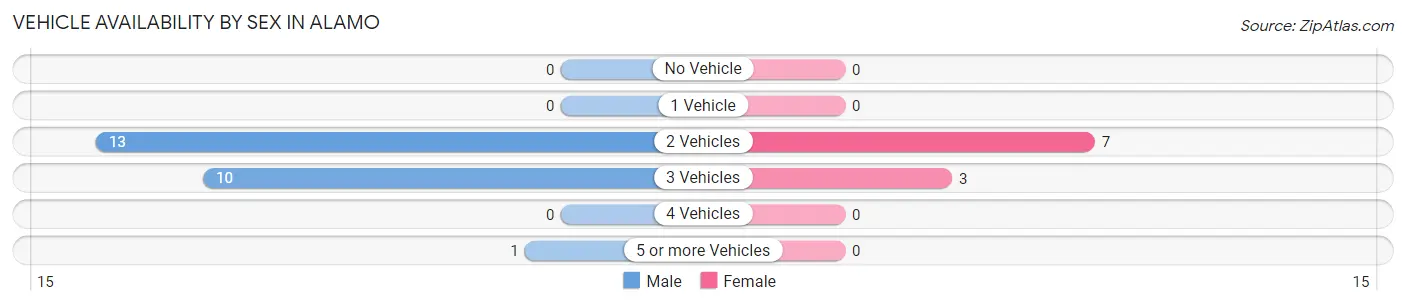
Vehicle Availability by Sex in Alamo
The most prevalent vehicle ownership categories in Alamo are males with 2 vehicles (13, accounting for 54.2%) and females with 2 vehicles (7, making up 130.0%).
| Vehicles Available | Male | Female |
| No Vehicle | 0 (0.0%) | 0 (0.0%) |
| 1 Vehicle | 0 (0.0%) | 0 (0.0%) |
| 2 Vehicles | 13 (54.2%) | 7 (70.0%) |
| 3 Vehicles | 10 (41.7%) | 3 (30.0%) |
| 4 Vehicles | 0 (0.0%) | 0 (0.0%) |
| 5 or more Vehicles | 1 (4.2%) | 0 (0.0%) |
| Total | 24 (100.0%) | 10 (100.0%) |
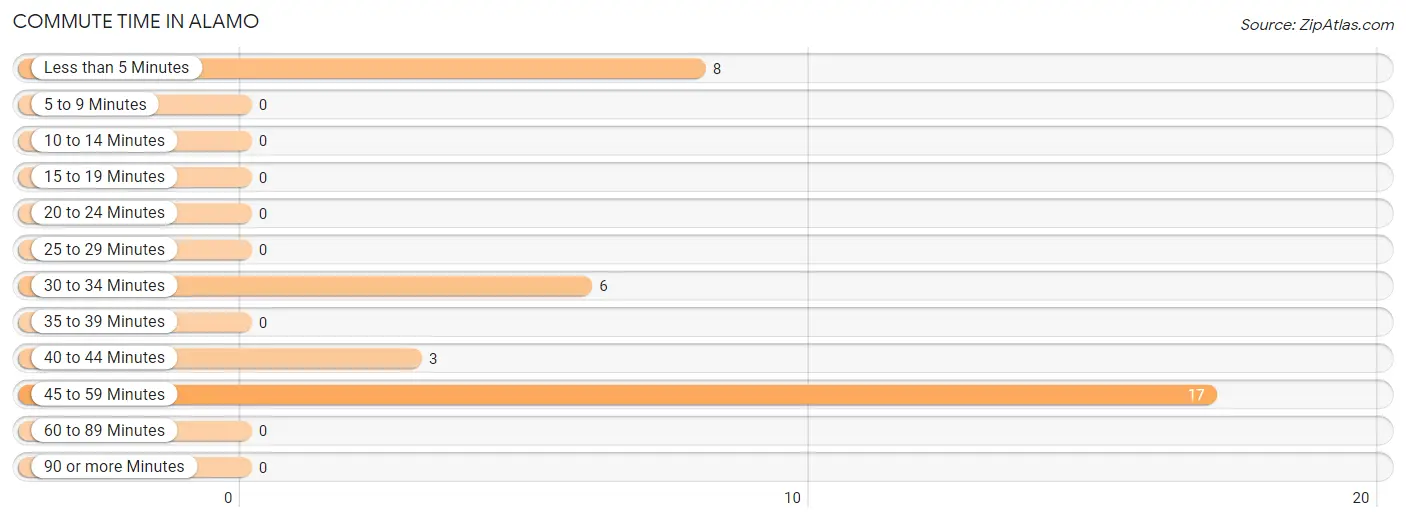
Commute Time in Alamo
The most frequently occuring commute durations in Alamo are 45 to 59 minutes (17 commuters, 50.0%), less than 5 minutes (8 commuters, 23.5%), and 30 to 34 minutes (6 commuters, 17.6%).
| Commute Time | # Commuters | % Commuters |
| Less than 5 Minutes | 8 | 23.5% |
| 5 to 9 Minutes | 0 | 0.0% |
| 10 to 14 Minutes | 0 | 0.0% |
| 15 to 19 Minutes | 0 | 0.0% |
| 20 to 24 Minutes | 0 | 0.0% |
| 25 to 29 Minutes | 0 | 0.0% |
| 30 to 34 Minutes | 6 | 17.6% |
| 35 to 39 Minutes | 0 | 0.0% |
| 40 to 44 Minutes | 3 | 8.8% |
| 45 to 59 Minutes | 17 | 50.0% |
| 60 to 89 Minutes | 0 | 0.0% |
| 90 or more Minutes | 0 | 0.0% |
Commute Time by Sex in Alamo
The most common commute times in Alamo are 45 to 59 minutes (10 commuters, 41.7%) for males and 45 to 59 minutes (7 commuters, 70.0%) for females.
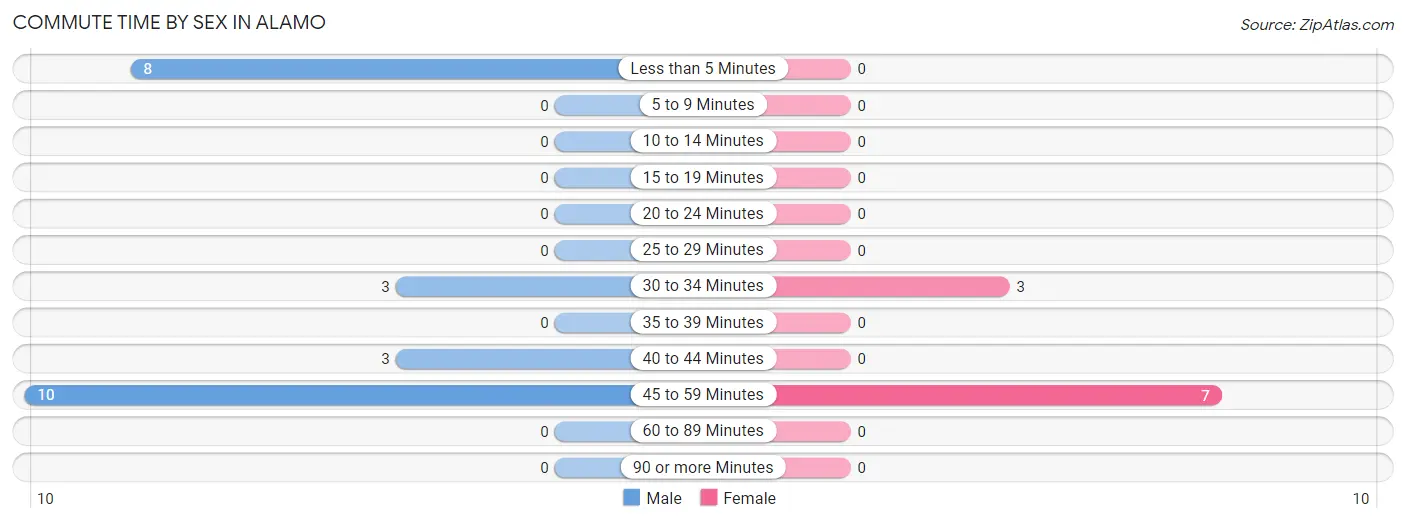
| Commute Time | Male | Female |
| Less than 5 Minutes | 8 (33.3%) | 0 (0.0%) |
| 5 to 9 Minutes | 0 (0.0%) | 0 (0.0%) |
| 10 to 14 Minutes | 0 (0.0%) | 0 (0.0%) |
| 15 to 19 Minutes | 0 (0.0%) | 0 (0.0%) |
| 20 to 24 Minutes | 0 (0.0%) | 0 (0.0%) |
| 25 to 29 Minutes | 0 (0.0%) | 0 (0.0%) |
| 30 to 34 Minutes | 3 (12.5%) | 3 (30.0%) |
| 35 to 39 Minutes | 0 (0.0%) | 0 (0.0%) |
| 40 to 44 Minutes | 3 (12.5%) | 0 (0.0%) |
| 45 to 59 Minutes | 10 (41.7%) | 7 (70.0%) |
| 60 to 89 Minutes | 0 (0.0%) | 0 (0.0%) |
| 90 or more Minutes | 0 (0.0%) | 0 (0.0%) |
Time of Departure to Work by Sex in Alamo
The most frequent times of departure to work in Alamo are 7:00 AM to 7:29 AM (11, 45.8%) for males and 7:00 AM to 7:29 AM (10, 100.0%) for females.
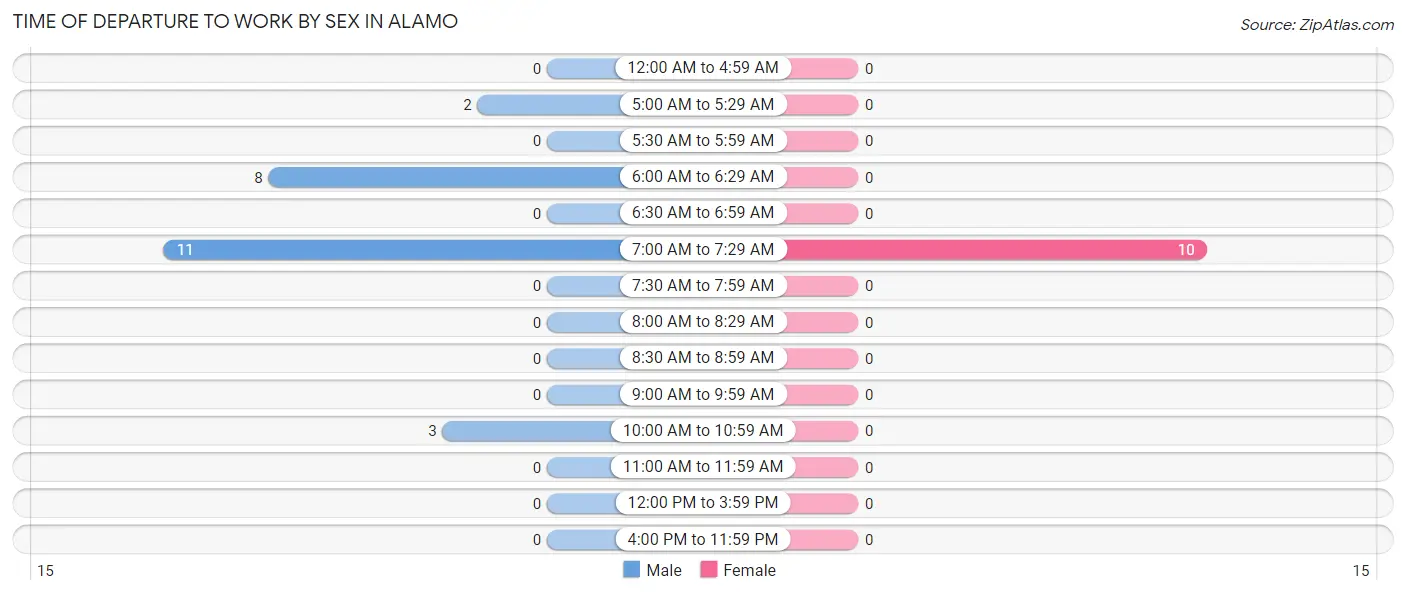
| Time of Departure | Male | Female |
| 12:00 AM to 4:59 AM | 0 (0.0%) | 0 (0.0%) |
| 5:00 AM to 5:29 AM | 2 (8.3%) | 0 (0.0%) |
| 5:30 AM to 5:59 AM | 0 (0.0%) | 0 (0.0%) |
| 6:00 AM to 6:29 AM | 8 (33.3%) | 0 (0.0%) |
| 6:30 AM to 6:59 AM | 0 (0.0%) | 0 (0.0%) |
| 7:00 AM to 7:29 AM | 11 (45.8%) | 10 (100.0%) |
| 7:30 AM to 7:59 AM | 0 (0.0%) | 0 (0.0%) |
| 8:00 AM to 8:29 AM | 0 (0.0%) | 0 (0.0%) |
| 8:30 AM to 8:59 AM | 0 (0.0%) | 0 (0.0%) |
| 9:00 AM to 9:59 AM | 0 (0.0%) | 0 (0.0%) |
| 10:00 AM to 10:59 AM | 3 (12.5%) | 0 (0.0%) |
| 11:00 AM to 11:59 AM | 0 (0.0%) | 0 (0.0%) |
| 12:00 PM to 3:59 PM | 0 (0.0%) | 0 (0.0%) |
| 4:00 PM to 11:59 PM | 0 (0.0%) | 0 (0.0%) |
| Total | 24 (100.0%) | 10 (100.0%) |
Housing Occupancy in Alamo
Occupancy by Ownership in Alamo
Of the total 34 dwellings in Alamo, owner-occupied units account for 34 (100.0%), while renter-occupied units make up 0 (0.0%).
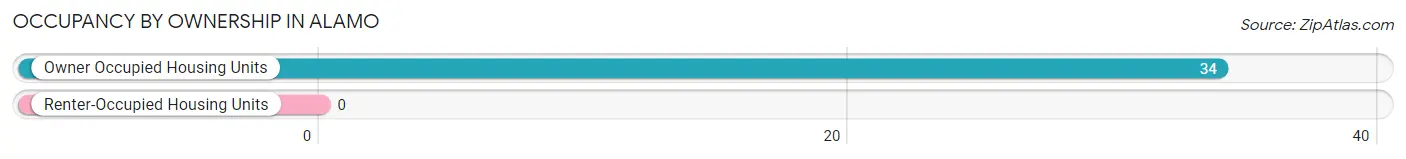
| Occupancy | # Housing Units | % Housing Units |
| Owner Occupied Housing Units | 34 | 100.0% |
| Renter-Occupied Housing Units | 0 | 0.0% |
| Total Occupied Housing Units | 34 | 100.0% |
Occupancy by Household Size in Alamo
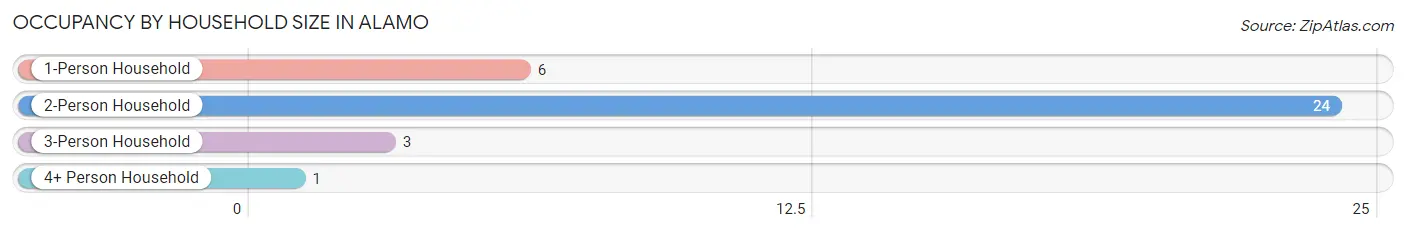
| Household Size | # Housing Units | % Housing Units |
| 1-Person Household | 6 | 17.6% |
| 2-Person Household | 24 | 70.6% |
| 3-Person Household | 3 | 8.8% |
| 4+ Person Household | 1 | 2.9% |
| Total Housing Units | 34 | 100.0% |
Occupancy by Ownership by Household Size in Alamo
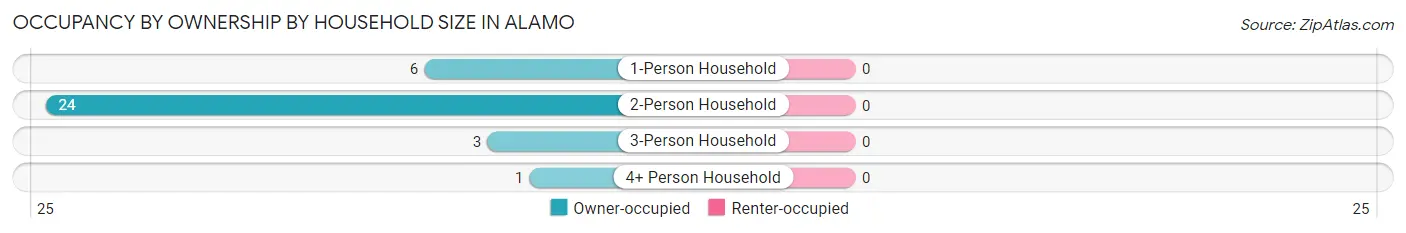
| Household Size | Owner-occupied | Renter-occupied |
| 1-Person Household | 6 (100.0%) | 0 (0.0%) |
| 2-Person Household | 24 (100.0%) | 0 (0.0%) |
| 3-Person Household | 3 (100.0%) | 0 (0.0%) |
| 4+ Person Household | 1 (100.0%) | 0 (0.0%) |
| Total Housing Units | 34 (100.0%) | 0 (0.0%) |
Occupancy by Educational Attainment in Alamo
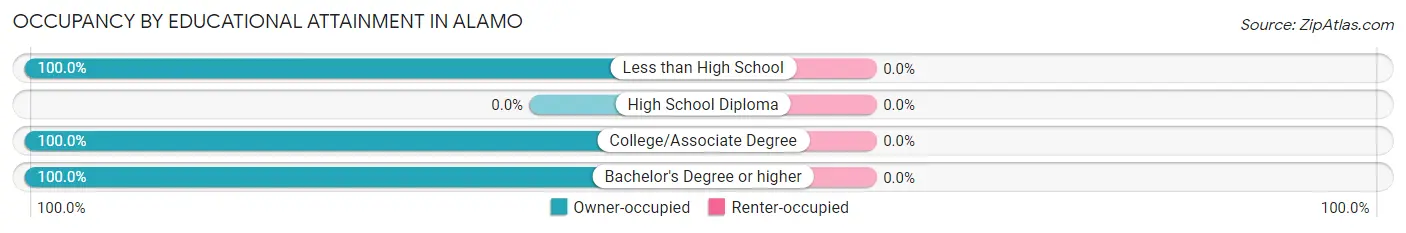
| Household Size | Owner-occupied | Renter-occupied |
| Less than High School | 3 (100.0%) | 0 (0.0%) |
| High School Diploma | 0 (0.0%) | 0 (0.0%) |
| College/Associate Degree | 19 (100.0%) | 0 (0.0%) |
| Bachelor's Degree or higher | 12 (100.0%) | 0 (0.0%) |
Occupancy by Age of Householder in Alamo
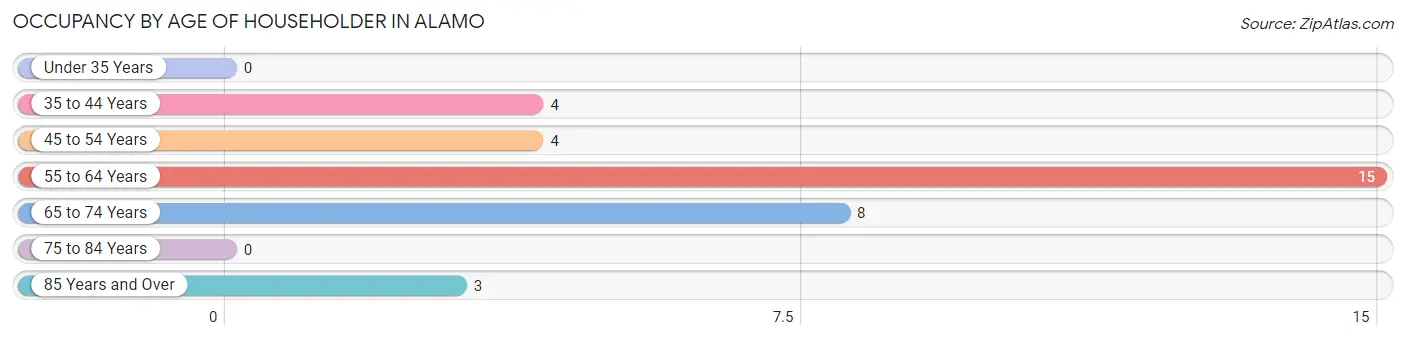
| Age Bracket | # Households | % Households |
| Under 35 Years | 0 | 0.0% |
| 35 to 44 Years | 4 | 11.8% |
| 45 to 54 Years | 4 | 11.8% |
| 55 to 64 Years | 15 | 44.1% |
| 65 to 74 Years | 8 | 23.5% |
| 75 to 84 Years | 0 | 0.0% |
| 85 Years and Over | 3 | 8.8% |
| Total | 34 | 100.0% |
Housing Finances in Alamo
Median Income by Occupancy in Alamo
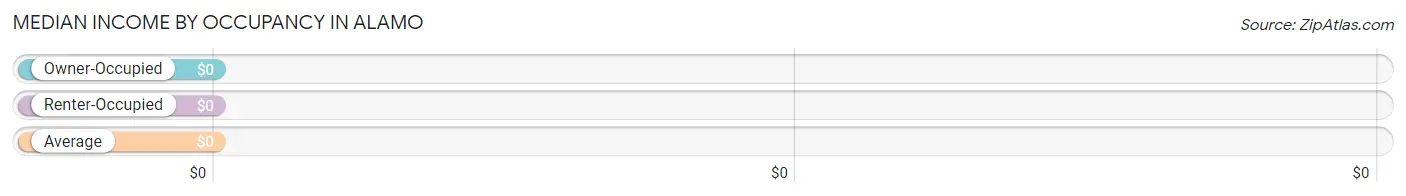
| Occupancy Type | # Households | Median Income |
| Owner-Occupied | 34 (100.0%) | $0 |
| Renter-Occupied | 0 (0.0%) | $0 |
| Average | 34 (100.0%) | $0 |
Occupancy by Householder Income Bracket in Alamo
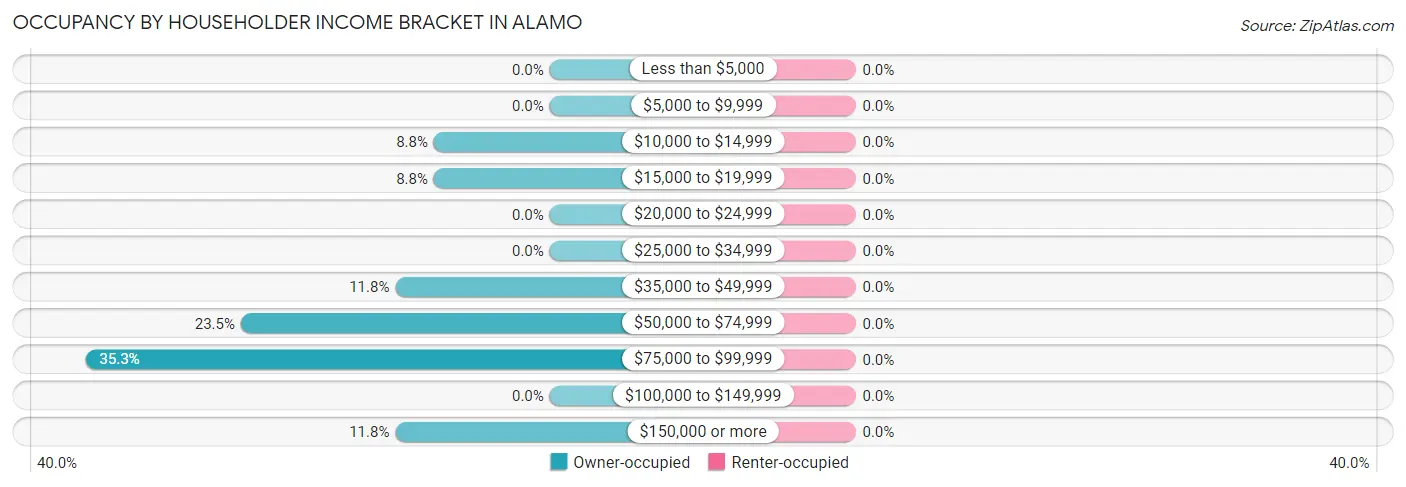
| Income Bracket | Owner-occupied | Renter-occupied |
| Less than $5,000 | 0 (0.0%) | 0 (0.0%) |
| $5,000 to $9,999 | 0 (0.0%) | 0 (0.0%) |
| $10,000 to $14,999 | 3 (8.8%) | 0 (0.0%) |
| $15,000 to $19,999 | 3 (8.8%) | 0 (0.0%) |
| $20,000 to $24,999 | 0 (0.0%) | 0 (0.0%) |
| $25,000 to $34,999 | 0 (0.0%) | 0 (0.0%) |
| $35,000 to $49,999 | 4 (11.8%) | 0 (0.0%) |
| $50,000 to $74,999 | 8 (23.5%) | 0 (0.0%) |
| $75,000 to $99,999 | 12 (35.3%) | 0 (0.0%) |
| $100,000 to $149,999 | 0 (0.0%) | 0 (0.0%) |
| $150,000 or more | 4 (11.8%) | 0 (0.0%) |
| Total | 34 (100.0%) | 0 (0.0%) |
Monthly Housing Cost Tiers in Alamo
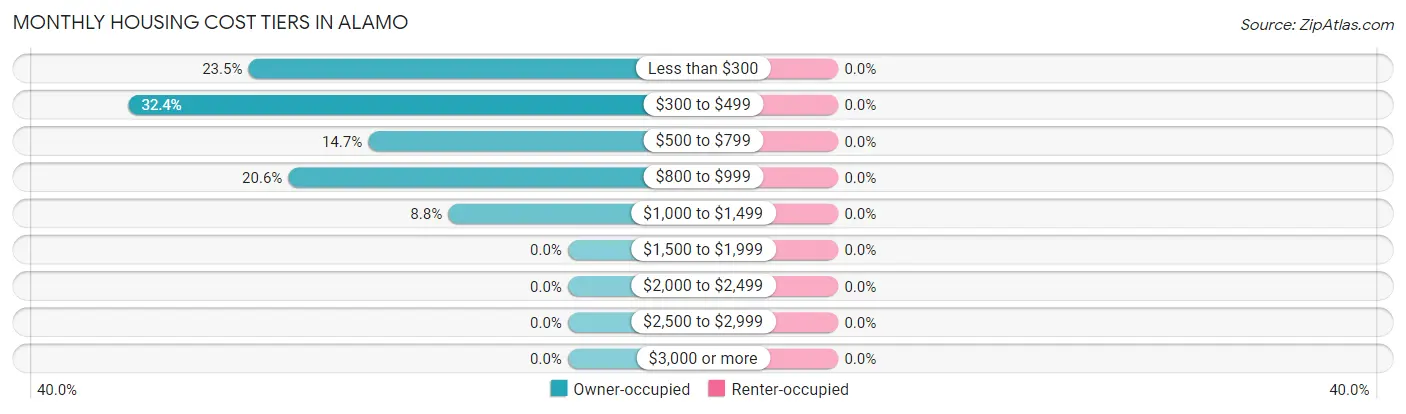
| Monthly Cost | Owner-occupied | Renter-occupied |
| Less than $300 | 8 (23.5%) | 0 (0.0%) |
| $300 to $499 | 11 (32.4%) | 0 (0.0%) |
| $500 to $799 | 5 (14.7%) | 0 (0.0%) |
| $800 to $999 | 7 (20.6%) | 0 (0.0%) |
| $1,000 to $1,499 | 3 (8.8%) | 0 (0.0%) |
| $1,500 to $1,999 | 0 (0.0%) | 0 (0.0%) |
| $2,000 to $2,499 | 0 (0.0%) | 0 (0.0%) |
| $2,500 to $2,999 | 0 (0.0%) | 0 (0.0%) |
| $3,000 or more | 0 (0.0%) | 0 (0.0%) |
| Total | 34 (100.0%) | 0 (0.0%) |
Physical Housing Characteristics in Alamo
Housing Structures in Alamo
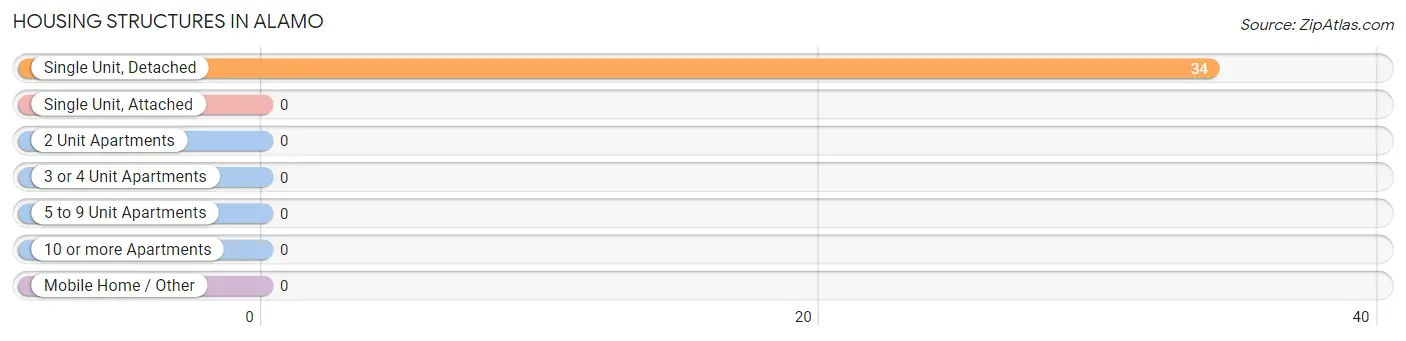
| Structure Type | # Housing Units | % Housing Units |
| Single Unit, Detached | 34 | 100.0% |
| Single Unit, Attached | 0 | 0.0% |
| 2 Unit Apartments | 0 | 0.0% |
| 3 or 4 Unit Apartments | 0 | 0.0% |
| 5 to 9 Unit Apartments | 0 | 0.0% |
| 10 or more Apartments | 0 | 0.0% |
| Mobile Home / Other | 0 | 0.0% |
| Total | 34 | 100.0% |
Housing Structures by Occupancy in Alamo
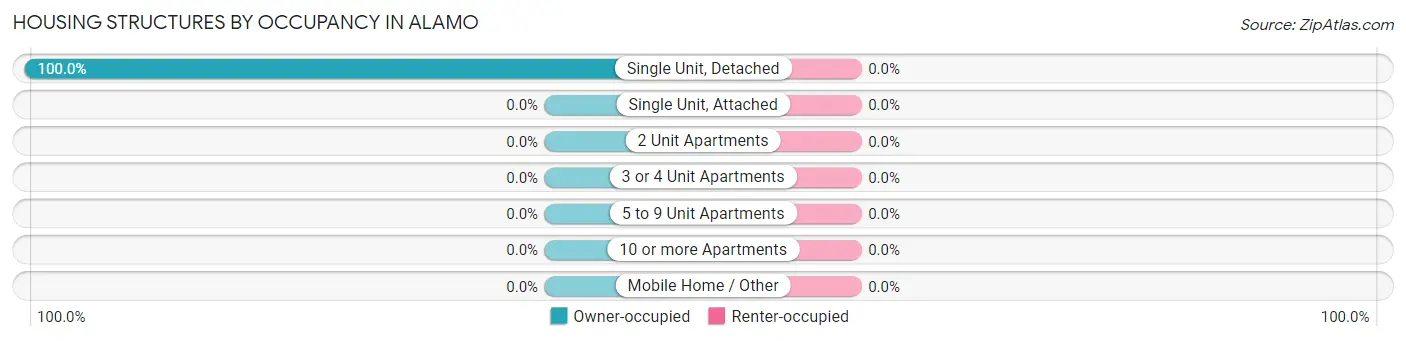
| Structure Type | Owner-occupied | Renter-occupied |
| Single Unit, Detached | 34 (100.0%) | 0 (0.0%) |
| Single Unit, Attached | 0 (0.0%) | 0 (0.0%) |
| 2 Unit Apartments | 0 (0.0%) | 0 (0.0%) |
| 3 or 4 Unit Apartments | 0 (0.0%) | 0 (0.0%) |
| 5 to 9 Unit Apartments | 0 (0.0%) | 0 (0.0%) |
| 10 or more Apartments | 0 (0.0%) | 0 (0.0%) |
| Mobile Home / Other | 0 (0.0%) | 0 (0.0%) |
| Total | 34 (100.0%) | 0 (0.0%) |
Housing Structures by Number of Rooms in Alamo
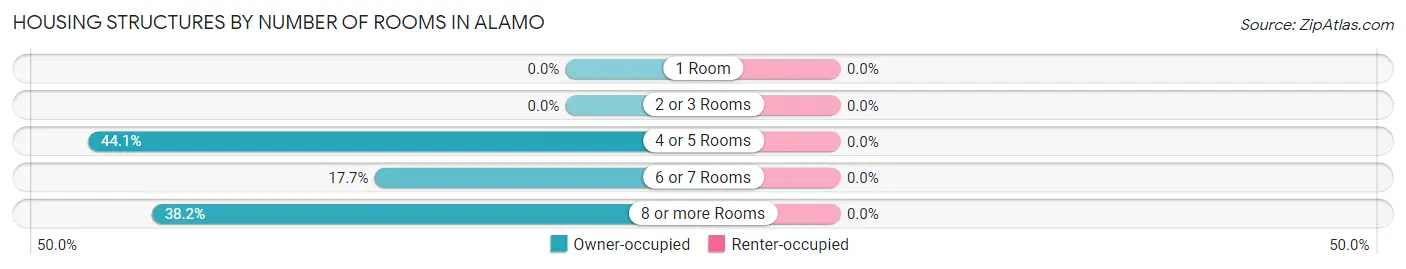
| Number of Rooms | Owner-occupied | Renter-occupied |
| 1 Room | 0 (0.0%) | 0 (0.0%) |
| 2 or 3 Rooms | 0 (0.0%) | 0 (0.0%) |
| 4 or 5 Rooms | 15 (44.1%) | 0 (0.0%) |
| 6 or 7 Rooms | 6 (17.6%) | 0 (0.0%) |
| 8 or more Rooms | 13 (38.2%) | 0 (0.0%) |
| Total | 34 (100.0%) | 0 (0.0%) |
Housing Structure by Heating Type in Alamo
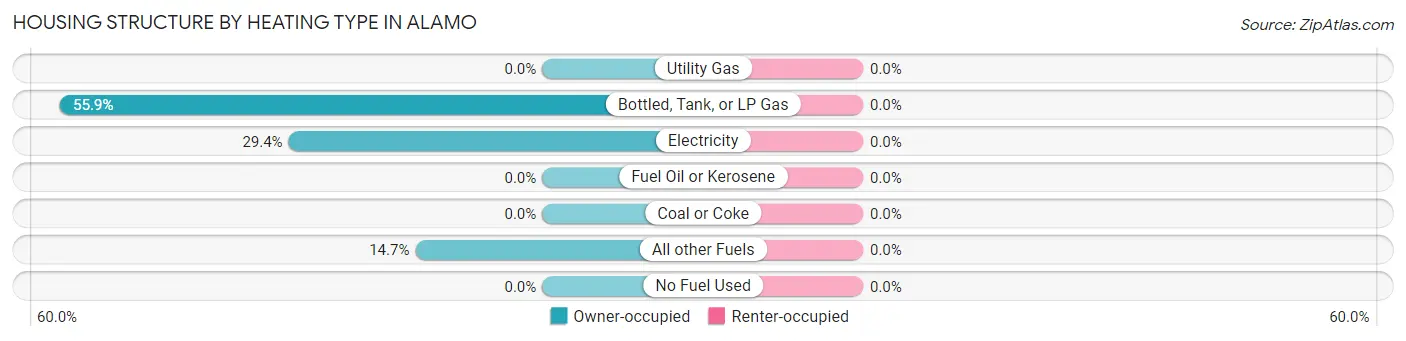
| Heating Type | Owner-occupied | Renter-occupied |
| Utility Gas | 0 (0.0%) | 0 (0.0%) |
| Bottled, Tank, or LP Gas | 19 (55.9%) | 0 (0.0%) |
| Electricity | 10 (29.4%) | 0 (0.0%) |
| Fuel Oil or Kerosene | 0 (0.0%) | 0 (0.0%) |
| Coal or Coke | 0 (0.0%) | 0 (0.0%) |
| All other Fuels | 5 (14.7%) | 0 (0.0%) |
| No Fuel Used | 0 (0.0%) | 0 (0.0%) |
| Total | 34 (100.0%) | 0 (0.0%) |
Household Vehicle Usage in Alamo
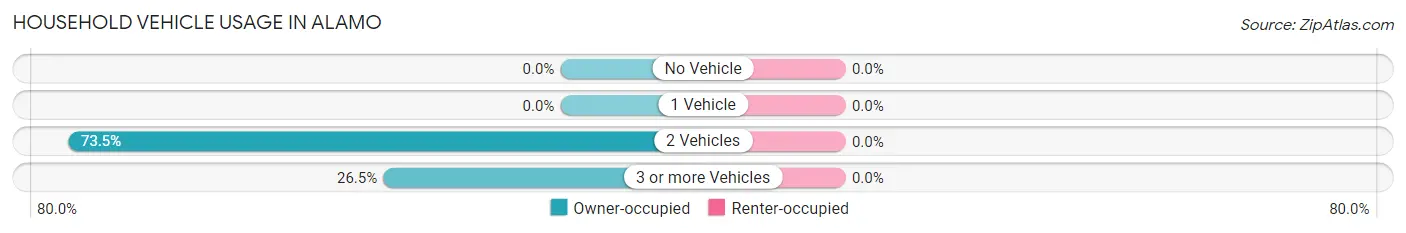
| Vehicles per Household | Owner-occupied | Renter-occupied |
| No Vehicle | 0 (0.0%) | 0 (0.0%) |
| 1 Vehicle | 0 (0.0%) | 0 (0.0%) |
| 2 Vehicles | 25 (73.5%) | 0 (0.0%) |
| 3 or more Vehicles | 9 (26.5%) | 0 (0.0%) |
| Total | 34 (100.0%) | 0 (0.0%) |
Real Estate & Mortgages in Alamo
Real Estate and Mortgage Overview in Alamo
| Characteristic | Without Mortgage | With Mortgage |
| Housing Units | 31 | 3 |
| Median Property Value | $112,500 | $0 |
| Median Household Income | $54,219 | $0 |
| Monthly Housing Costs | $378 | $0 |
| Real Estate Taxes | $946 | $0 |
Property Value by Mortgage Status in Alamo
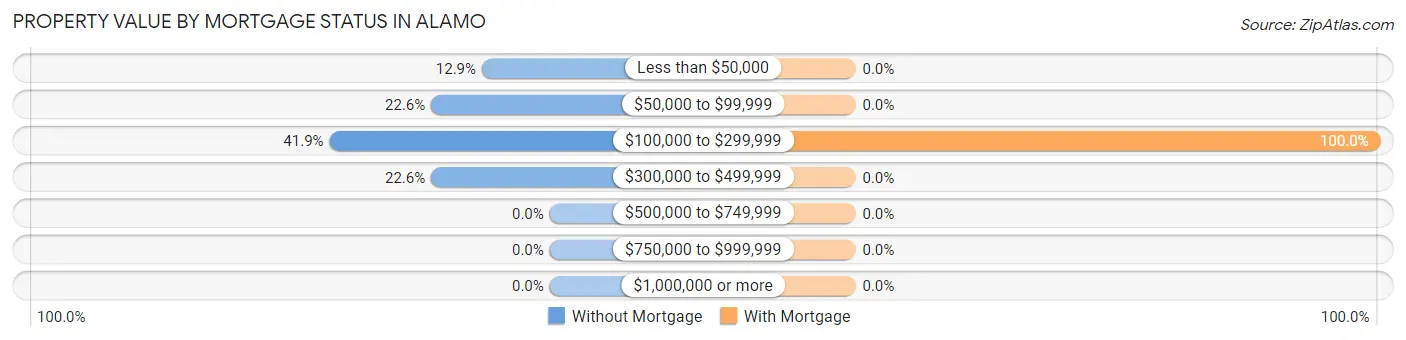
| Property Value | Without Mortgage | With Mortgage |
| Less than $50,000 | 4 (12.9%) | 0 (0.0%) |
| $50,000 to $99,999 | 7 (22.6%) | 0 (0.0%) |
| $100,000 to $299,999 | 13 (41.9%) | 3 (100.0%) |
| $300,000 to $499,999 | 7 (22.6%) | 0 (0.0%) |
| $500,000 to $749,999 | 0 (0.0%) | 0 (0.0%) |
| $750,000 to $999,999 | 0 (0.0%) | 0 (0.0%) |
| $1,000,000 or more | 0 (0.0%) | 0 (0.0%) |
| Total | 31 (100.0%) | 3 (100.0%) |
Household Income by Mortgage Status in Alamo
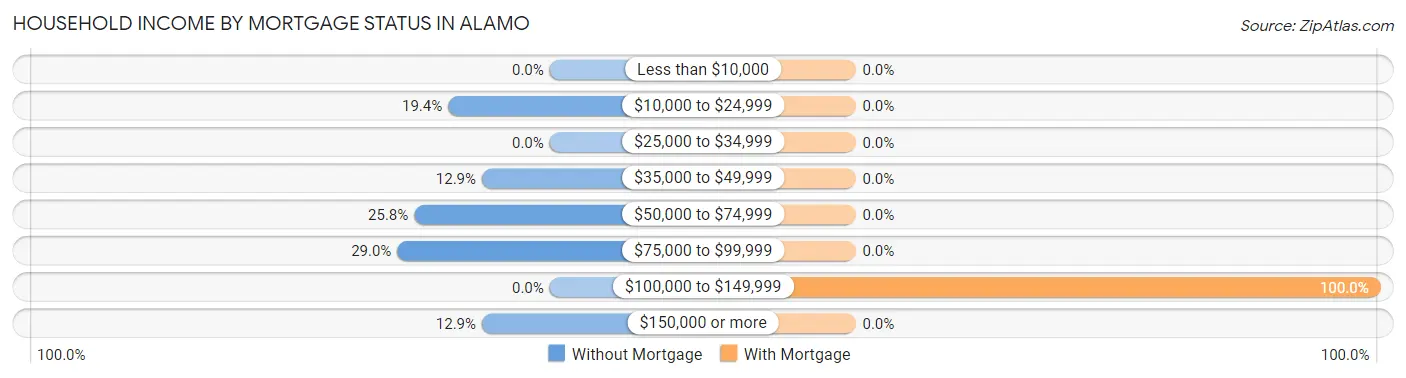
| Household Income | Without Mortgage | With Mortgage |
| Less than $10,000 | 0 (0.0%) | 0 (0.0%) |
| $10,000 to $24,999 | 6 (19.4%) | 0 (0.0%) |
| $25,000 to $34,999 | 0 (0.0%) | 0 (0.0%) |
| $35,000 to $49,999 | 4 (12.9%) | 0 (0.0%) |
| $50,000 to $74,999 | 8 (25.8%) | 0 (0.0%) |
| $75,000 to $99,999 | 9 (29.0%) | 0 (0.0%) |
| $100,000 to $149,999 | 0 (0.0%) | 3 (100.0%) |
| $150,000 or more | 4 (12.9%) | 0 (0.0%) |
| Total | 31 (100.0%) | 3 (100.0%) |
Property Value to Household Income Ratio in Alamo
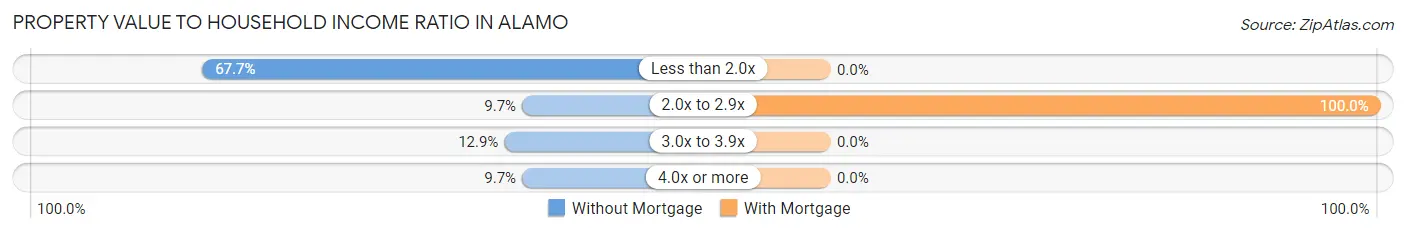
| Value-to-Income Ratio | Without Mortgage | With Mortgage |
| Less than 2.0x | 21 (67.7%) | 0 (0.0%) |
| 2.0x to 2.9x | 3 (9.7%) | 3 (100.0%) |
| 3.0x to 3.9x | 4 (12.9%) | 0 (0.0%) |
| 4.0x or more | 3 (9.7%) | 0 (0.0%) |
| Total | 31 (100.0%) | 3 (100.0%) |
Real Estate Taxes by Mortgage Status in Alamo
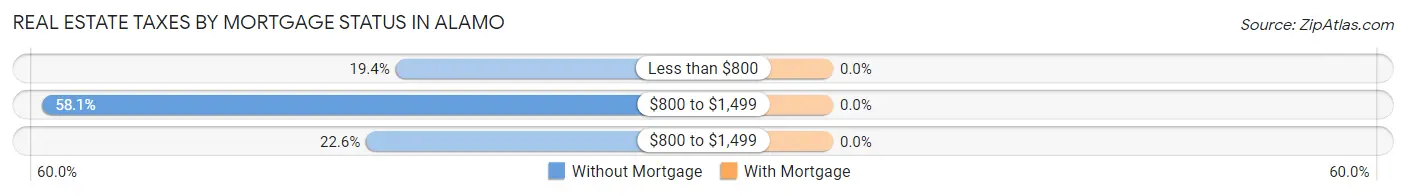
| Property Taxes | Without Mortgage | With Mortgage |
| Less than $800 | 6 (19.4%) | 0 (0.0%) |
| $800 to $1,499 | 18 (58.1%) | 0 (0.0%) |
| $800 to $1,499 | 7 (22.6%) | 0 (0.0%) |
| Total | 31 (100.0%) | 3 (100.0%) |
Health & Disability in Alamo
Health Insurance Coverage by Age in Alamo
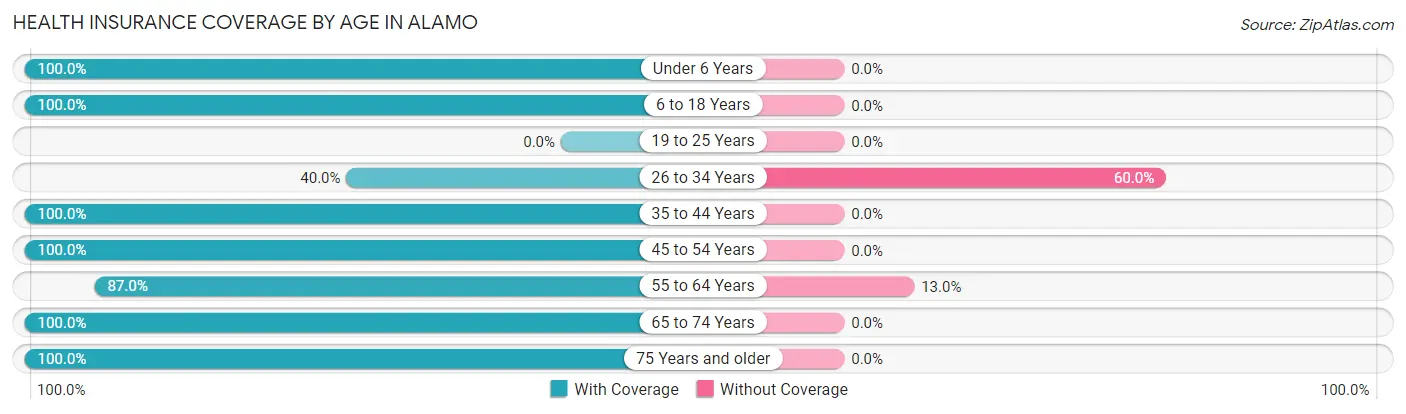
| Age Bracket | With Coverage | Without Coverage |
| Under 6 Years | 4 (100.0%) | 0 (0.0%) |
| 6 to 18 Years | 5 (100.0%) | 0 (0.0%) |
| 19 to 25 Years | 0 (0.0%) | 0 (0.0%) |
| 26 to 34 Years | 2 (40.0%) | 3 (60.0%) |
| 35 to 44 Years | 5 (100.0%) | 0 (0.0%) |
| 45 to 54 Years | 13 (100.0%) | 0 (0.0%) |
| 55 to 64 Years | 20 (87.0%) | 3 (13.0%) |
| 65 to 74 Years | 12 (100.0%) | 0 (0.0%) |
| 75 Years and older | 3 (100.0%) | 0 (0.0%) |
| Total | 64 (91.4%) | 6 (8.6%) |
Health Insurance Coverage by Citizenship Status in Alamo

| Citizenship Status | With Coverage | Without Coverage |
| Native Born | 4 (100.0%) | 0 (0.0%) |
| Foreign Born, Citizen | 5 (100.0%) | 0 (0.0%) |
| Foreign Born, not a Citizen | 0 (0.0%) | 0 (0.0%) |
Health Insurance Coverage by Household Income in Alamo
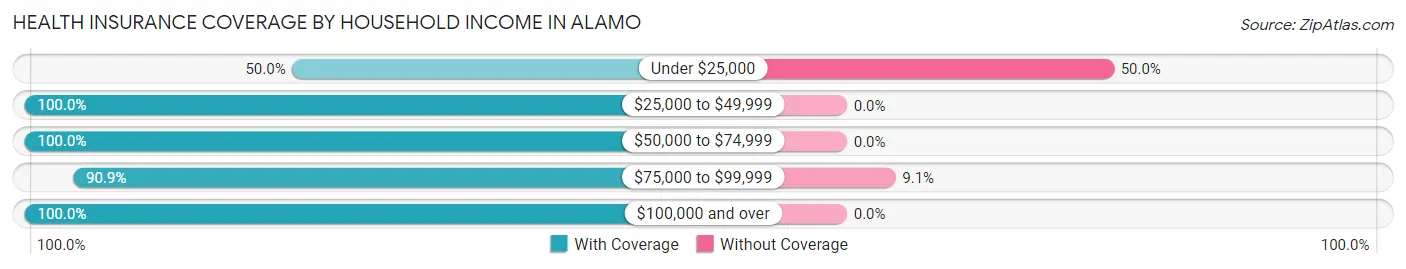
| Household Income | With Coverage | Without Coverage |
| Under $25,000 | 3 (50.0%) | 3 (50.0%) |
| $25,000 to $49,999 | 8 (100.0%) | 0 (0.0%) |
| $50,000 to $74,999 | 14 (100.0%) | 0 (0.0%) |
| $75,000 to $99,999 | 30 (90.9%) | 3 (9.1%) |
| $100,000 and over | 9 (100.0%) | 0 (0.0%) |
Public vs Private Health Insurance Coverage by Age in Alamo
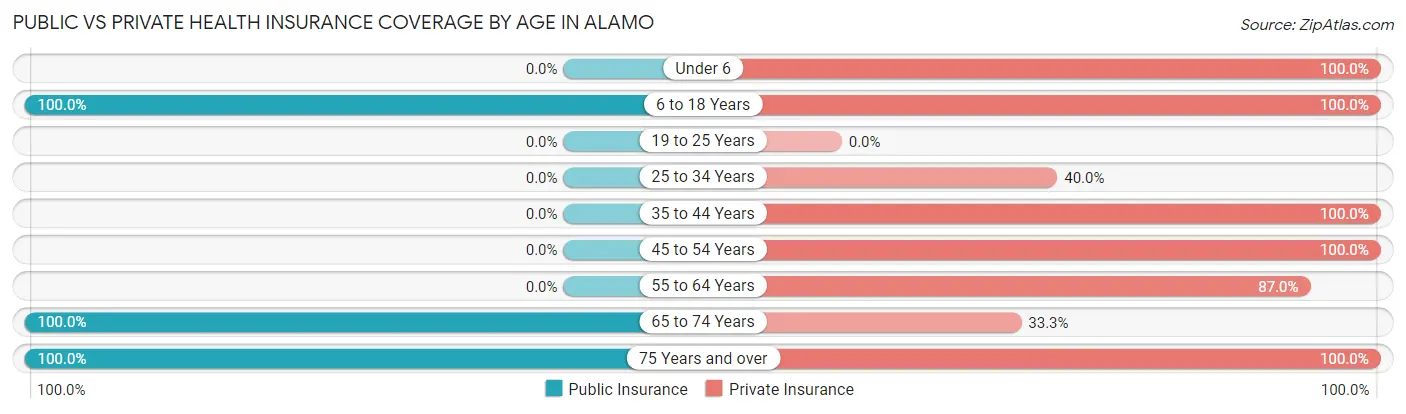
| Age Bracket | Public Insurance | Private Insurance |
| Under 6 | 0 (0.0%) | 4 (100.0%) |
| 6 to 18 Years | 5 (100.0%) | 5 (100.0%) |
| 19 to 25 Years | 0 (0.0%) | 0 (0.0%) |
| 25 to 34 Years | 0 (0.0%) | 2 (40.0%) |
| 35 to 44 Years | 0 (0.0%) | 5 (100.0%) |
| 45 to 54 Years | 0 (0.0%) | 13 (100.0%) |
| 55 to 64 Years | 0 (0.0%) | 20 (87.0%) |
| 65 to 74 Years | 12 (100.0%) | 4 (33.3%) |
| 75 Years and over | 3 (100.0%) | 3 (100.0%) |
| Total | 20 (28.6%) | 56 (80.0%) |
Disability Status by Sex by Age in Alamo
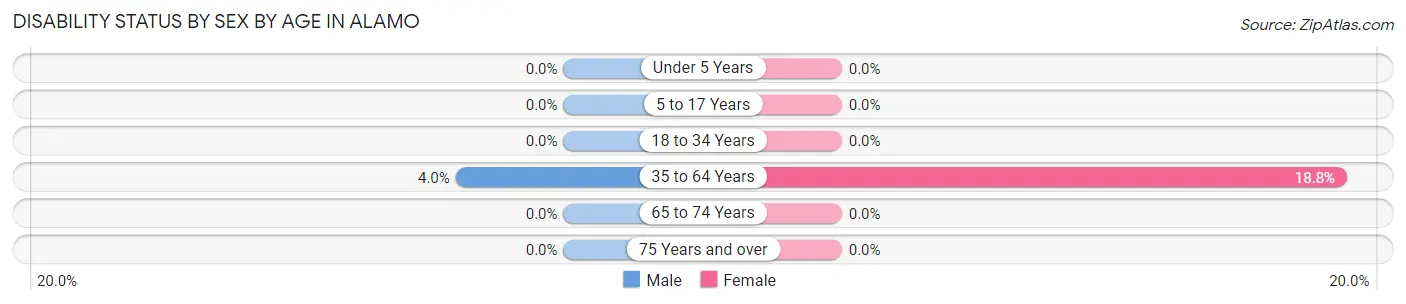
| Age Bracket | Male | Female |
| Under 5 Years | 0 (0.0%) | 0 (0.0%) |
| 5 to 17 Years | 0 (0.0%) | 0 (0.0%) |
| 18 to 34 Years | 0 (0.0%) | 0 (0.0%) |
| 35 to 64 Years | 1 (4.0%) | 3 (18.8%) |
| 65 to 74 Years | 0 (0.0%) | 0 (0.0%) |
| 75 Years and over | 0 (0.0%) | 0 (0.0%) |
Disability Class by Sex by Age in Alamo
Disability Class: Hearing Difficulty
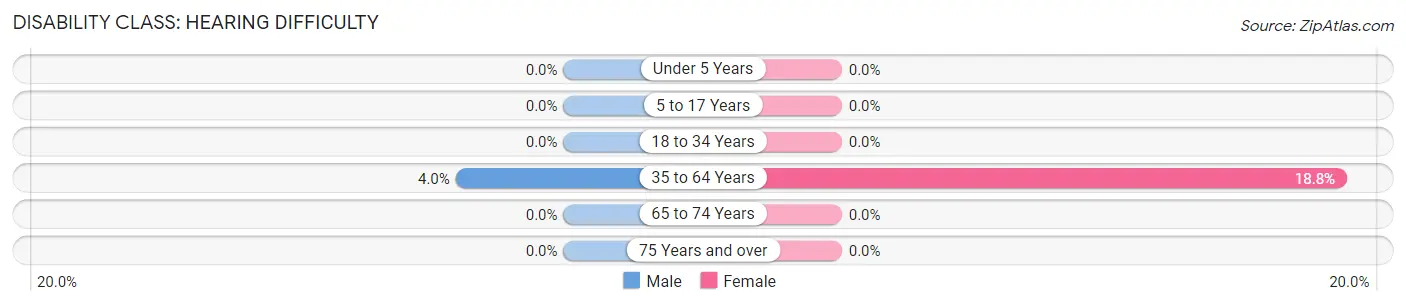
| Age Bracket | Male | Female |
| Under 5 Years | 0 (0.0%) | 0 (0.0%) |
| 5 to 17 Years | 0 (0.0%) | 0 (0.0%) |
| 18 to 34 Years | 0 (0.0%) | 0 (0.0%) |
| 35 to 64 Years | 1 (4.0%) | 3 (18.8%) |
| 65 to 74 Years | 0 (0.0%) | 0 (0.0%) |
| 75 Years and over | 0 (0.0%) | 0 (0.0%) |
Disability Class: Vision Difficulty
| Age Bracket | Male | Female |
| Under 5 Years | 0 (0.0%) | 0 (0.0%) |
| 5 to 17 Years | 0 (0.0%) | 0 (0.0%) |
| 18 to 34 Years | 0 (0.0%) | 0 (0.0%) |
| 35 to 64 Years | 0 (0.0%) | 0 (0.0%) |
| 65 to 74 Years | 0 (0.0%) | 0 (0.0%) |
| 75 Years and over | 0 (0.0%) | 0 (0.0%) |
Disability Class: Cognitive Difficulty
| Age Bracket | Male | Female |
| 5 to 17 Years | 0 (0.0%) | 0 (0.0%) |
| 18 to 34 Years | 0 (0.0%) | 0 (0.0%) |
| 35 to 64 Years | 0 (0.0%) | 0 (0.0%) |
| 65 to 74 Years | 0 (0.0%) | 0 (0.0%) |
| 75 Years and over | 0 (0.0%) | 0 (0.0%) |
Disability Class: Ambulatory Difficulty
| Age Bracket | Male | Female |
| 5 to 17 Years | 0 (0.0%) | 0 (0.0%) |
| 18 to 34 Years | 0 (0.0%) | 0 (0.0%) |
| 35 to 64 Years | 0 (0.0%) | 0 (0.0%) |
| 65 to 74 Years | 0 (0.0%) | 0 (0.0%) |
| 75 Years and over | 0 (0.0%) | 0 (0.0%) |
Disability Class: Self-Care Difficulty
| Age Bracket | Male | Female |
| 5 to 17 Years | 0 (0.0%) | 0 (0.0%) |
| 18 to 34 Years | 0 (0.0%) | 0 (0.0%) |
| 35 to 64 Years | 0 (0.0%) | 0 (0.0%) |
| 65 to 74 Years | 0 (0.0%) | 0 (0.0%) |
| 75 Years and over | 0 (0.0%) | 0 (0.0%) |
Technology Access in Alamo
Computing Device Access in Alamo
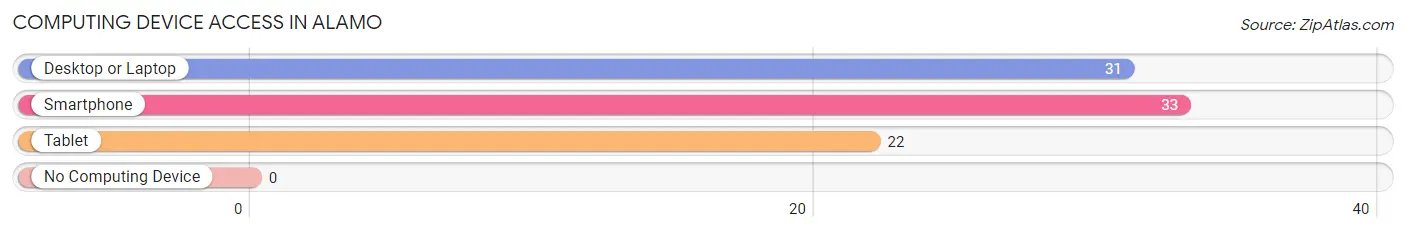
| Device Type | # Households | % Households |
| Desktop or Laptop | 31 | 91.2% |
| Smartphone | 33 | 97.1% |
| Tablet | 22 | 64.7% |
| No Computing Device | 0 | 0.0% |
| Total | 34 | 100.0% |
Internet Access in Alamo
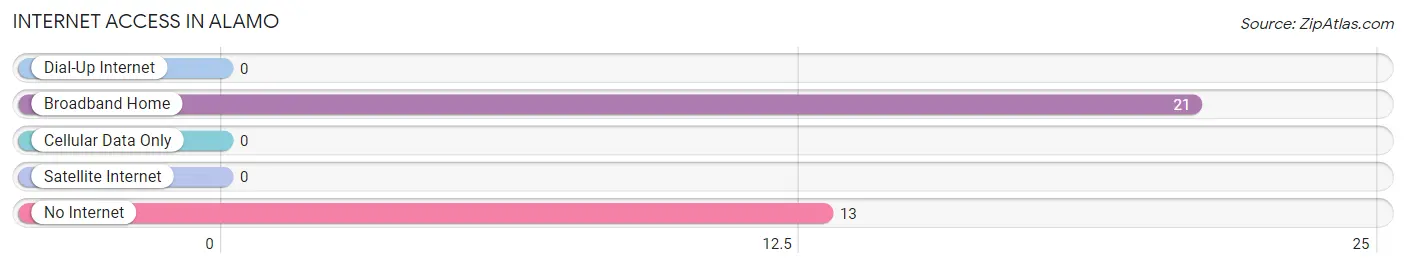
| Internet Type | # Households | % Households |
| Dial-Up Internet | 0 | 0.0% |
| Broadband Home | 21 | 61.8% |
| Cellular Data Only | 0 | 0.0% |
| Satellite Internet | 0 | 0.0% |
| No Internet | 13 | 38.2% |
| Total | 34 | 100.0% |
Alamo Summary
Alamo is a small town located in the state of North Dakota, in the United States. It is situated in the southeastern corner of the state, in the county of Grand Forks. The town has a population of approximately 200 people, and is located on the banks of the Red River of the North.
Geography
Alamo is located in the Red River Valley, which is a flat, fertile plain that stretches from the Canadian border to the Minnesota border. The town is situated on the banks of the Red River of the North, which is a major tributary of the Mississippi River. The town is surrounded by agricultural land, and is located approximately 20 miles south of Grand Forks, the county seat.
History
Alamo was founded in 1883 by a group of settlers from Norway. The town was named after the Alamo, a fort in Texas that was the site of a famous battle during the Texas Revolution. The town was originally a farming community, and the settlers grew wheat, oats, and barley. In the early 1900s, the town began to grow and develop, and a post office was established in 1906.
In the 1950s, the town began to decline, and many of the businesses and residents moved away. In the 1970s, the town was revitalized, and a new school was built. Today, Alamo is a small, rural community, and the main industries are agriculture and tourism.
Economy
The economy of Alamo is largely based on agriculture. The town is located in the Red River Valley, which is a major agricultural region. The main crops grown in the area are wheat, oats, barley, and corn. The town also has a small manufacturing sector, and there are several small businesses in the area.
Tourism is also an important part of the economy of Alamo. The town is located near several popular tourist attractions, including the Red River of the North, the Turtle River State Park, and the Grand Forks Air Force Base.
Demographics
As of the 2010 census, the population of Alamo was 200 people. The racial makeup of the town was 97.5% White, 0.5% Native American, 0.5% Asian, and 1.5% from two or more races. The median household income was $37,500, and the median age was 43.
Alamo is a small, rural town with a strong sense of community. The town is home to a variety of businesses, and the residents are friendly and welcoming. The town is a great place to live, work, and raise a family.
Common Questions
What is Per Capita Income in Alamo?
Per Capita income in Alamo is $38,413.
What is the Median Family Income in Alamo?
Median Family Income in Alamo is $76,667.
What is Income or Wage Gap in Alamo?
Income or Wage Gap in Alamo is 17.1%.
Women in Alamo earn 82.9 cents for every dollar earned by a man.
What is Inequality or Gini Index in Alamo?
Inequality or Gini Index in Alamo is 0.37.
What is the Total Population of Alamo?
Total Population of Alamo is 70.
What is the Total Male Population of Alamo?
Total Male Population of Alamo is 47.
What is the Total Female Population of Alamo?
Total Female Population of Alamo is 23.
What is the Ratio of Males per 100 Females in Alamo?
There are 204.35 Males per 100 Females in Alamo.
What is the Ratio of Females per 100 Males in Alamo?
There are 48.94 Females per 100 Males in Alamo.
What is the Median Population Age in Alamo?
Median Population Age in Alamo is 57.4 Years.
What is the Average Family Size in Alamo
Average Family Size in Alamo is 2.3 People.
What is the Average Household Size in Alamo
Average Household Size in Alamo is 2.1 People.
How Large is the Labor Force in Alamo?
There are 40 People in the Labor Forcein in Alamo.
What is the Percentage of People in the Labor Force in Alamo?
65.6% of People are in the Labor Force in Alamo.
What is the Unemployment Rate in Alamo?
Unemployment Rate in Alamo is 15.0%.