Edgeley, ND Map & Demographics
Edgeley Map
Edgeley Overview
$30,817
PER CAPITA INCOME
$78,750
AVG FAMILY INCOME
$42,500
AVG HOUSEHOLD INCOME
34.3%
WAGE / INCOME GAP [ % ]
65.7¢/ $1
WAGE / INCOME GAP [ $ ]
$11,440
FAMILY INCOME DEFICIT
0.42
INEQUALITY / GINI INDEX
678
TOTAL POPULATION
299
MALE POPULATION
379
FEMALE POPULATION
78.89
MALES / 100 FEMALES
126.76
FEMALES / 100 MALES
56.2
MEDIAN AGE
2.9
AVG FAMILY SIZE
2.0
AVG HOUSEHOLD SIZE
332
LABOR FORCE [ PEOPLE ]
61.1%
PERCENT IN LABOR FORCE
Edgeley Zip Codes
Edgeley Area Codes
Income in Edgeley
Income Overview in Edgeley
Per Capita Income in Edgeley is $30,817, while median incomes of families and households are $78,750 and $42,500 respectively.
| Characteristic | Number | Measure |
| Per Capita Income | 678 | $30,817 |
| Median Family Income | 171 | $78,750 |
| Mean Family Income | 171 | $89,693 |
| Median Household Income | 322 | $42,500 |
| Mean Household Income | 322 | $63,940 |
| Income Deficit | 171 | $11,440 |
| Wage / Income Gap (%) | 678 | 34.29% |
| Wage / Income Gap ($) | 678 | 65.71¢ per $1 |
| Gini / Inequality Index | 678 | 0.42 |
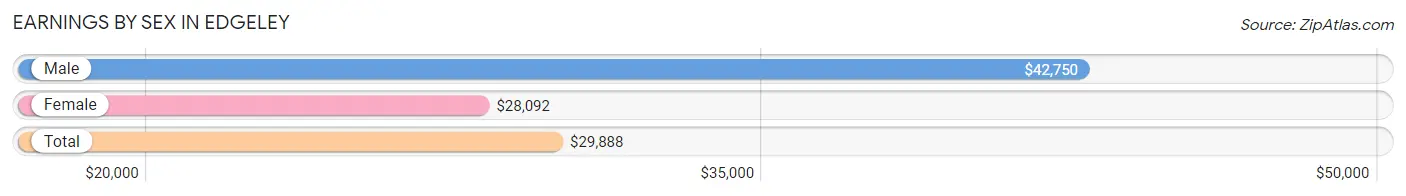
Earnings by Sex in Edgeley
Average Earnings in Edgeley are $29,888, $42,750 for men and $28,092 for women, a difference of 34.3%.
| Sex | Number | Average Earnings |
| Male | 181 (47.9%) | $42,750 |
| Female | 197 (52.1%) | $28,092 |
| Total | 378 (100.0%) | $29,888 |
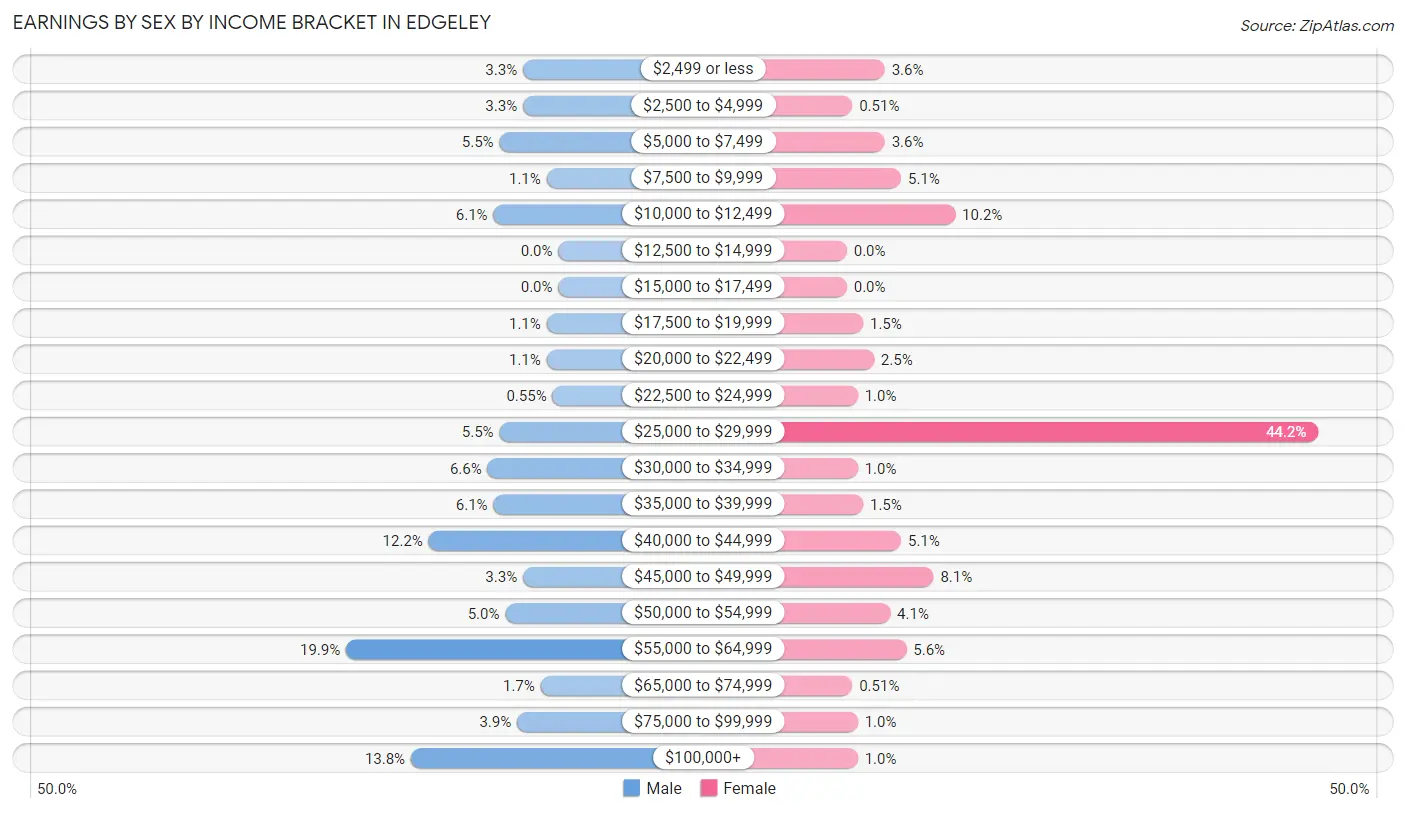
Earnings by Sex by Income Bracket in Edgeley
The most common earnings brackets in Edgeley are $55,000 to $64,999 for men (36 | 19.9%) and $25,000 to $29,999 for women (87 | 44.2%).
| Income | Male | Female |
| $2,499 or less | 6 (3.3%) | 7 (3.5%) |
| $2,500 to $4,999 | 6 (3.3%) | 1 (0.5%) |
| $5,000 to $7,499 | 10 (5.5%) | 7 (3.5%) |
| $7,500 to $9,999 | 2 (1.1%) | 10 (5.1%) |
| $10,000 to $12,499 | 11 (6.1%) | 20 (10.2%) |
| $12,500 to $14,999 | 0 (0.0%) | 0 (0.0%) |
| $15,000 to $17,499 | 0 (0.0%) | 0 (0.0%) |
| $17,500 to $19,999 | 2 (1.1%) | 3 (1.5%) |
| $20,000 to $22,499 | 2 (1.1%) | 5 (2.5%) |
| $22,500 to $24,999 | 1 (0.5%) | 2 (1.0%) |
| $25,000 to $29,999 | 10 (5.5%) | 87 (44.2%) |
| $30,000 to $34,999 | 12 (6.6%) | 2 (1.0%) |
| $35,000 to $39,999 | 11 (6.1%) | 3 (1.5%) |
| $40,000 to $44,999 | 22 (12.1%) | 10 (5.1%) |
| $45,000 to $49,999 | 6 (3.3%) | 16 (8.1%) |
| $50,000 to $54,999 | 9 (5.0%) | 8 (4.1%) |
| $55,000 to $64,999 | 36 (19.9%) | 11 (5.6%) |
| $65,000 to $74,999 | 3 (1.7%) | 1 (0.5%) |
| $75,000 to $99,999 | 7 (3.9%) | 2 (1.0%) |
| $100,000+ | 25 (13.8%) | 2 (1.0%) |
| Total | 181 (100.0%) | 197 (100.0%) |
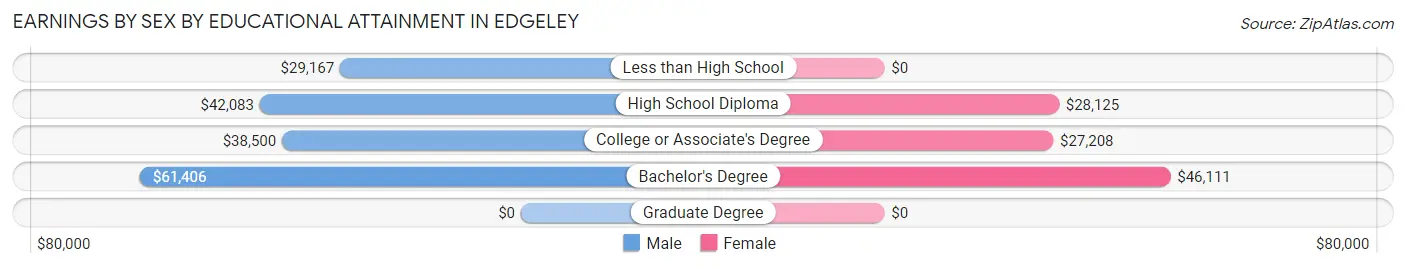
Earnings by Sex by Educational Attainment in Edgeley
Average earnings in Edgeley are $44,750 for men and $28,202 for women, a difference of 37.0%. Men with an educational attainment of bachelor's degree enjoy the highest average annual earnings of $61,406, while those with less than high school education earn the least with $29,167. Women with an educational attainment of bachelor's degree earn the most with the average annual earnings of $46,111, while those with college or associate's degree education have the smallest earnings of $27,208.
| Educational Attainment | Male Income | Female Income |
| Less than High School | $29,167 | $0 |
| High School Diploma | $42,083 | $28,125 |
| College or Associate's Degree | $38,500 | $27,208 |
| Bachelor's Degree | $61,406 | $46,111 |
| Graduate Degree | - | - |
| Total | $44,750 | $28,202 |
Family Income in Edgeley
Family Income Brackets in Edgeley
According to the Edgeley family income data, there are 35 families falling into the $100,000 to $149,999 income range, which is the most common income bracket and makes up 20.5% of all families.
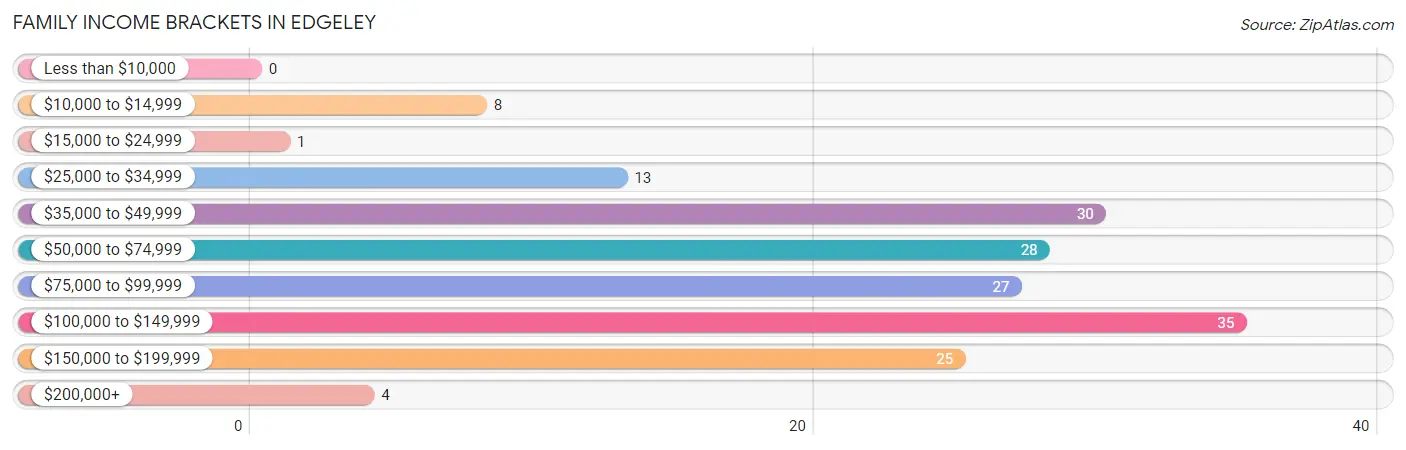
| Income Bracket | # Families | % Families |
| Less than $10,000 | 0 | 0.0% |
| $10,000 to $14,999 | 8 | 4.7% |
| $15,000 to $24,999 | 1 | 0.6% |
| $25,000 to $34,999 | 13 | 7.6% |
| $35,000 to $49,999 | 30 | 17.5% |
| $50,000 to $74,999 | 28 | 16.4% |
| $75,000 to $99,999 | 27 | 15.8% |
| $100,000 to $149,999 | 35 | 20.5% |
| $150,000 to $199,999 | 25 | 14.6% |
| $200,000+ | 4 | 2.3% |
Family Income by Famaliy Size in Edgeley
3-person families (15 | 8.8%) account for the highest median family income in Edgeley with $106,875 per family, while 2-person families (97 | 56.7%) have the highest median income of $39,732 per family member.
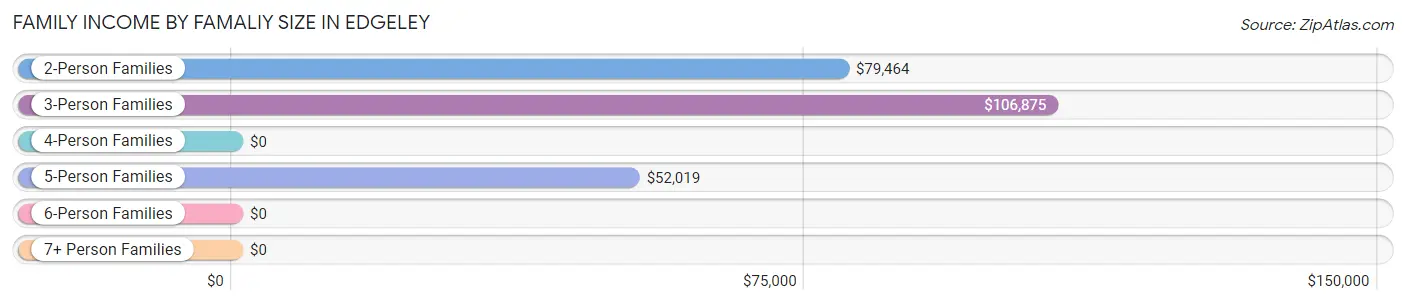
| Income Bracket | # Families | Median Income |
| 2-Person Families | 97 (56.7%) | $79,464 |
| 3-Person Families | 15 (8.8%) | $106,875 |
| 4-Person Families | 32 (18.7%) | $0 |
| 5-Person Families | 21 (12.3%) | $52,019 |
| 6-Person Families | 2 (1.2%) | $0 |
| 7+ Person Families | 4 (2.3%) | $0 |
| Total | 171 (100.0%) | $78,750 |
Family Income by Number of Earners in Edgeley
The median family income in Edgeley is $78,750, with families comprising 3+ earners (10) having the highest median family income of $156,250, while families with 1 earner (39) have the lowest median family income of $41,771, accounting for 5.9% and 22.8% of families, respectively.
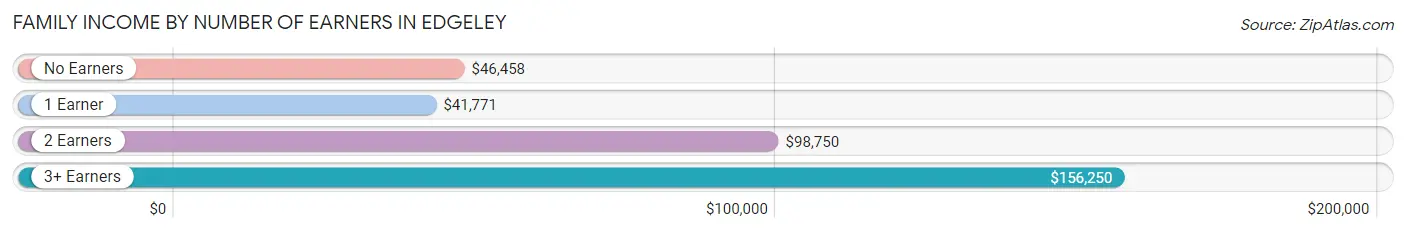
| Number of Earners | # Families | Median Income |
| No Earners | 31 (18.1%) | $46,458 |
| 1 Earner | 39 (22.8%) | $41,771 |
| 2 Earners | 91 (53.2%) | $98,750 |
| 3+ Earners | 10 (5.9%) | $156,250 |
| Total | 171 (100.0%) | $78,750 |
Household Income in Edgeley
Household Income Brackets in Edgeley
With 95 households falling in the category, the $25,000 to $34,999 income range is the most frequent in Edgeley, accounting for 29.5% of all households. In contrast, only 4 households (1.2%) fall into the $200,000+ income bracket, making it the least populous group.
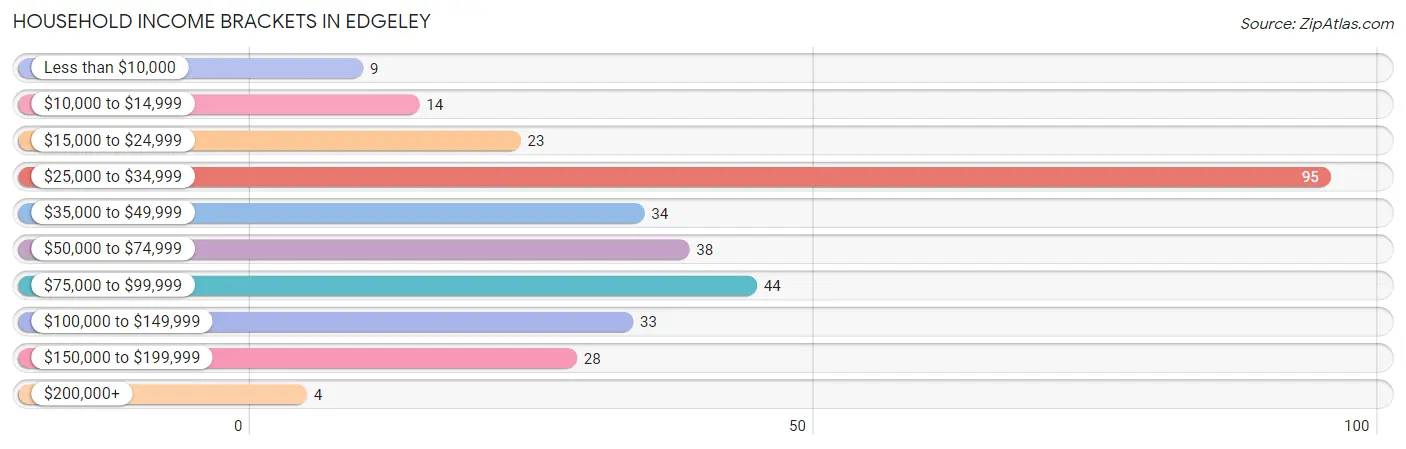
| Income Bracket | # Households | % Households |
| Less than $10,000 | 9 | 2.8% |
| $10,000 to $14,999 | 14 | 4.3% |
| $15,000 to $24,999 | 23 | 7.1% |
| $25,000 to $34,999 | 95 | 29.5% |
| $35,000 to $49,999 | 34 | 10.6% |
| $50,000 to $74,999 | 38 | 11.8% |
| $75,000 to $99,999 | 44 | 13.7% |
| $100,000 to $149,999 | 33 | 10.2% |
| $150,000 to $199,999 | 28 | 8.7% |
| $200,000+ | 4 | 1.2% |
Household Income by Householder Age in Edgeley
The median household income in Edgeley is $42,500, with the highest median household income of $53,250 found in the 25 to 44 years age bracket for the primary householder. A total of 65 households (20.2%) fall into this category.
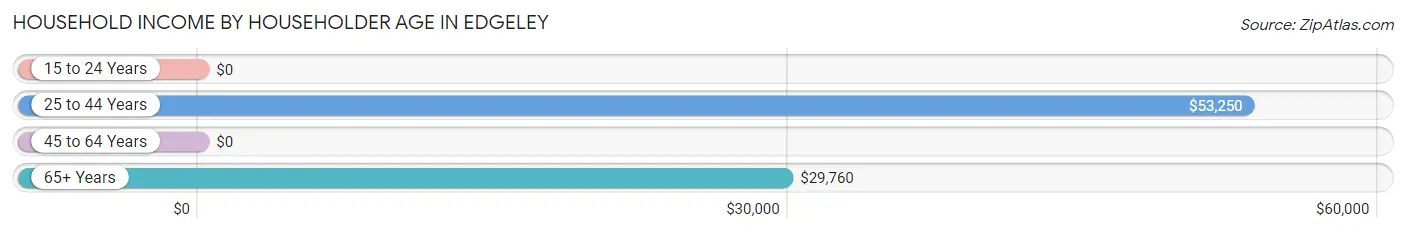
| Income Bracket | # Households | Median Income |
| 15 to 24 Years | 0 (0.0%) | $0 |
| 25 to 44 Years | 65 (20.2%) | $53,250 |
| 45 to 64 Years | 109 (33.9%) | $0 |
| 65+ Years | 148 (46.0%) | $29,760 |
| Total | 322 (100.0%) | $42,500 |
Poverty in Edgeley
Income Below Poverty by Sex and Age in Edgeley
With 12.3% poverty level for males and 14.8% for females among the residents of Edgeley, 6 to 11 year old males and under 5 year old females are the most vulnerable to poverty, with 9 males (47.4%) and 12 females (41.4%) in their respective age groups living below the poverty level.
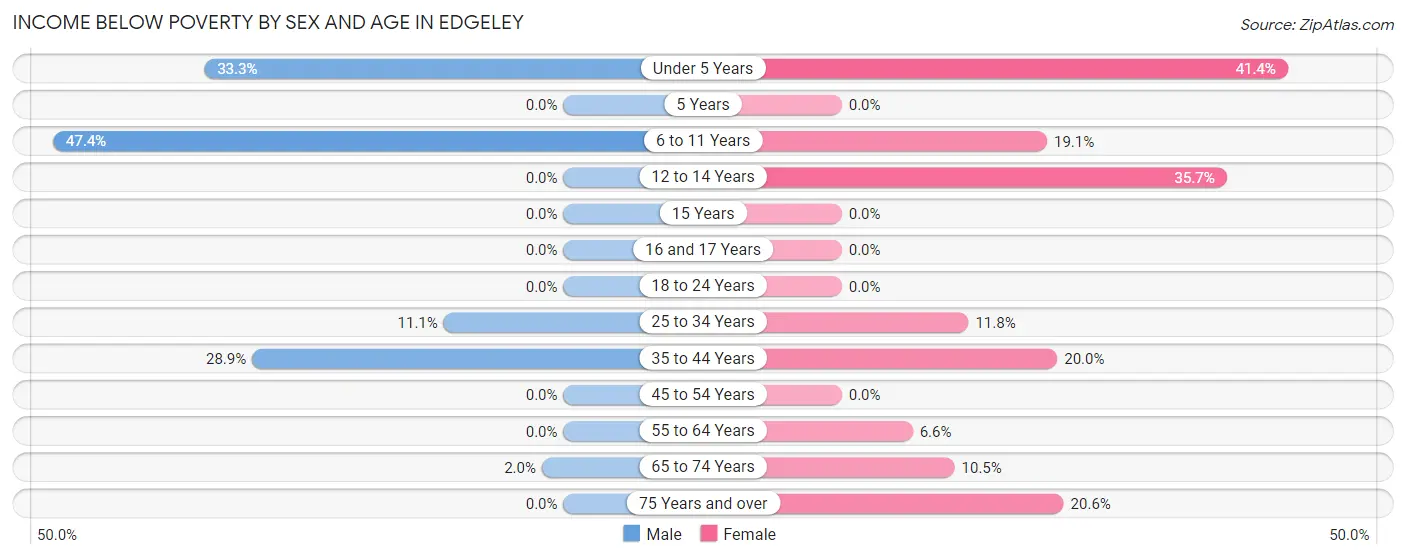
| Age Bracket | Male | Female |
| Under 5 Years | 11 (33.3%) | 12 (41.4%) |
| 5 Years | 0 (0.0%) | 0 (0.0%) |
| 6 to 11 Years | 9 (47.4%) | 4 (19.1%) |
| 12 to 14 Years | 0 (0.0%) | 5 (35.7%) |
| 15 Years | 0 (0.0%) | 0 (0.0%) |
| 16 and 17 Years | 0 (0.0%) | 0 (0.0%) |
| 18 to 24 Years | 0 (0.0%) | 0 (0.0%) |
| 25 to 34 Years | 2 (11.1%) | 4 (11.8%) |
| 35 to 44 Years | 13 (28.9%) | 7 (20.0%) |
| 45 to 54 Years | 0 (0.0%) | 0 (0.0%) |
| 55 to 64 Years | 0 (0.0%) | 5 (6.6%) |
| 65 to 74 Years | 1 (2.0%) | 9 (10.5%) |
| 75 Years and over | 0 (0.0%) | 7 (20.6%) |
| Total | 36 (12.3%) | 53 (14.8%) |
Income Above Poverty by Sex and Age in Edgeley
According to the poverty statistics in Edgeley, males aged 5 years and females aged 5 years are the age groups that are most secure financially, with 100.0% of males and 100.0% of females in these age groups living above the poverty line.
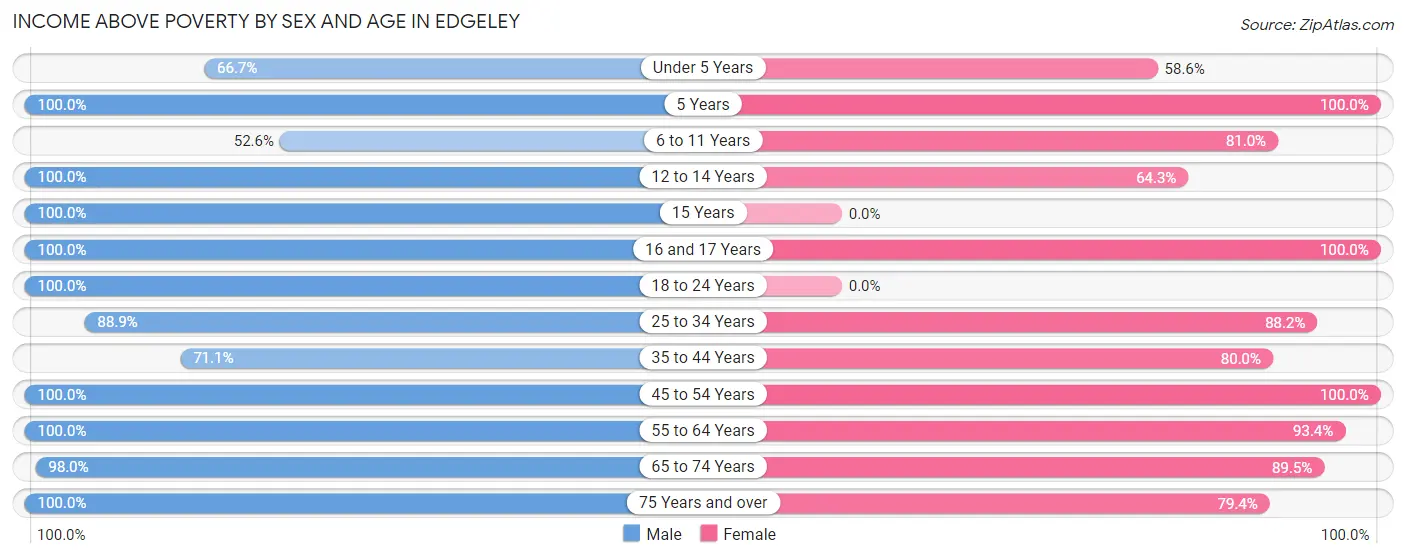
| Age Bracket | Male | Female |
| Under 5 Years | 22 (66.7%) | 17 (58.6%) |
| 5 Years | 3 (100.0%) | 7 (100.0%) |
| 6 to 11 Years | 10 (52.6%) | 17 (80.9%) |
| 12 to 14 Years | 3 (100.0%) | 9 (64.3%) |
| 15 Years | 6 (100.0%) | 0 (0.0%) |
| 16 and 17 Years | 3 (100.0%) | 5 (100.0%) |
| 18 to 24 Years | 5 (100.0%) | 0 (0.0%) |
| 25 to 34 Years | 16 (88.9%) | 30 (88.2%) |
| 35 to 44 Years | 32 (71.1%) | 28 (80.0%) |
| 45 to 54 Years | 29 (100.0%) | 17 (100.0%) |
| 55 to 64 Years | 52 (100.0%) | 71 (93.4%) |
| 65 to 74 Years | 49 (98.0%) | 77 (89.5%) |
| 75 Years and over | 27 (100.0%) | 27 (79.4%) |
| Total | 257 (87.7%) | 305 (85.2%) |
Income Below Poverty Among Married-Couple Families in Edgeley
The poverty statistics for married-couple families in Edgeley show that 9.1% or 15 of the total 165 families live below the poverty line. Families with 5 or more children have the highest poverty rate of 100.0%, comprising of 4 families. On the other hand, families with no children have the lowest poverty rate of 1.0%, which includes 1 families.
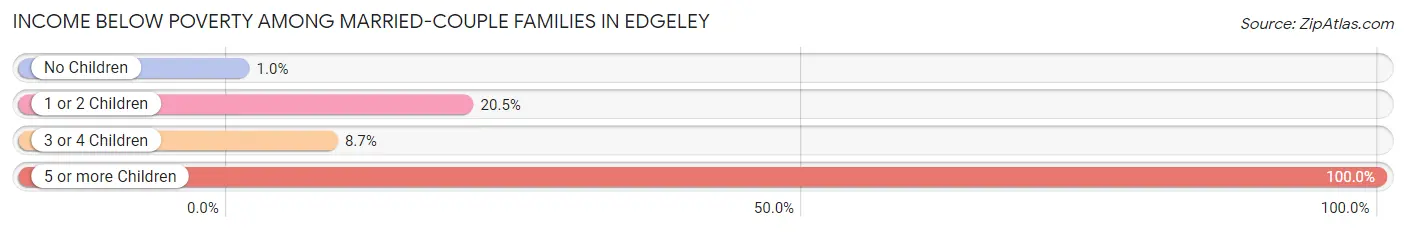
| Children | Above Poverty | Below Poverty |
| No Children | 98 (99.0%) | 1 (1.0%) |
| 1 or 2 Children | 31 (79.5%) | 8 (20.5%) |
| 3 or 4 Children | 21 (91.3%) | 2 (8.7%) |
| 5 or more Children | 0 (0.0%) | 4 (100.0%) |
| Total | 150 (90.9%) | 15 (9.1%) |
Income Below Poverty Among Single-Parent Households in Edgeley
| Children | Single Father | Single Mother |
| No Children | 0 (0.0%) | 0 (0.0%) |
| 1 or 2 Children | 0 (0.0%) | 0 (0.0%) |
| 3 or 4 Children | 0 (0.0%) | 0 (0.0%) |
| 5 or more Children | 0 (0.0%) | 0 (0.0%) |
| Total | 0 (0.0%) | 0 (0.0%) |
Income Below Poverty Among Married-Couple vs Single-Parent Households in Edgeley
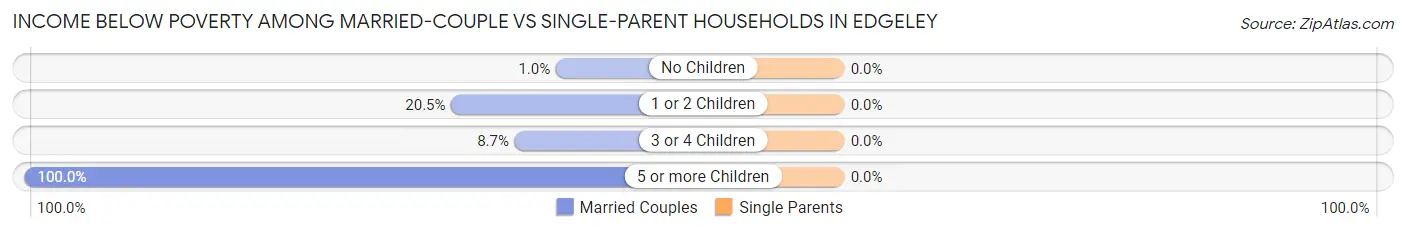
| Children | Married-Couple Families | Single-Parent Households |
| No Children | 1 (1.0%) | 0 (0.0%) |
| 1 or 2 Children | 8 (20.5%) | 0 (0.0%) |
| 3 or 4 Children | 2 (8.7%) | 0 (0.0%) |
| 5 or more Children | 4 (100.0%) | 0 (0.0%) |
| Total | 15 (9.1%) | 0 (0.0%) |
Race in Edgeley
The most populous races in Edgeley are White / Caucasian (665 | 98.1%), Hispanic or Latino (7 | 1.0%), and Black / African American (5 | 0.7%).
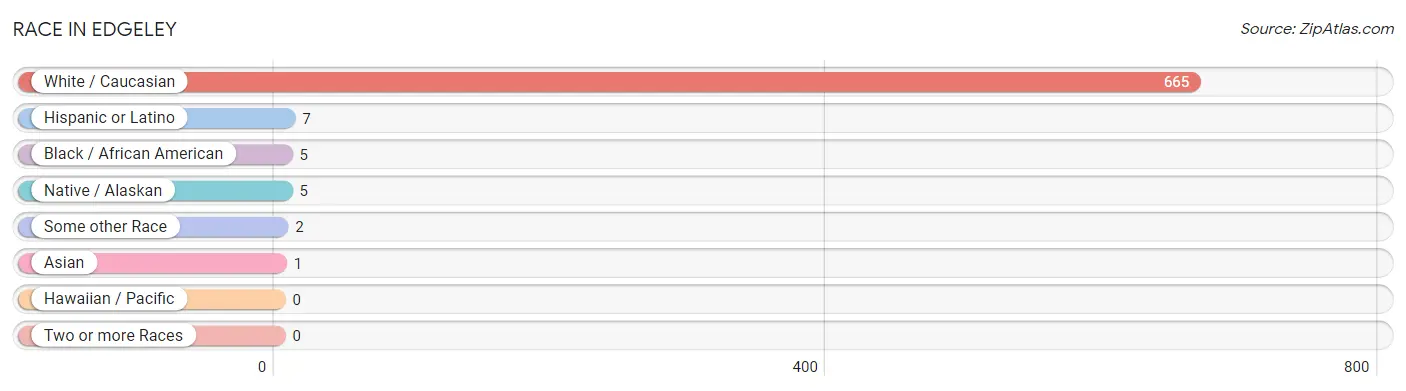
| Race | # Population | % Population |
| Asian | 1 | 0.2% |
| Black / African American | 5 | 0.7% |
| Hawaiian / Pacific | 0 | 0.0% |
| Hispanic or Latino | 7 | 1.0% |
| Native / Alaskan | 5 | 0.7% |
| White / Caucasian | 665 | 98.1% |
| Two or more Races | 0 | 0.0% |
| Some other Race | 2 | 0.3% |
| Total | 678 | 100.0% |
Ancestry in Edgeley
The most populous ancestries reported in Edgeley are German (291 | 42.9%), Norwegian (95 | 14.0%), Dutch (71 | 10.5%), Irish (57 | 8.4%), and English (33 | 4.9%), together accounting for 80.7% of all Edgeley residents.
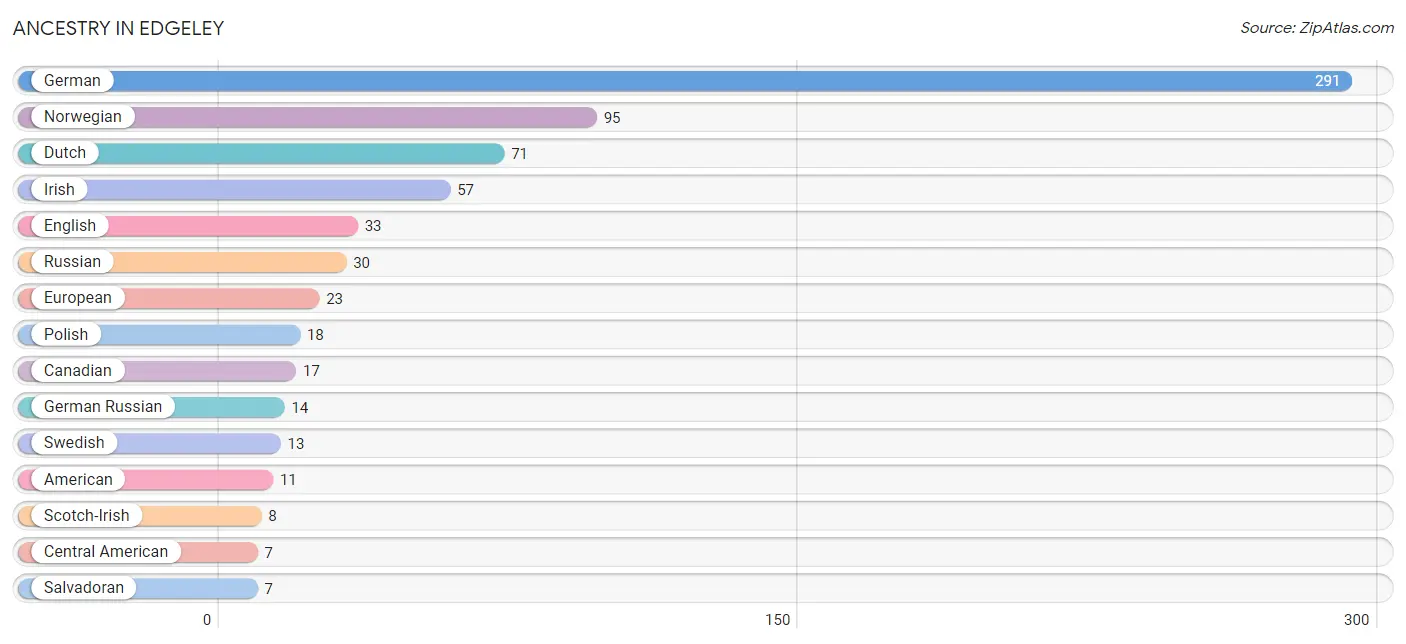
| Ancestry | # Population | % Population |
| African | 5 | 0.7% |
| American | 11 | 1.6% |
| Burmese | 1 | 0.2% |
| Canadian | 17 | 2.5% |
| Central American | 7 | 1.0% |
| Czech | 6 | 0.9% |
| Danish | 3 | 0.4% |
| Dutch | 71 | 10.5% |
| English | 33 | 4.9% |
| European | 23 | 3.4% |
| Finnish | 4 | 0.6% |
| French | 6 | 0.9% |
| French Canadian | 3 | 0.4% |
| German | 291 | 42.9% |
| German Russian | 14 | 2.1% |
| Irish | 57 | 8.4% |
| Italian | 2 | 0.3% |
| Norwegian | 95 | 14.0% |
| Polish | 18 | 2.6% |
| Russian | 30 | 4.4% |
| Salvadoran | 7 | 1.0% |
| Scandinavian | 4 | 0.6% |
| Scotch-Irish | 8 | 1.2% |
| Scottish | 7 | 1.0% |
| Sioux | 5 | 0.7% |
| Subsaharan African | 5 | 0.7% |
| Swedish | 13 | 1.9% | View All 27 Rows |
Immigrants in Edgeley
The most numerous immigrant groups reported in Edgeley came from Central America (6 | 0.9%), El Salvador (6 | 0.9%), Latin America (6 | 0.9%), Asia (1 | 0.2%), and Eastern Asia (1 | 0.2%), together accounting for 2.9% of all Edgeley residents.
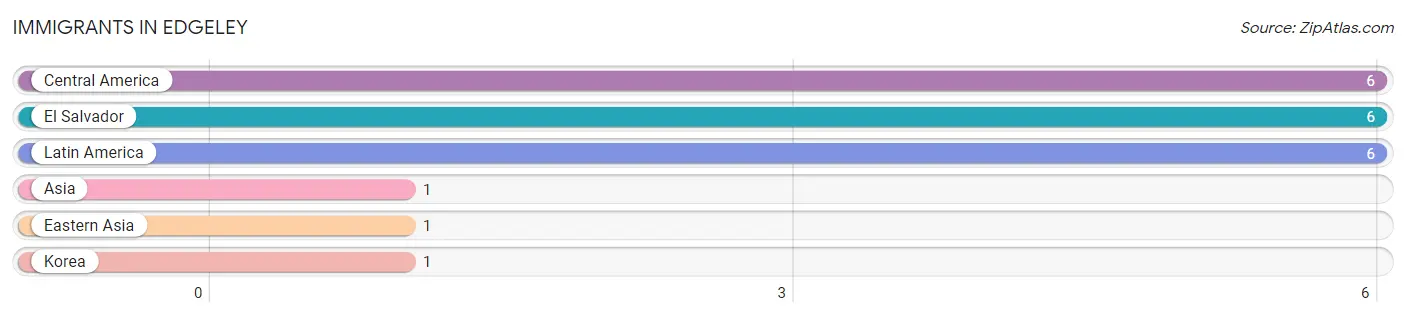
| Immigration Origin | # Population | % Population |
| Asia | 1 | 0.2% |
| Central America | 6 | 0.9% |
| Eastern Asia | 1 | 0.2% |
| El Salvador | 6 | 0.9% |
| Korea | 1 | 0.2% |
| Latin America | 6 | 0.9% | View All 6 Rows |
Sex and Age in Edgeley
Sex and Age in Edgeley
The most populous age groups in Edgeley are 35 to 39 Years (45 | 15.0%) for men and 70 to 74 Years (66 | 17.4%) for women.
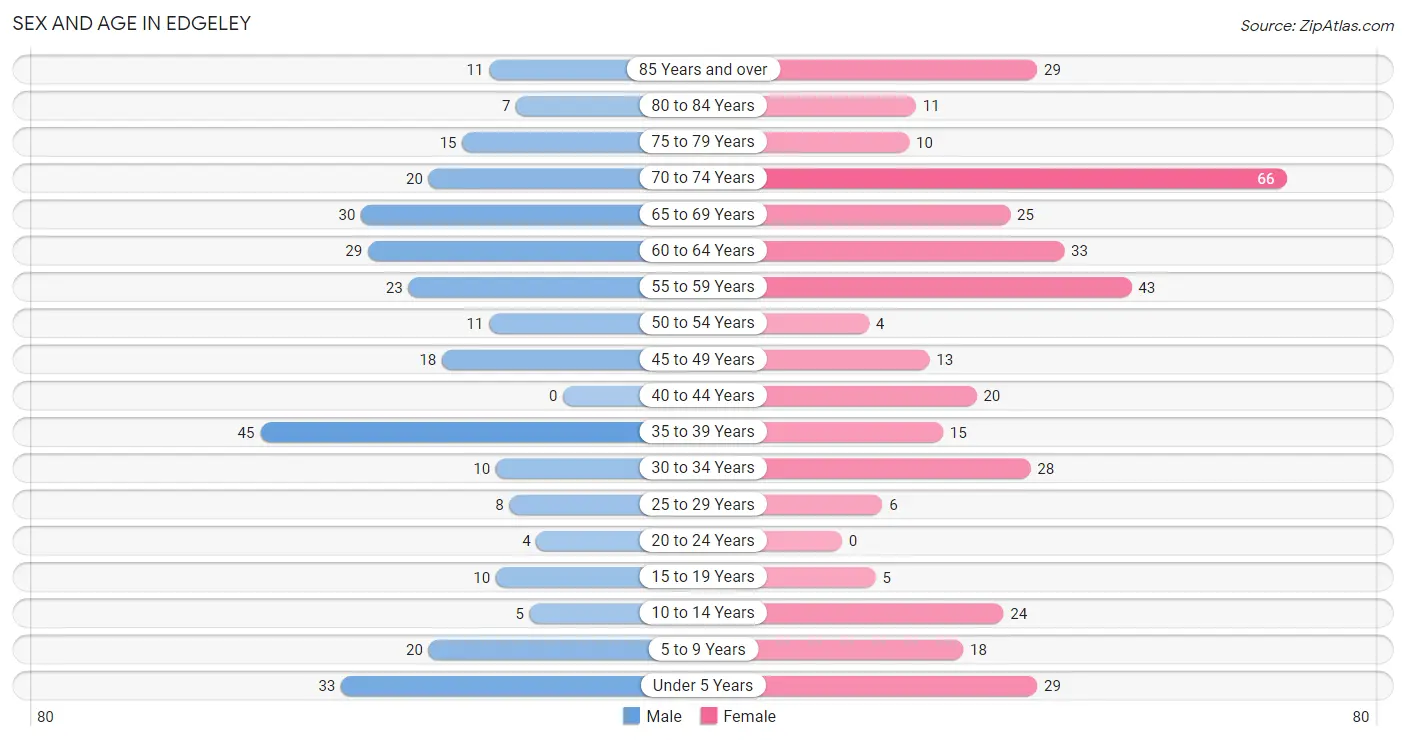
| Age Bracket | Male | Female |
| Under 5 Years | 33 (11.0%) | 29 (7.6%) |
| 5 to 9 Years | 20 (6.7%) | 18 (4.8%) |
| 10 to 14 Years | 5 (1.7%) | 24 (6.3%) |
| 15 to 19 Years | 10 (3.3%) | 5 (1.3%) |
| 20 to 24 Years | 4 (1.3%) | 0 (0.0%) |
| 25 to 29 Years | 8 (2.7%) | 6 (1.6%) |
| 30 to 34 Years | 10 (3.3%) | 28 (7.4%) |
| 35 to 39 Years | 45 (15.0%) | 15 (4.0%) |
| 40 to 44 Years | 0 (0.0%) | 20 (5.3%) |
| 45 to 49 Years | 18 (6.0%) | 13 (3.4%) |
| 50 to 54 Years | 11 (3.7%) | 4 (1.1%) |
| 55 to 59 Years | 23 (7.7%) | 43 (11.4%) |
| 60 to 64 Years | 29 (9.7%) | 33 (8.7%) |
| 65 to 69 Years | 30 (10.0%) | 25 (6.6%) |
| 70 to 74 Years | 20 (6.7%) | 66 (17.4%) |
| 75 to 79 Years | 15 (5.0%) | 10 (2.6%) |
| 80 to 84 Years | 7 (2.3%) | 11 (2.9%) |
| 85 Years and over | 11 (3.7%) | 29 (7.6%) |
| Total | 299 (100.0%) | 379 (100.0%) |
Families and Households in Edgeley
Median Family Size in Edgeley
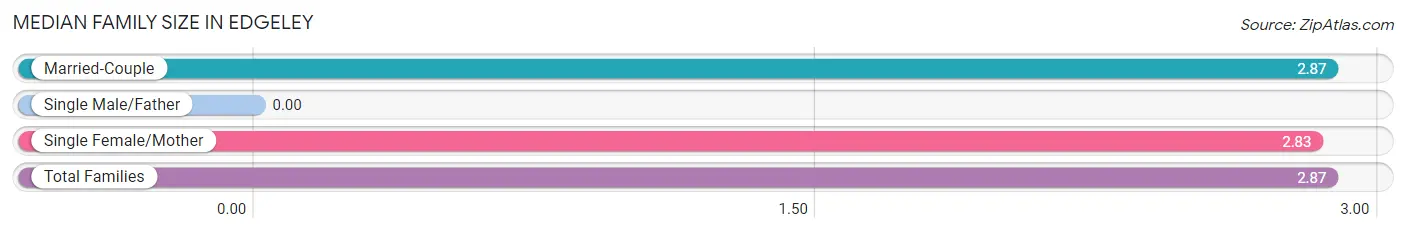
| Family Type | # Families | Family Size |
| Married-Couple | 165 (96.5%) | 2.87 |
| Single Male/Father | 0 (0.0%) | - |
| Single Female/Mother | 6 (3.5%) | 2.83 |
| Total Families | 171 (100.0%) | 2.87 |
Median Household Size in Edgeley
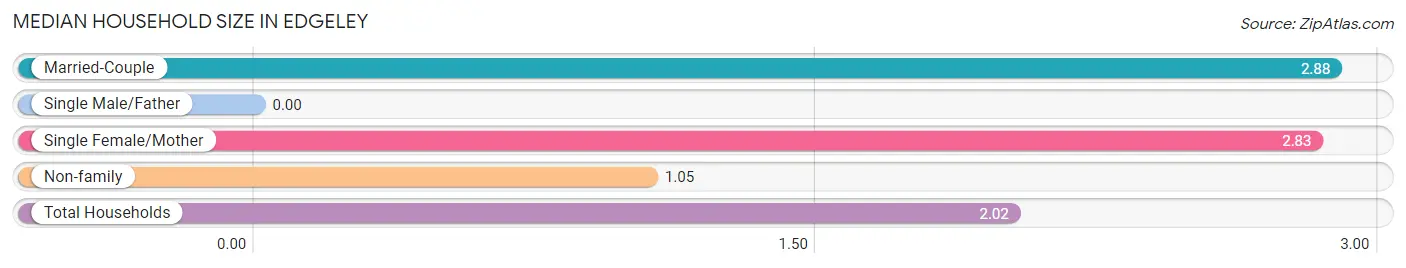
| Household Type | # Households | Household Size |
| Married-Couple | 165 (51.2%) | 2.88 |
| Single Male/Father | 0 (0.0%) | - |
| Single Female/Mother | 6 (1.9%) | 2.83 |
| Non-family | 151 (46.9%) | 1.05 |
| Total Households | 322 (100.0%) | 2.02 |
Household Size by Marriage Status in Edgeley
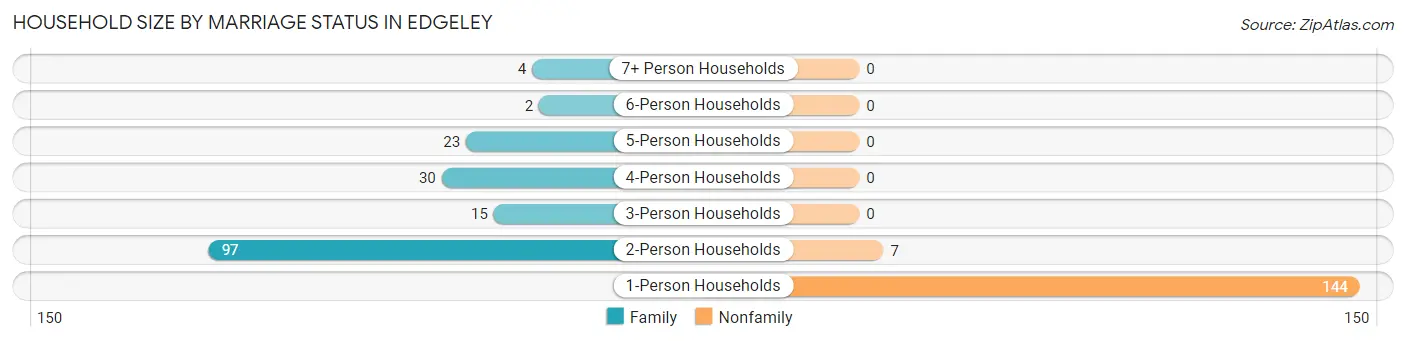
Out of a total of 322 households in Edgeley, 171 (53.1%) are family households, while 151 (46.9%) are nonfamily households. The most numerous type of family households are 2-person households, comprising 97, and the most common type of nonfamily households are 1-person households, comprising 144.
| Household Size | Family Households | Nonfamily Households |
| 1-Person Households | - | 144 (44.7%) |
| 2-Person Households | 97 (30.1%) | 7 (2.2%) |
| 3-Person Households | 15 (4.7%) | 0 (0.0%) |
| 4-Person Households | 30 (9.3%) | 0 (0.0%) |
| 5-Person Households | 23 (7.1%) | 0 (0.0%) |
| 6-Person Households | 2 (0.6%) | 0 (0.0%) |
| 7+ Person Households | 4 (1.2%) | 0 (0.0%) |
| Total | 171 (53.1%) | 151 (46.9%) |
Female Fertility in Edgeley
Fertility by Age in Edgeley
Average fertility rate in Edgeley is 103.0 births per 1,000 women. Women in the age bracket of 20 to 34 years have the highest fertility rate with 118.0 births per 1,000 women. Women in the age bracket of 35 to 50 years acount for 55.6% of all women with births.
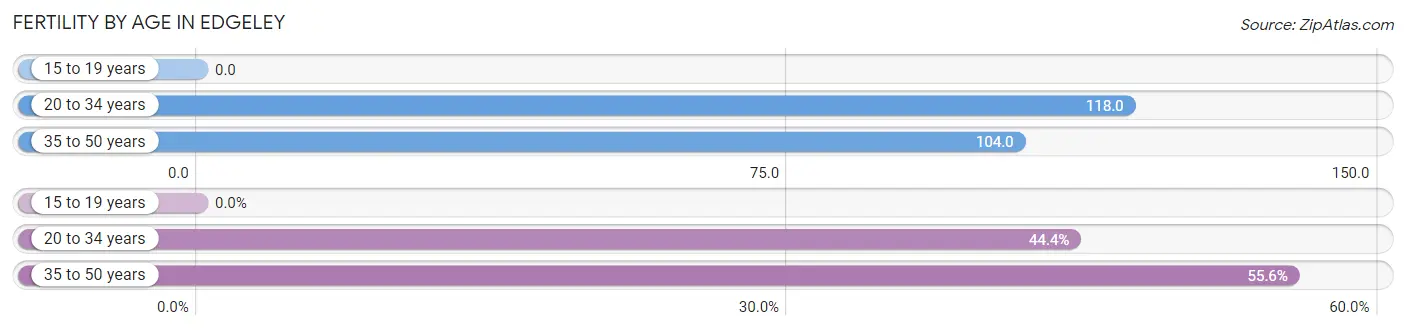
| Age Bracket | Women with Births | Births / 1,000 Women |
| 15 to 19 years | 0 (0.0%) | 0.0 |
| 20 to 34 years | 4 (44.4%) | 118.0 |
| 35 to 50 years | 5 (55.6%) | 104.0 |
| Total | 9 (100.0%) | 103.0 |
Fertility by Age by Marriage Status in Edgeley
77.8% of women with births (9) in Edgeley are married. The highest percentage of unmarried women with births falls into 20 to 34 years age bracket with 50.0% of them unmarried at the time of birth, while the lowest percentage of unmarried women with births belong to 35 to 50 years age bracket with 0.0% of them unmarried.
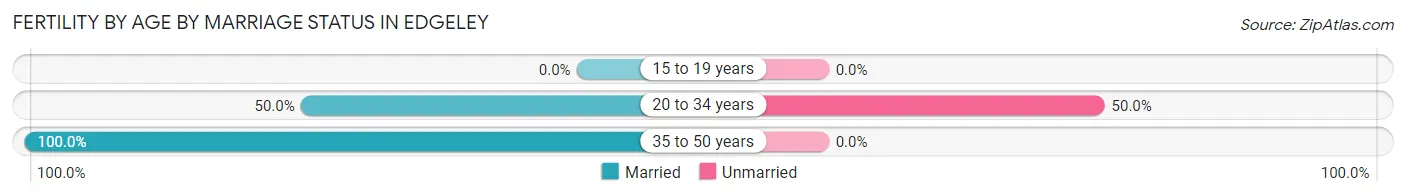
| Age Bracket | Married | Unmarried |
| 15 to 19 years | 0 (0.0%) | 0 (0.0%) |
| 20 to 34 years | 2 (50.0%) | 2 (50.0%) |
| 35 to 50 years | 5 (100.0%) | 0 (0.0%) |
| Total | 7 (77.8%) | 2 (22.2%) |
Fertility by Education in Edgeley
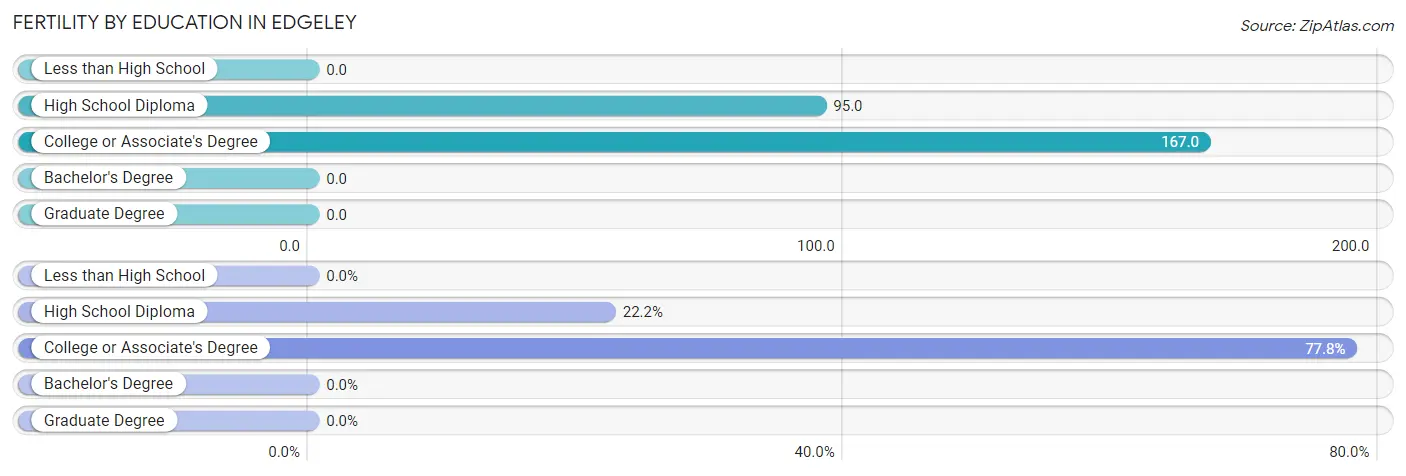
| Educational Attainment | Women with Births | Births / 1,000 Women |
| Less than High School | 0 (0.0%) | 0.0 |
| High School Diploma | 2 (22.2%) | 95.0 |
| College or Associate's Degree | 7 (77.8%) | 167.0 |
| Bachelor's Degree | 0 (0.0%) | 0.0 |
| Graduate Degree | 0 (0.0%) | 0.0 |
| Total | 9 (100.0%) | 103.0 |
Fertility by Education by Marriage Status in Edgeley
22.2% of women with births in Edgeley are unmarried. Women with the educational attainment of college or associate's degree are most likely to be married with 100.0% of them married at childbirth, while women with the educational attainment of high school diploma are least likely to be married with 100.0% of them unmarried at childbirth.
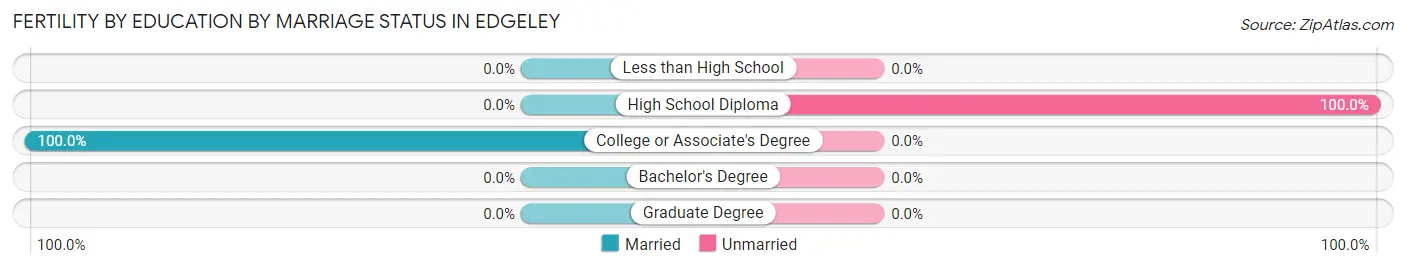
| Educational Attainment | Married | Unmarried |
| Less than High School | 0 (0.0%) | 0 (0.0%) |
| High School Diploma | 0 (0.0%) | 2 (100.0%) |
| College or Associate's Degree | 7 (100.0%) | 0 (0.0%) |
| Bachelor's Degree | 0 (0.0%) | 0 (0.0%) |
| Graduate Degree | 0 (0.0%) | 0 (0.0%) |
| Total | 7 (77.8%) | 2 (22.2%) |
Employment Characteristics in Edgeley
Employment by Class of Employer in Edgeley
Among the 327 employed individuals in Edgeley, private company employees (202 | 61.8%), local government employees (44 | 13.5%), and self-employed (not incorporated) (42 | 12.8%) make up the most common classes of employment.
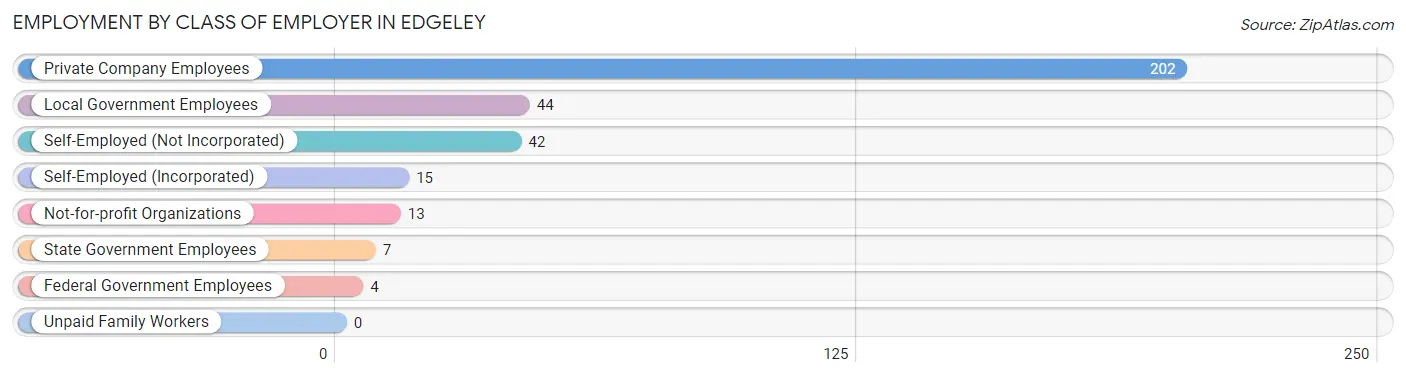
| Employer Class | # Employees | % Employees |
| Private Company Employees | 202 | 61.8% |
| Self-Employed (Incorporated) | 15 | 4.6% |
| Self-Employed (Not Incorporated) | 42 | 12.8% |
| Not-for-profit Organizations | 13 | 4.0% |
| Local Government Employees | 44 | 13.5% |
| State Government Employees | 7 | 2.1% |
| Federal Government Employees | 4 | 1.2% |
| Unpaid Family Workers | 0 | 0.0% |
| Total | 327 | 100.0% |
Employment Status by Age in Edgeley
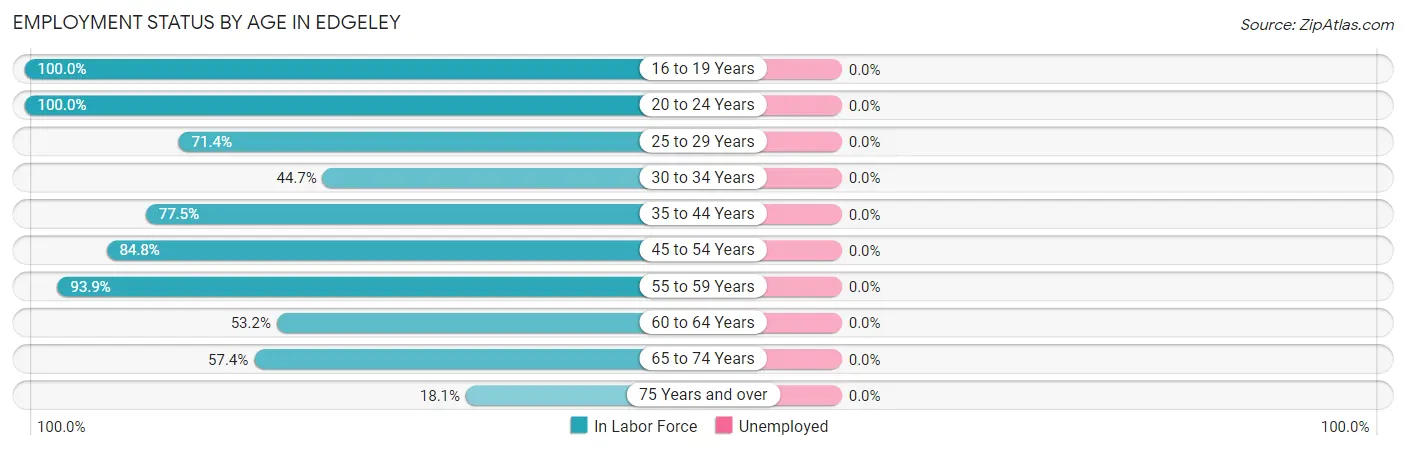
| Age Bracket | In Labor Force | Unemployed |
| 16 to 19 Years | 9 (100.0%) | 0 (0.0%) |
| 20 to 24 Years | 4 (100.0%) | 0 (0.0%) |
| 25 to 29 Years | 10 (71.4%) | 0 (0.0%) |
| 30 to 34 Years | 17 (44.7%) | 0 (0.0%) |
| 35 to 44 Years | 62 (77.5%) | 0 (0.0%) |
| 45 to 54 Years | 39 (84.8%) | 0 (0.0%) |
| 55 to 59 Years | 62 (93.9%) | 0 (0.0%) |
| 60 to 64 Years | 33 (53.2%) | 0 (0.0%) |
| 65 to 74 Years | 81 (57.4%) | 0 (0.0%) |
| 75 Years and over | 15 (18.1%) | 0 (0.0%) |
| Total | 332 (61.1%) | 0 (0.0%) |
Employment Status by Educational Attainment in Edgeley
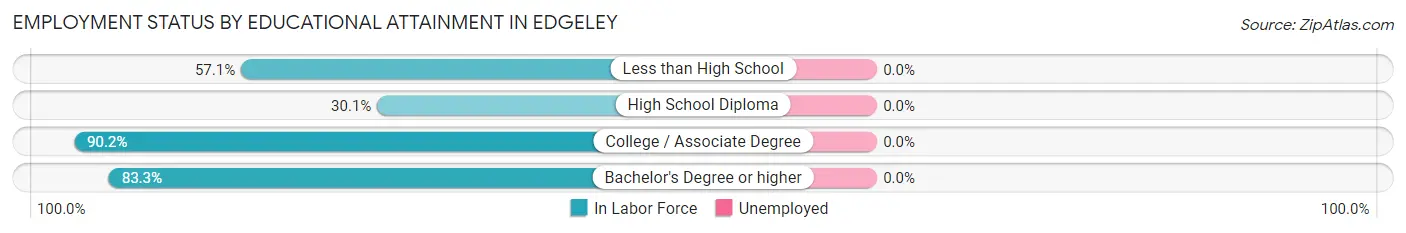
| Educational Attainment | In Labor Force | Unemployed |
| Less than High School | 8 (57.1%) | 0 (0.0%) |
| High School Diploma | 22 (30.1%) | 0 (0.0%) |
| College / Associate Degree | 138 (90.2%) | 0 (0.0%) |
| Bachelor's Degree or higher | 55 (83.3%) | 0 (0.0%) |
| Total | 223 (72.9%) | 0 (0.0%) |
Employment Occupations by Sex in Edgeley
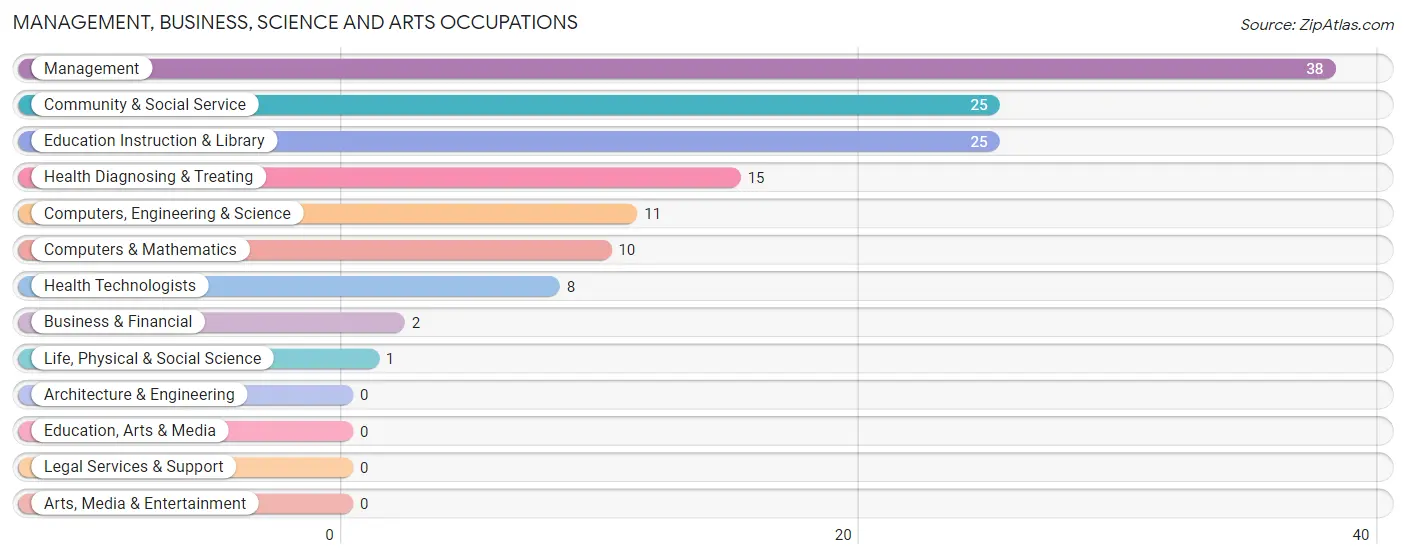
Management, Business, Science and Arts Occupations
The most common Management, Business, Science and Arts occupations in Edgeley are Management (38 | 11.5%), Community & Social Service (25 | 7.5%), Education Instruction & Library (25 | 7.5%), Health Diagnosing & Treating (15 | 4.5%), and Computers, Engineering & Science (11 | 3.3%).
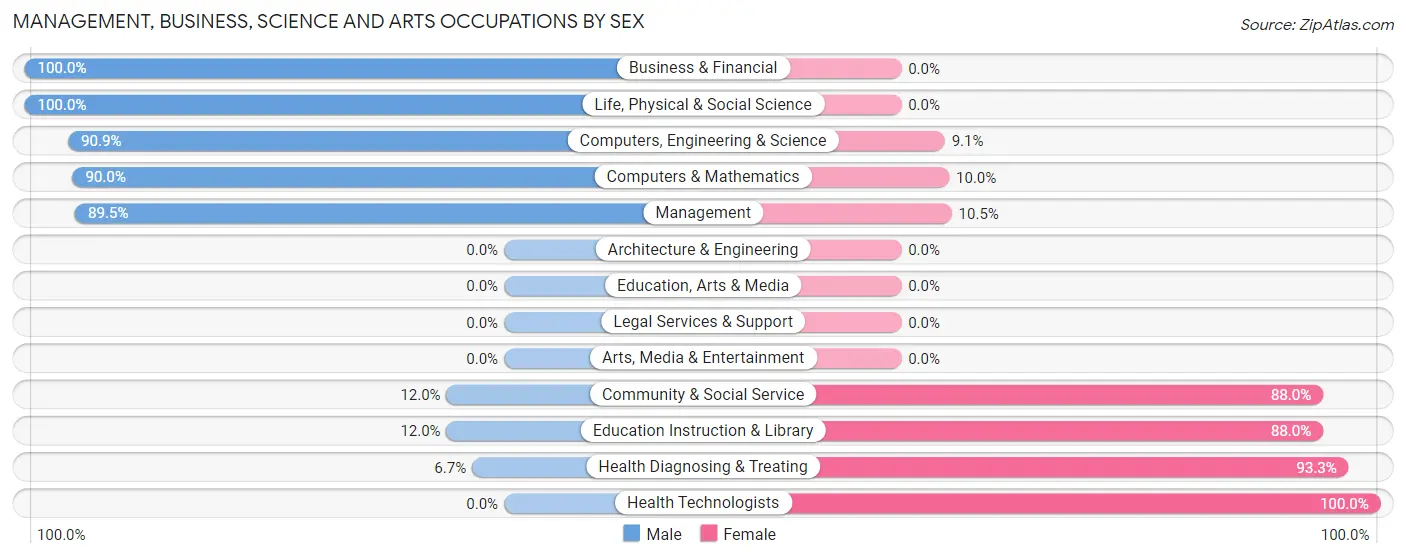
Management, Business, Science and Arts Occupations by Sex
Within the Management, Business, Science and Arts occupations in Edgeley, the most male-oriented occupations are Business & Financial (100.0%), Life, Physical & Social Science (100.0%), and Computers, Engineering & Science (90.9%), while the most female-oriented occupations are Health Technologists (100.0%), Health Diagnosing & Treating (93.3%), and Community & Social Service (88.0%).
| Occupation | Male | Female |
| Management | 34 (89.5%) | 4 (10.5%) |
| Business & Financial | 2 (100.0%) | 0 (0.0%) |
| Computers, Engineering & Science | 10 (90.9%) | 1 (9.1%) |
| Computers & Mathematics | 9 (90.0%) | 1 (10.0%) |
| Architecture & Engineering | 0 (0.0%) | 0 (0.0%) |
| Life, Physical & Social Science | 1 (100.0%) | 0 (0.0%) |
| Community & Social Service | 3 (12.0%) | 22 (88.0%) |
| Education, Arts & Media | 0 (0.0%) | 0 (0.0%) |
| Legal Services & Support | 0 (0.0%) | 0 (0.0%) |
| Education Instruction & Library | 3 (12.0%) | 22 (88.0%) |
| Arts, Media & Entertainment | 0 (0.0%) | 0 (0.0%) |
| Health Diagnosing & Treating | 1 (6.7%) | 14 (93.3%) |
| Health Technologists | 0 (0.0%) | 8 (100.0%) |
| Total (Category) | 50 (54.9%) | 41 (45.1%) |
| Total (Overall) | 154 (46.4%) | 178 (53.6%) |
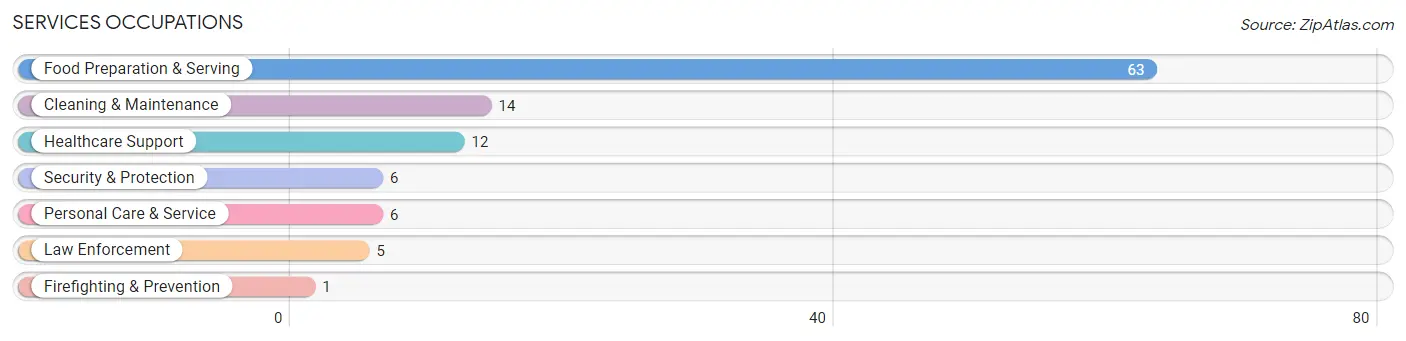
Services Occupations
The most common Services occupations in Edgeley are Food Preparation & Serving (63 | 19.0%), Cleaning & Maintenance (14 | 4.2%), Healthcare Support (12 | 3.6%), Security & Protection (6 | 1.8%), and Personal Care & Service (6 | 1.8%).
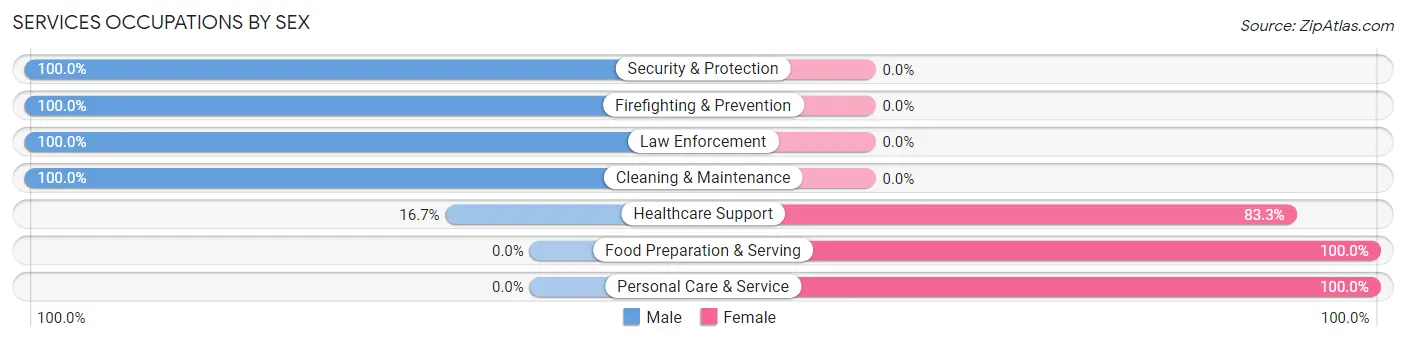
Services Occupations by Sex
Within the Services occupations in Edgeley, the most male-oriented occupations are Security & Protection (100.0%), Firefighting & Prevention (100.0%), and Law Enforcement (100.0%), while the most female-oriented occupations are Food Preparation & Serving (100.0%), Personal Care & Service (100.0%), and Healthcare Support (83.3%).
| Occupation | Male | Female |
| Healthcare Support | 2 (16.7%) | 10 (83.3%) |
| Security & Protection | 6 (100.0%) | 0 (0.0%) |
| Firefighting & Prevention | 1 (100.0%) | 0 (0.0%) |
| Law Enforcement | 5 (100.0%) | 0 (0.0%) |
| Food Preparation & Serving | 0 (0.0%) | 63 (100.0%) |
| Cleaning & Maintenance | 14 (100.0%) | 0 (0.0%) |
| Personal Care & Service | 0 (0.0%) | 6 (100.0%) |
| Total (Category) | 22 (21.8%) | 79 (78.2%) |
| Total (Overall) | 154 (46.4%) | 178 (53.6%) |
Sales and Office Occupations
The most common Sales and Office occupations in Edgeley are Sales & Related (46 | 13.9%), and Office & Administration (22 | 6.6%).
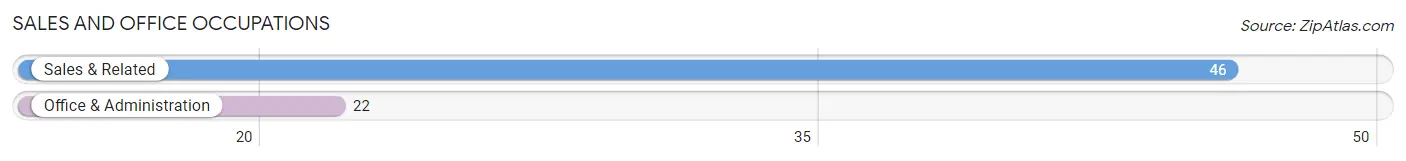
Sales and Office Occupations by Sex
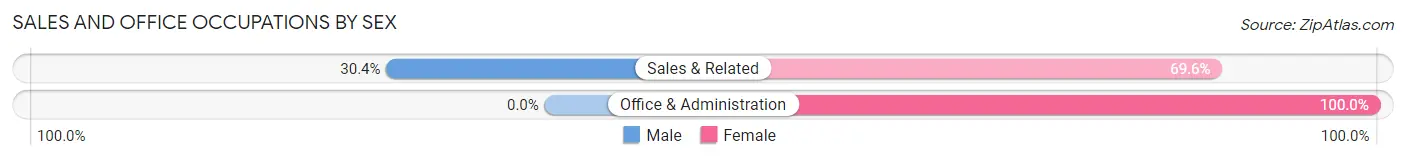
| Occupation | Male | Female |
| Sales & Related | 14 (30.4%) | 32 (69.6%) |
| Office & Administration | 0 (0.0%) | 22 (100.0%) |
| Total (Category) | 14 (20.6%) | 54 (79.4%) |
| Total (Overall) | 154 (46.4%) | 178 (53.6%) |
Natural Resources, Construction and Maintenance Occupations
The most common Natural Resources, Construction and Maintenance occupations in Edgeley are Installation, Maintenance & Repair (18 | 5.4%), Construction & Extraction (16 | 4.8%), and Farming, Fishing & Forestry (4 | 1.2%).
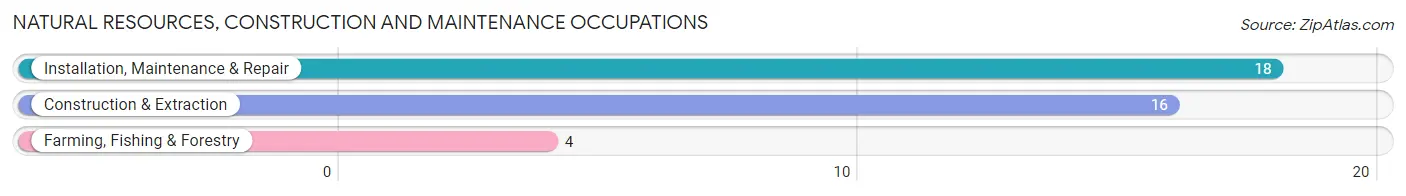
Natural Resources, Construction and Maintenance Occupations by Sex
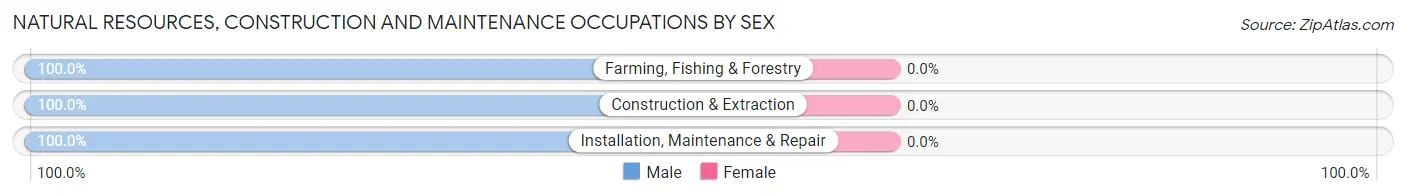
| Occupation | Male | Female |
| Farming, Fishing & Forestry | 4 (100.0%) | 0 (0.0%) |
| Construction & Extraction | 16 (100.0%) | 0 (0.0%) |
| Installation, Maintenance & Repair | 18 (100.0%) | 0 (0.0%) |
| Total (Category) | 38 (100.0%) | 0 (0.0%) |
| Total (Overall) | 154 (46.4%) | 178 (53.6%) |
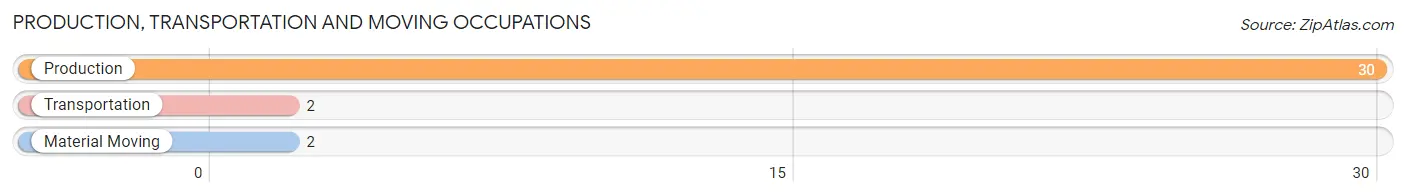
Production, Transportation and Moving Occupations
The most common Production, Transportation and Moving occupations in Edgeley are Production (30 | 9.0%), Transportation (2 | 0.6%), and Material Moving (2 | 0.6%).
Production, Transportation and Moving Occupations by Sex
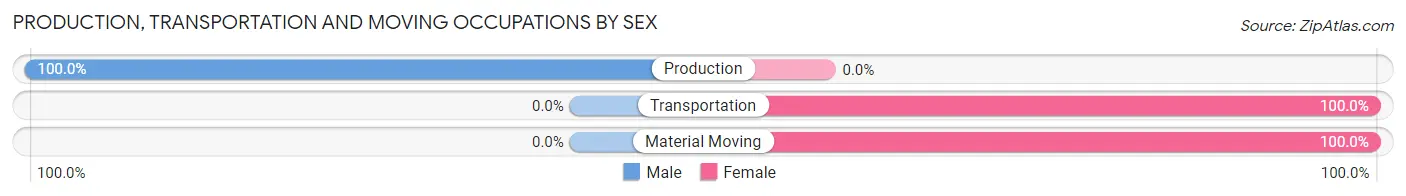
| Occupation | Male | Female |
| Production | 30 (100.0%) | 0 (0.0%) |
| Transportation | 0 (0.0%) | 2 (100.0%) |
| Material Moving | 0 (0.0%) | 2 (100.0%) |
| Total (Category) | 30 (88.2%) | 4 (11.8%) |
| Total (Overall) | 154 (46.4%) | 178 (53.6%) |
Employment Industries by Sex in Edgeley
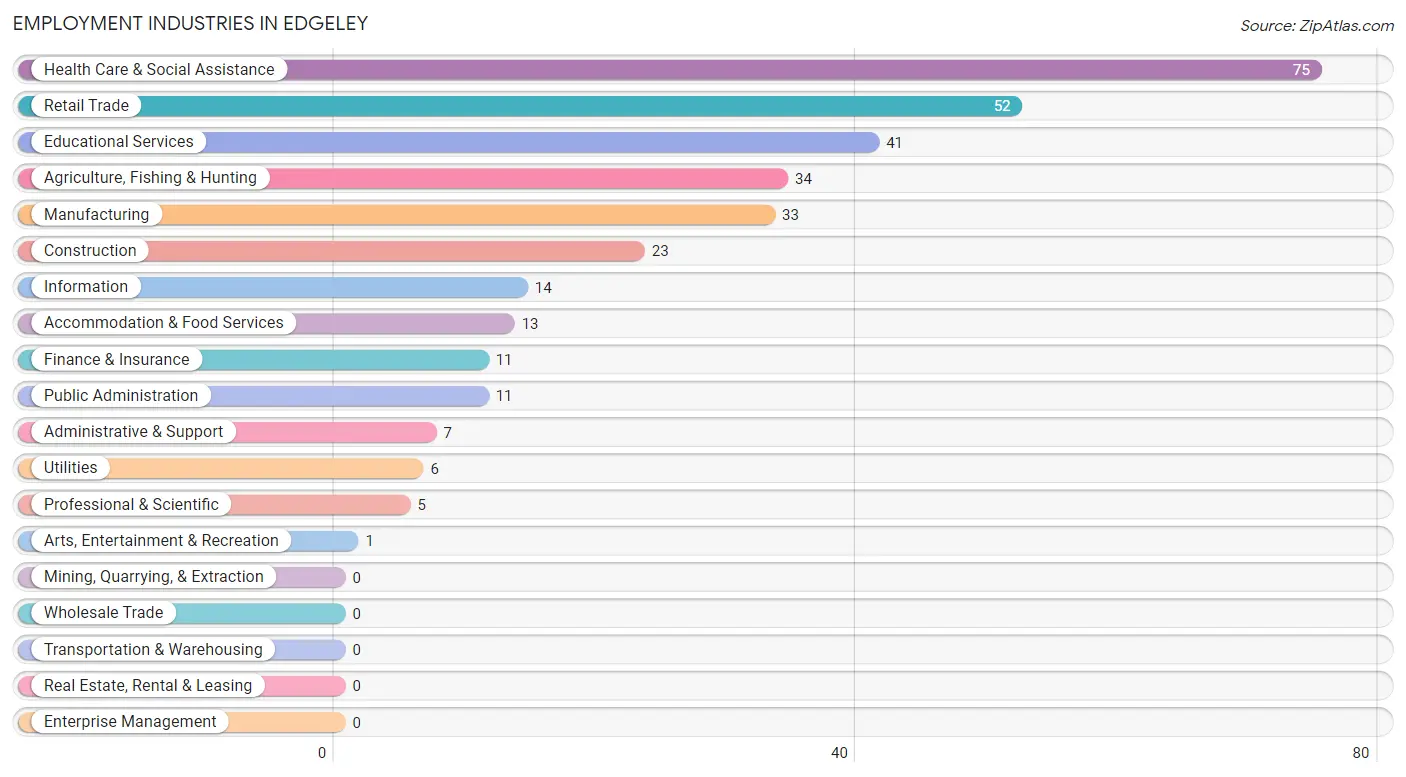
Employment Industries in Edgeley
The major employment industries in Edgeley include Health Care & Social Assistance (75 | 22.6%), Retail Trade (52 | 15.7%), Educational Services (41 | 12.3%), Agriculture, Fishing & Hunting (34 | 10.2%), and Manufacturing (33 | 9.9%).
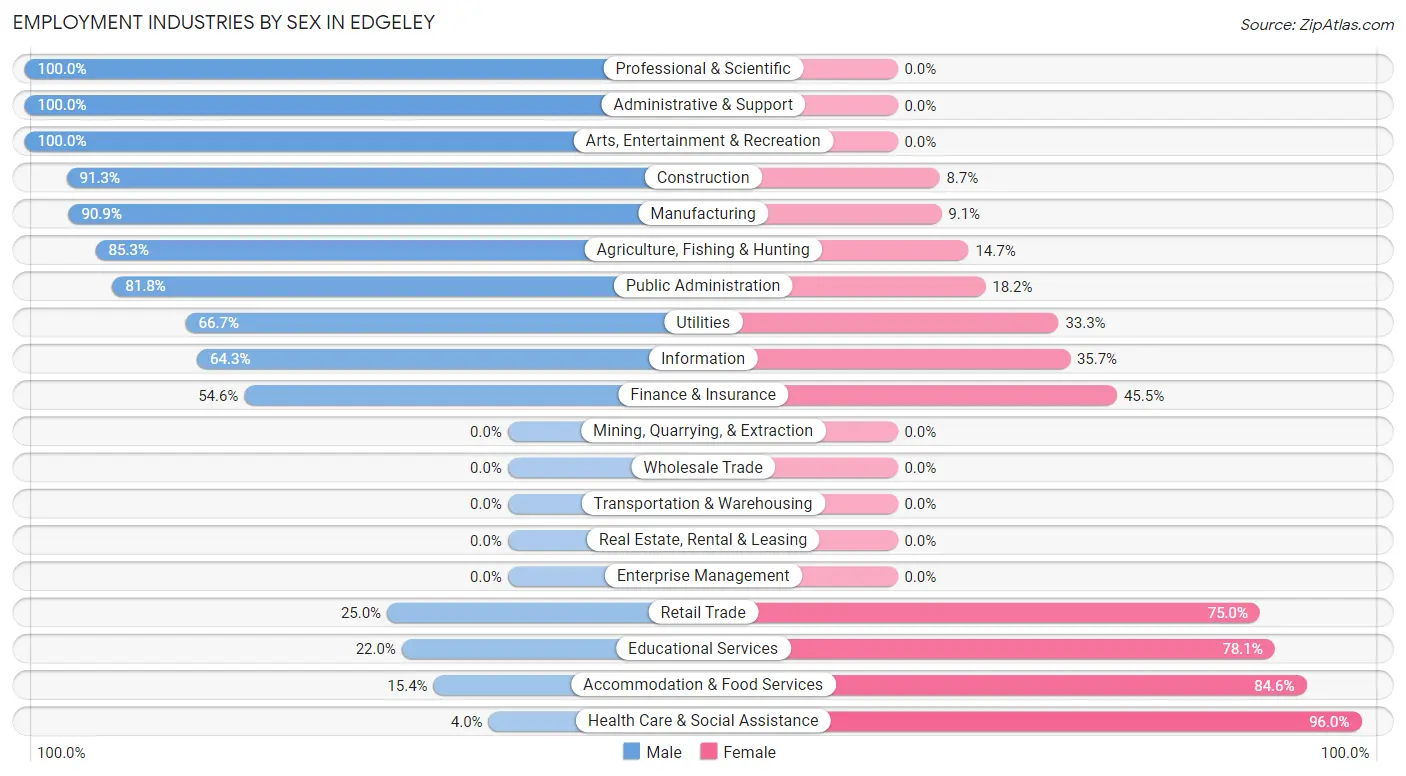
Employment Industries by Sex in Edgeley
The Edgeley industries that see more men than women are Professional & Scientific (100.0%), Administrative & Support (100.0%), and Arts, Entertainment & Recreation (100.0%), whereas the industries that tend to have a higher number of women are Health Care & Social Assistance (96.0%), Accommodation & Food Services (84.6%), and Educational Services (78.0%).
| Industry | Male | Female |
| Agriculture, Fishing & Hunting | 29 (85.3%) | 5 (14.7%) |
| Mining, Quarrying, & Extraction | 0 (0.0%) | 0 (0.0%) |
| Construction | 21 (91.3%) | 2 (8.7%) |
| Manufacturing | 30 (90.9%) | 3 (9.1%) |
| Wholesale Trade | 0 (0.0%) | 0 (0.0%) |
| Retail Trade | 13 (25.0%) | 39 (75.0%) |
| Transportation & Warehousing | 0 (0.0%) | 0 (0.0%) |
| Utilities | 4 (66.7%) | 2 (33.3%) |
| Information | 9 (64.3%) | 5 (35.7%) |
| Finance & Insurance | 6 (54.5%) | 5 (45.5%) |
| Real Estate, Rental & Leasing | 0 (0.0%) | 0 (0.0%) |
| Professional & Scientific | 5 (100.0%) | 0 (0.0%) |
| Enterprise Management | 0 (0.0%) | 0 (0.0%) |
| Administrative & Support | 7 (100.0%) | 0 (0.0%) |
| Educational Services | 9 (22.0%) | 32 (78.0%) |
| Health Care & Social Assistance | 3 (4.0%) | 72 (96.0%) |
| Arts, Entertainment & Recreation | 1 (100.0%) | 0 (0.0%) |
| Accommodation & Food Services | 2 (15.4%) | 11 (84.6%) |
| Public Administration | 9 (81.8%) | 2 (18.2%) |
| Total | 154 (46.4%) | 178 (53.6%) |
Education in Edgeley
School Enrollment in Edgeley
The most common levels of schooling among the 105 students in Edgeley are elementary school (30 | 28.6%), middle school (27 | 25.7%), and nursery / preschool (25 | 23.8%).
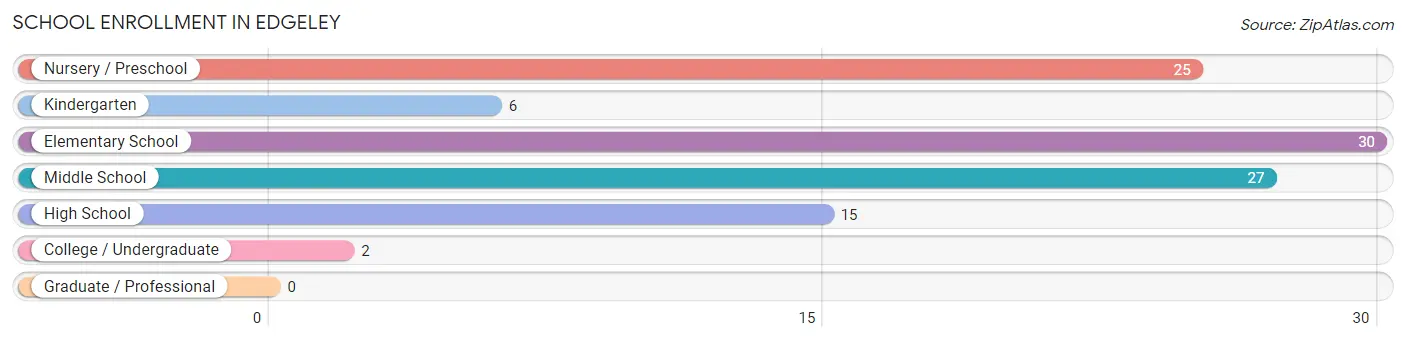
| School Level | # Students | % Students |
| Nursery / Preschool | 25 | 23.8% |
| Kindergarten | 6 | 5.7% |
| Elementary School | 30 | 28.6% |
| Middle School | 27 | 25.7% |
| High School | 15 | 14.3% |
| College / Undergraduate | 2 | 1.9% |
| Graduate / Professional | 0 | 0.0% |
| Total | 105 | 100.0% |
School Enrollment by Age by Funding Source in Edgeley
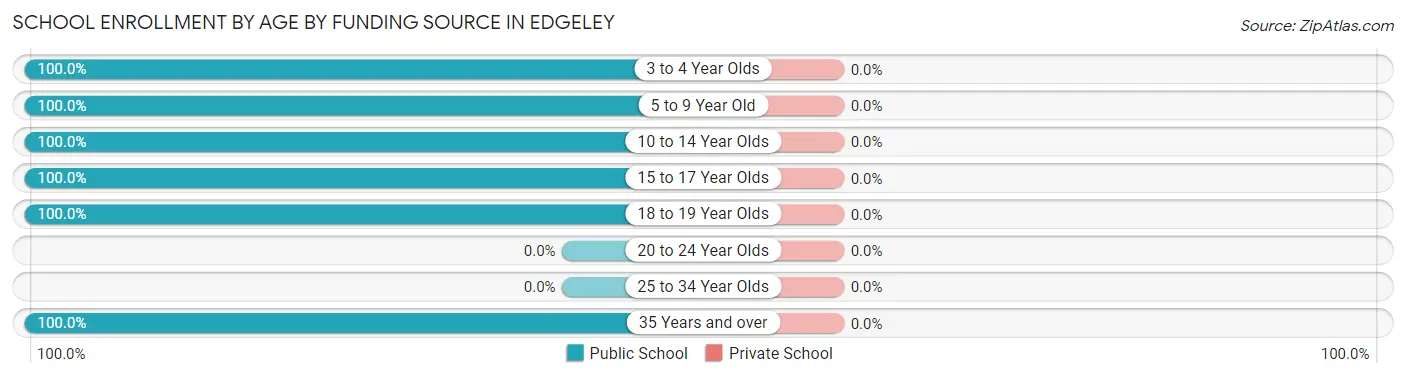
| Age Bracket | Public School | Private School |
| 3 to 4 Year Olds | 21 (100.0%) | 0 (0.0%) |
| 5 to 9 Year Old | 38 (100.0%) | 0 (0.0%) |
| 10 to 14 Year Olds | 29 (100.0%) | 0 (0.0%) |
| 15 to 17 Year Olds | 14 (100.0%) | 0 (0.0%) |
| 18 to 19 Year Olds | 1 (100.0%) | 0 (0.0%) |
| 20 to 24 Year Olds | 0 (0.0%) | 0 (0.0%) |
| 25 to 34 Year Olds | 0 (0.0%) | 0 (0.0%) |
| 35 Years and over | 2 (100.0%) | 0 (0.0%) |
| Total | 105 (100.0%) | 0 (0.0%) |
Educational Attainment by Field of Study in Edgeley
Education (25 | 29.8%), bio, nature & agricultural (21 | 25.0%), business (10 | 11.9%), visual & performing arts (6 | 7.1%), and literature & languages (5 | 5.9%) are the most common fields of study among 84 individuals in Edgeley who have obtained a bachelor's degree or higher.
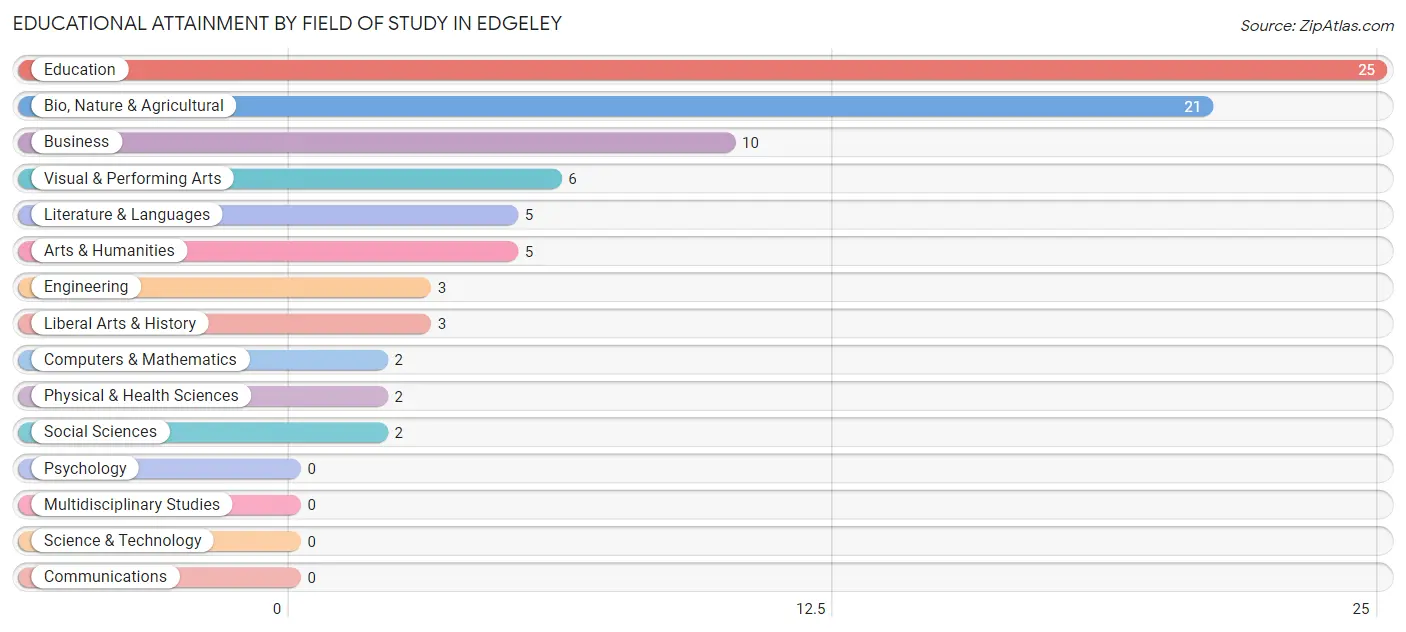
| Field of Study | # Graduates | % Graduates |
| Computers & Mathematics | 2 | 2.4% |
| Bio, Nature & Agricultural | 21 | 25.0% |
| Physical & Health Sciences | 2 | 2.4% |
| Psychology | 0 | 0.0% |
| Social Sciences | 2 | 2.4% |
| Engineering | 3 | 3.6% |
| Multidisciplinary Studies | 0 | 0.0% |
| Science & Technology | 0 | 0.0% |
| Business | 10 | 11.9% |
| Education | 25 | 29.8% |
| Literature & Languages | 5 | 5.9% |
| Liberal Arts & History | 3 | 3.6% |
| Visual & Performing Arts | 6 | 7.1% |
| Communications | 0 | 0.0% |
| Arts & Humanities | 5 | 5.9% |
| Total | 84 | 100.0% |
Transportation & Commute in Edgeley
Vehicle Availability by Sex in Edgeley
The most prevalent vehicle ownership categories in Edgeley are males with 2 vehicles (58, accounting for 38.9%) and females with 2 vehicles (86, making up 32.6%).
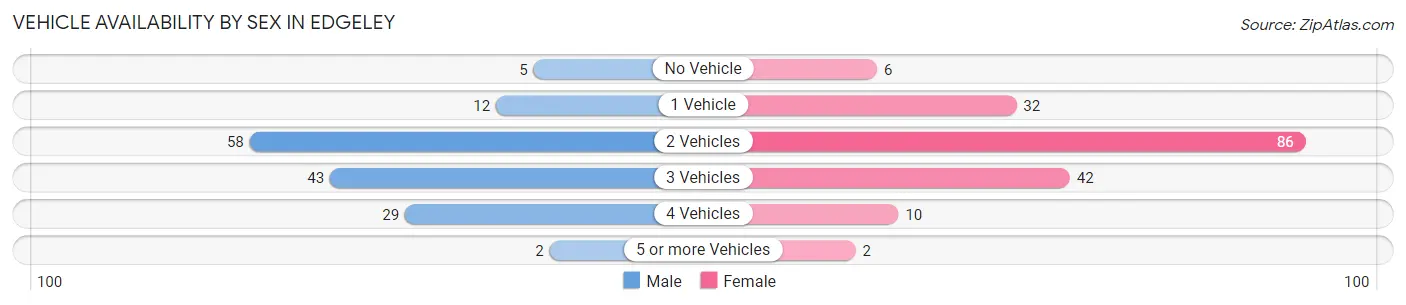
| Vehicles Available | Male | Female |
| No Vehicle | 5 (3.4%) | 6 (3.4%) |
| 1 Vehicle | 12 (8.1%) | 32 (18.0%) |
| 2 Vehicles | 58 (38.9%) | 86 (48.3%) |
| 3 Vehicles | 43 (28.9%) | 42 (23.6%) |
| 4 Vehicles | 29 (19.5%) | 10 (5.6%) |
| 5 or more Vehicles | 2 (1.3%) | 2 (1.1%) |
| Total | 149 (100.0%) | 178 (100.0%) |
Commute Time in Edgeley
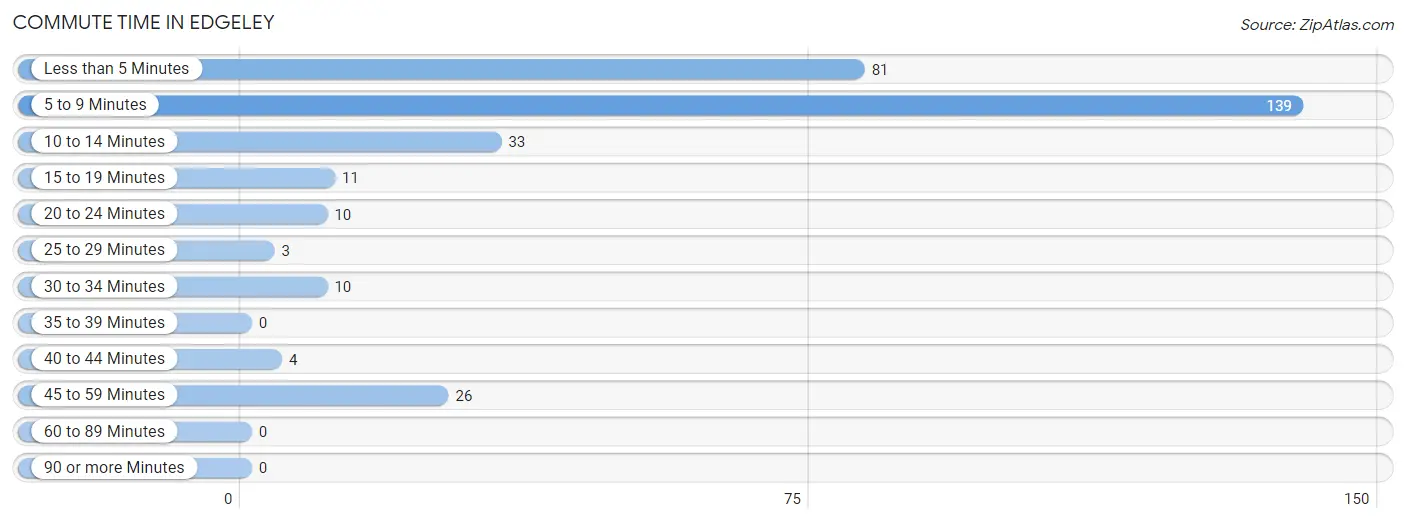
The most frequently occuring commute durations in Edgeley are 5 to 9 minutes (139 commuters, 43.9%), less than 5 minutes (81 commuters, 25.6%), and 10 to 14 minutes (33 commuters, 10.4%).
| Commute Time | # Commuters | % Commuters |
| Less than 5 Minutes | 81 | 25.6% |
| 5 to 9 Minutes | 139 | 43.9% |
| 10 to 14 Minutes | 33 | 10.4% |
| 15 to 19 Minutes | 11 | 3.5% |
| 20 to 24 Minutes | 10 | 3.2% |
| 25 to 29 Minutes | 3 | 0.9% |
| 30 to 34 Minutes | 10 | 3.2% |
| 35 to 39 Minutes | 0 | 0.0% |
| 40 to 44 Minutes | 4 | 1.3% |
| 45 to 59 Minutes | 26 | 8.2% |
| 60 to 89 Minutes | 0 | 0.0% |
| 90 or more Minutes | 0 | 0.0% |
Commute Time by Sex in Edgeley
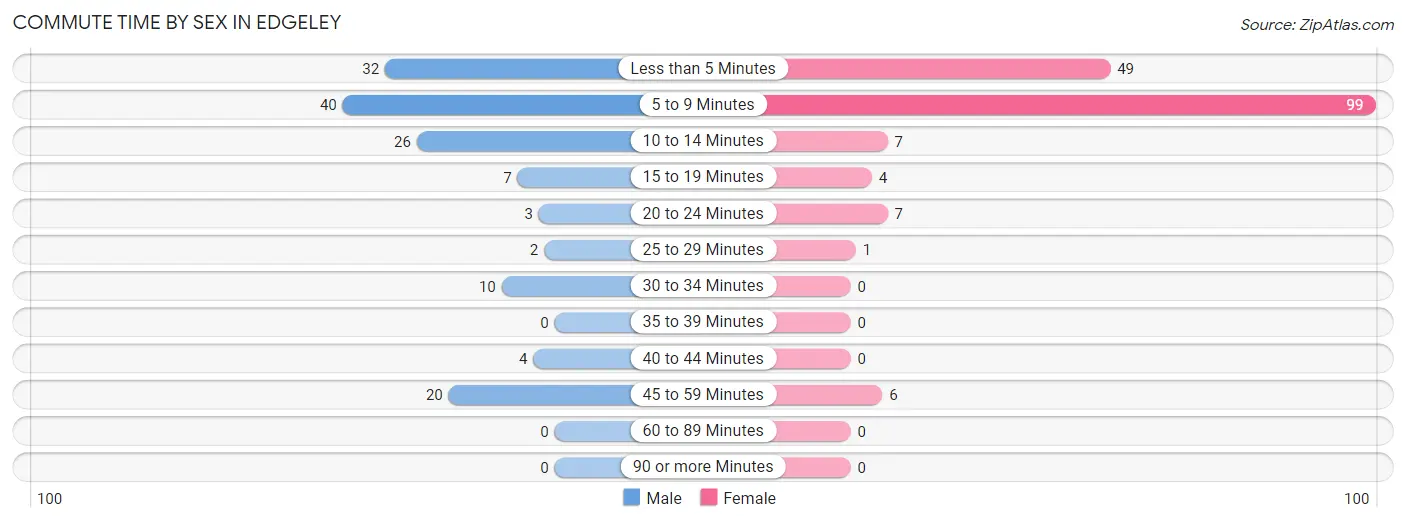
The most common commute times in Edgeley are 5 to 9 minutes (40 commuters, 27.8%) for males and 5 to 9 minutes (99 commuters, 57.2%) for females.
| Commute Time | Male | Female |
| Less than 5 Minutes | 32 (22.2%) | 49 (28.3%) |
| 5 to 9 Minutes | 40 (27.8%) | 99 (57.2%) |
| 10 to 14 Minutes | 26 (18.1%) | 7 (4.1%) |
| 15 to 19 Minutes | 7 (4.9%) | 4 (2.3%) |
| 20 to 24 Minutes | 3 (2.1%) | 7 (4.1%) |
| 25 to 29 Minutes | 2 (1.4%) | 1 (0.6%) |
| 30 to 34 Minutes | 10 (6.9%) | 0 (0.0%) |
| 35 to 39 Minutes | 0 (0.0%) | 0 (0.0%) |
| 40 to 44 Minutes | 4 (2.8%) | 0 (0.0%) |
| 45 to 59 Minutes | 20 (13.9%) | 6 (3.5%) |
| 60 to 89 Minutes | 0 (0.0%) | 0 (0.0%) |
| 90 or more Minutes | 0 (0.0%) | 0 (0.0%) |
Time of Departure to Work by Sex in Edgeley
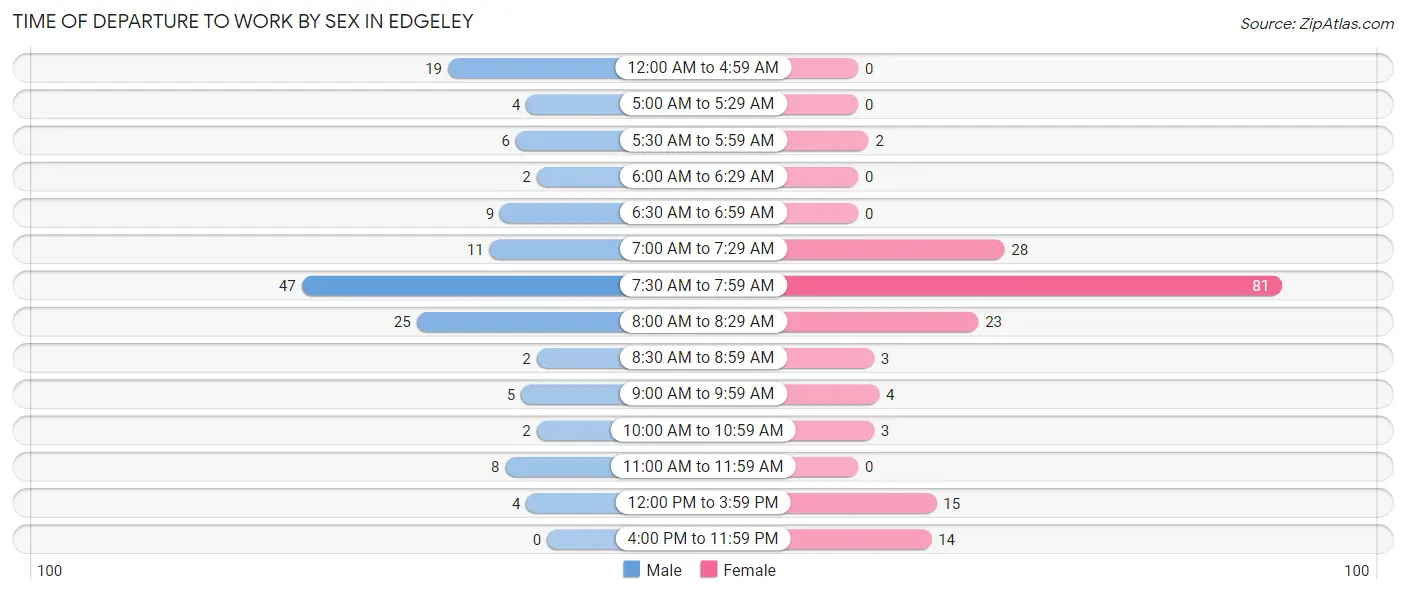
The most frequent times of departure to work in Edgeley are 7:30 AM to 7:59 AM (47, 32.6%) for males and 7:30 AM to 7:59 AM (81, 46.8%) for females.
| Time of Departure | Male | Female |
| 12:00 AM to 4:59 AM | 19 (13.2%) | 0 (0.0%) |
| 5:00 AM to 5:29 AM | 4 (2.8%) | 0 (0.0%) |
| 5:30 AM to 5:59 AM | 6 (4.2%) | 2 (1.2%) |
| 6:00 AM to 6:29 AM | 2 (1.4%) | 0 (0.0%) |
| 6:30 AM to 6:59 AM | 9 (6.2%) | 0 (0.0%) |
| 7:00 AM to 7:29 AM | 11 (7.6%) | 28 (16.2%) |
| 7:30 AM to 7:59 AM | 47 (32.6%) | 81 (46.8%) |
| 8:00 AM to 8:29 AM | 25 (17.4%) | 23 (13.3%) |
| 8:30 AM to 8:59 AM | 2 (1.4%) | 3 (1.7%) |
| 9:00 AM to 9:59 AM | 5 (3.5%) | 4 (2.3%) |
| 10:00 AM to 10:59 AM | 2 (1.4%) | 3 (1.7%) |
| 11:00 AM to 11:59 AM | 8 (5.6%) | 0 (0.0%) |
| 12:00 PM to 3:59 PM | 4 (2.8%) | 15 (8.7%) |
| 4:00 PM to 11:59 PM | 0 (0.0%) | 14 (8.1%) |
| Total | 144 (100.0%) | 173 (100.0%) |
Housing Occupancy in Edgeley
Occupancy by Ownership in Edgeley
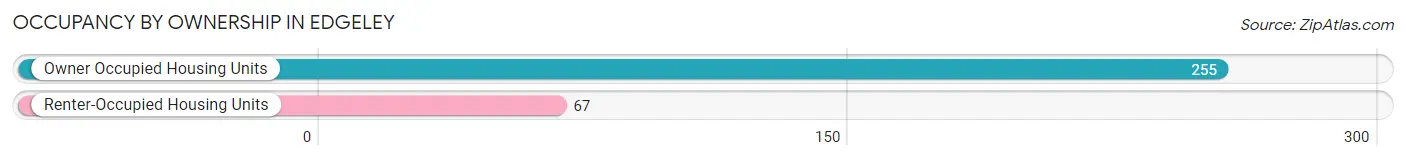
Of the total 322 dwellings in Edgeley, owner-occupied units account for 255 (79.2%), while renter-occupied units make up 67 (20.8%).
| Occupancy | # Housing Units | % Housing Units |
| Owner Occupied Housing Units | 255 | 79.2% |
| Renter-Occupied Housing Units | 67 | 20.8% |
| Total Occupied Housing Units | 322 | 100.0% |
Occupancy by Household Size in Edgeley
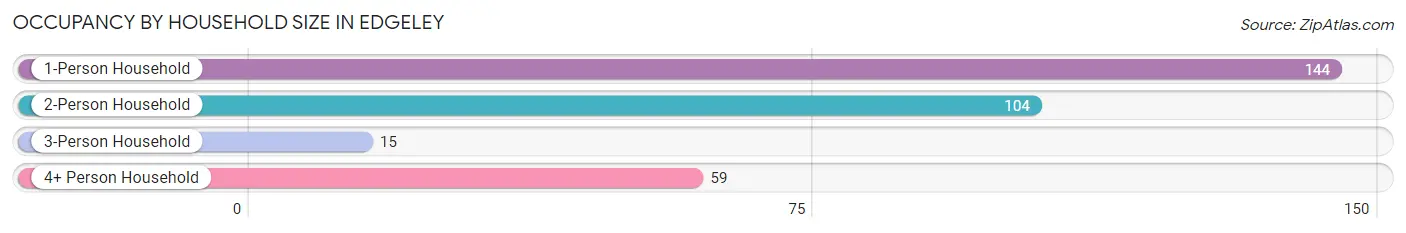
| Household Size | # Housing Units | % Housing Units |
| 1-Person Household | 144 | 44.7% |
| 2-Person Household | 104 | 32.3% |
| 3-Person Household | 15 | 4.7% |
| 4+ Person Household | 59 | 18.3% |
| Total Housing Units | 322 | 100.0% |
Occupancy by Ownership by Household Size in Edgeley
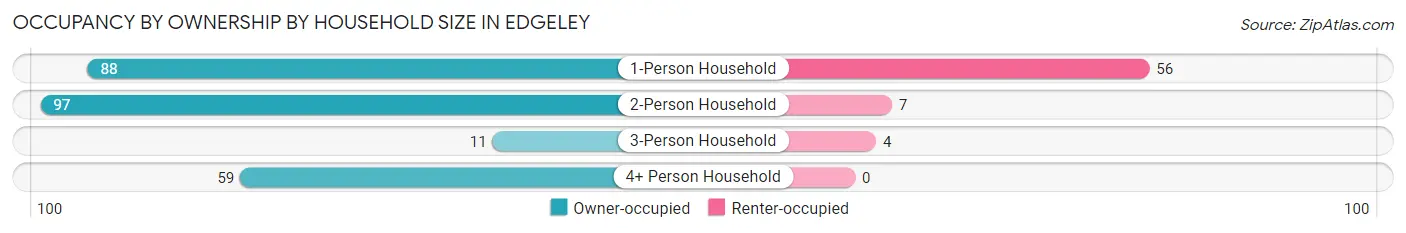
| Household Size | Owner-occupied | Renter-occupied |
| 1-Person Household | 88 (61.1%) | 56 (38.9%) |
| 2-Person Household | 97 (93.3%) | 7 (6.7%) |
| 3-Person Household | 11 (73.3%) | 4 (26.7%) |
| 4+ Person Household | 59 (100.0%) | 0 (0.0%) |
| Total Housing Units | 255 (79.2%) | 67 (20.8%) |
Occupancy by Educational Attainment in Edgeley
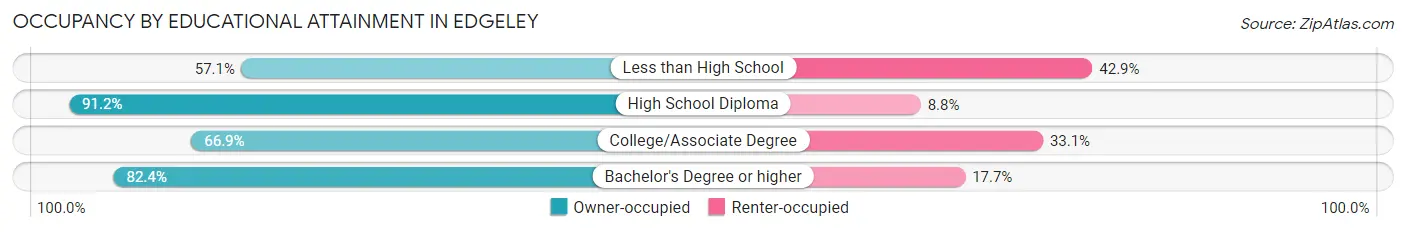
| Household Size | Owner-occupied | Renter-occupied |
| Less than High School | 8 (57.1%) | 6 (42.9%) |
| High School Diploma | 134 (91.2%) | 13 (8.8%) |
| College/Associate Degree | 85 (66.9%) | 42 (33.1%) |
| Bachelor's Degree or higher | 28 (82.4%) | 6 (17.6%) |
Occupancy by Age of Householder in Edgeley
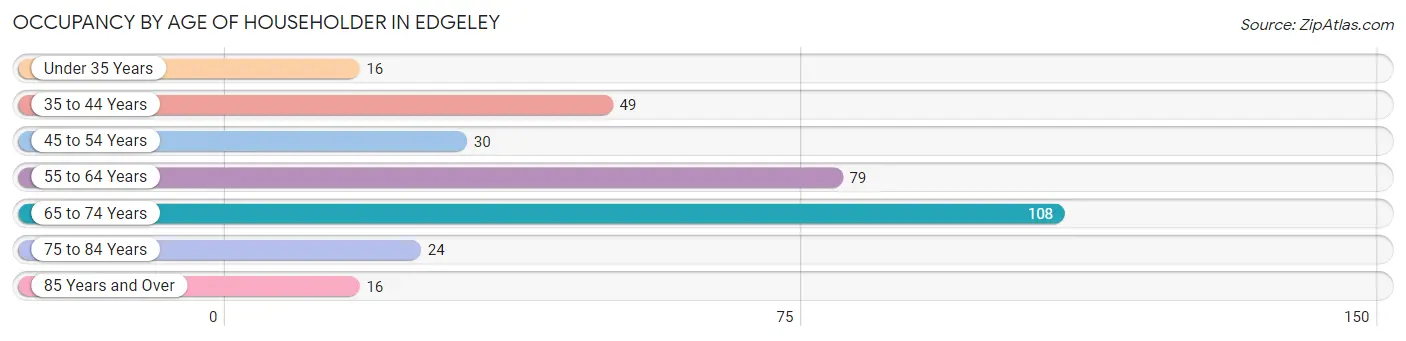
| Age Bracket | # Households | % Households |
| Under 35 Years | 16 | 5.0% |
| 35 to 44 Years | 49 | 15.2% |
| 45 to 54 Years | 30 | 9.3% |
| 55 to 64 Years | 79 | 24.5% |
| 65 to 74 Years | 108 | 33.5% |
| 75 to 84 Years | 24 | 7.4% |
| 85 Years and Over | 16 | 5.0% |
| Total | 322 | 100.0% |
Housing Finances in Edgeley
Median Income by Occupancy in Edgeley
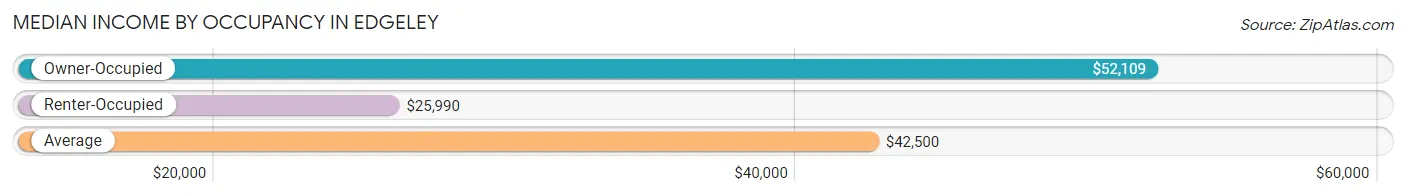
| Occupancy Type | # Households | Median Income |
| Owner-Occupied | 255 (79.2%) | $52,109 |
| Renter-Occupied | 67 (20.8%) | $25,990 |
| Average | 322 (100.0%) | $42,500 |
Occupancy by Householder Income Bracket in Edgeley
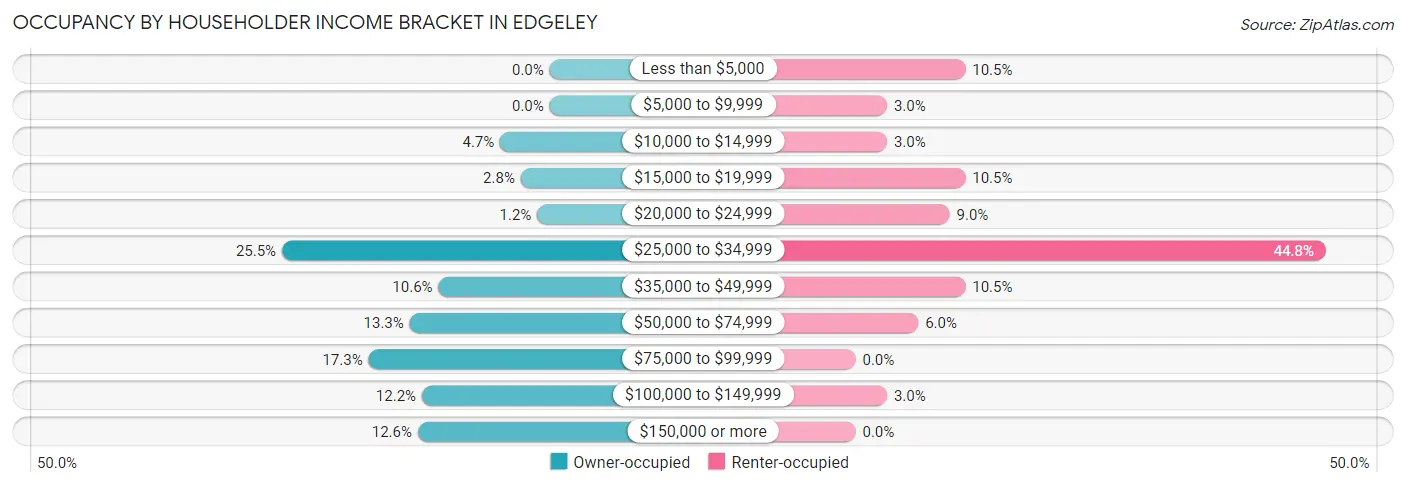
| Income Bracket | Owner-occupied | Renter-occupied |
| Less than $5,000 | 0 (0.0%) | 7 (10.4%) |
| $5,000 to $9,999 | 0 (0.0%) | 2 (3.0%) |
| $10,000 to $14,999 | 12 (4.7%) | 2 (3.0%) |
| $15,000 to $19,999 | 7 (2.8%) | 7 (10.4%) |
| $20,000 to $24,999 | 3 (1.2%) | 6 (9.0%) |
| $25,000 to $34,999 | 65 (25.5%) | 30 (44.8%) |
| $35,000 to $49,999 | 27 (10.6%) | 7 (10.4%) |
| $50,000 to $74,999 | 34 (13.3%) | 4 (6.0%) |
| $75,000 to $99,999 | 44 (17.2%) | 0 (0.0%) |
| $100,000 to $149,999 | 31 (12.2%) | 2 (3.0%) |
| $150,000 or more | 32 (12.6%) | 0 (0.0%) |
| Total | 255 (100.0%) | 67 (100.0%) |
Monthly Housing Cost Tiers in Edgeley
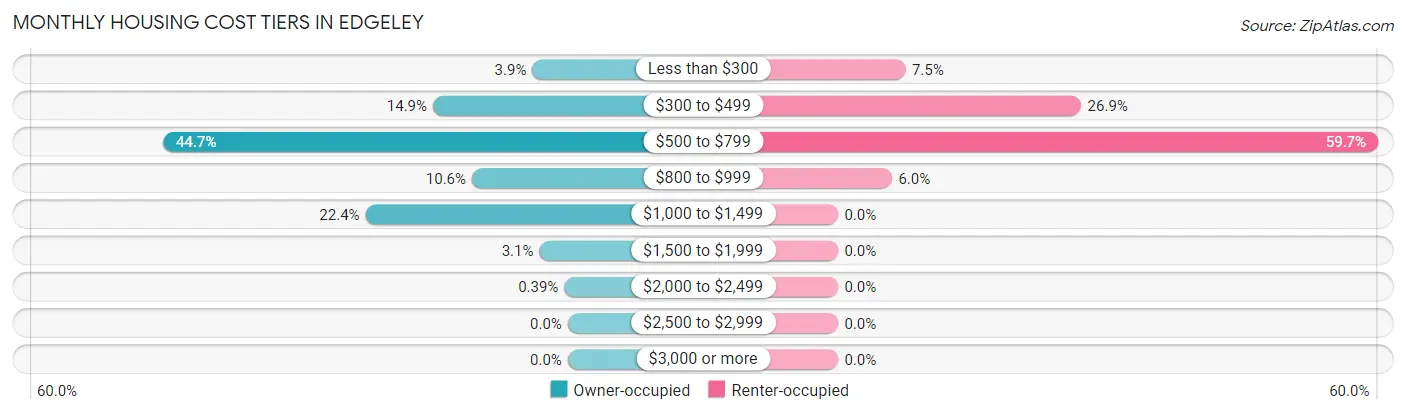
| Monthly Cost | Owner-occupied | Renter-occupied |
| Less than $300 | 10 (3.9%) | 5 (7.5%) |
| $300 to $499 | 38 (14.9%) | 18 (26.9%) |
| $500 to $799 | 114 (44.7%) | 40 (59.7%) |
| $800 to $999 | 27 (10.6%) | 4 (6.0%) |
| $1,000 to $1,499 | 57 (22.4%) | 0 (0.0%) |
| $1,500 to $1,999 | 8 (3.1%) | 0 (0.0%) |
| $2,000 to $2,499 | 1 (0.4%) | 0 (0.0%) |
| $2,500 to $2,999 | 0 (0.0%) | 0 (0.0%) |
| $3,000 or more | 0 (0.0%) | 0 (0.0%) |
| Total | 255 (100.0%) | 67 (100.0%) |
Physical Housing Characteristics in Edgeley
Housing Structures in Edgeley
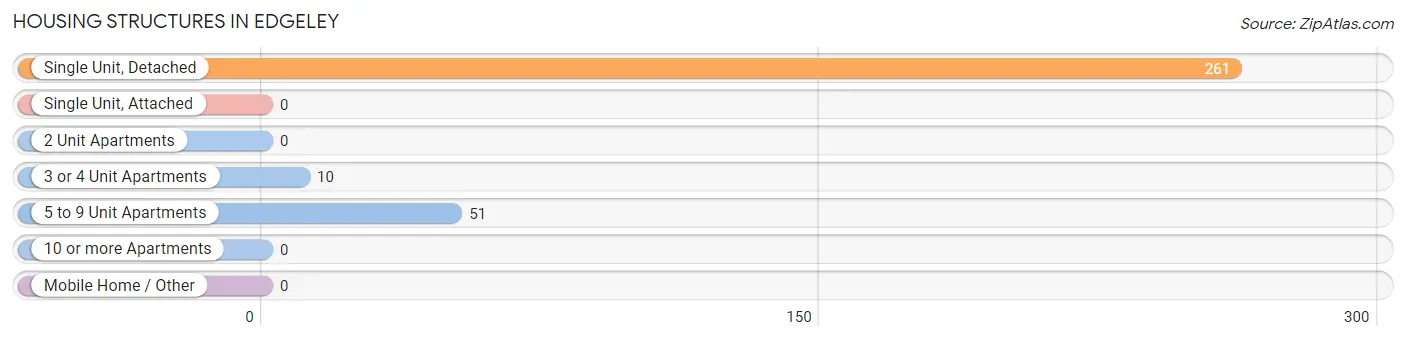
| Structure Type | # Housing Units | % Housing Units |
| Single Unit, Detached | 261 | 81.1% |
| Single Unit, Attached | 0 | 0.0% |
| 2 Unit Apartments | 0 | 0.0% |
| 3 or 4 Unit Apartments | 10 | 3.1% |
| 5 to 9 Unit Apartments | 51 | 15.8% |
| 10 or more Apartments | 0 | 0.0% |
| Mobile Home / Other | 0 | 0.0% |
| Total | 322 | 100.0% |
Housing Structures by Occupancy in Edgeley
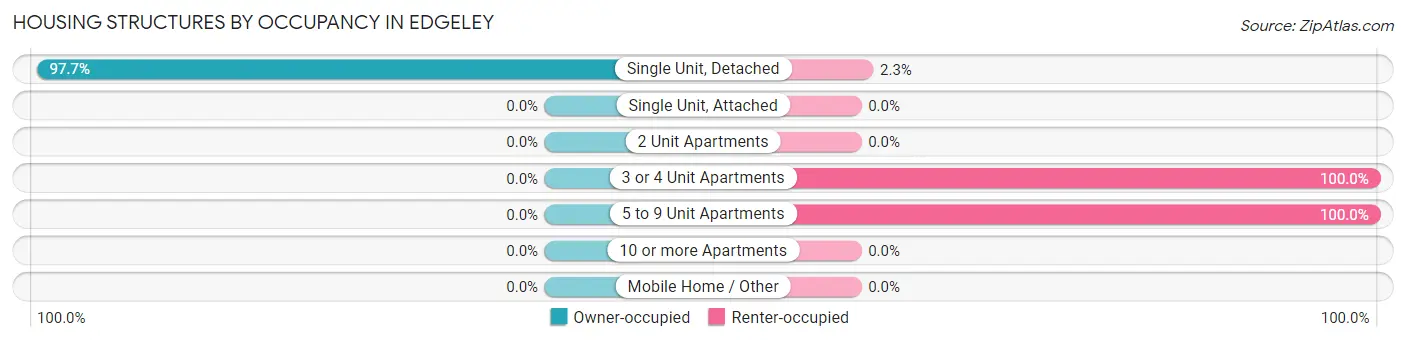
| Structure Type | Owner-occupied | Renter-occupied |
| Single Unit, Detached | 255 (97.7%) | 6 (2.3%) |
| Single Unit, Attached | 0 (0.0%) | 0 (0.0%) |
| 2 Unit Apartments | 0 (0.0%) | 0 (0.0%) |
| 3 or 4 Unit Apartments | 0 (0.0%) | 10 (100.0%) |
| 5 to 9 Unit Apartments | 0 (0.0%) | 51 (100.0%) |
| 10 or more Apartments | 0 (0.0%) | 0 (0.0%) |
| Mobile Home / Other | 0 (0.0%) | 0 (0.0%) |
| Total | 255 (79.2%) | 67 (20.8%) |
Housing Structures by Number of Rooms in Edgeley
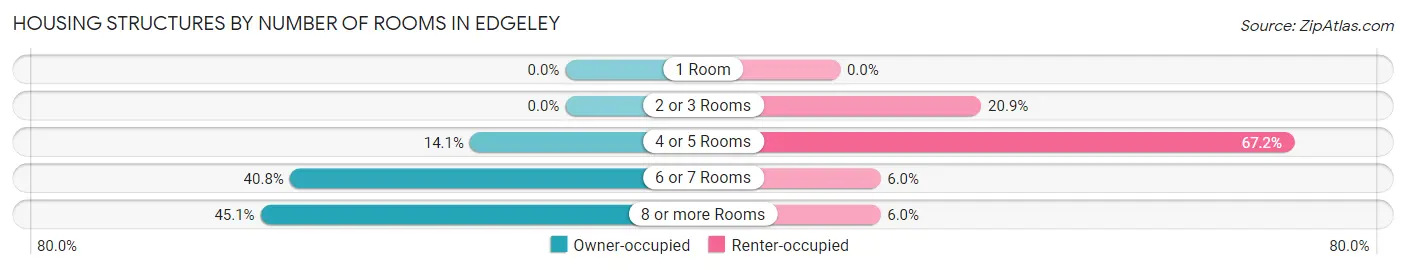
| Number of Rooms | Owner-occupied | Renter-occupied |
| 1 Room | 0 (0.0%) | 0 (0.0%) |
| 2 or 3 Rooms | 0 (0.0%) | 14 (20.9%) |
| 4 or 5 Rooms | 36 (14.1%) | 45 (67.2%) |
| 6 or 7 Rooms | 104 (40.8%) | 4 (6.0%) |
| 8 or more Rooms | 115 (45.1%) | 4 (6.0%) |
| Total | 255 (100.0%) | 67 (100.0%) |
Housing Structure by Heating Type in Edgeley
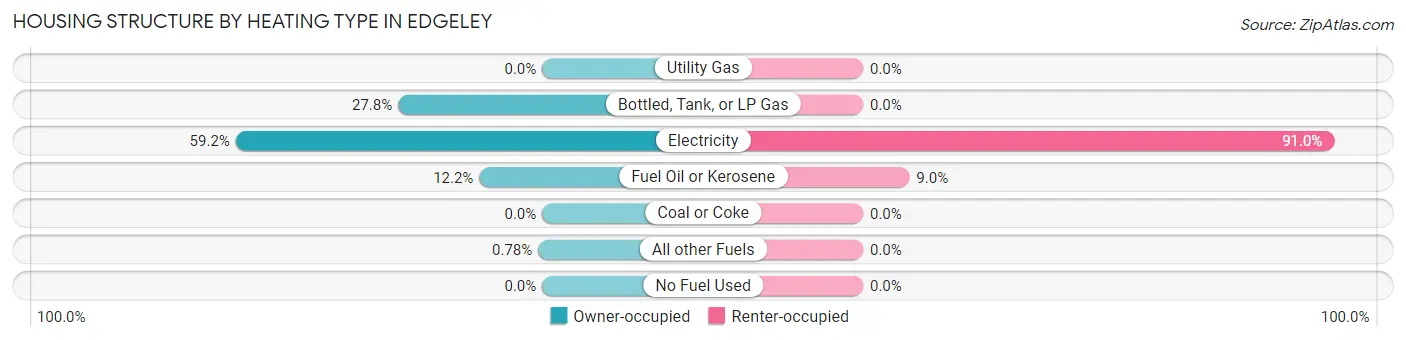
| Heating Type | Owner-occupied | Renter-occupied |
| Utility Gas | 0 (0.0%) | 0 (0.0%) |
| Bottled, Tank, or LP Gas | 71 (27.8%) | 0 (0.0%) |
| Electricity | 151 (59.2%) | 61 (91.0%) |
| Fuel Oil or Kerosene | 31 (12.2%) | 6 (9.0%) |
| Coal or Coke | 0 (0.0%) | 0 (0.0%) |
| All other Fuels | 2 (0.8%) | 0 (0.0%) |
| No Fuel Used | 0 (0.0%) | 0 (0.0%) |
| Total | 255 (100.0%) | 67 (100.0%) |
Household Vehicle Usage in Edgeley
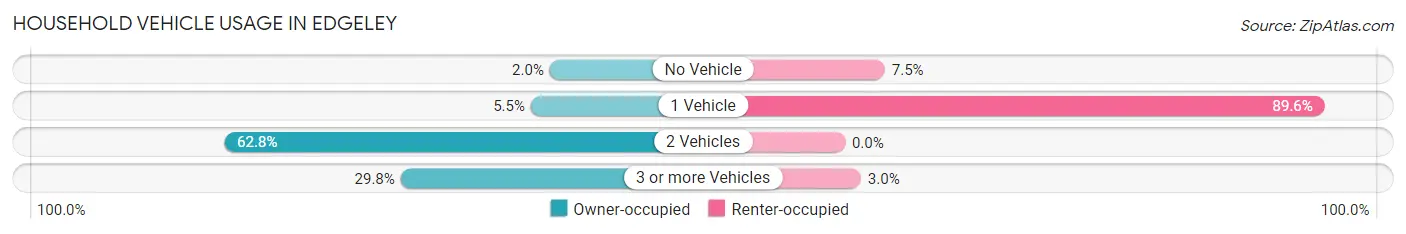
| Vehicles per Household | Owner-occupied | Renter-occupied |
| No Vehicle | 5 (2.0%) | 5 (7.5%) |
| 1 Vehicle | 14 (5.5%) | 60 (89.5%) |
| 2 Vehicles | 160 (62.7%) | 0 (0.0%) |
| 3 or more Vehicles | 76 (29.8%) | 2 (3.0%) |
| Total | 255 (100.0%) | 67 (100.0%) |
Real Estate & Mortgages in Edgeley
Real Estate and Mortgage Overview in Edgeley
| Characteristic | Without Mortgage | With Mortgage |
| Housing Units | 164 | 91 |
| Median Property Value | $97,400 | $115,200 |
| Median Household Income | $42,813 | $18 |
| Monthly Housing Costs | $545 | $0 |
| Real Estate Taxes | $1,206 | $13 |
Property Value by Mortgage Status in Edgeley
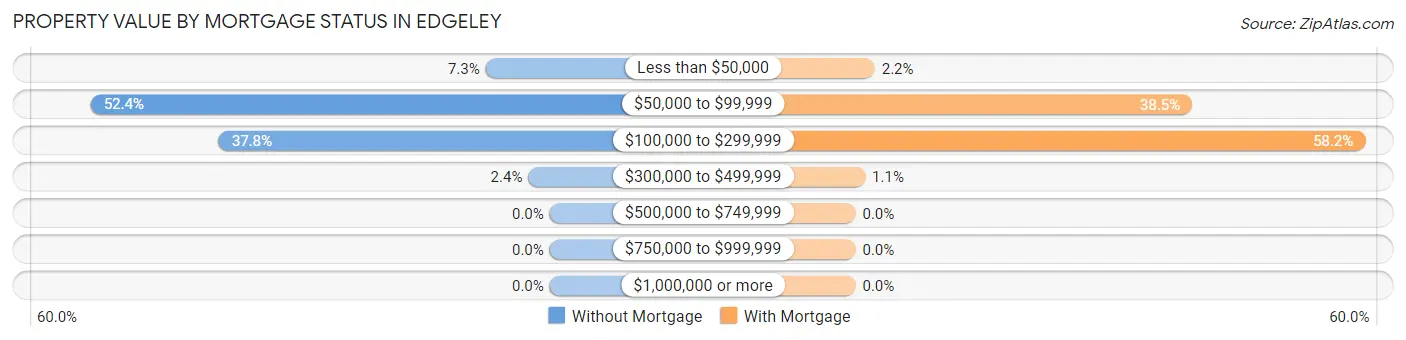
| Property Value | Without Mortgage | With Mortgage |
| Less than $50,000 | 12 (7.3%) | 2 (2.2%) |
| $50,000 to $99,999 | 86 (52.4%) | 35 (38.5%) |
| $100,000 to $299,999 | 62 (37.8%) | 53 (58.2%) |
| $300,000 to $499,999 | 4 (2.4%) | 1 (1.1%) |
| $500,000 to $749,999 | 0 (0.0%) | 0 (0.0%) |
| $750,000 to $999,999 | 0 (0.0%) | 0 (0.0%) |
| $1,000,000 or more | 0 (0.0%) | 0 (0.0%) |
| Total | 164 (100.0%) | 91 (100.0%) |
Household Income by Mortgage Status in Edgeley
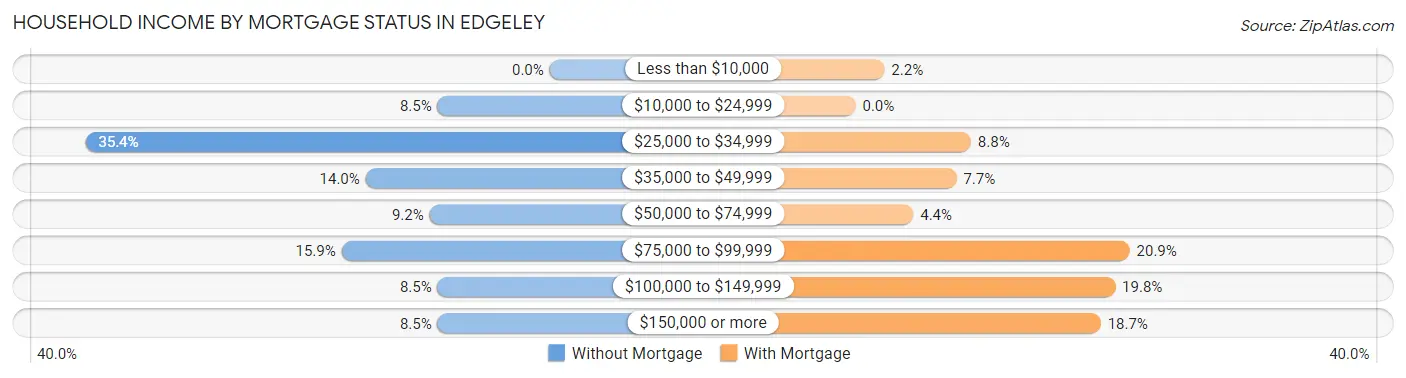
| Household Income | Without Mortgage | With Mortgage |
| Less than $10,000 | 0 (0.0%) | 2 (2.2%) |
| $10,000 to $24,999 | 14 (8.5%) | 0 (0.0%) |
| $25,000 to $34,999 | 58 (35.4%) | 8 (8.8%) |
| $35,000 to $49,999 | 23 (14.0%) | 7 (7.7%) |
| $50,000 to $74,999 | 15 (9.1%) | 4 (4.4%) |
| $75,000 to $99,999 | 26 (15.9%) | 19 (20.9%) |
| $100,000 to $149,999 | 14 (8.5%) | 18 (19.8%) |
| $150,000 or more | 14 (8.5%) | 17 (18.7%) |
| Total | 164 (100.0%) | 91 (100.0%) |
Property Value to Household Income Ratio in Edgeley
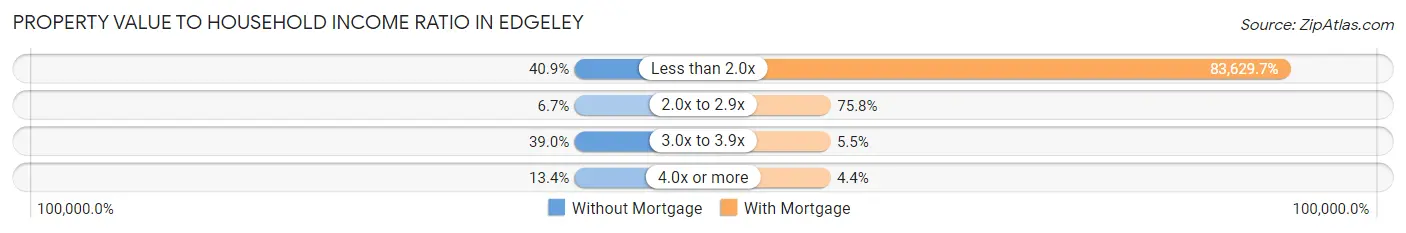
| Value-to-Income Ratio | Without Mortgage | With Mortgage |
| Less than 2.0x | 67 (40.8%) | 76,103 (83,629.7%) |
| 2.0x to 2.9x | 11 (6.7%) | 69 (75.8%) |
| 3.0x to 3.9x | 64 (39.0%) | 5 (5.5%) |
| 4.0x or more | 22 (13.4%) | 4 (4.4%) |
| Total | 164 (100.0%) | 91 (100.0%) |
Real Estate Taxes by Mortgage Status in Edgeley
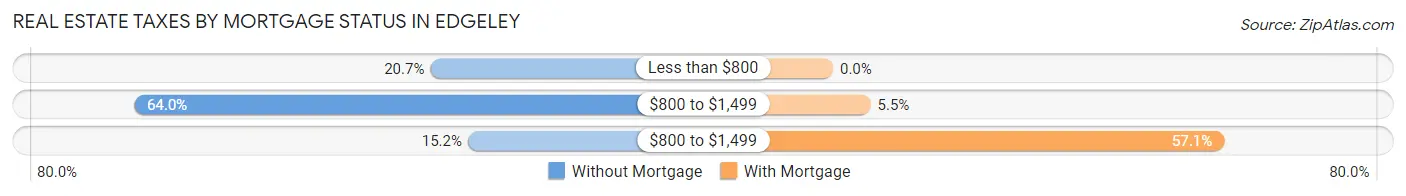
| Property Taxes | Without Mortgage | With Mortgage |
| Less than $800 | 34 (20.7%) | 0 (0.0%) |
| $800 to $1,499 | 105 (64.0%) | 5 (5.5%) |
| $800 to $1,499 | 25 (15.2%) | 52 (57.1%) |
| Total | 164 (100.0%) | 91 (100.0%) |
Health & Disability in Edgeley
Health Insurance Coverage by Age in Edgeley
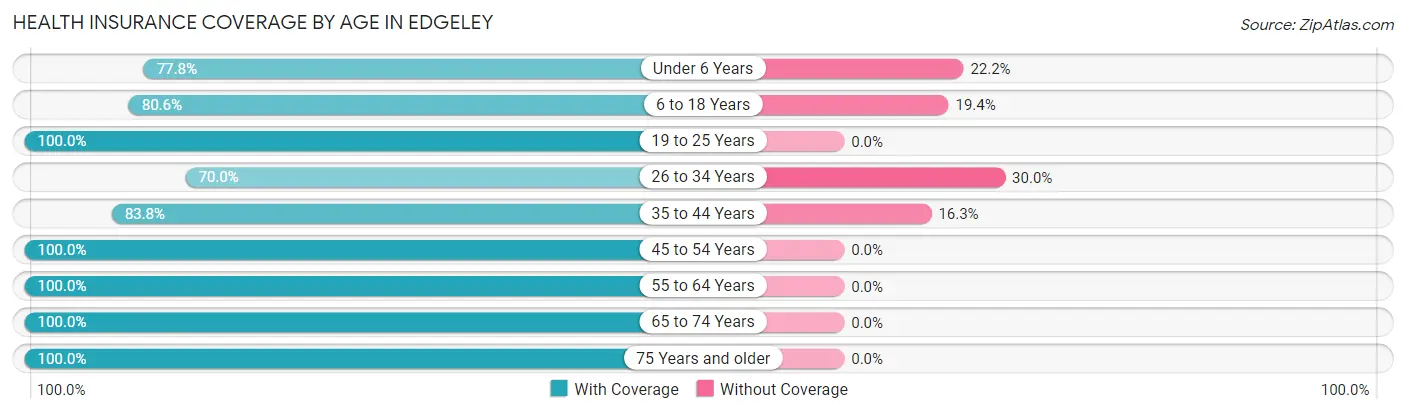
| Age Bracket | With Coverage | Without Coverage |
| Under 6 Years | 56 (77.8%) | 16 (22.2%) |
| 6 to 18 Years | 58 (80.6%) | 14 (19.4%) |
| 19 to 25 Years | 6 (100.0%) | 0 (0.0%) |
| 26 to 34 Years | 35 (70.0%) | 15 (30.0%) |
| 35 to 44 Years | 67 (83.8%) | 13 (16.3%) |
| 45 to 54 Years | 46 (100.0%) | 0 (0.0%) |
| 55 to 64 Years | 128 (100.0%) | 0 (0.0%) |
| 65 to 74 Years | 136 (100.0%) | 0 (0.0%) |
| 75 Years and older | 61 (100.0%) | 0 (0.0%) |
| Total | 593 (91.1%) | 58 (8.9%) |
Health Insurance Coverage by Citizenship Status in Edgeley
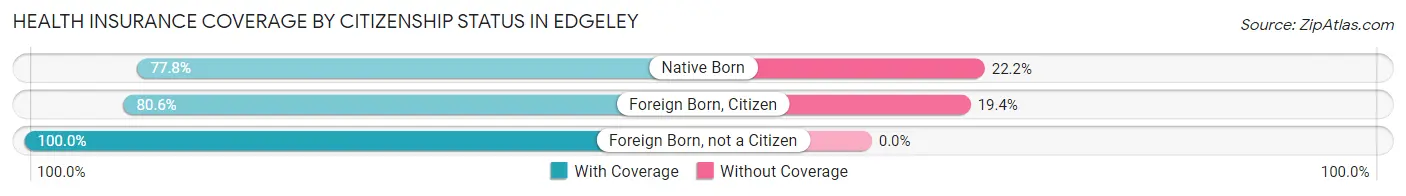
| Citizenship Status | With Coverage | Without Coverage |
| Native Born | 56 (77.8%) | 16 (22.2%) |
| Foreign Born, Citizen | 58 (80.6%) | 14 (19.4%) |
| Foreign Born, not a Citizen | 6 (100.0%) | 0 (0.0%) |
Health Insurance Coverage by Household Income in Edgeley
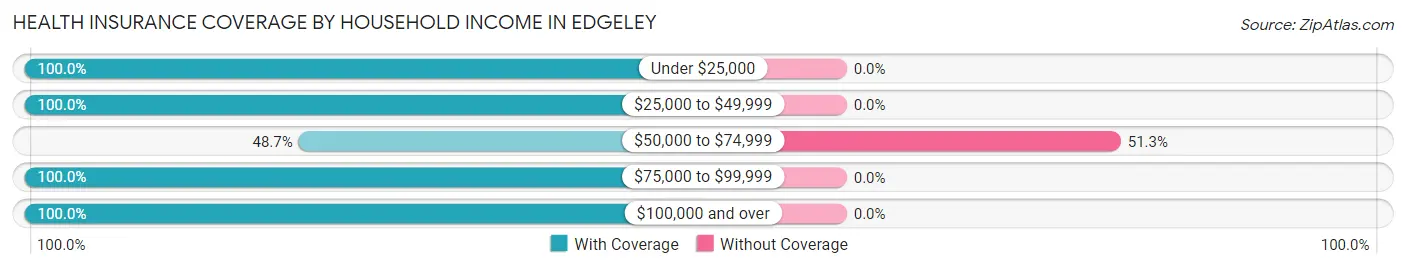
| Household Income | With Coverage | Without Coverage |
| Under $25,000 | 67 (100.0%) | 0 (0.0%) |
| $25,000 to $49,999 | 207 (100.0%) | 0 (0.0%) |
| $50,000 to $74,999 | 55 (48.7%) | 58 (51.3%) |
| $75,000 to $99,999 | 67 (100.0%) | 0 (0.0%) |
| $100,000 and over | 197 (100.0%) | 0 (0.0%) |
Public vs Private Health Insurance Coverage by Age in Edgeley
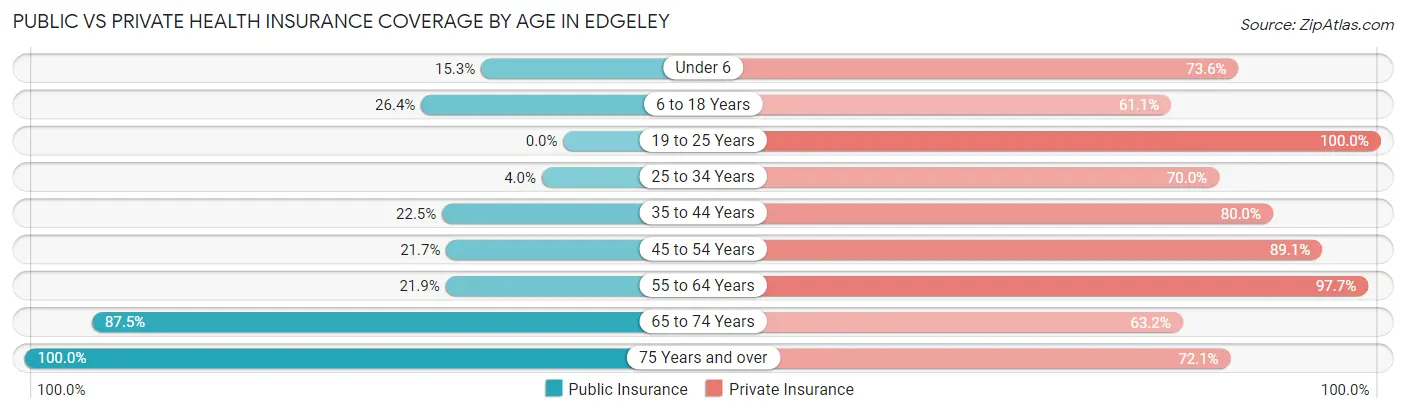
| Age Bracket | Public Insurance | Private Insurance |
| Under 6 | 11 (15.3%) | 53 (73.6%) |
| 6 to 18 Years | 19 (26.4%) | 44 (61.1%) |
| 19 to 25 Years | 0 (0.0%) | 6 (100.0%) |
| 25 to 34 Years | 2 (4.0%) | 35 (70.0%) |
| 35 to 44 Years | 18 (22.5%) | 64 (80.0%) |
| 45 to 54 Years | 10 (21.7%) | 41 (89.1%) |
| 55 to 64 Years | 28 (21.9%) | 125 (97.7%) |
| 65 to 74 Years | 119 (87.5%) | 86 (63.2%) |
| 75 Years and over | 61 (100.0%) | 44 (72.1%) |
| Total | 268 (41.2%) | 498 (76.5%) |
Disability Status by Sex by Age in Edgeley
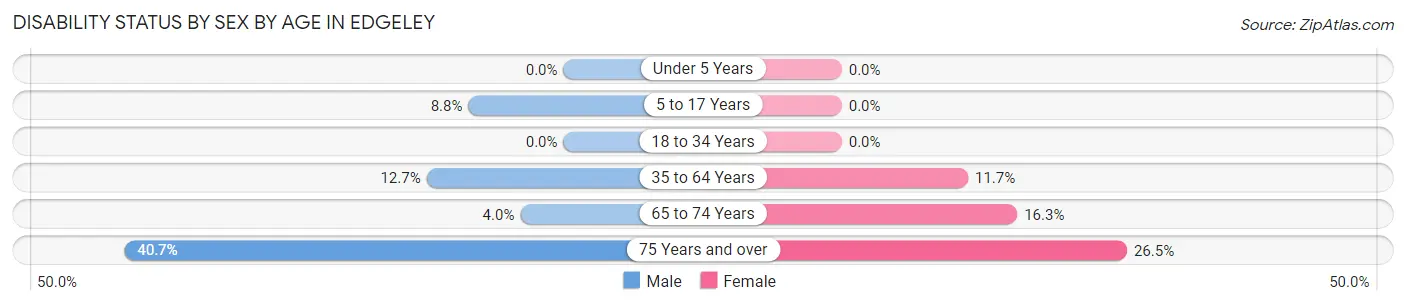
| Age Bracket | Male | Female |
| Under 5 Years | 0 (0.0%) | 0 (0.0%) |
| 5 to 17 Years | 3 (8.8%) | 0 (0.0%) |
| 18 to 34 Years | 0 (0.0%) | 0 (0.0%) |
| 35 to 64 Years | 16 (12.7%) | 15 (11.7%) |
| 65 to 74 Years | 2 (4.0%) | 14 (16.3%) |
| 75 Years and over | 11 (40.7%) | 9 (26.5%) |
Disability Class by Sex by Age in Edgeley
Disability Class: Hearing Difficulty
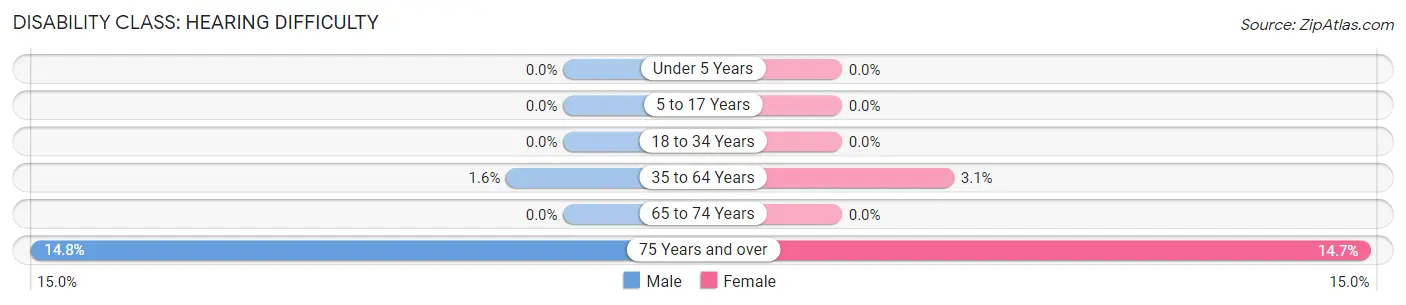
| Age Bracket | Male | Female |
| Under 5 Years | 0 (0.0%) | 0 (0.0%) |
| 5 to 17 Years | 0 (0.0%) | 0 (0.0%) |
| 18 to 34 Years | 0 (0.0%) | 0 (0.0%) |
| 35 to 64 Years | 2 (1.6%) | 4 (3.1%) |
| 65 to 74 Years | 0 (0.0%) | 0 (0.0%) |
| 75 Years and over | 4 (14.8%) | 5 (14.7%) |
Disability Class: Vision Difficulty
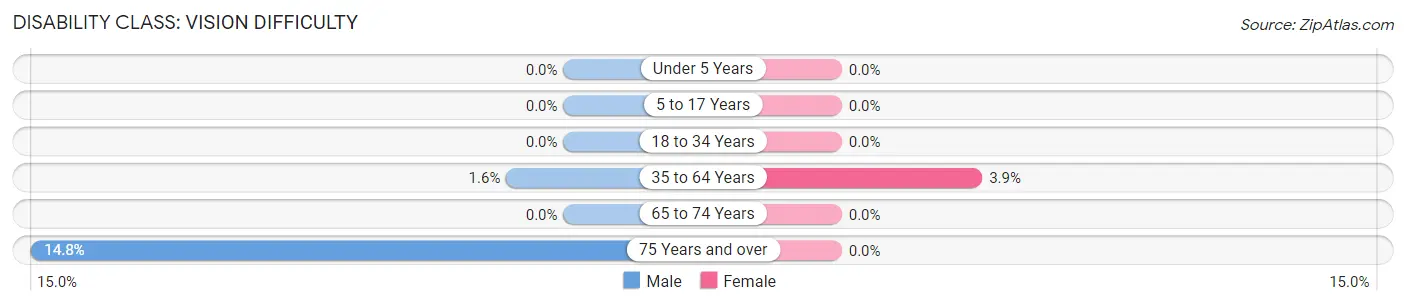
| Age Bracket | Male | Female |
| Under 5 Years | 0 (0.0%) | 0 (0.0%) |
| 5 to 17 Years | 0 (0.0%) | 0 (0.0%) |
| 18 to 34 Years | 0 (0.0%) | 0 (0.0%) |
| 35 to 64 Years | 2 (1.6%) | 5 (3.9%) |
| 65 to 74 Years | 0 (0.0%) | 0 (0.0%) |
| 75 Years and over | 4 (14.8%) | 0 (0.0%) |
Disability Class: Cognitive Difficulty
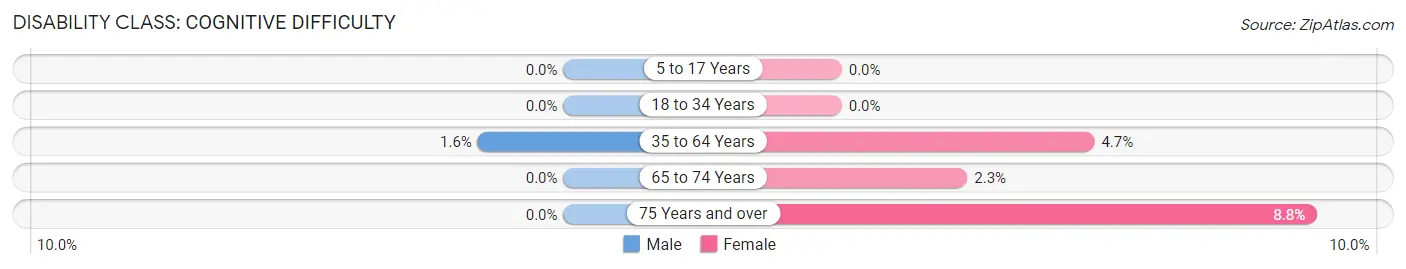
| Age Bracket | Male | Female |
| 5 to 17 Years | 0 (0.0%) | 0 (0.0%) |
| 18 to 34 Years | 0 (0.0%) | 0 (0.0%) |
| 35 to 64 Years | 2 (1.6%) | 6 (4.7%) |
| 65 to 74 Years | 0 (0.0%) | 2 (2.3%) |
| 75 Years and over | 0 (0.0%) | 3 (8.8%) |
Disability Class: Ambulatory Difficulty
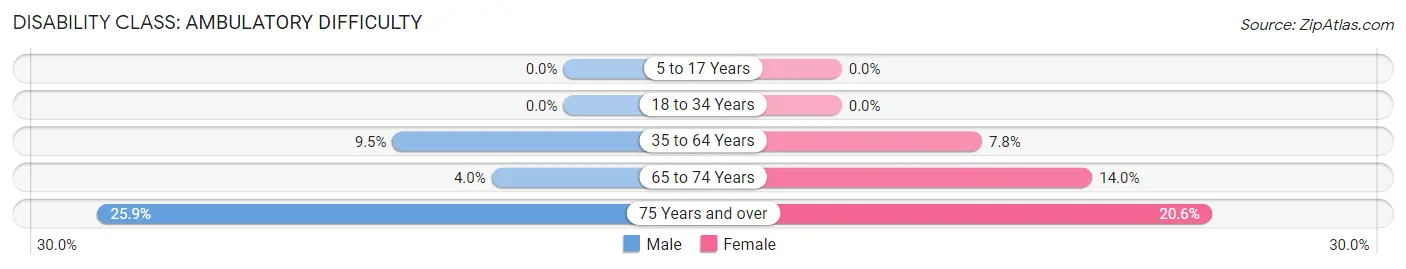
| Age Bracket | Male | Female |
| 5 to 17 Years | 0 (0.0%) | 0 (0.0%) |
| 18 to 34 Years | 0 (0.0%) | 0 (0.0%) |
| 35 to 64 Years | 12 (9.5%) | 10 (7.8%) |
| 65 to 74 Years | 2 (4.0%) | 12 (14.0%) |
| 75 Years and over | 7 (25.9%) | 7 (20.6%) |
Disability Class: Self-Care Difficulty
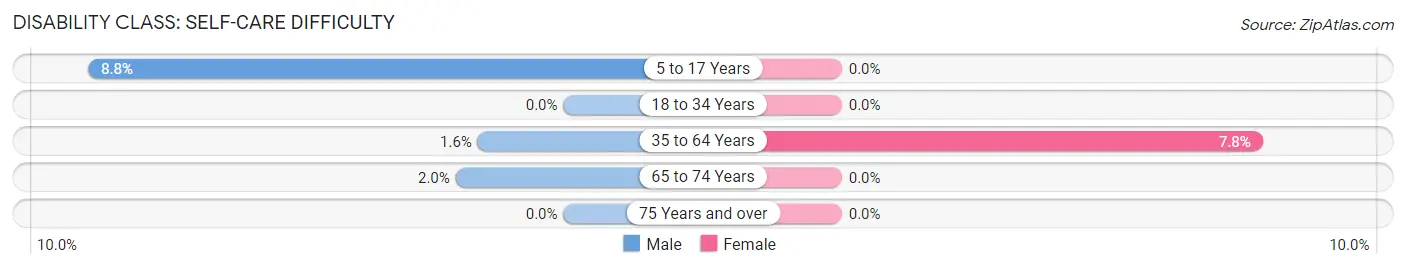
| Age Bracket | Male | Female |
| 5 to 17 Years | 3 (8.8%) | 0 (0.0%) |
| 18 to 34 Years | 0 (0.0%) | 0 (0.0%) |
| 35 to 64 Years | 2 (1.6%) | 10 (7.8%) |
| 65 to 74 Years | 1 (2.0%) | 0 (0.0%) |
| 75 Years and over | 0 (0.0%) | 0 (0.0%) |
Technology Access in Edgeley
Computing Device Access in Edgeley
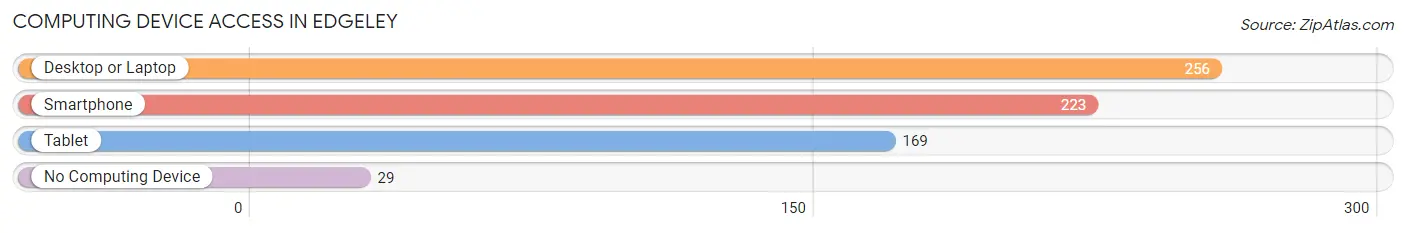
| Device Type | # Households | % Households |
| Desktop or Laptop | 256 | 79.5% |
| Smartphone | 223 | 69.3% |
| Tablet | 169 | 52.5% |
| No Computing Device | 29 | 9.0% |
| Total | 322 | 100.0% |
Internet Access in Edgeley
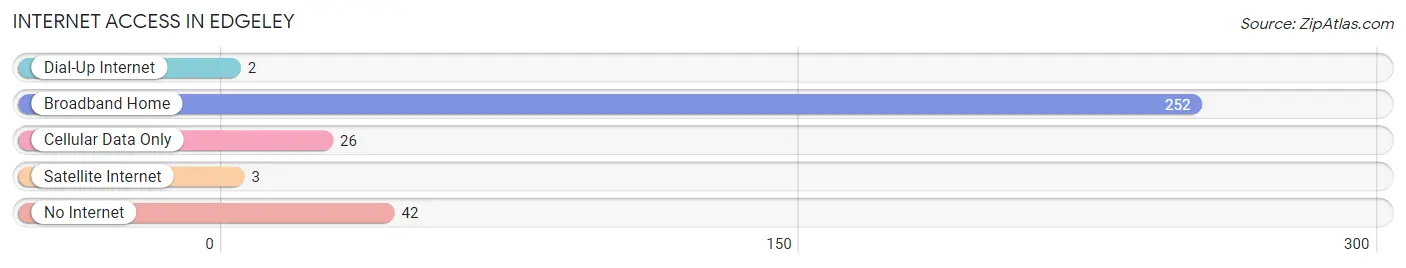
| Internet Type | # Households | % Households |
| Dial-Up Internet | 2 | 0.6% |
| Broadband Home | 252 | 78.3% |
| Cellular Data Only | 26 | 8.1% |
| Satellite Internet | 3 | 0.9% |
| No Internet | 42 | 13.0% |
| Total | 322 | 100.0% |
Edgeley Summary
History
Edgeley is a small town located in LaMoure County, North Dakota. It was founded in 1883 by a group of settlers from Wisconsin. The town was named after a nearby lake, which was named after a local Native American chief. The town was originally a farming community, but it soon became a hub for the railroad industry. The railroad brought in new businesses and people, and the town grew rapidly.
In the early 1900s, Edgeley was a bustling town with a population of over 1,000 people. It had a variety of businesses, including a bank, a hotel, a general store, a lumberyard, and a blacksmith shop. The town also had a school, a post office, and a newspaper.
The town continued to grow and prosper until the Great Depression hit in the 1930s. Many of the businesses closed and the population declined. The town was able to survive, however, and it continued to be a small but vibrant community.
In the 1950s, Edgeley experienced a resurgence. The railroad industry was booming and the town was able to attract new businesses and people. The population grew to over 1,500 people and the town was able to build a new school and a new hospital.
In the late 1970s, the railroad industry began to decline and the town’s population began to decline as well. The town was able to survive, however, and it remains a small but vibrant community today.
Geography
Edgeley is located in the southeastern corner of LaMoure County, North Dakota. It is situated on the banks of the James River, which flows through the town. The town is surrounded by rolling hills and farmland.
The town is located about 30 miles south of Jamestown, the county seat, and about 50 miles west of Fargo, the state’s largest city. Edgeley is also located about 25 miles east of the Minnesota border.
The town has a total area of 1.2 square miles, all of which is land. The town has a humid continental climate, with cold winters and hot summers.
Economy
Edgeley’s economy is largely based on agriculture. The town is home to several farms, which produce a variety of crops, including wheat, corn, soybeans, and sunflowers. The town also has a few small businesses, including a grocery store, a hardware store, and a restaurant.
The town is also home to a few manufacturing companies, which produce a variety of products, including furniture, clothing, and electronics.
Demographics
As of the 2010 census, Edgeley had a population of 1,092 people. The town has a median age of 39.7 years, and the median household income is $41,250. The town is predominantly white, with a small Hispanic population.
Conclusion
Edgeley is a small town located in LaMoure County, North Dakota. It was founded in 1883 and has a population of 1,092 people. The town’s economy is largely based on agriculture, and it also has a few small businesses and manufacturing companies. Edgeley is a small but vibrant community, and it continues to be a great place to live and work.
Common Questions
What is Per Capita Income in Edgeley?
Per Capita income in Edgeley is $30,817.
What is the Median Family Income in Edgeley?
Median Family Income in Edgeley is $78,750.
What is the Median Household income in Edgeley?
Median Household Income in Edgeley is $42,500.
What is Income or Wage Gap in Edgeley?
Income or Wage Gap in Edgeley is 34.3%.
Women in Edgeley earn 65.7 cents for every dollar earned by a man.
What is Family Income Deficit in Edgeley?
Family Income Deficit in Edgeley is $11,440.
Families that are below poverty line in Edgeley earn $11,440 less on average than the poverty threshold level.
What is Inequality or Gini Index in Edgeley?
Inequality or Gini Index in Edgeley is 0.42.
What is the Total Population of Edgeley?
Total Population of Edgeley is 678.
What is the Total Male Population of Edgeley?
Total Male Population of Edgeley is 299.
What is the Total Female Population of Edgeley?
Total Female Population of Edgeley is 379.
What is the Ratio of Males per 100 Females in Edgeley?
There are 78.89 Males per 100 Females in Edgeley.
What is the Ratio of Females per 100 Males in Edgeley?
There are 126.76 Females per 100 Males in Edgeley.
What is the Median Population Age in Edgeley?
Median Population Age in Edgeley is 56.2 Years.
What is the Average Family Size in Edgeley
Average Family Size in Edgeley is 2.9 People.
What is the Average Household Size in Edgeley
Average Household Size in Edgeley is 2.0 People.
How Large is the Labor Force in Edgeley?
There are 332 People in the Labor Forcein in Edgeley.
What is the Percentage of People in the Labor Force in Edgeley?
61.1% of People are in the Labor Force in Edgeley.