Zip Codes with the Highest Percentage of Population Employed in Food Preparation & Serving in Wahpeton, ND
RELATED REPORTS & OPTIONS
Food Preparation & Serving
Wahpeton
Compare Zip Codes
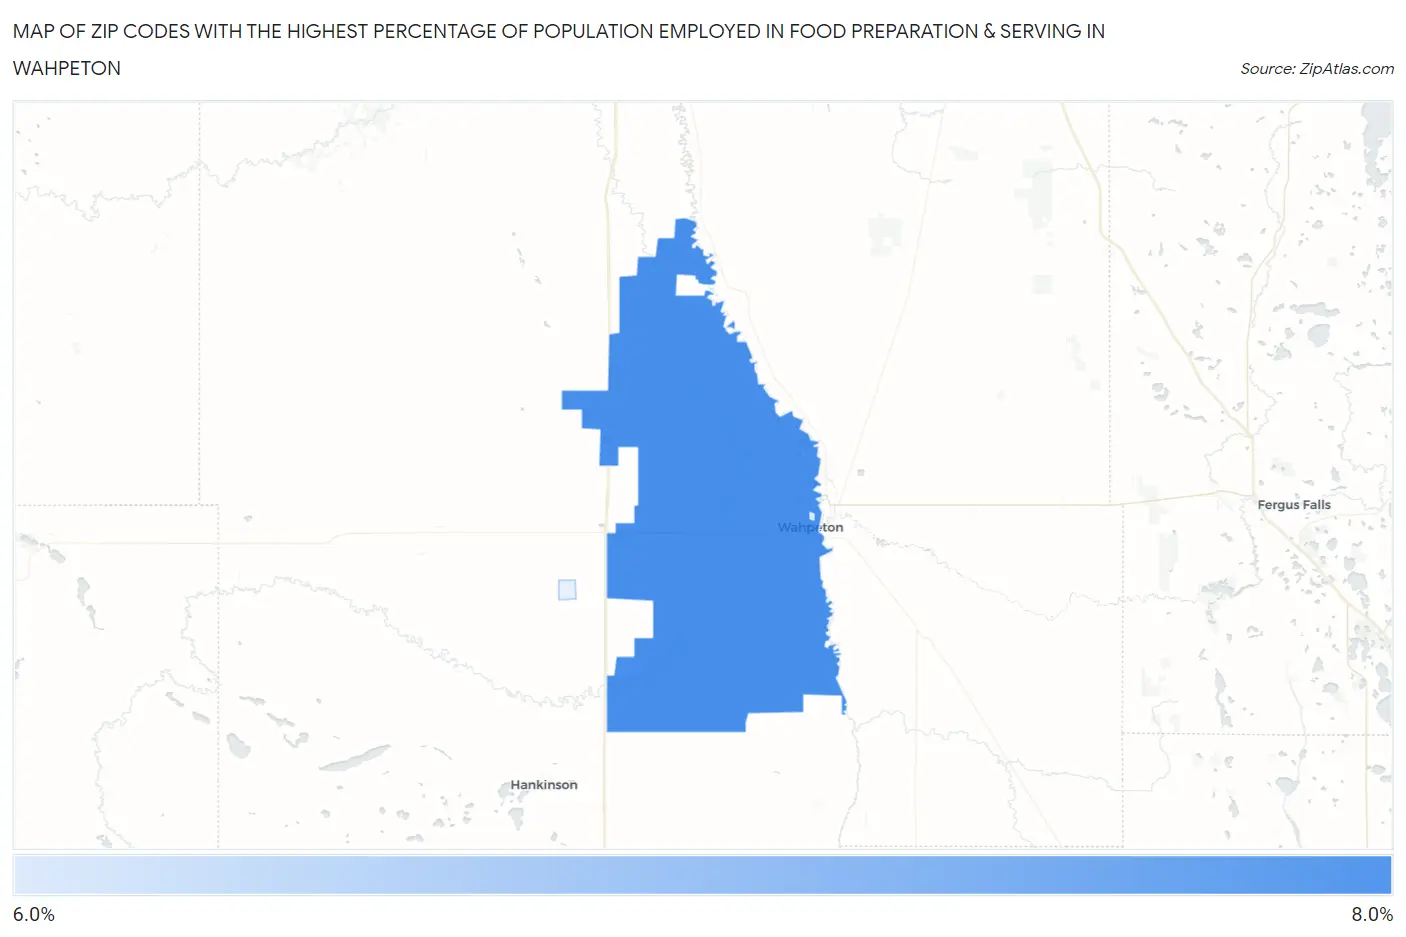
Map of Zip Codes with the Highest Percentage of Population Employed in Food Preparation & Serving in Wahpeton
6.5%
7.0%
Zip Codes with the Highest Percentage of Population Employed in Food Preparation & Serving in Wahpeton, ND
| Zip Code | % Employed | vs State | vs National | |
| 1. | 58075 | 7.0% | 5.2%(+1.80)#54 | 5.3%(+1.74)#6,493 |
| 2. | 58076 | 6.5% | 5.2%(+1.25)#62 | 5.3%(+1.19)#7,937 |
1
Common Questions
What are the Top Zip Codes with the Highest Percentage of Population Employed in Food Preparation & Serving in Wahpeton, ND?
Top Zip Codes with the Highest Percentage of Population Employed in Food Preparation & Serving in Wahpeton, ND are:
What zip code has the Highest Percentage of Population Employed in Food Preparation & Serving in Wahpeton, ND?
58075 has the Highest Percentage of Population Employed in Food Preparation & Serving in Wahpeton, ND with 7.0%.
What is the Percentage of Population Employed in Food Preparation & Serving in Wahpeton, ND?
Percentage of Population Employed in Food Preparation & Serving in Wahpeton is 8.2%.
What is the Percentage of Population Employed in Food Preparation & Serving in North Dakota?
Percentage of Population Employed in Food Preparation & Serving in North Dakota is 5.2%.
What is the Percentage of Population Employed in Food Preparation & Serving in the United States?
Percentage of Population Employed in Food Preparation & Serving in the United States is 5.3%.