Zip Codes with the Highest Percentage of Population Employed in Food Preparation & Serving in Bismarck, ND
RELATED REPORTS & OPTIONS
Food Preparation & Serving
Bismarck
Compare Zip Codes
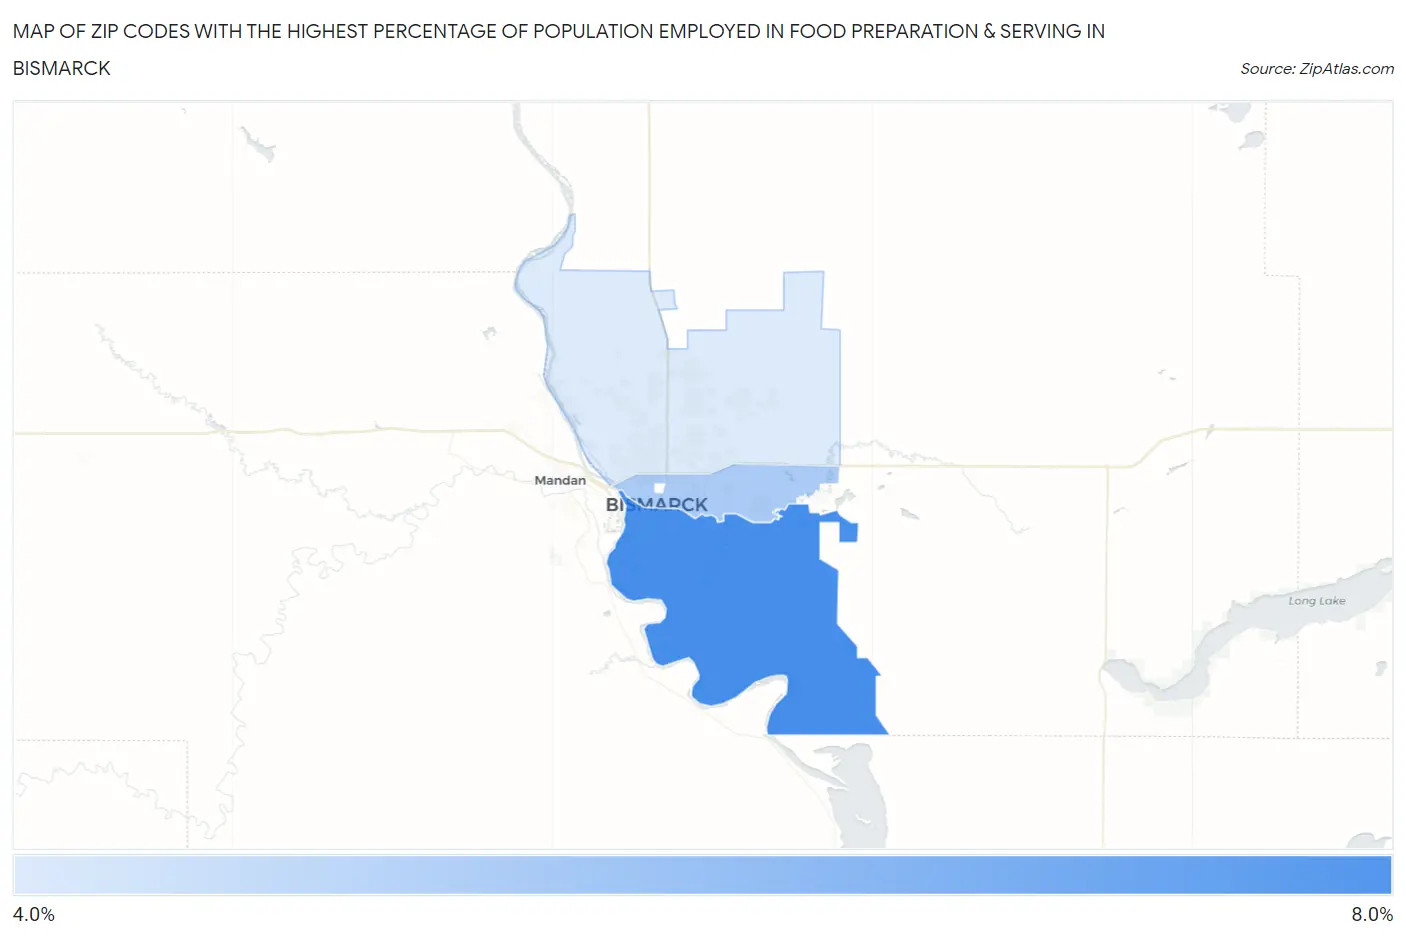
Map of Zip Codes with the Highest Percentage of Population Employed in Food Preparation & Serving in Bismarck
4.8%
6.5%
Zip Codes with the Highest Percentage of Population Employed in Food Preparation & Serving in Bismarck, ND
| Zip Code | % Employed | vs State | vs National | |
| 1. | 58504 | 6.5% | 5.2%(+1.31)#61 | 5.3%(+1.25)#7,780 |
| 2. | 58501 | 5.4% | 5.2%(+0.129)#93 | 5.3%(+0.072)#11,549 |
| 3. | 58503 | 4.8% | 5.2%(-0.473)#117 | 5.3%(-0.530)#13,932 |
1
Common Questions
What are the Top Zip Codes with the Highest Percentage of Population Employed in Food Preparation & Serving in Bismarck, ND?
Top Zip Codes with the Highest Percentage of Population Employed in Food Preparation & Serving in Bismarck, ND are:
What zip code has the Highest Percentage of Population Employed in Food Preparation & Serving in Bismarck, ND?
58504 has the Highest Percentage of Population Employed in Food Preparation & Serving in Bismarck, ND with 6.5%.
What is the Percentage of Population Employed in Food Preparation & Serving in Bismarck, ND?
Percentage of Population Employed in Food Preparation & Serving in Bismarck is 5.5%.
What is the Percentage of Population Employed in Food Preparation & Serving in North Dakota?
Percentage of Population Employed in Food Preparation & Serving in North Dakota is 5.2%.
What is the Percentage of Population Employed in Food Preparation & Serving in the United States?
Percentage of Population Employed in Food Preparation & Serving in the United States is 5.3%.