Zip Codes with the Highest Percentage of Population Employed in Food Preparation & Serving in Grand Forks AFB, ND
RELATED REPORTS & OPTIONS
Food Preparation & Serving
Grand Forks AFB
Compare Zip Codes
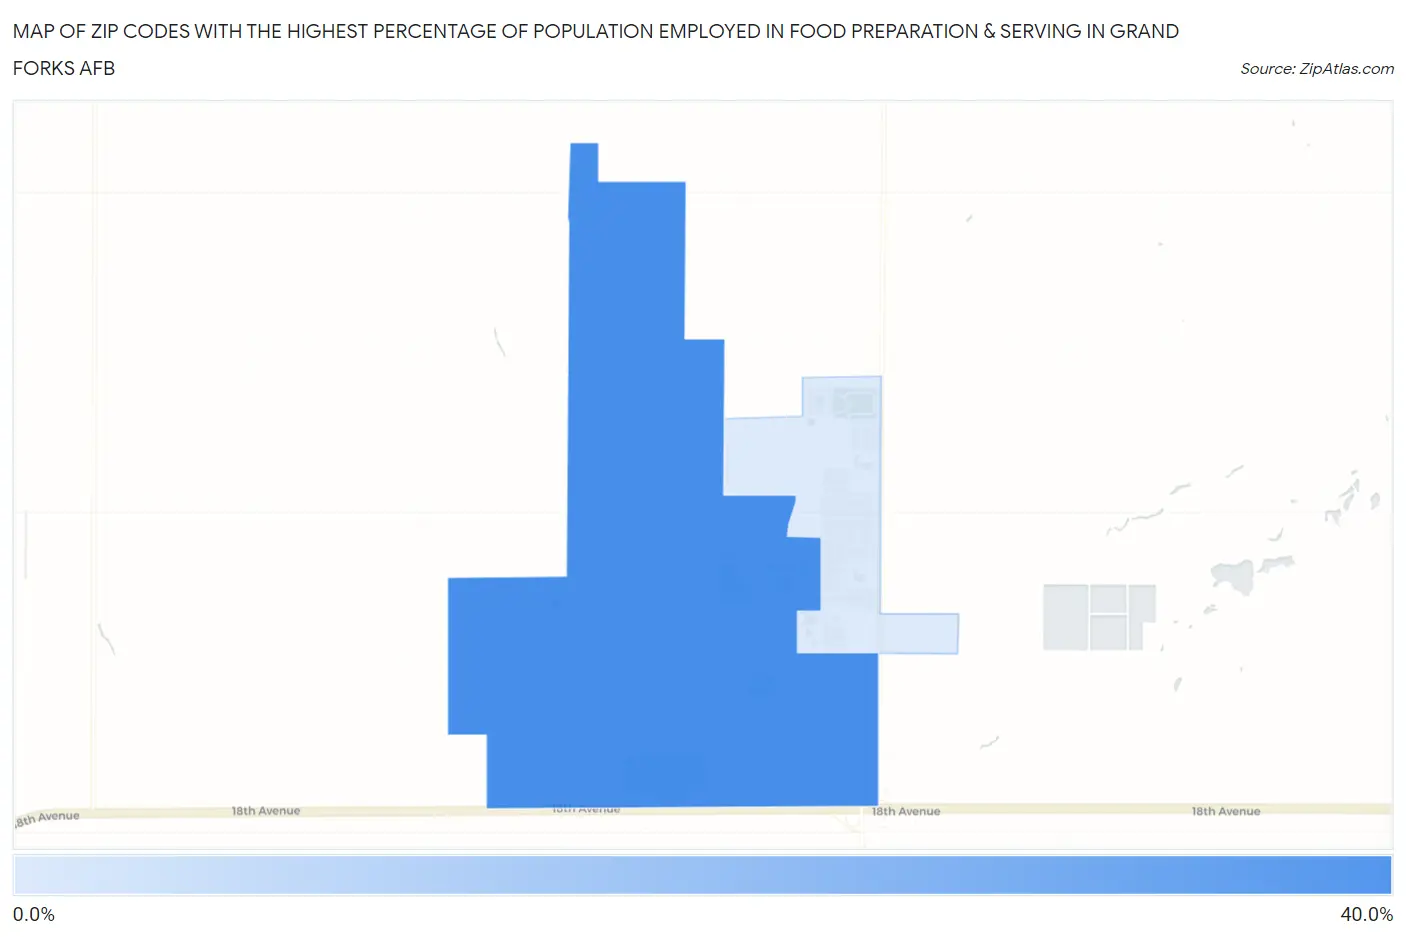
Map of Zip Codes with the Highest Percentage of Population Employed in Food Preparation & Serving in Grand Forks AFB
2.4%
33.3%
Zip Codes with the Highest Percentage of Population Employed in Food Preparation & Serving in Grand Forks AFB, ND
| Zip Code | % Employed | vs State | vs National | |
| 1. | 58205 | 33.3% | 5.2%(+28.1)#2 | 5.3%(+28.0)#169 |
| 2. | 58204 | 2.4% | 5.2%(-2.84)#192 | 5.3%(-2.90)#23,494 |
1
Common Questions
What are the Top Zip Codes with the Highest Percentage of Population Employed in Food Preparation & Serving in Grand Forks AFB, ND?
Top Zip Codes with the Highest Percentage of Population Employed in Food Preparation & Serving in Grand Forks AFB, ND are:
What zip code has the Highest Percentage of Population Employed in Food Preparation & Serving in Grand Forks AFB, ND?
58205 has the Highest Percentage of Population Employed in Food Preparation & Serving in Grand Forks AFB, ND with 33.3%.
What is the Percentage of Population Employed in Food Preparation & Serving in Grand Forks AFB, ND?
Percentage of Population Employed in Food Preparation & Serving in Grand Forks AFB is 3.0%.
What is the Percentage of Population Employed in Food Preparation & Serving in North Dakota?
Percentage of Population Employed in Food Preparation & Serving in North Dakota is 5.2%.
What is the Percentage of Population Employed in Food Preparation & Serving in the United States?
Percentage of Population Employed in Food Preparation & Serving in the United States is 5.3%.