Zip Codes with the Highest Percentage of Population Employed in Food Preparation & Serving in North Dakota
RELATED REPORTS & OPTIONS
Food Preparation & Serving
North Dakota
Compare Zip Codes
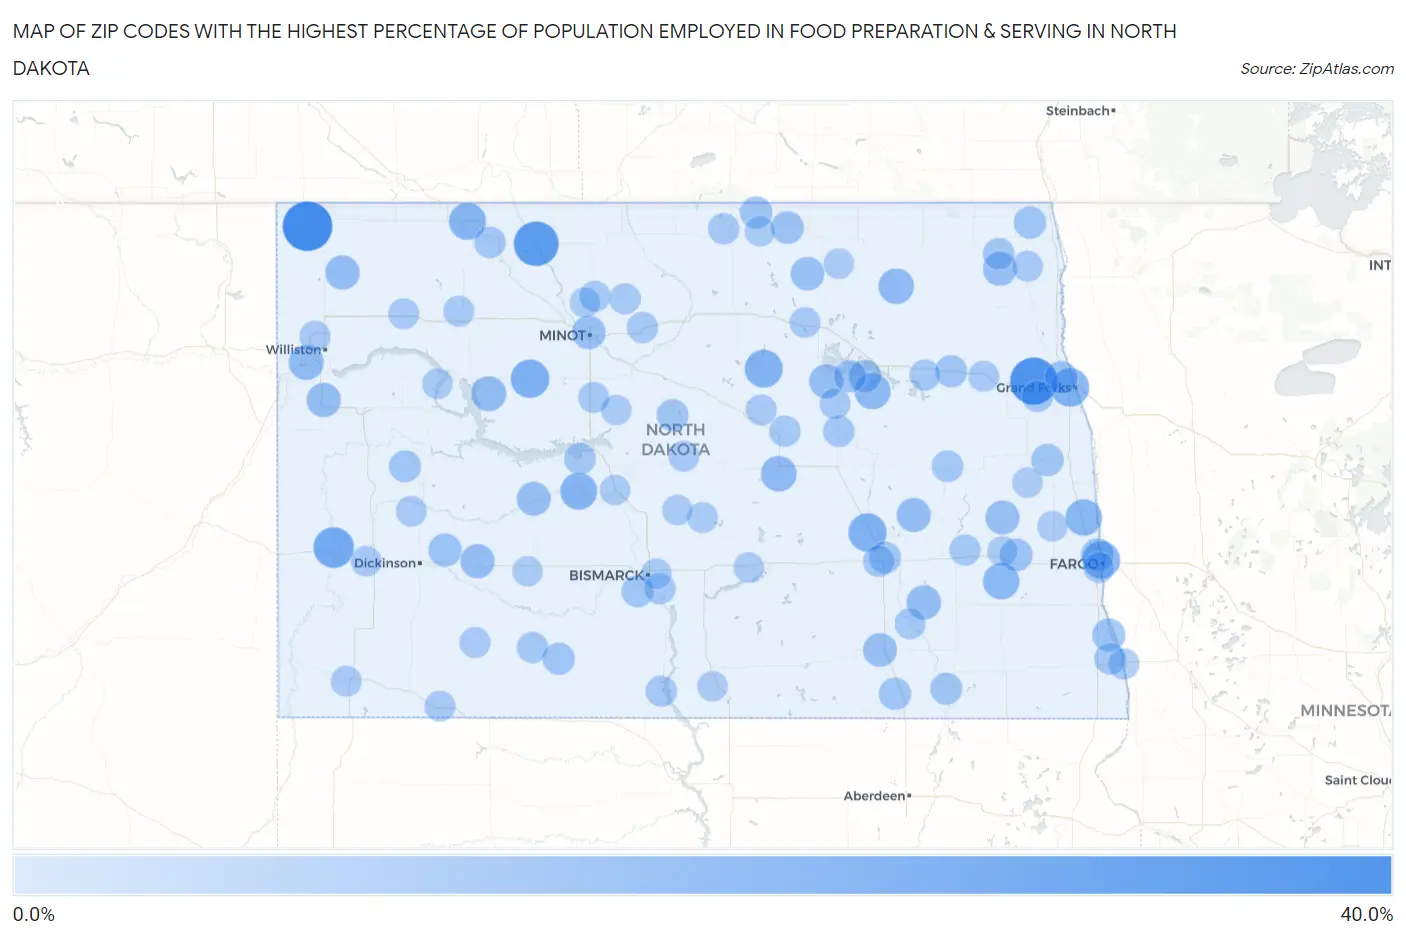
Map of Zip Codes with the Highest Percentage of Population Employed in Food Preparation & Serving in North Dakota
0.0%
40.0%
Zip Codes with the Highest Percentage of Population Employed in Food Preparation & Serving in North Dakota
| Zip Code | % Employed | vs State | vs National | |
| 1. | 58844 | 37.3% | 5.2%(+32.1)#1 | 5.3%(+32.0)#126 |
| 2. | 58205 | 33.3% | 5.2%(+28.1)#2 | 5.3%(+28.0)#169 |
| 3. | 58787 | 29.0% | 5.2%(+23.8)#3 | 5.3%(+23.7)#232 |
| 4. | 58645 | 22.0% | 5.2%(+16.7)#4 | 5.3%(+16.7)#421 |
| 5. | 58756 | 18.6% | 5.2%(+13.3)#5 | 5.3%(+13.3)#607 |
| 6. | 58202 | 18.2% | 5.2%(+13.0)#6 | 5.3%(+12.9)#638 |
| 7. | 58420 | 18.1% | 5.2%(+12.8)#7 | 5.3%(+12.8)#652 |
| 8. | 58332 | 17.6% | 5.2%(+12.4)#8 | 5.3%(+12.3)#696 |
| 9. | 58105 | 17.2% | 5.2%(+11.9)#9 | 5.3%(+11.9)#731 |
| 10. | 58737 | 16.2% | 5.2%(+11.0)#10 | 5.3%(+10.9)#833 |
| 11. | 58571 | 15.8% | 5.2%(+10.6)#11 | 5.3%(+10.6)#880 |
| 12. | 58036 | 15.3% | 5.2%(+10.1)#12 | 5.3%(+10.1)#938 |
| 13. | 58031 | 15.1% | 5.2%(+9.85)#13 | 5.3%(+9.79)#971 |
| 14. | 58379 | 14.5% | 5.2%(+9.23)#14 | 5.3%(+9.17)#1,068 |
| 15. | 58418 | 13.8% | 5.2%(+8.60)#15 | 5.3%(+8.54)#1,199 |
| 16. | 58338 | 13.5% | 5.2%(+8.28)#16 | 5.3%(+8.23)#1,273 |
| 17. | 58770 | 12.7% | 5.2%(+7.48)#17 | 5.3%(+7.43)#1,464 |
| 18. | 58853 | 12.7% | 5.2%(+7.46)#18 | 5.3%(+7.40)#1,471 |
| 19. | 58466 | 11.8% | 5.2%(+6.61)#19 | 5.3%(+6.56)#1,722 |
| 20. | 58830 | 11.7% | 5.2%(+6.46)#20 | 5.3%(+6.40)#1,782 |
| 21. | 58831 | 11.6% | 5.2%(+6.34)#21 | 5.3%(+6.28)#1,826 |
| 22. | 58652 | 11.6% | 5.2%(+6.32)#22 | 5.3%(+6.26)#1,830 |
| 23. | 58492 | 11.4% | 5.2%(+6.19)#23 | 5.3%(+6.13)#1,870 |
| 24. | 58357 | 11.4% | 5.2%(+6.17)#24 | 5.3%(+6.11)#1,876 |
| 25. | 58222 | 11.2% | 5.2%(+5.99)#25 | 5.3%(+5.93)#1,952 |
| 26. | 58064 | 11.2% | 5.2%(+5.93)#26 | 5.3%(+5.88)#1,978 |
| 27. | 58523 | 11.1% | 5.2%(+5.86)#27 | 5.3%(+5.80)#2,019 |
| 28. | 58433 | 10.7% | 5.2%(+5.51)#28 | 5.3%(+5.46)#2,182 |
| 29. | 58317 | 10.4% | 5.2%(+5.22)#29 | 5.3%(+5.16)#2,350 |
| 30. | 58707 | 10.4% | 5.2%(+5.18)#30 | 5.3%(+5.12)#2,369 |
| 31. | 58630 | 9.9% | 5.2%(+4.70)#31 | 5.3%(+4.65)#2,683 |
| 32. | 58102 | 9.7% | 5.2%(+4.50)#32 | 5.3%(+4.44)#2,859 |
| 33. | 58001 | 9.4% | 5.2%(+4.17)#33 | 5.3%(+4.12)#3,139 |
| 34. | 58203 | 9.4% | 5.2%(+4.16)#34 | 5.3%(+4.11)#3,149 |
| 35. | 58367 | 9.2% | 5.2%(+3.94)#35 | 5.3%(+3.89)#3,349 |
| 36. | 58011 | 9.0% | 5.2%(+3.78)#36 | 5.3%(+3.73)#3,515 |
| 37. | 58370 | 8.8% | 5.2%(+3.55)#37 | 5.3%(+3.49)#3,754 |
| 38. | 58257 | 8.6% | 5.2%(+3.36)#38 | 5.3%(+3.30)#3,981 |
| 39. | 58335 | 8.5% | 5.2%(+3.27)#39 | 5.3%(+3.21)#4,075 |
| 40. | 58216 | 8.4% | 5.2%(+3.18)#40 | 5.3%(+3.13)#4,157 |
| 41. | 58436 | 8.4% | 5.2%(+3.12)#41 | 5.3%(+3.07)#4,232 |
| 42. | 58369 | 8.3% | 5.2%(+3.10)#42 | 5.3%(+3.05)#4,256 |
| 43. | 58259 | 8.2% | 5.2%(+3.01)#43 | 5.3%(+2.95)#4,387 |
| 44. | 58529 | 8.2% | 5.2%(+2.97)#44 | 5.3%(+2.91)#4,444 |
| 45. | 58474 | 7.9% | 5.2%(+2.64)#45 | 5.3%(+2.59)#4,930 |
| 46. | 58640 | 7.8% | 5.2%(+2.58)#46 | 5.3%(+2.52)#5,033 |
| 47. | 58554 | 7.8% | 5.2%(+2.54)#47 | 5.3%(+2.49)#5,100 |
| 48. | 58405 | 7.6% | 5.2%(+2.41)#48 | 5.3%(+2.35)#5,315 |
| 49. | 58723 | 7.4% | 5.2%(+2.18)#49 | 5.3%(+2.12)#5,736 |
| 50. | 58241 | 7.3% | 5.2%(+2.09)#50 | 5.3%(+2.03)#5,895 |
| 51. | 58565 | 7.3% | 5.2%(+2.06)#51 | 5.3%(+2.01)#5,937 |
| 52. | 58425 | 7.2% | 5.2%(+1.93)#52 | 5.3%(+1.88)#6,201 |
| 53. | 58746 | 7.1% | 5.2%(+1.84)#53 | 5.3%(+1.78)#6,403 |
| 54. | 58075 | 7.0% | 5.2%(+1.80)#54 | 5.3%(+1.74)#6,493 |
| 55. | 58356 | 6.9% | 5.2%(+1.72)#55 | 5.3%(+1.66)#6,692 |
| 56. | 58401 | 6.8% | 5.2%(+1.60)#56 | 5.3%(+1.55)#6,983 |
| 57. | 58228 | 6.8% | 5.2%(+1.60)#57 | 5.3%(+1.54)#6,991 |
| 58. | 58533 | 6.7% | 5.2%(+1.50)#58 | 5.3%(+1.44)#7,258 |
| 59. | 58329 | 6.6% | 5.2%(+1.42)#59 | 5.3%(+1.36)#7,489 |
| 60. | 58438 | 6.6% | 5.2%(+1.36)#60 | 5.3%(+1.30)#7,634 |
| 61. | 58504 | 6.5% | 5.2%(+1.31)#61 | 5.3%(+1.25)#7,780 |
| 62. | 58076 | 6.5% | 5.2%(+1.25)#62 | 5.3%(+1.19)#7,937 |
| 63. | 58741 | 6.5% | 5.2%(+1.24)#63 | 5.3%(+1.18)#7,956 |
| 64. | 58538 | 6.4% | 5.2%(+1.21)#64 | 5.3%(+1.15)#8,047 |
| 65. | 58072 | 6.4% | 5.2%(+1.18)#65 | 5.3%(+1.12)#8,133 |
| 66. | 58731 | 6.4% | 5.2%(+1.17)#66 | 5.3%(+1.12)#8,137 |
| 67. | 58740 | 6.3% | 5.2%(+1.05)#67 | 5.3%(+0.997)#8,485 |
| 68. | 58344 | 6.3% | 5.2%(+1.04)#68 | 5.3%(+0.980)#8,525 |
| 69. | 58759 | 6.1% | 5.2%(+0.899)#69 | 5.3%(+0.843)#8,934 |
| 70. | 58431 | 6.1% | 5.2%(+0.893)#70 | 5.3%(+0.836)#8,957 |
| 71. | 58646 | 6.1% | 5.2%(+0.876)#71 | 5.3%(+0.819)#9,002 |
| 72. | 58852 | 6.1% | 5.2%(+0.869)#72 | 5.3%(+0.813)#9,028 |
| 73. | 58784 | 6.1% | 5.2%(+0.839)#73 | 5.3%(+0.783)#9,117 |
| 74. | 58341 | 6.1% | 5.2%(+0.834)#74 | 5.3%(+0.777)#9,131 |
| 75. | 58463 | 6.1% | 5.2%(+0.831)#75 | 5.3%(+0.775)#9,141 |
| 76. | 58103 | 6.0% | 5.2%(+0.813)#76 | 5.3%(+0.756)#9,197 |
| 77. | 58266 | 6.0% | 5.2%(+0.794)#77 | 5.3%(+0.738)#9,266 |
| 78. | 58801 | 6.0% | 5.2%(+0.789)#78 | 5.3%(+0.733)#9,285 |
| 79. | 58639 | 6.0% | 5.2%(+0.734)#79 | 5.3%(+0.677)#9,463 |
| 80. | 58374 | 5.9% | 5.2%(+0.703)#80 | 5.3%(+0.646)#9,569 |
| 81. | 58494 | 5.9% | 5.2%(+0.682)#81 | 5.3%(+0.625)#9,640 |
| 82. | 58276 | 5.9% | 5.2%(+0.626)#82 | 5.3%(+0.570)#9,841 |
| 83. | 58346 | 5.8% | 5.2%(+0.589)#83 | 5.3%(+0.532)#9,970 |
| 84. | 58623 | 5.8% | 5.2%(+0.549)#84 | 5.3%(+0.493)#10,095 |
| 85. | 58642 | 5.7% | 5.2%(+0.508)#85 | 5.3%(+0.452)#10,218 |
| 86. | 58622 | 5.6% | 5.2%(+0.404)#86 | 5.3%(+0.348)#10,582 |
| 87. | 58763 | 5.6% | 5.2%(+0.323)#87 | 5.3%(+0.266)#10,885 |
| 88. | 58006 | 5.5% | 5.2%(+0.250)#88 | 5.3%(+0.193)#11,128 |
| 89. | 58704 | 5.5% | 5.2%(+0.227)#89 | 5.3%(+0.171)#11,195 |
| 90. | 58331 | 5.4% | 5.2%(+0.205)#90 | 5.3%(+0.149)#11,285 |
| 91. | 58482 | 5.4% | 5.2%(+0.198)#91 | 5.3%(+0.142)#11,309 |
| 92. | 58071 | 5.4% | 5.2%(+0.176)#92 | 5.3%(+0.119)#11,387 |
| 93. | 58501 | 5.4% | 5.2%(+0.129)#93 | 5.3%(+0.072)#11,549 |
| 94. | 58016 | 5.4% | 5.2%(+0.128)#94 | 5.3%(+0.071)#11,554 |
| 95. | 58316 | 5.3% | 5.2%(+0.087)#95 | 5.3%(+0.031)#11,701 |
| 96. | 58477 | 5.3% | 5.2%(+0.034)#96 | 5.3%(-0.023)#11,908 |
| 97. | 58577 | 5.2% | 5.2%(-0.020)#97 | 5.3%(-0.077)#12,097 |
| 98. | 58716 | 5.2% | 5.2%(-0.021)#98 | 5.3%(-0.078)#12,100 |
| 99. | 58631 | 5.2% | 5.2%(-0.041)#99 | 5.3%(-0.097)#12,196 |
| 100. | 58573 | 5.2% | 5.2%(-0.072)#100 | 5.3%(-0.128)#12,331 |
Common Questions
What are the Top 10 Zip Codes with the Highest Percentage of Population Employed in Food Preparation & Serving in North Dakota?
Top 10 Zip Codes with the Highest Percentage of Population Employed in Food Preparation & Serving in North Dakota are:
What zip code has the Highest Percentage of Population Employed in Food Preparation & Serving in North Dakota?
58844 has the Highest Percentage of Population Employed in Food Preparation & Serving in North Dakota with 37.3%.
What is the Percentage of Population Employed in Food Preparation & Serving in the State of North Dakota?
Percentage of Population Employed in Food Preparation & Serving in North Dakota is 5.2%.
What is the Percentage of Population Employed in Food Preparation & Serving in the United States?
Percentage of Population Employed in Food Preparation & Serving in the United States is 5.3%.