Streeter, ND Map & Demographics
Streeter Map
Streeter Overview
$35,804
PER CAPITA INCOME
$39,167
AVG FAMILY INCOME
$38,750
AVG HOUSEHOLD INCOME
0.40
INEQUALITY / GINI INDEX
90
TOTAL POPULATION
52
MALE POPULATION
38
FEMALE POPULATION
136.84
MALES / 100 FEMALES
73.08
FEMALES / 100 MALES
66.1
MEDIAN AGE
2.2
AVG FAMILY SIZE
1.7
AVG HOUSEHOLD SIZE
41
LABOR FORCE [ PEOPLE ]
45.6%
PERCENT IN LABOR FORCE
Streeter Zip Codes
Streeter Area Codes
Income in Streeter
Income Overview in Streeter
Per Capita Income in Streeter is $35,804, while median incomes of families and households are $39,167 and $38,750 respectively.
| Characteristic | Number | Measure |
| Per Capita Income | 90 | $35,804 |
| Median Family Income | 28 | $39,167 |
| Mean Family Income | 28 | $65,664 |
| Median Household Income | 52 | $38,750 |
| Mean Household Income | 52 | $57,590 |
| Income Deficit | 28 | $0 |
| Wage / Income Gap (%) | 90 | 0.00% |
| Wage / Income Gap ($) | 90 | 100.00¢ per $1 |
| Gini / Inequality Index | 90 | 0.40 |
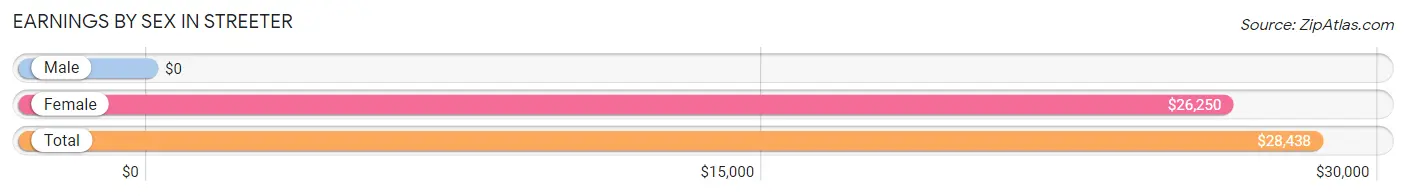
Earnings by Sex in Streeter
| Sex | Number | Average Earnings |
| Male | 33 (60.0%) | $0 |
| Female | 22 (40.0%) | $26,250 |
| Total | 55 (100.0%) | $28,438 |
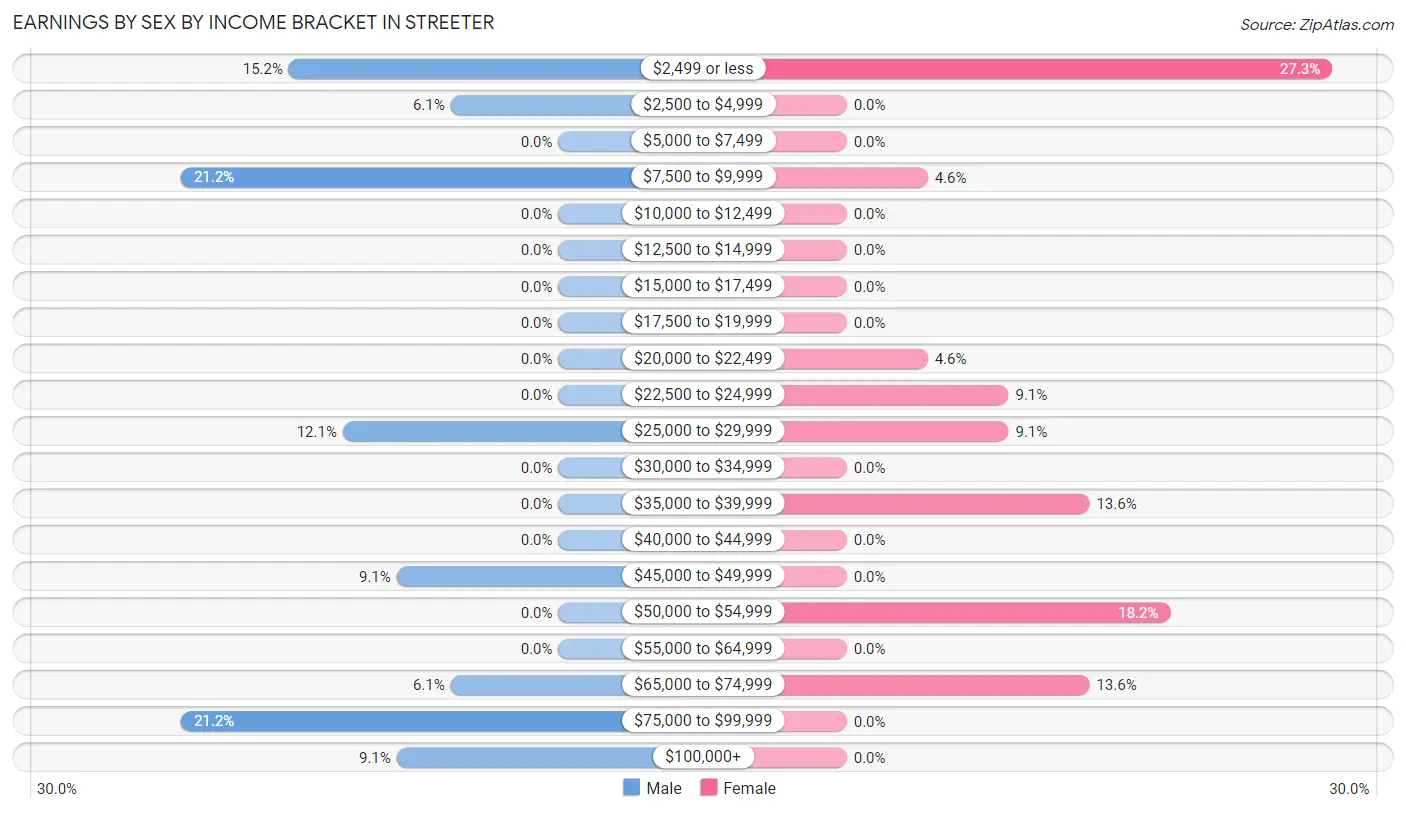
Earnings by Sex by Income Bracket in Streeter
The most common earnings brackets in Streeter are $7,500 to $9,999 for men (7 | 21.2%) and $2,499 or less for women (6 | 27.3%).
| Income | Male | Female |
| $2,499 or less | 5 (15.1%) | 6 (27.3%) |
| $2,500 to $4,999 | 2 (6.1%) | 0 (0.0%) |
| $5,000 to $7,499 | 0 (0.0%) | 0 (0.0%) |
| $7,500 to $9,999 | 7 (21.2%) | 1 (4.5%) |
| $10,000 to $12,499 | 0 (0.0%) | 0 (0.0%) |
| $12,500 to $14,999 | 0 (0.0%) | 0 (0.0%) |
| $15,000 to $17,499 | 0 (0.0%) | 0 (0.0%) |
| $17,500 to $19,999 | 0 (0.0%) | 0 (0.0%) |
| $20,000 to $22,499 | 0 (0.0%) | 1 (4.5%) |
| $22,500 to $24,999 | 0 (0.0%) | 2 (9.1%) |
| $25,000 to $29,999 | 4 (12.1%) | 2 (9.1%) |
| $30,000 to $34,999 | 0 (0.0%) | 0 (0.0%) |
| $35,000 to $39,999 | 0 (0.0%) | 3 (13.6%) |
| $40,000 to $44,999 | 0 (0.0%) | 0 (0.0%) |
| $45,000 to $49,999 | 3 (9.1%) | 0 (0.0%) |
| $50,000 to $54,999 | 0 (0.0%) | 4 (18.2%) |
| $55,000 to $64,999 | 0 (0.0%) | 0 (0.0%) |
| $65,000 to $74,999 | 2 (6.1%) | 3 (13.6%) |
| $75,000 to $99,999 | 7 (21.2%) | 0 (0.0%) |
| $100,000+ | 3 (9.1%) | 0 (0.0%) |
| Total | 33 (100.0%) | 22 (100.0%) |
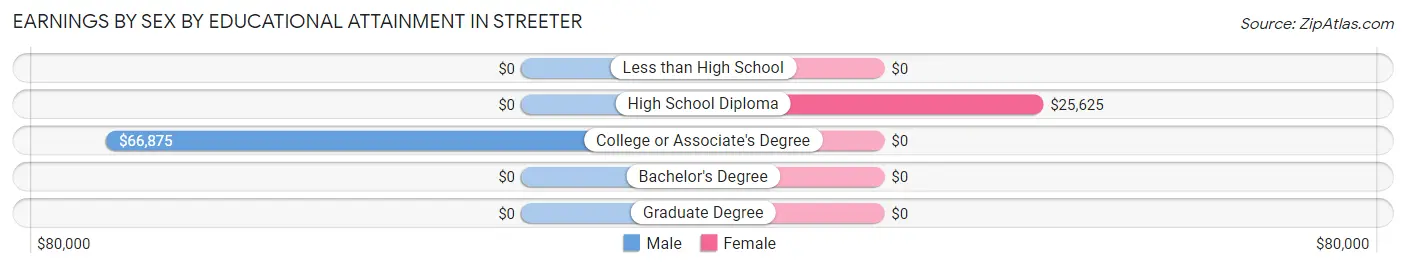
Earnings by Sex by Educational Attainment in Streeter
| Educational Attainment | Male Income | Female Income |
| Less than High School | - | - |
| High School Diploma | - | - |
| College or Associate's Degree | $66,875 | $0 |
| Bachelor's Degree | - | - |
| Graduate Degree | - | - |
| Total | - | - |
Family Income in Streeter
Family Income Brackets in Streeter
According to the Streeter family income data, there are 12 families falling into the $35,000 to $49,999 income range, which is the most common income bracket and makes up 42.9% of all families.
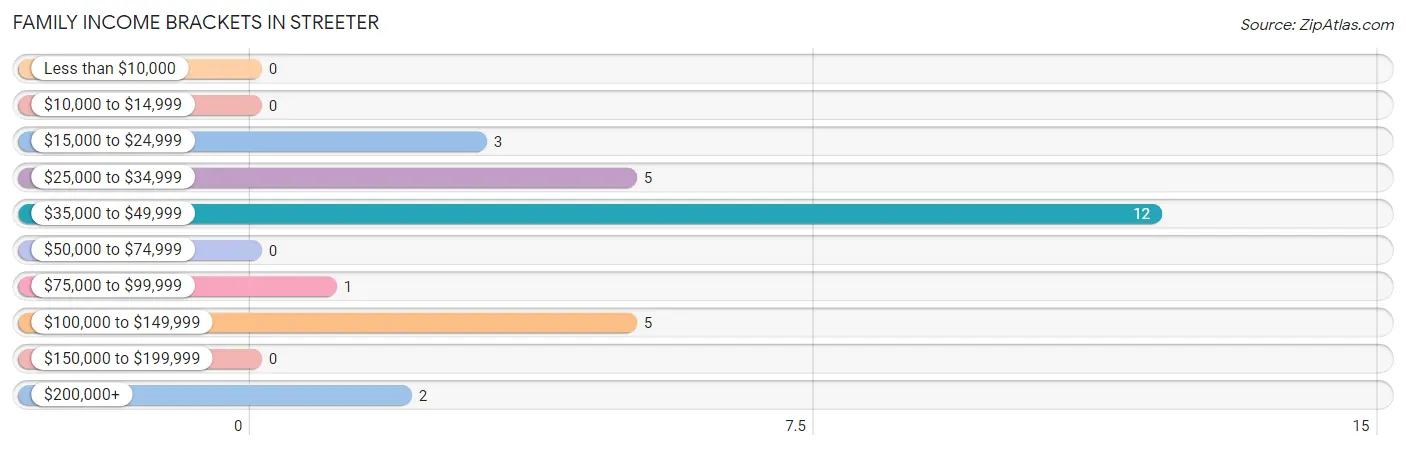
| Income Bracket | # Families | % Families |
| Less than $10,000 | 0 | 0.0% |
| $10,000 to $14,999 | 0 | 0.0% |
| $15,000 to $24,999 | 3 | 10.7% |
| $25,000 to $34,999 | 5 | 17.9% |
| $35,000 to $49,999 | 12 | 42.9% |
| $50,000 to $74,999 | 0 | 0.0% |
| $75,000 to $99,999 | 1 | 3.6% |
| $100,000 to $149,999 | 5 | 17.9% |
| $150,000 to $199,999 | 0 | 0.0% |
| $200,000+ | 2 | 7.1% |
Family Income by Famaliy Size in Streeter
2-person families (28 | 100.0%) account for the highest median family income in Streeter with $39,167 per family, while 2-person families (28 | 100.0%) have the highest median income of $19,584 per family member.
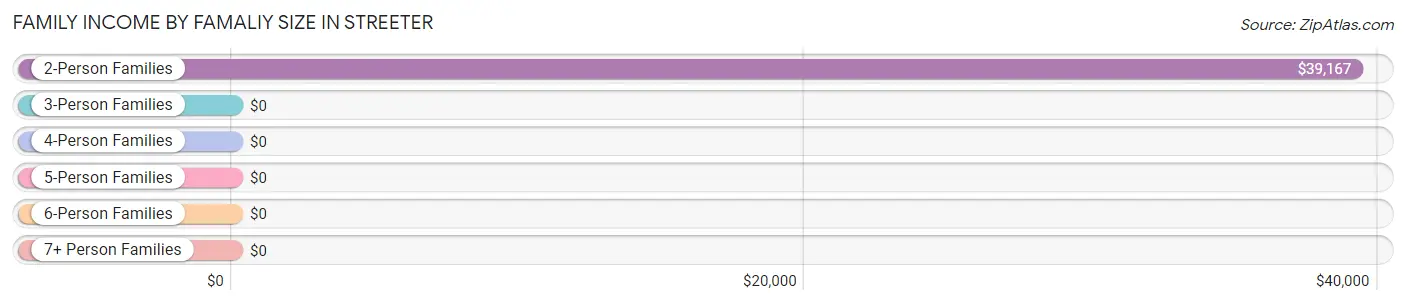
| Income Bracket | # Families | Median Income |
| 2-Person Families | 28 (100.0%) | $39,167 |
| 3-Person Families | 0 (0.0%) | $0 |
| 4-Person Families | 0 (0.0%) | $0 |
| 5-Person Families | 0 (0.0%) | $0 |
| 6-Person Families | 0 (0.0%) | $0 |
| 7+ Person Families | 0 (0.0%) | $0 |
| Total | 28 (100.0%) | $39,167 |
Family Income by Number of Earners in Streeter
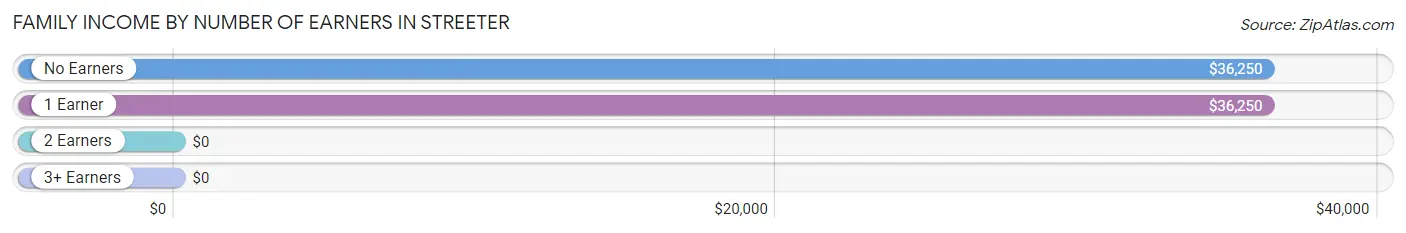
| Number of Earners | # Families | Median Income |
| No Earners | 10 (35.7%) | $36,250 |
| 1 Earner | 6 (21.4%) | $36,250 |
| 2 Earners | 12 (42.9%) | $0 |
| 3+ Earners | 0 (0.0%) | $0 |
| Total | 28 (100.0%) | $39,167 |
Household Income in Streeter
Household Income Brackets in Streeter
With 15 households falling in the category, the $35,000 to $49,999 income range is the most frequent in Streeter, accounting for 28.8% of all households.
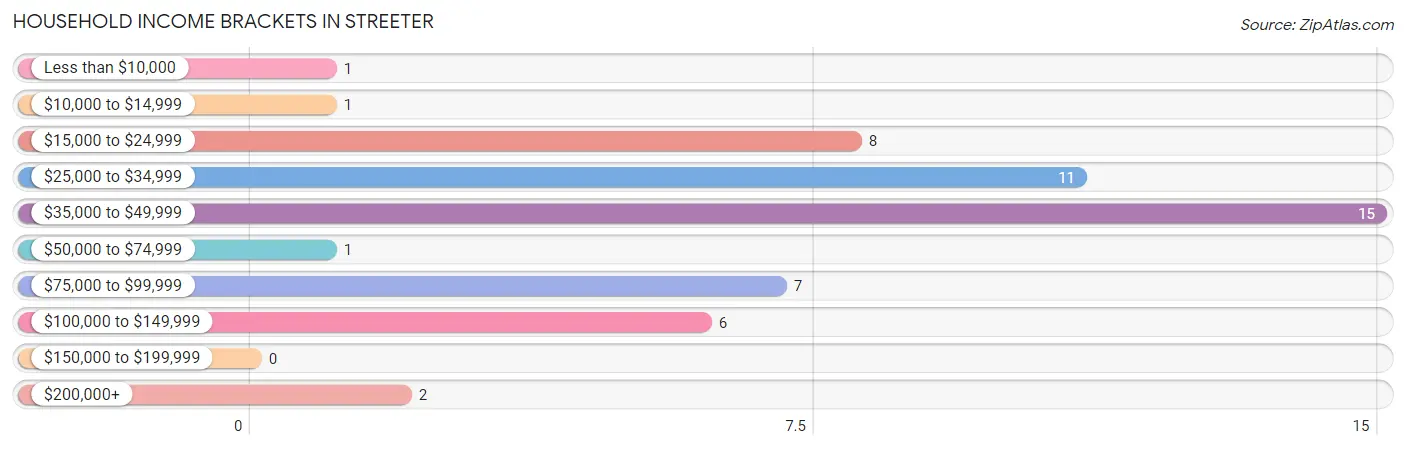
| Income Bracket | # Households | % Households |
| Less than $10,000 | 1 | 1.9% |
| $10,000 to $14,999 | 1 | 1.9% |
| $15,000 to $24,999 | 8 | 15.4% |
| $25,000 to $34,999 | 11 | 21.2% |
| $35,000 to $49,999 | 15 | 28.8% |
| $50,000 to $74,999 | 1 | 1.9% |
| $75,000 to $99,999 | 7 | 13.5% |
| $100,000 to $149,999 | 6 | 11.5% |
| $150,000 to $199,999 | 0 | 0.0% |
| $200,000+ | 2 | 3.8% |
Household Income by Householder Age in Streeter
The median household income in Streeter is $38,750, with the highest median household income of $39,583 found in the 65+ years age bracket for the primary householder. A total of 30 households (57.7%) fall into this category.
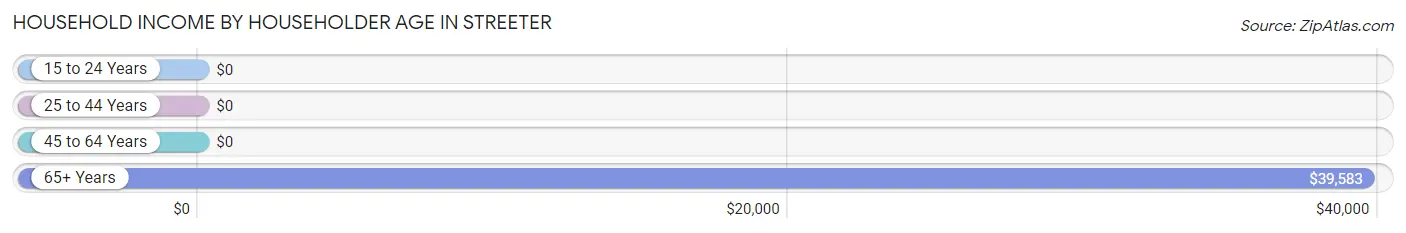
| Income Bracket | # Households | Median Income |
| 15 to 24 Years | 0 (0.0%) | $0 |
| 25 to 44 Years | 8 (15.4%) | $0 |
| 45 to 64 Years | 14 (26.9%) | $0 |
| 65+ Years | 30 (57.7%) | $39,583 |
| Total | 52 (100.0%) | $38,750 |
Poverty in Streeter
Income Below Poverty by Sex and Age in Streeter
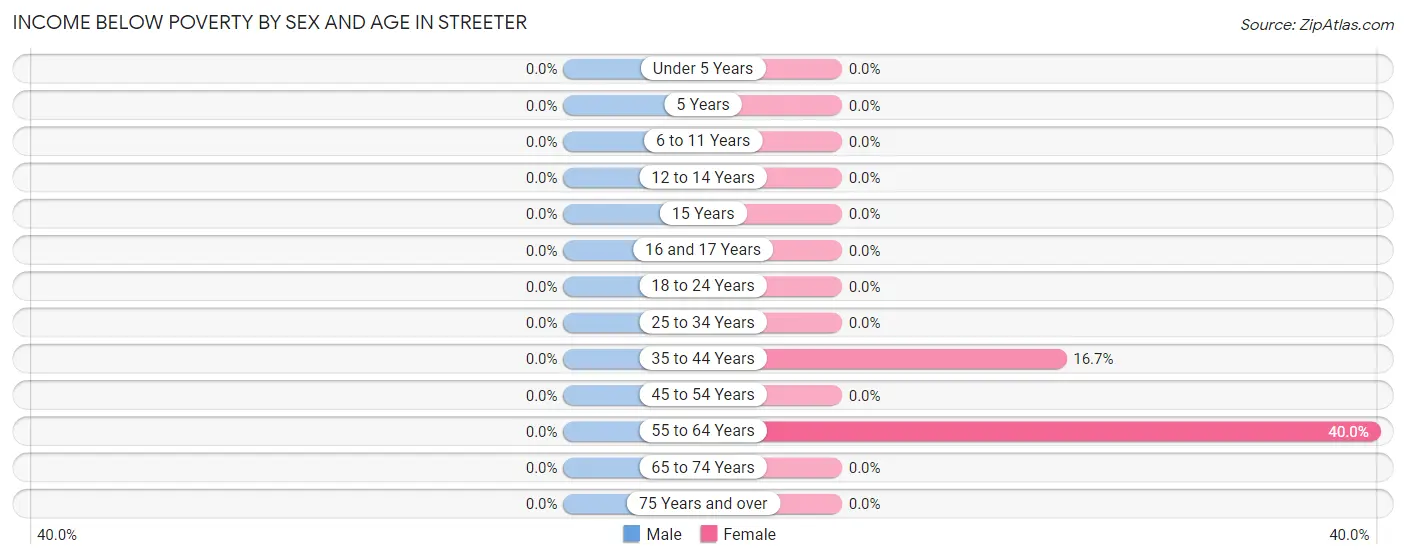
| Age Bracket | Male | Female |
| Under 5 Years | 0 (0.0%) | 0 (0.0%) |
| 5 Years | 0 (0.0%) | 0 (0.0%) |
| 6 to 11 Years | 0 (0.0%) | 0 (0.0%) |
| 12 to 14 Years | 0 (0.0%) | 0 (0.0%) |
| 15 Years | 0 (0.0%) | 0 (0.0%) |
| 16 and 17 Years | 0 (0.0%) | 0 (0.0%) |
| 18 to 24 Years | 0 (0.0%) | 0 (0.0%) |
| 25 to 34 Years | 0 (0.0%) | 0 (0.0%) |
| 35 to 44 Years | 0 (0.0%) | 1 (16.7%) |
| 45 to 54 Years | 0 (0.0%) | 0 (0.0%) |
| 55 to 64 Years | 0 (0.0%) | 2 (40.0%) |
| 65 to 74 Years | 0 (0.0%) | 0 (0.0%) |
| 75 Years and over | 0 (0.0%) | 0 (0.0%) |
| Total | 0 (0.0%) | 3 (7.9%) |
Income Above Poverty by Sex and Age in Streeter
According to the poverty statistics in Streeter, males aged 16 and 17 years and females aged 18 to 24 years are the age groups that are most secure financially, with 100.0% of males and 100.0% of females in these age groups living above the poverty line.
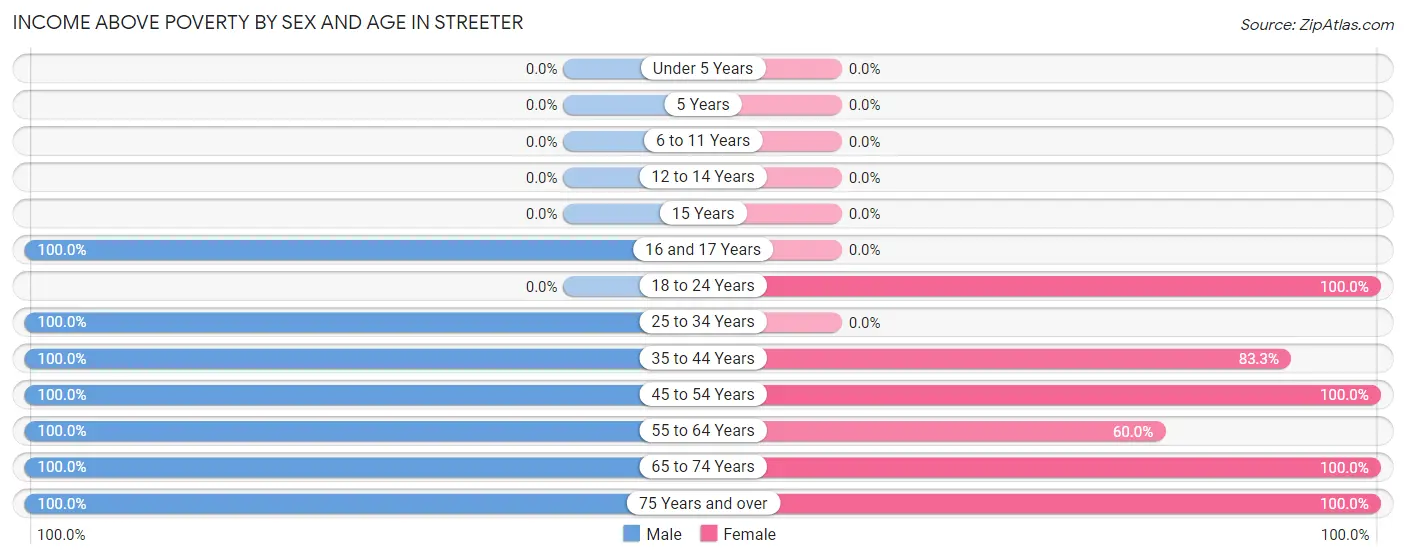
| Age Bracket | Male | Female |
| Under 5 Years | 0 (0.0%) | 0 (0.0%) |
| 5 Years | 0 (0.0%) | 0 (0.0%) |
| 6 to 11 Years | 0 (0.0%) | 0 (0.0%) |
| 12 to 14 Years | 0 (0.0%) | 0 (0.0%) |
| 15 Years | 0 (0.0%) | 0 (0.0%) |
| 16 and 17 Years | 2 (100.0%) | 0 (0.0%) |
| 18 to 24 Years | 0 (0.0%) | 2 (100.0%) |
| 25 to 34 Years | 4 (100.0%) | 0 (0.0%) |
| 35 to 44 Years | 4 (100.0%) | 5 (83.3%) |
| 45 to 54 Years | 9 (100.0%) | 3 (100.0%) |
| 55 to 64 Years | 8 (100.0%) | 3 (60.0%) |
| 65 to 74 Years | 13 (100.0%) | 11 (100.0%) |
| 75 Years and over | 12 (100.0%) | 11 (100.0%) |
| Total | 52 (100.0%) | 35 (92.1%) |
Income Below Poverty Among Married-Couple Families in Streeter
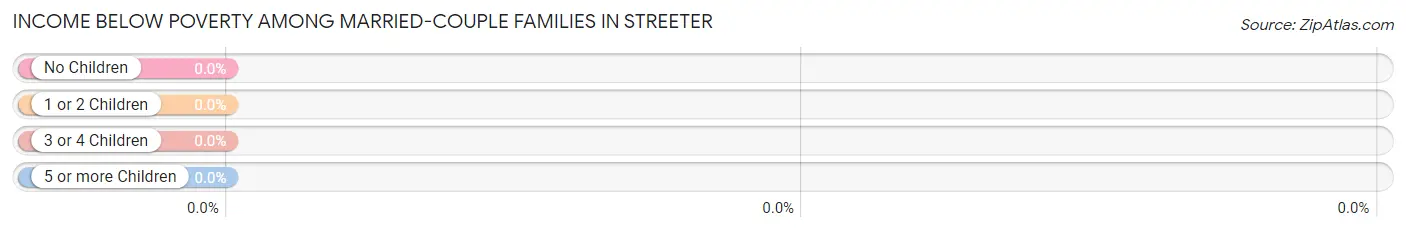
| Children | Above Poverty | Below Poverty |
| No Children | 21 (100.0%) | 0 (0.0%) |
| 1 or 2 Children | 0 (0.0%) | 0 (0.0%) |
| 3 or 4 Children | 0 (0.0%) | 0 (0.0%) |
| 5 or more Children | 0 (0.0%) | 0 (0.0%) |
| Total | 21 (100.0%) | 0 (0.0%) |
Income Below Poverty Among Single-Parent Households in Streeter
| Children | Single Father | Single Mother |
| No Children | 0 (0.0%) | 0 (0.0%) |
| 1 or 2 Children | 0 (0.0%) | 0 (0.0%) |
| 3 or 4 Children | 0 (0.0%) | 0 (0.0%) |
| 5 or more Children | 0 (0.0%) | 0 (0.0%) |
| Total | 0 (0.0%) | 0 (0.0%) |
Income Below Poverty Among Married-Couple vs Single-Parent Households in Streeter
| Children | Married-Couple Families | Single-Parent Households |
| No Children | 0 (0.0%) | 0 (0.0%) |
| 1 or 2 Children | 0 (0.0%) | 0 (0.0%) |
| 3 or 4 Children | 0 (0.0%) | 0 (0.0%) |
| 5 or more Children | 0 (0.0%) | 0 (0.0%) |
| Total | 0 (0.0%) | 0 (0.0%) |
Race in Streeter
The most populous races in Streeter are White / Caucasian (86 | 95.6%), Two or more Races (3 | 3.3%), and Black / African American (1 | 1.1%).
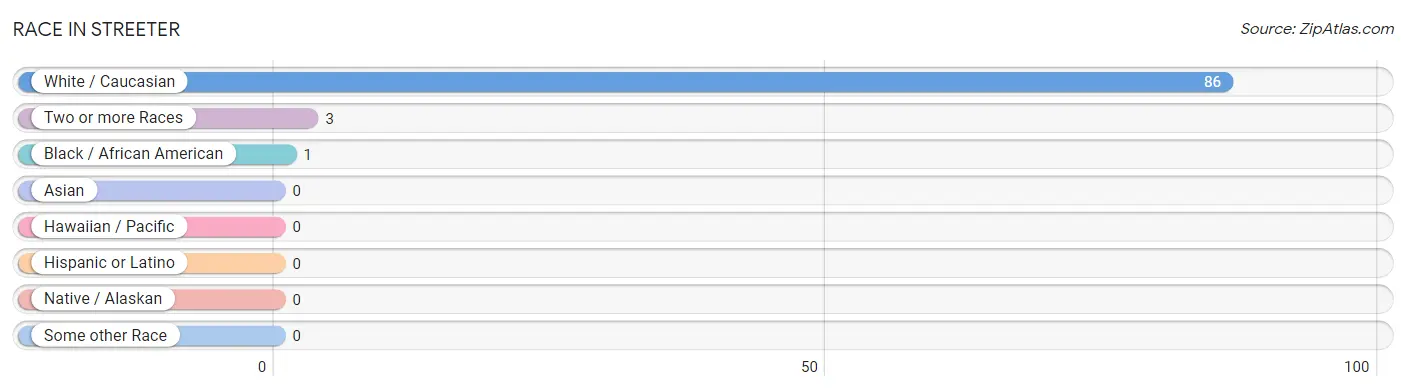
| Race | # Population | % Population |
| Asian | 0 | 0.0% |
| Black / African American | 1 | 1.1% |
| Hawaiian / Pacific | 0 | 0.0% |
| Hispanic or Latino | 0 | 0.0% |
| Native / Alaskan | 0 | 0.0% |
| White / Caucasian | 86 | 95.6% |
| Two or more Races | 3 | 3.3% |
| Some other Race | 0 | 0.0% |
| Total | 90 | 100.0% |
Ancestry in Streeter
The most populous ancestries reported in Streeter are German (48 | 53.3%), Russian (26 | 28.9%), Norwegian (10 | 11.1%), German Russian (7 | 7.8%), and Canadian (3 | 3.3%), together accounting for 104.4% of all Streeter residents.
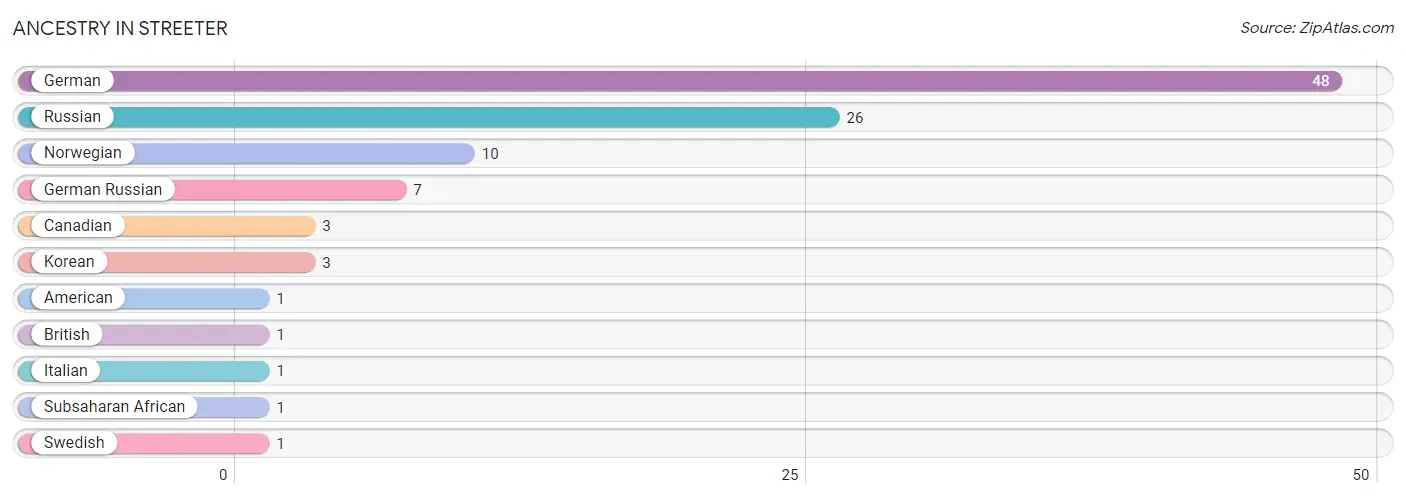
| Ancestry | # Population | % Population |
| American | 1 | 1.1% |
| British | 1 | 1.1% |
| Canadian | 3 | 3.3% |
| German | 48 | 53.3% |
| German Russian | 7 | 7.8% |
| Italian | 1 | 1.1% |
| Korean | 3 | 3.3% |
| Norwegian | 10 | 11.1% |
| Russian | 26 | 28.9% |
| Subsaharan African | 1 | 1.1% |
| Swedish | 1 | 1.1% | View All 11 Rows |
Immigrants in Streeter
The most numerous immigrant groups reported in Streeter came from Africa (1 | 1.1%), Eastern Africa (1 | 1.1%), and Zimbabwe (1 | 1.1%), together accounting for 3.3% of all Streeter residents.
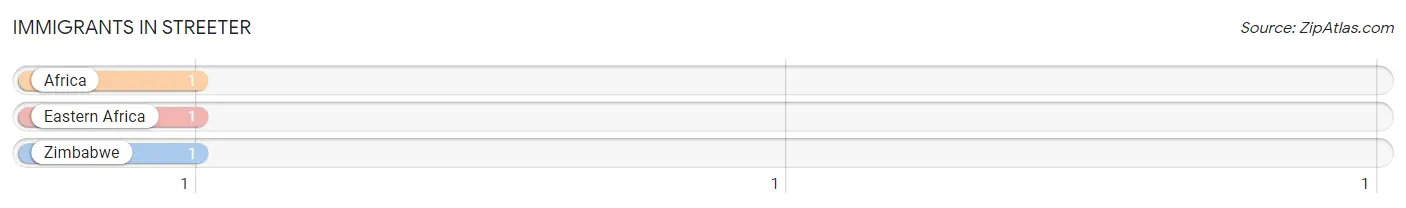
| Immigration Origin | # Population | % Population |
| Africa | 1 | 1.1% |
| Eastern Africa | 1 | 1.1% |
| Zimbabwe | 1 | 1.1% | View All 3 Rows |
Sex and Age in Streeter
Sex and Age in Streeter
The most populous age groups in Streeter are 80 to 84 Years (8 | 15.4%) for men and 75 to 79 Years (7 | 18.4%) for women.
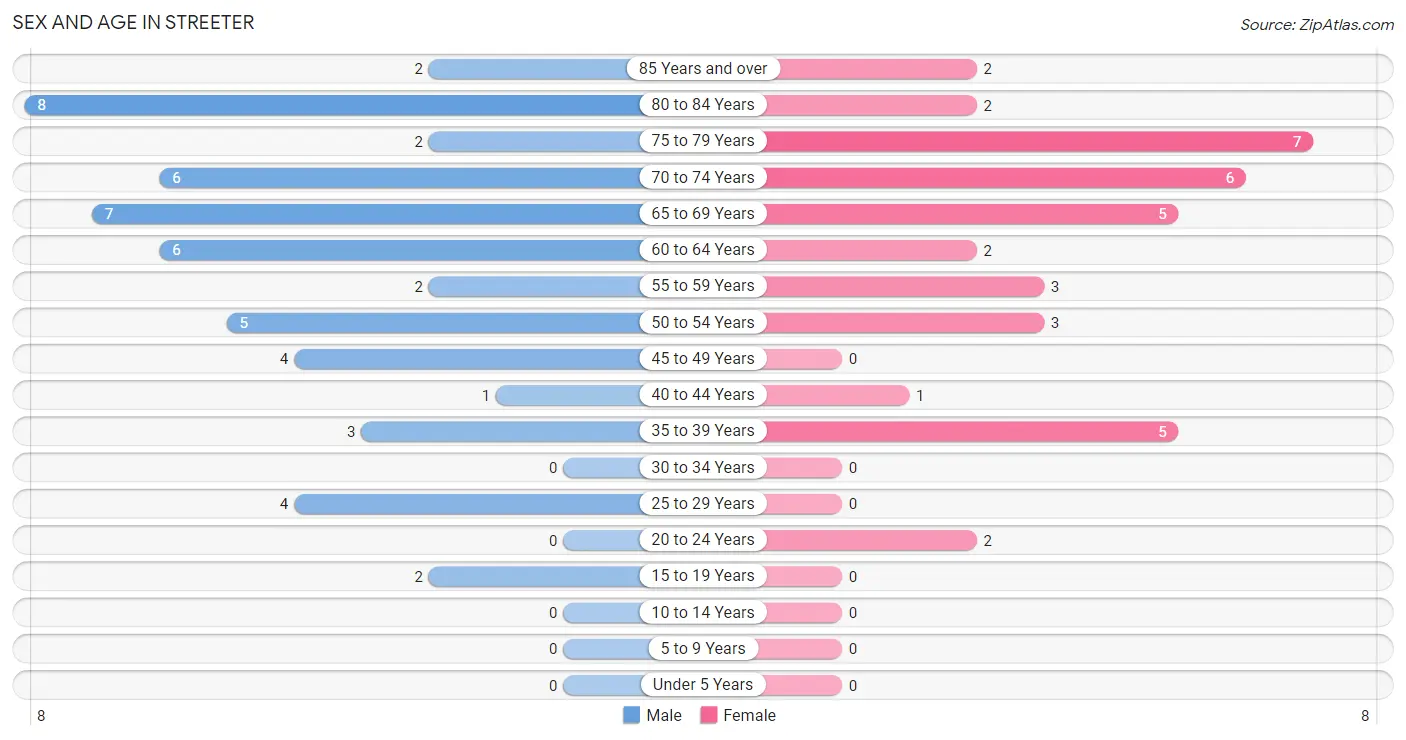
| Age Bracket | Male | Female |
| Under 5 Years | 0 (0.0%) | 0 (0.0%) |
| 5 to 9 Years | 0 (0.0%) | 0 (0.0%) |
| 10 to 14 Years | 0 (0.0%) | 0 (0.0%) |
| 15 to 19 Years | 2 (3.8%) | 0 (0.0%) |
| 20 to 24 Years | 0 (0.0%) | 2 (5.3%) |
| 25 to 29 Years | 4 (7.7%) | 0 (0.0%) |
| 30 to 34 Years | 0 (0.0%) | 0 (0.0%) |
| 35 to 39 Years | 3 (5.8%) | 5 (13.2%) |
| 40 to 44 Years | 1 (1.9%) | 1 (2.6%) |
| 45 to 49 Years | 4 (7.7%) | 0 (0.0%) |
| 50 to 54 Years | 5 (9.6%) | 3 (7.9%) |
| 55 to 59 Years | 2 (3.8%) | 3 (7.9%) |
| 60 to 64 Years | 6 (11.5%) | 2 (5.3%) |
| 65 to 69 Years | 7 (13.5%) | 5 (13.2%) |
| 70 to 74 Years | 6 (11.5%) | 6 (15.8%) |
| 75 to 79 Years | 2 (3.8%) | 7 (18.4%) |
| 80 to 84 Years | 8 (15.4%) | 2 (5.3%) |
| 85 Years and over | 2 (3.8%) | 2 (5.3%) |
| Total | 52 (100.0%) | 38 (100.0%) |
Families and Households in Streeter
Median Family Size in Streeter
The median family size in Streeter is 2.21 persons per family, with single male/father families (4 | 14.3%) accounting for the largest median family size of 2.25 persons per family. On the other hand, single female/mother families (3 | 10.7%) represent the smallest median family size with 2.00 persons per family.
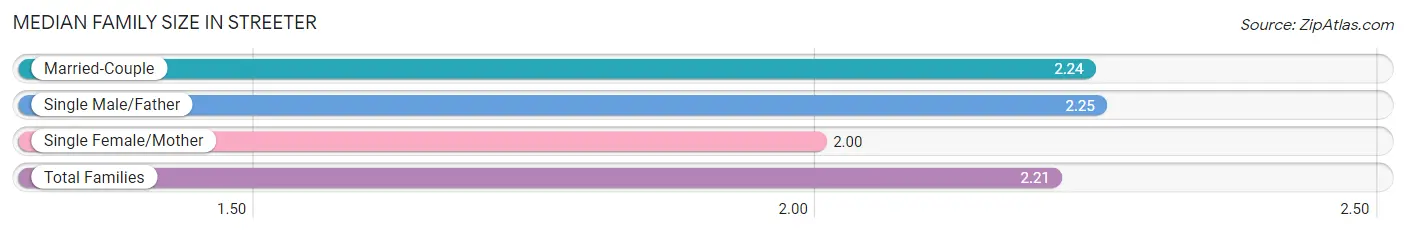
| Family Type | # Families | Family Size |
| Married-Couple | 21 (75.0%) | 2.24 |
| Single Male/Father | 4 (14.3%) | 2.25 |
| Single Female/Mother | 3 (10.7%) | 2.00 |
| Total Families | 28 (100.0%) | 2.21 |
Median Household Size in Streeter
The median household size in Streeter is 1.73 persons per household, with single male/father households (4 | 7.7%) accounting for the largest median household size of 2.25 persons per household. non-family households (24 | 46.2%) represent the smallest median household size with 1.17 persons per household.
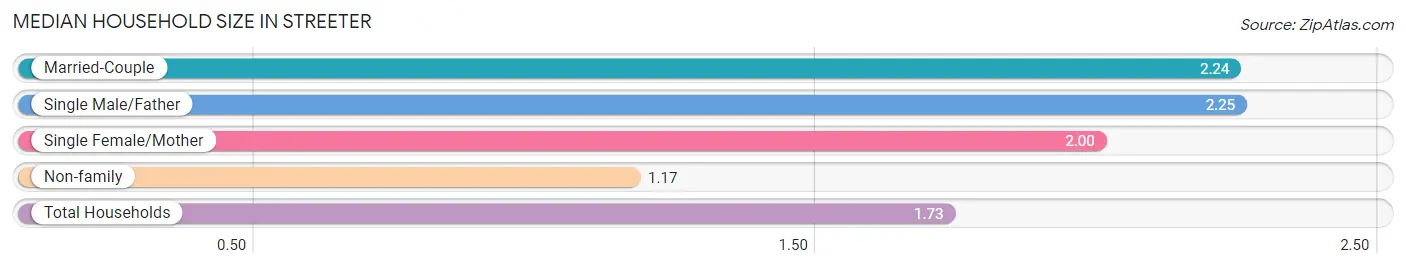
| Household Type | # Households | Household Size |
| Married-Couple | 21 (40.4%) | 2.24 |
| Single Male/Father | 4 (7.7%) | 2.25 |
| Single Female/Mother | 3 (5.8%) | 2.00 |
| Non-family | 24 (46.2%) | 1.17 |
| Total Households | 52 (100.0%) | 1.73 |
Household Size by Marriage Status in Streeter
Out of a total of 52 households in Streeter, 28 (53.8%) are family households, while 24 (46.2%) are nonfamily households. The most numerous type of family households are 2-person households, comprising 28, and the most common type of nonfamily households are 1-person households, comprising 20.
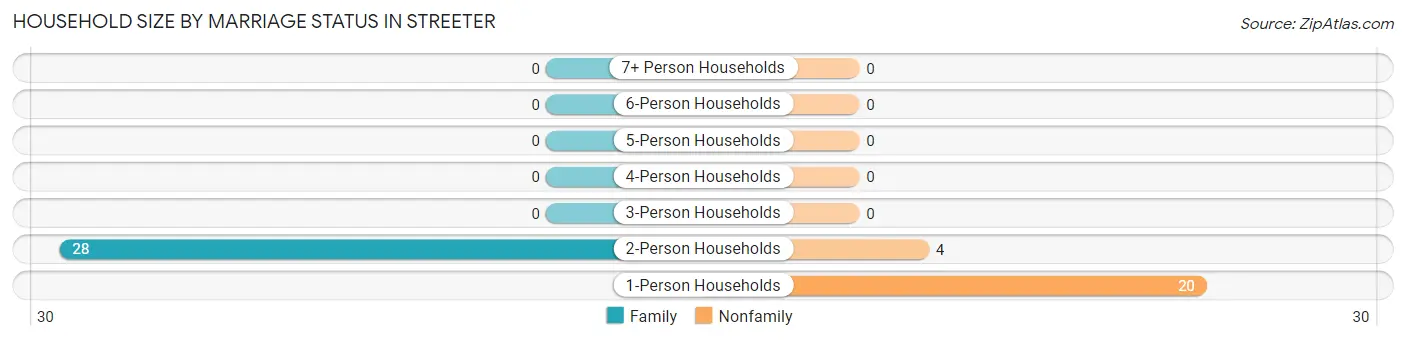
| Household Size | Family Households | Nonfamily Households |
| 1-Person Households | - | 20 (38.5%) |
| 2-Person Households | 28 (53.8%) | 4 (7.7%) |
| 3-Person Households | 0 (0.0%) | 0 (0.0%) |
| 4-Person Households | 0 (0.0%) | 0 (0.0%) |
| 5-Person Households | 0 (0.0%) | 0 (0.0%) |
| 6-Person Households | 0 (0.0%) | 0 (0.0%) |
| 7+ Person Households | 0 (0.0%) | 0 (0.0%) |
| Total | 28 (53.8%) | 24 (46.2%) |
Female Fertility in Streeter
Fertility by Age in Streeter
| Age Bracket | Women with Births | Births / 1,000 Women |
| 15 to 19 years | 0 (0.0%) | 0.0 |
| 20 to 34 years | 0 (0.0%) | 0.0 |
| 35 to 50 years | 0 (0.0%) | 0.0 |
| Total | 0 (0.0%) | 0.0 |
Fertility by Age by Marriage Status in Streeter
| Age Bracket | Married | Unmarried |
| 15 to 19 years | 0 (0.0%) | 0 (0.0%) |
| 20 to 34 years | 0 (0.0%) | 0 (0.0%) |
| 35 to 50 years | 0 (0.0%) | 0 (0.0%) |
| Total | 0 (0.0%) | 0 (0.0%) |
Fertility by Education in Streeter
| Educational Attainment | Women with Births | Births / 1,000 Women |
| Less than High School | 0 (0.0%) | 0.0 |
| High School Diploma | 0 (0.0%) | 0.0 |
| College or Associate's Degree | 0 (0.0%) | 0.0 |
| Bachelor's Degree | 0 (0.0%) | 0.0 |
| Graduate Degree | 0 (0.0%) | 0.0 |
| Total | 0 (0.0%) | 0.0 |
Fertility by Education by Marriage Status in Streeter
| Educational Attainment | Married | Unmarried |
| Less than High School | 0 (0.0%) | 0 (0.0%) |
| High School Diploma | 0 (0.0%) | 0 (0.0%) |
| College or Associate's Degree | 0 (0.0%) | 0 (0.0%) |
| Bachelor's Degree | 0 (0.0%) | 0 (0.0%) |
| Graduate Degree | 0 (0.0%) | 0 (0.0%) |
| Total | 0 (0.0%) | 0 (0.0%) |
Employment Characteristics in Streeter
Employment by Class of Employer in Streeter
Among the 39 employed individuals in Streeter, private company employees (29 | 74.4%), self-employed (incorporated) (3 | 7.7%), and self-employed (not incorporated) (3 | 7.7%) make up the most common classes of employment.
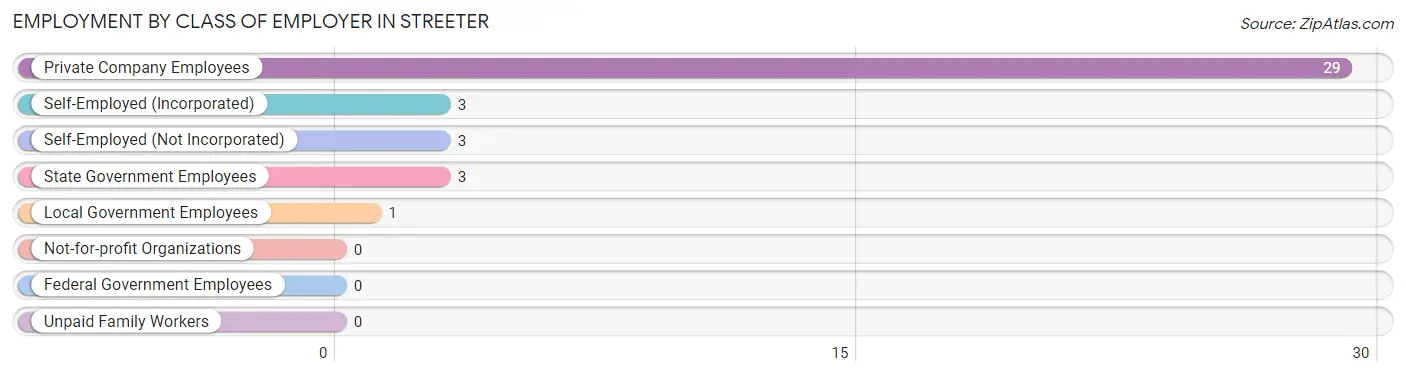
| Employer Class | # Employees | % Employees |
| Private Company Employees | 29 | 74.4% |
| Self-Employed (Incorporated) | 3 | 7.7% |
| Self-Employed (Not Incorporated) | 3 | 7.7% |
| Not-for-profit Organizations | 0 | 0.0% |
| Local Government Employees | 1 | 2.6% |
| State Government Employees | 3 | 7.7% |
| Federal Government Employees | 0 | 0.0% |
| Unpaid Family Workers | 0 | 0.0% |
| Total | 39 | 100.0% |
Employment Status by Age in Streeter
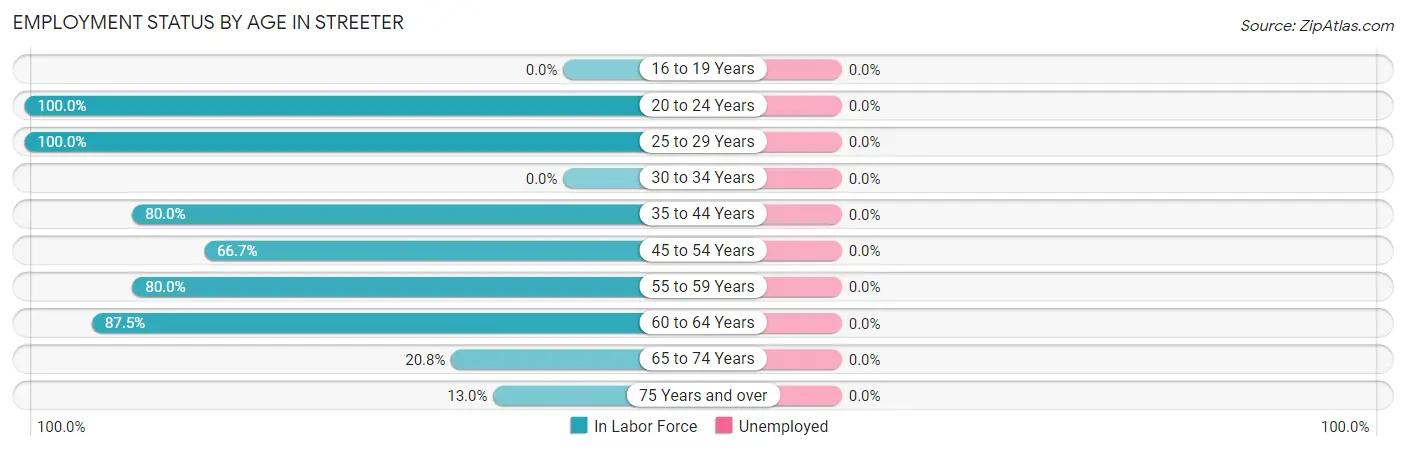
| Age Bracket | In Labor Force | Unemployed |
| 16 to 19 Years | 0 (0.0%) | 0 (0.0%) |
| 20 to 24 Years | 2 (100.0%) | 0 (0.0%) |
| 25 to 29 Years | 4 (100.0%) | 0 (0.0%) |
| 30 to 34 Years | 0 (0.0%) | 0 (0.0%) |
| 35 to 44 Years | 8 (80.0%) | 0 (0.0%) |
| 45 to 54 Years | 8 (66.7%) | 0 (0.0%) |
| 55 to 59 Years | 4 (80.0%) | 0 (0.0%) |
| 60 to 64 Years | 7 (87.5%) | 0 (0.0%) |
| 65 to 74 Years | 5 (20.8%) | 0 (0.0%) |
| 75 Years and over | 3 (13.0%) | 0 (0.0%) |
| Total | 41 (45.6%) | 0 (0.0%) |
Employment Status by Educational Attainment in Streeter
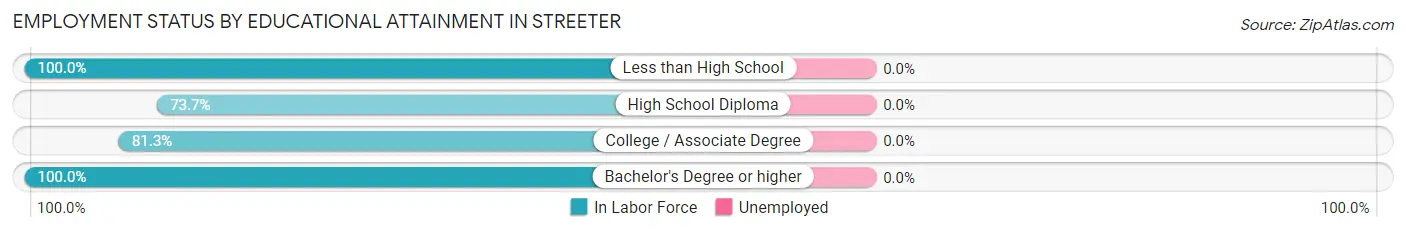
| Educational Attainment | In Labor Force | Unemployed |
| Less than High School | 2 (100.0%) | 0 (0.0%) |
| High School Diploma | 14 (73.7%) | 0 (0.0%) |
| College / Associate Degree | 13 (81.3%) | 0 (0.0%) |
| Bachelor's Degree or higher | 2 (100.0%) | 0 (0.0%) |
| Total | 31 (79.5%) | 0 (0.0%) |
Employment Occupations by Sex in Streeter
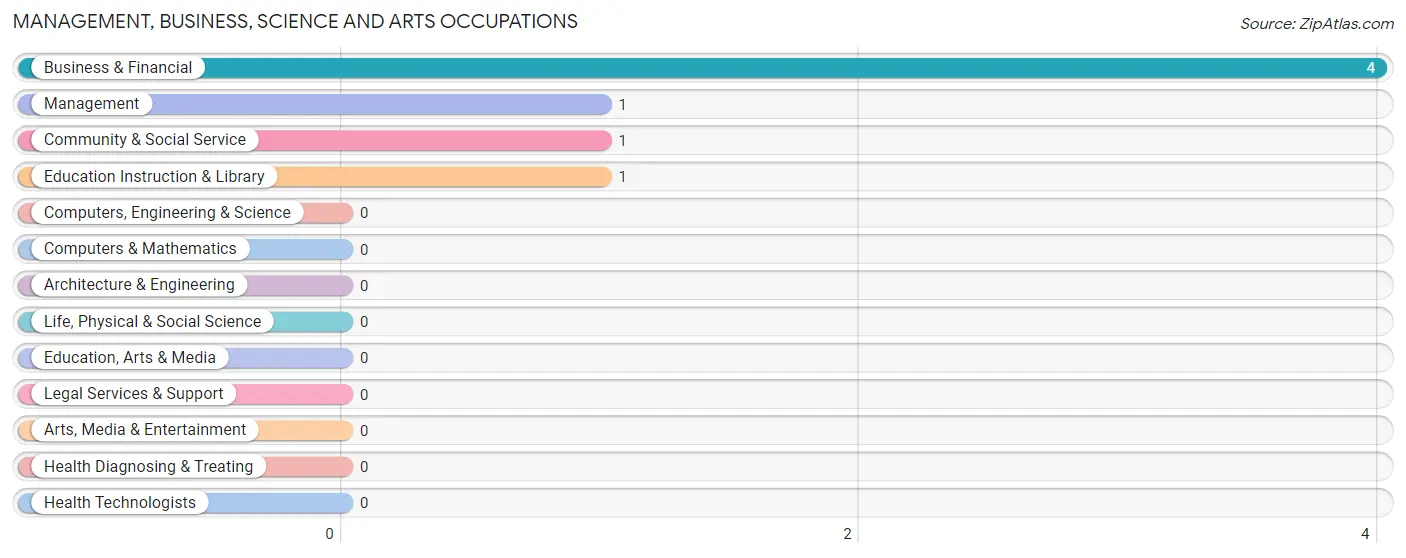
Management, Business, Science and Arts Occupations
The most common Management, Business, Science and Arts occupations in Streeter are Business & Financial (4 | 9.8%), Management (1 | 2.4%), Community & Social Service (1 | 2.4%), and Education Instruction & Library (1 | 2.4%).
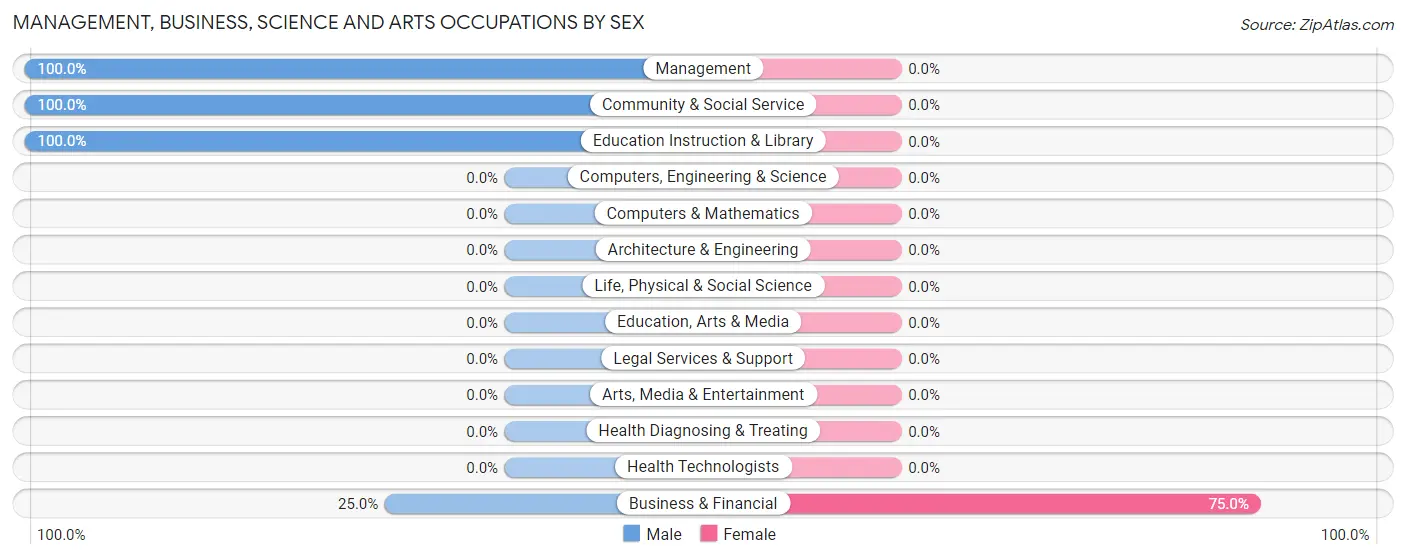
Management, Business, Science and Arts Occupations by Sex
| Occupation | Male | Female |
| Management | 1 (100.0%) | 0 (0.0%) |
| Business & Financial | 1 (25.0%) | 3 (75.0%) |
| Computers, Engineering & Science | 0 (0.0%) | 0 (0.0%) |
| Computers & Mathematics | 0 (0.0%) | 0 (0.0%) |
| Architecture & Engineering | 0 (0.0%) | 0 (0.0%) |
| Life, Physical & Social Science | 0 (0.0%) | 0 (0.0%) |
| Community & Social Service | 1 (100.0%) | 0 (0.0%) |
| Education, Arts & Media | 0 (0.0%) | 0 (0.0%) |
| Legal Services & Support | 0 (0.0%) | 0 (0.0%) |
| Education Instruction & Library | 1 (100.0%) | 0 (0.0%) |
| Arts, Media & Entertainment | 0 (0.0%) | 0 (0.0%) |
| Health Diagnosing & Treating | 0 (0.0%) | 0 (0.0%) |
| Health Technologists | 0 (0.0%) | 0 (0.0%) |
| Total (Category) | 3 (50.0%) | 3 (50.0%) |
| Total (Overall) | 24 (58.5%) | 17 (41.5%) |
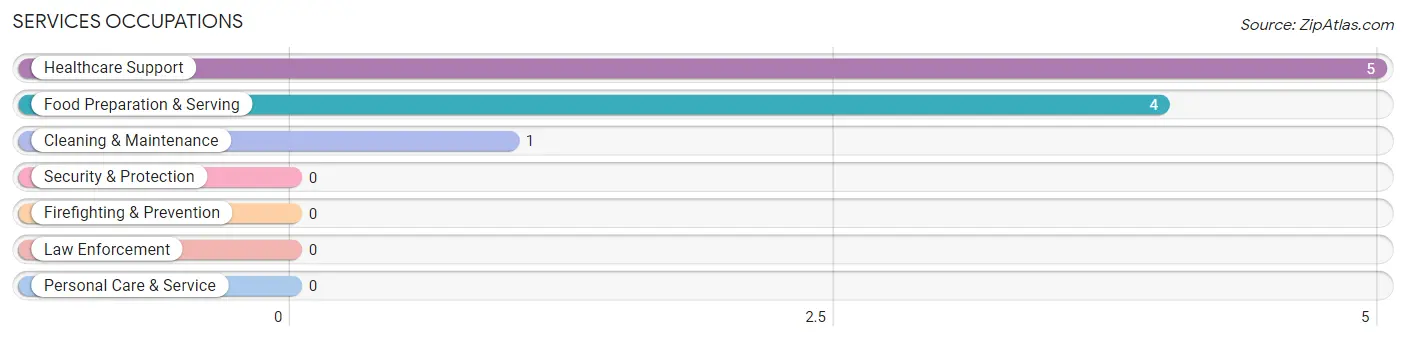
Services Occupations
The most common Services occupations in Streeter are Healthcare Support (5 | 12.2%), Food Preparation & Serving (4 | 9.8%), and Cleaning & Maintenance (1 | 2.4%).
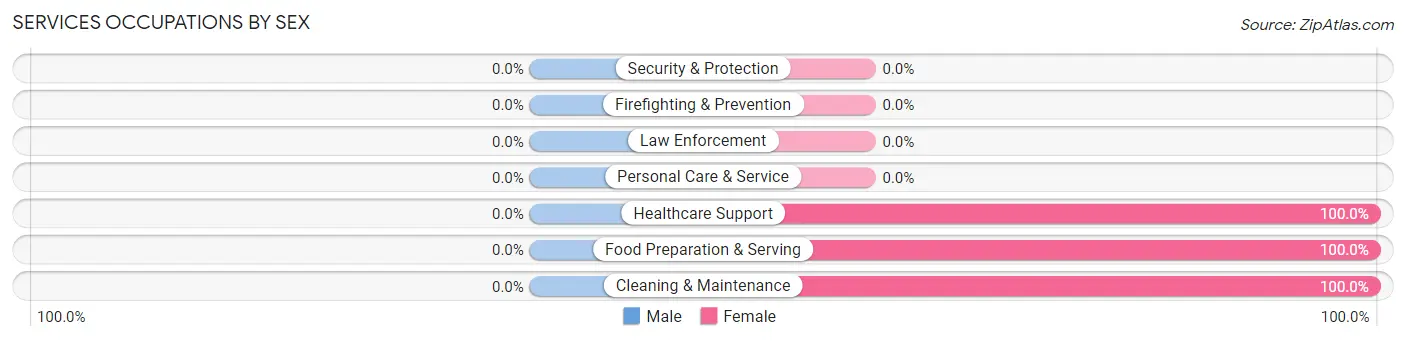
Services Occupations by Sex
| Occupation | Male | Female |
| Healthcare Support | 0 (0.0%) | 5 (100.0%) |
| Security & Protection | 0 (0.0%) | 0 (0.0%) |
| Firefighting & Prevention | 0 (0.0%) | 0 (0.0%) |
| Law Enforcement | 0 (0.0%) | 0 (0.0%) |
| Food Preparation & Serving | 0 (0.0%) | 4 (100.0%) |
| Cleaning & Maintenance | 0 (0.0%) | 1 (100.0%) |
| Personal Care & Service | 0 (0.0%) | 0 (0.0%) |
| Total (Category) | 0 (0.0%) | 10 (100.0%) |
| Total (Overall) | 24 (58.5%) | 17 (41.5%) |
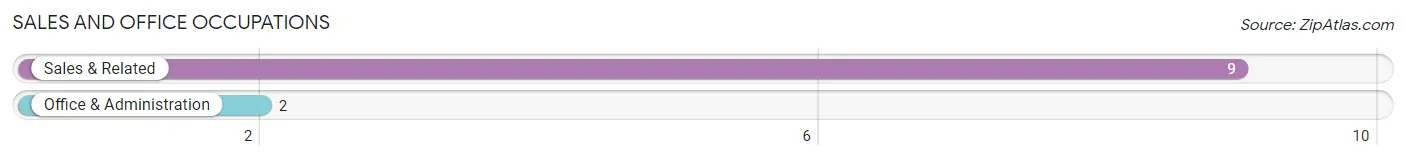
Sales and Office Occupations
The most common Sales and Office occupations in Streeter are Sales & Related (9 | 22.0%), and Office & Administration (2 | 4.9%).
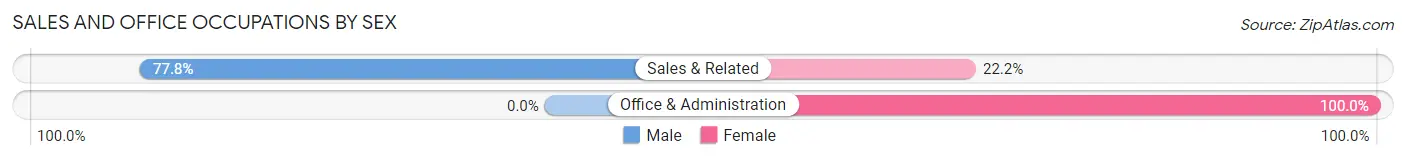
Sales and Office Occupations by Sex
| Occupation | Male | Female |
| Sales & Related | 7 (77.8%) | 2 (22.2%) |
| Office & Administration | 0 (0.0%) | 2 (100.0%) |
| Total (Category) | 7 (63.6%) | 4 (36.4%) |
| Total (Overall) | 24 (58.5%) | 17 (41.5%) |
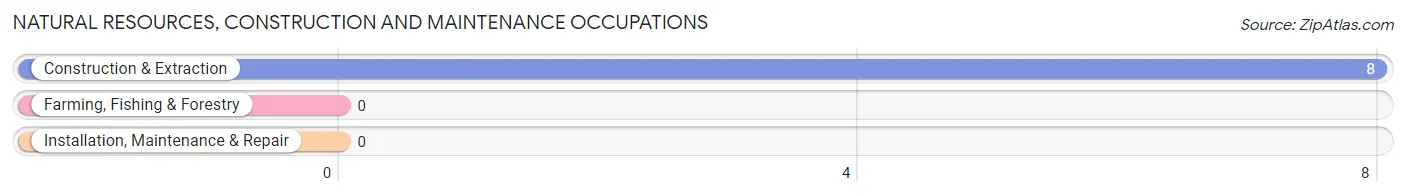
Natural Resources, Construction and Maintenance Occupations
The most common Natural Resources, Construction and Maintenance occupations in Streeter are , and Construction & Extraction (8 | 19.5%).
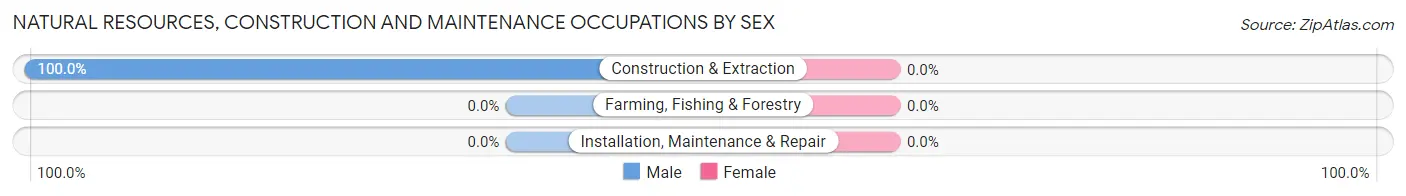
Natural Resources, Construction and Maintenance Occupations by Sex
| Occupation | Male | Female |
| Farming, Fishing & Forestry | 0 (0.0%) | 0 (0.0%) |
| Construction & Extraction | 8 (100.0%) | 0 (0.0%) |
| Installation, Maintenance & Repair | 0 (0.0%) | 0 (0.0%) |
| Total (Category) | 8 (100.0%) | 0 (0.0%) |
| Total (Overall) | 24 (58.5%) | 17 (41.5%) |
Production, Transportation and Moving Occupations
The most common Production, Transportation and Moving occupations in Streeter are Production (5 | 12.2%), and Transportation (1 | 2.4%).
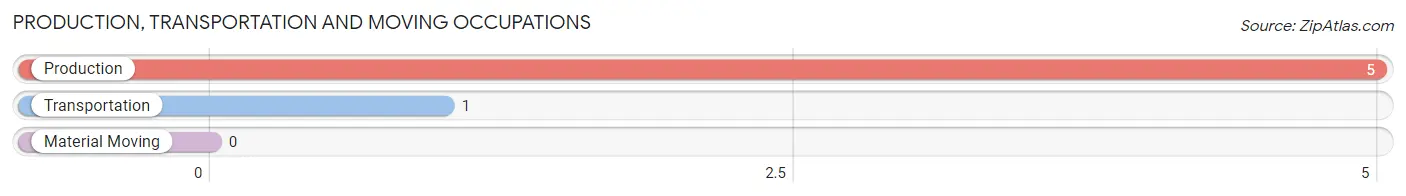
Production, Transportation and Moving Occupations by Sex
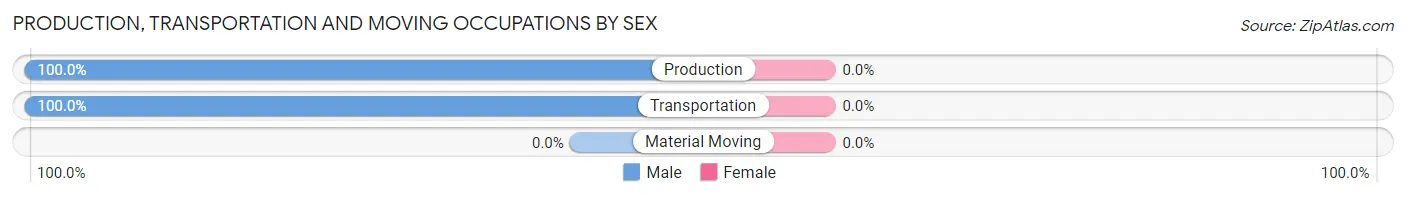
| Occupation | Male | Female |
| Production | 5 (100.0%) | 0 (0.0%) |
| Transportation | 1 (100.0%) | 0 (0.0%) |
| Material Moving | 0 (0.0%) | 0 (0.0%) |
| Total (Category) | 6 (100.0%) | 0 (0.0%) |
| Total (Overall) | 24 (58.5%) | 17 (41.5%) |
Employment Industries by Sex in Streeter
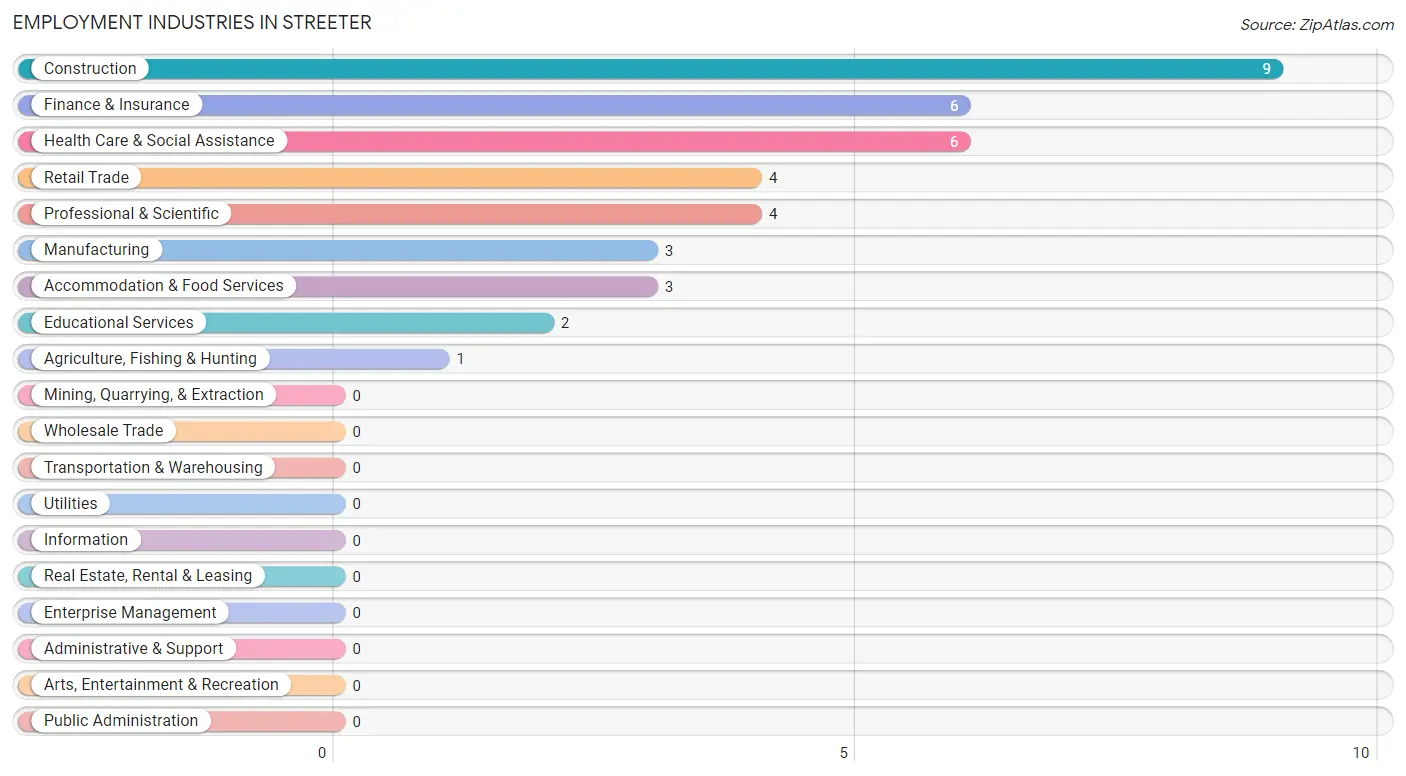
Employment Industries in Streeter
The major employment industries in Streeter include Construction (9 | 22.0%), Finance & Insurance (6 | 14.6%), Health Care & Social Assistance (6 | 14.6%), Retail Trade (4 | 9.8%), and Professional & Scientific (4 | 9.8%).
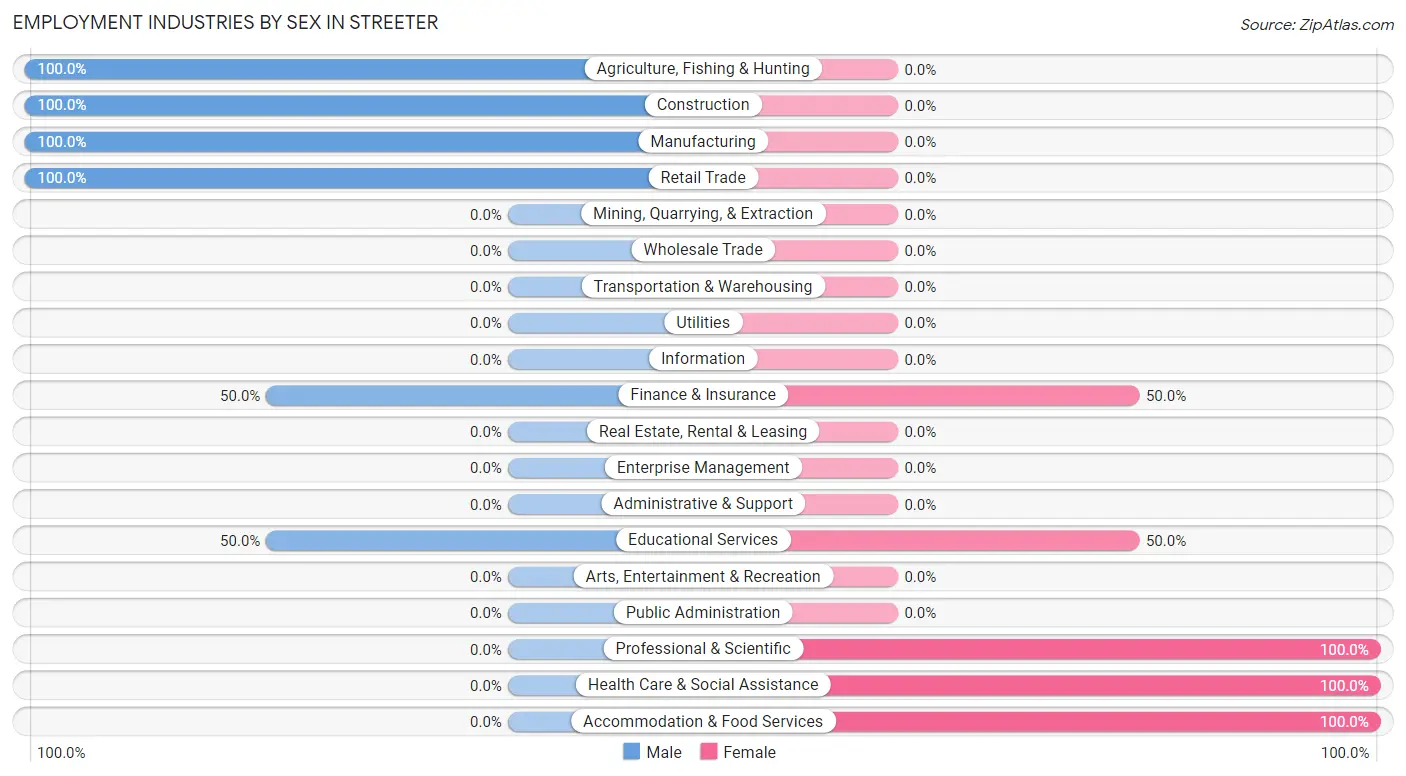
Employment Industries by Sex in Streeter
The Streeter industries that see more men than women are Agriculture, Fishing & Hunting (100.0%), Construction (100.0%), and Manufacturing (100.0%), whereas the industries that tend to have a higher number of women are Professional & Scientific (100.0%), Health Care & Social Assistance (100.0%), and Accommodation & Food Services (100.0%).
| Industry | Male | Female |
| Agriculture, Fishing & Hunting | 1 (100.0%) | 0 (0.0%) |
| Mining, Quarrying, & Extraction | 0 (0.0%) | 0 (0.0%) |
| Construction | 9 (100.0%) | 0 (0.0%) |
| Manufacturing | 3 (100.0%) | 0 (0.0%) |
| Wholesale Trade | 0 (0.0%) | 0 (0.0%) |
| Retail Trade | 4 (100.0%) | 0 (0.0%) |
| Transportation & Warehousing | 0 (0.0%) | 0 (0.0%) |
| Utilities | 0 (0.0%) | 0 (0.0%) |
| Information | 0 (0.0%) | 0 (0.0%) |
| Finance & Insurance | 3 (50.0%) | 3 (50.0%) |
| Real Estate, Rental & Leasing | 0 (0.0%) | 0 (0.0%) |
| Professional & Scientific | 0 (0.0%) | 4 (100.0%) |
| Enterprise Management | 0 (0.0%) | 0 (0.0%) |
| Administrative & Support | 0 (0.0%) | 0 (0.0%) |
| Educational Services | 1 (50.0%) | 1 (50.0%) |
| Health Care & Social Assistance | 0 (0.0%) | 6 (100.0%) |
| Arts, Entertainment & Recreation | 0 (0.0%) | 0 (0.0%) |
| Accommodation & Food Services | 0 (0.0%) | 3 (100.0%) |
| Public Administration | 0 (0.0%) | 0 (0.0%) |
| Total | 24 (58.5%) | 17 (41.5%) |
Education in Streeter
School Enrollment in Streeter
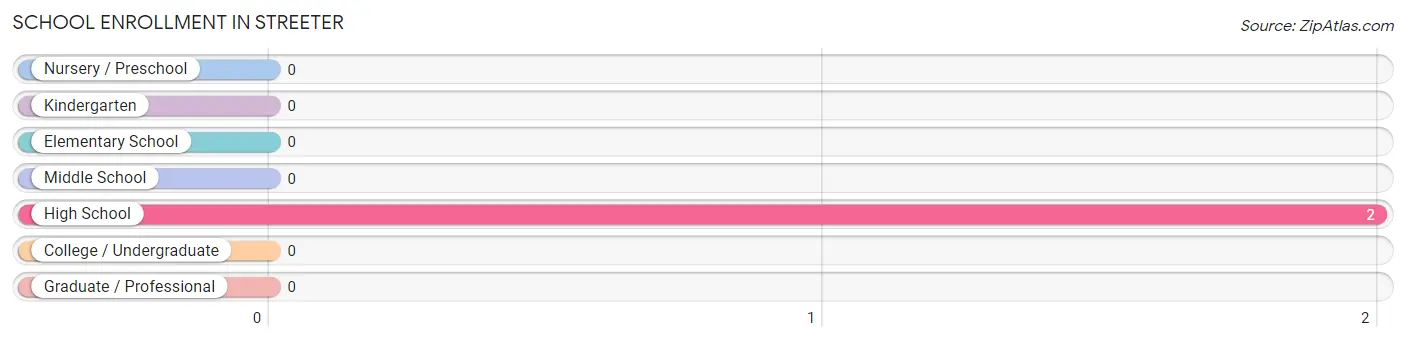
| School Level | # Students | % Students |
| Nursery / Preschool | 0 | 0.0% |
| Kindergarten | 0 | 0.0% |
| Elementary School | 0 | 0.0% |
| Middle School | 0 | 0.0% |
| High School | 2 | 100.0% |
| College / Undergraduate | 0 | 0.0% |
| Graduate / Professional | 0 | 0.0% |
| Total | 2 | 100.0% |
School Enrollment by Age by Funding Source in Streeter
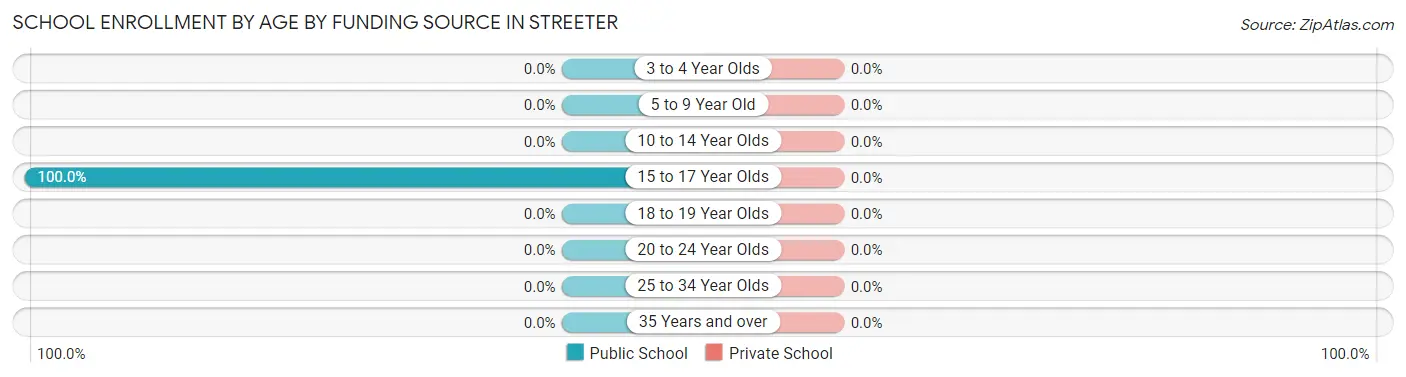
| Age Bracket | Public School | Private School |
| 3 to 4 Year Olds | 0 (0.0%) | 0 (0.0%) |
| 5 to 9 Year Old | 0 (0.0%) | 0 (0.0%) |
| 10 to 14 Year Olds | 0 (0.0%) | 0 (0.0%) |
| 15 to 17 Year Olds | 2 (100.0%) | 0 (0.0%) |
| 18 to 19 Year Olds | 0 (0.0%) | 0 (0.0%) |
| 20 to 24 Year Olds | 0 (0.0%) | 0 (0.0%) |
| 25 to 34 Year Olds | 0 (0.0%) | 0 (0.0%) |
| 35 Years and over | 0 (0.0%) | 0 (0.0%) |
| Total | 2 (100.0%) | 0 (0.0%) |
Educational Attainment by Field of Study in Streeter
Bio, nature & agricultural (6 | 75.0%), business (1 | 12.5%), and education (1 | 12.5%) are the most common fields of study among 8 individuals in Streeter who have obtained a bachelor's degree or higher.
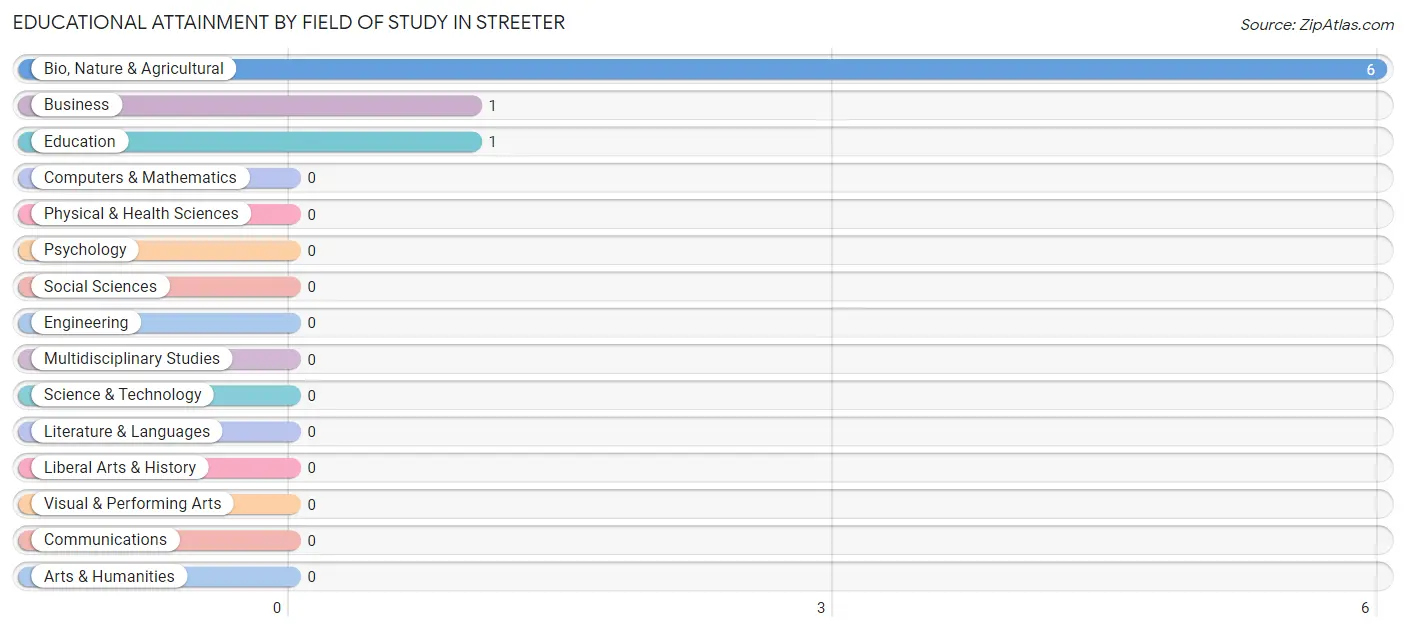
| Field of Study | # Graduates | % Graduates |
| Computers & Mathematics | 0 | 0.0% |
| Bio, Nature & Agricultural | 6 | 75.0% |
| Physical & Health Sciences | 0 | 0.0% |
| Psychology | 0 | 0.0% |
| Social Sciences | 0 | 0.0% |
| Engineering | 0 | 0.0% |
| Multidisciplinary Studies | 0 | 0.0% |
| Science & Technology | 0 | 0.0% |
| Business | 1 | 12.5% |
| Education | 1 | 12.5% |
| Literature & Languages | 0 | 0.0% |
| Liberal Arts & History | 0 | 0.0% |
| Visual & Performing Arts | 0 | 0.0% |
| Communications | 0 | 0.0% |
| Arts & Humanities | 0 | 0.0% |
| Total | 8 | 100.0% |
Transportation & Commute in Streeter
Vehicle Availability by Sex in Streeter
The most prevalent vehicle ownership categories in Streeter are males with 3 vehicles (13, accounting for 54.2%) and females with 3 vehicles (3, making up 86.7%).
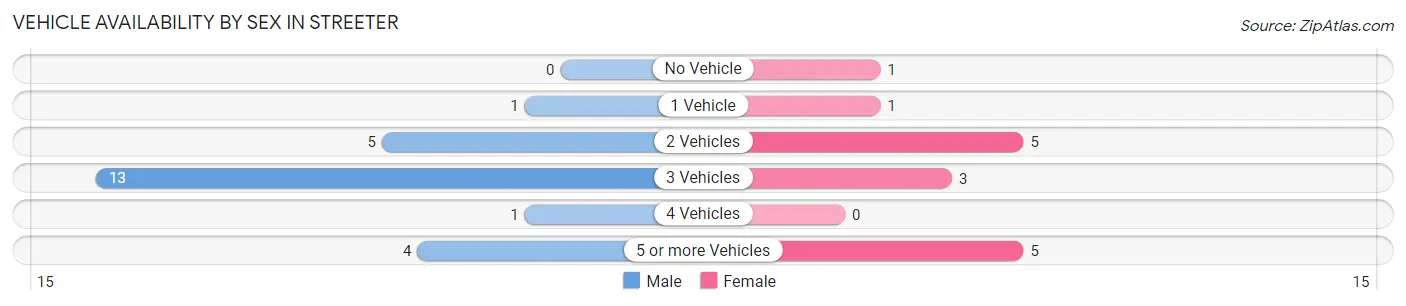
| Vehicles Available | Male | Female |
| No Vehicle | 0 (0.0%) | 1 (6.7%) |
| 1 Vehicle | 1 (4.2%) | 1 (6.7%) |
| 2 Vehicles | 5 (20.8%) | 5 (33.3%) |
| 3 Vehicles | 13 (54.2%) | 3 (20.0%) |
| 4 Vehicles | 1 (4.2%) | 0 (0.0%) |
| 5 or more Vehicles | 4 (16.7%) | 5 (33.3%) |
| Total | 24 (100.0%) | 15 (100.0%) |
Commute Time in Streeter
The most frequently occuring commute durations in Streeter are less than 5 minutes (11 commuters, 28.2%), 10 to 14 minutes (8 commuters, 20.5%), and 15 to 19 minutes (7 commuters, 17.9%).
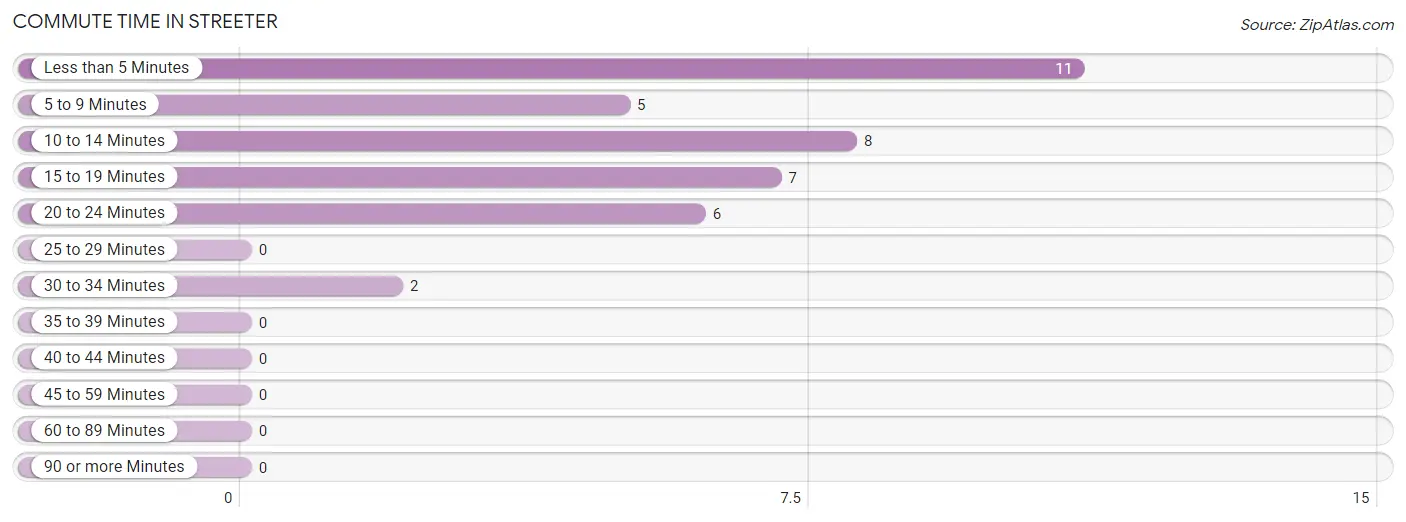
| Commute Time | # Commuters | % Commuters |
| Less than 5 Minutes | 11 | 28.2% |
| 5 to 9 Minutes | 5 | 12.8% |
| 10 to 14 Minutes | 8 | 20.5% |
| 15 to 19 Minutes | 7 | 17.9% |
| 20 to 24 Minutes | 6 | 15.4% |
| 25 to 29 Minutes | 0 | 0.0% |
| 30 to 34 Minutes | 2 | 5.1% |
| 35 to 39 Minutes | 0 | 0.0% |
| 40 to 44 Minutes | 0 | 0.0% |
| 45 to 59 Minutes | 0 | 0.0% |
| 60 to 89 Minutes | 0 | 0.0% |
| 90 or more Minutes | 0 | 0.0% |
Commute Time by Sex in Streeter
The most common commute times in Streeter are less than 5 minutes (7 commuters, 29.2%) for males and less than 5 minutes (4 commuters, 26.7%) for females.
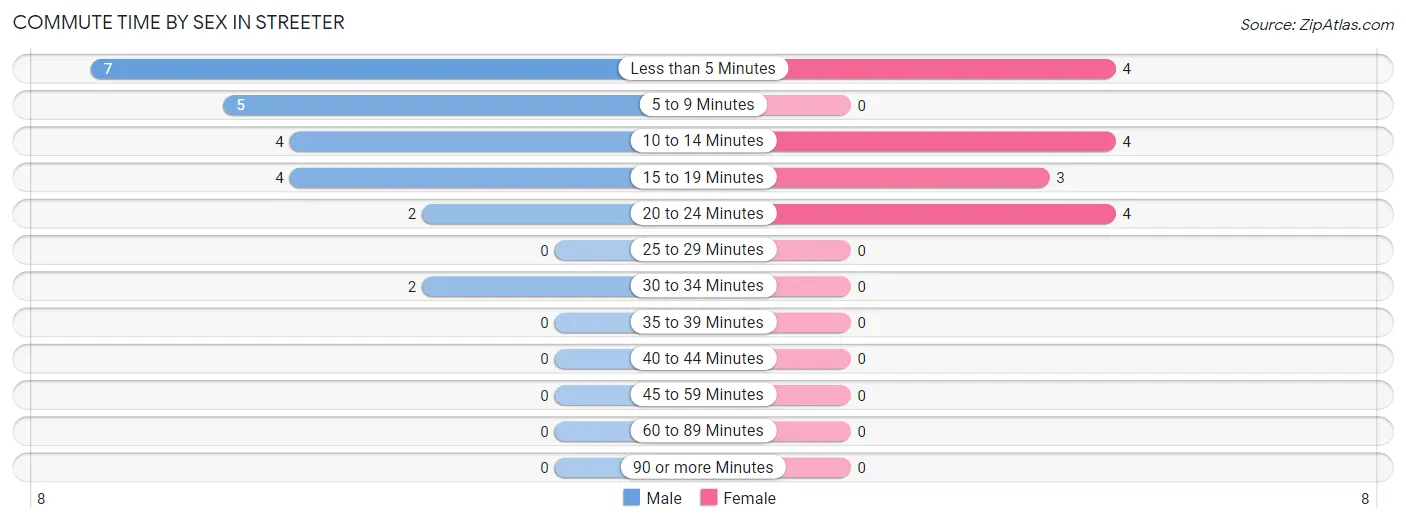
| Commute Time | Male | Female |
| Less than 5 Minutes | 7 (29.2%) | 4 (26.7%) |
| 5 to 9 Minutes | 5 (20.8%) | 0 (0.0%) |
| 10 to 14 Minutes | 4 (16.7%) | 4 (26.7%) |
| 15 to 19 Minutes | 4 (16.7%) | 3 (20.0%) |
| 20 to 24 Minutes | 2 (8.3%) | 4 (26.7%) |
| 25 to 29 Minutes | 0 (0.0%) | 0 (0.0%) |
| 30 to 34 Minutes | 2 (8.3%) | 0 (0.0%) |
| 35 to 39 Minutes | 0 (0.0%) | 0 (0.0%) |
| 40 to 44 Minutes | 0 (0.0%) | 0 (0.0%) |
| 45 to 59 Minutes | 0 (0.0%) | 0 (0.0%) |
| 60 to 89 Minutes | 0 (0.0%) | 0 (0.0%) |
| 90 or more Minutes | 0 (0.0%) | 0 (0.0%) |
Time of Departure to Work by Sex in Streeter
The most frequent times of departure to work in Streeter are 6:30 AM to 6:59 AM (7, 29.2%) for males and 12:00 PM to 3:59 PM (6, 40.0%) for females.
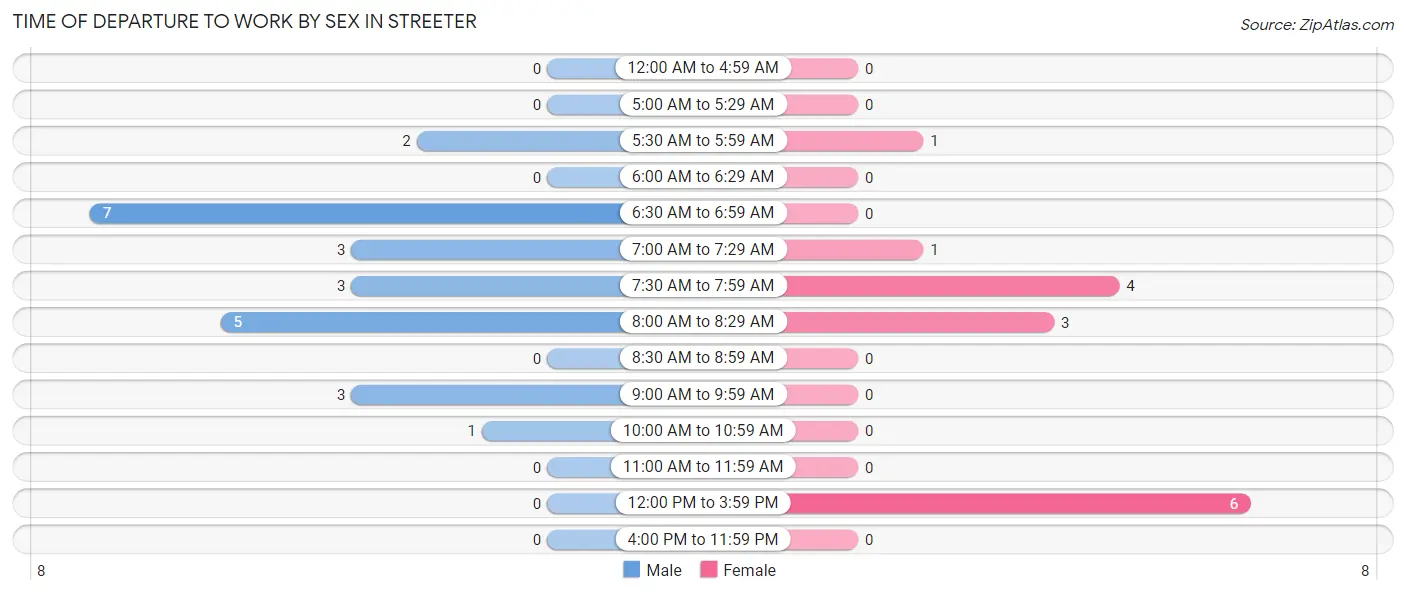
| Time of Departure | Male | Female |
| 12:00 AM to 4:59 AM | 0 (0.0%) | 0 (0.0%) |
| 5:00 AM to 5:29 AM | 0 (0.0%) | 0 (0.0%) |
| 5:30 AM to 5:59 AM | 2 (8.3%) | 1 (6.7%) |
| 6:00 AM to 6:29 AM | 0 (0.0%) | 0 (0.0%) |
| 6:30 AM to 6:59 AM | 7 (29.2%) | 0 (0.0%) |
| 7:00 AM to 7:29 AM | 3 (12.5%) | 1 (6.7%) |
| 7:30 AM to 7:59 AM | 3 (12.5%) | 4 (26.7%) |
| 8:00 AM to 8:29 AM | 5 (20.8%) | 3 (20.0%) |
| 8:30 AM to 8:59 AM | 0 (0.0%) | 0 (0.0%) |
| 9:00 AM to 9:59 AM | 3 (12.5%) | 0 (0.0%) |
| 10:00 AM to 10:59 AM | 1 (4.2%) | 0 (0.0%) |
| 11:00 AM to 11:59 AM | 0 (0.0%) | 0 (0.0%) |
| 12:00 PM to 3:59 PM | 0 (0.0%) | 6 (40.0%) |
| 4:00 PM to 11:59 PM | 0 (0.0%) | 0 (0.0%) |
| Total | 24 (100.0%) | 15 (100.0%) |
Housing Occupancy in Streeter
Occupancy by Ownership in Streeter
Of the total 52 dwellings in Streeter, owner-occupied units account for 45 (86.5%), while renter-occupied units make up 7 (13.5%).
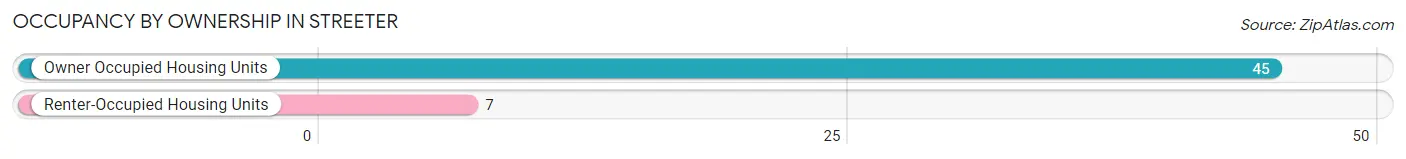
| Occupancy | # Housing Units | % Housing Units |
| Owner Occupied Housing Units | 45 | 86.5% |
| Renter-Occupied Housing Units | 7 | 13.5% |
| Total Occupied Housing Units | 52 | 100.0% |
Occupancy by Household Size in Streeter
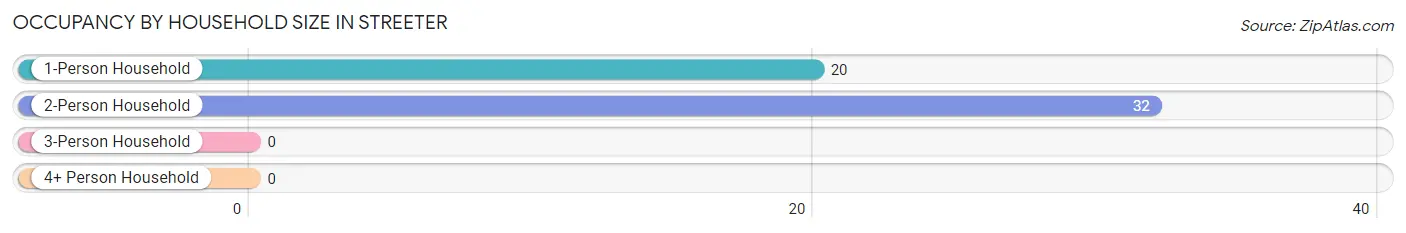
| Household Size | # Housing Units | % Housing Units |
| 1-Person Household | 20 | 38.5% |
| 2-Person Household | 32 | 61.5% |
| 3-Person Household | 0 | 0.0% |
| 4+ Person Household | 0 | 0.0% |
| Total Housing Units | 52 | 100.0% |
Occupancy by Ownership by Household Size in Streeter
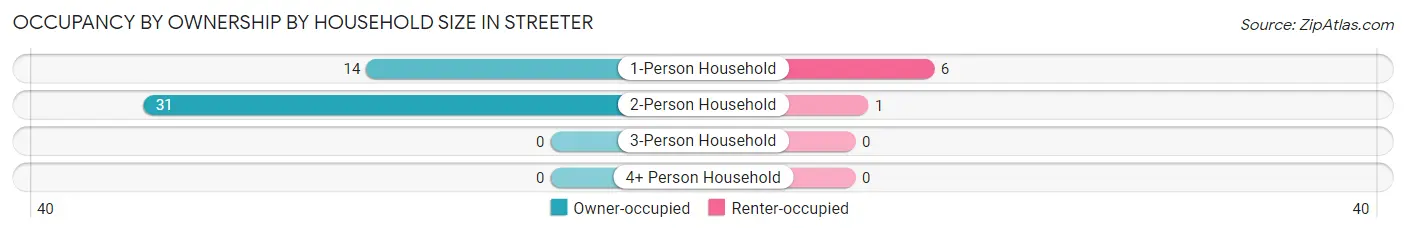
| Household Size | Owner-occupied | Renter-occupied |
| 1-Person Household | 14 (70.0%) | 6 (30.0%) |
| 2-Person Household | 31 (96.9%) | 1 (3.1%) |
| 3-Person Household | 0 (0.0%) | 0 (0.0%) |
| 4+ Person Household | 0 (0.0%) | 0 (0.0%) |
| Total Housing Units | 45 (86.5%) | 7 (13.5%) |
Occupancy by Educational Attainment in Streeter
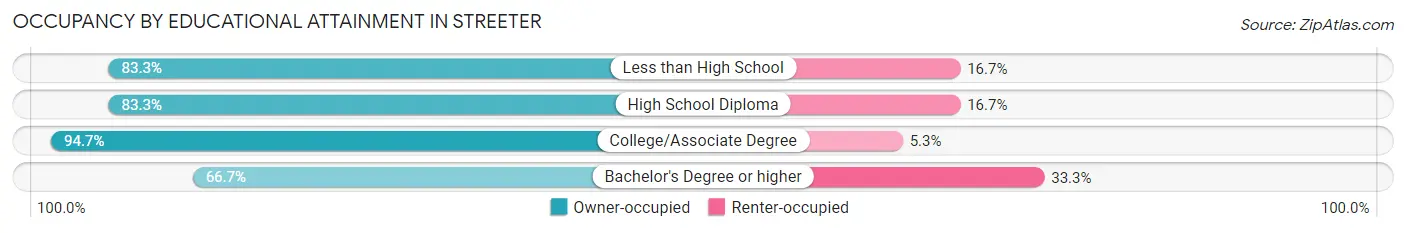
| Household Size | Owner-occupied | Renter-occupied |
| Less than High School | 5 (83.3%) | 1 (16.7%) |
| High School Diploma | 20 (83.3%) | 4 (16.7%) |
| College/Associate Degree | 18 (94.7%) | 1 (5.3%) |
| Bachelor's Degree or higher | 2 (66.7%) | 1 (33.3%) |
Occupancy by Age of Householder in Streeter
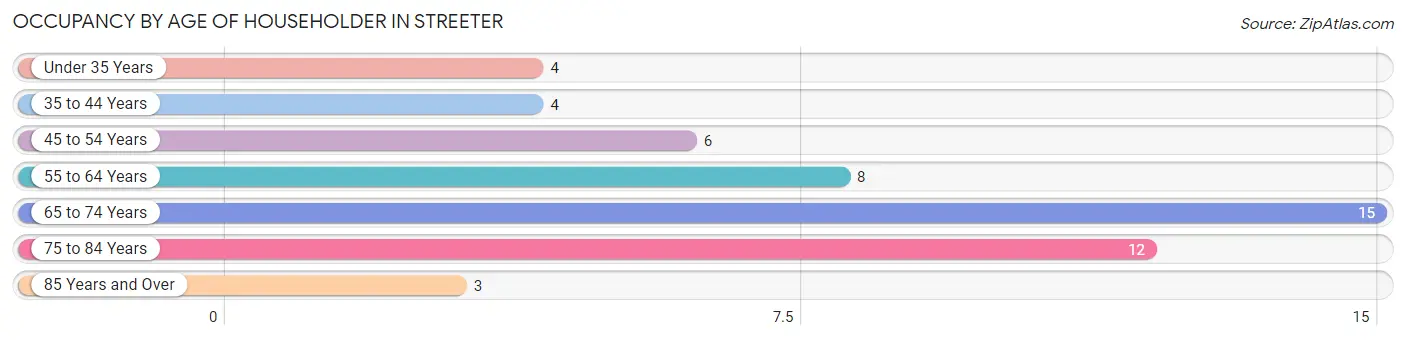
| Age Bracket | # Households | % Households |
| Under 35 Years | 4 | 7.7% |
| 35 to 44 Years | 4 | 7.7% |
| 45 to 54 Years | 6 | 11.5% |
| 55 to 64 Years | 8 | 15.4% |
| 65 to 74 Years | 15 | 28.8% |
| 75 to 84 Years | 12 | 23.1% |
| 85 Years and Over | 3 | 5.8% |
| Total | 52 | 100.0% |
Housing Finances in Streeter
Median Income by Occupancy in Streeter
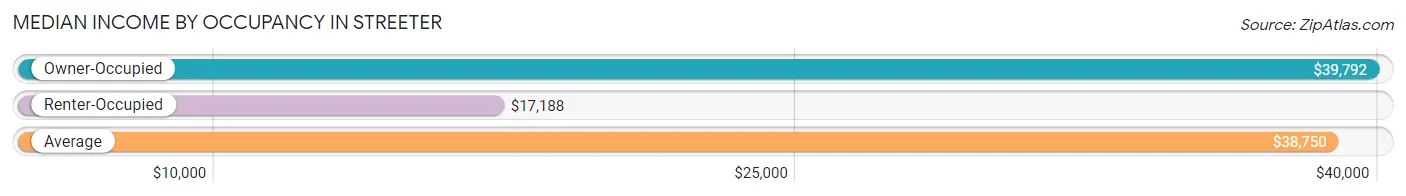
| Occupancy Type | # Households | Median Income |
| Owner-Occupied | 45 (86.5%) | $39,792 |
| Renter-Occupied | 7 (13.5%) | $17,188 |
| Average | 52 (100.0%) | $38,750 |
Occupancy by Householder Income Bracket in Streeter
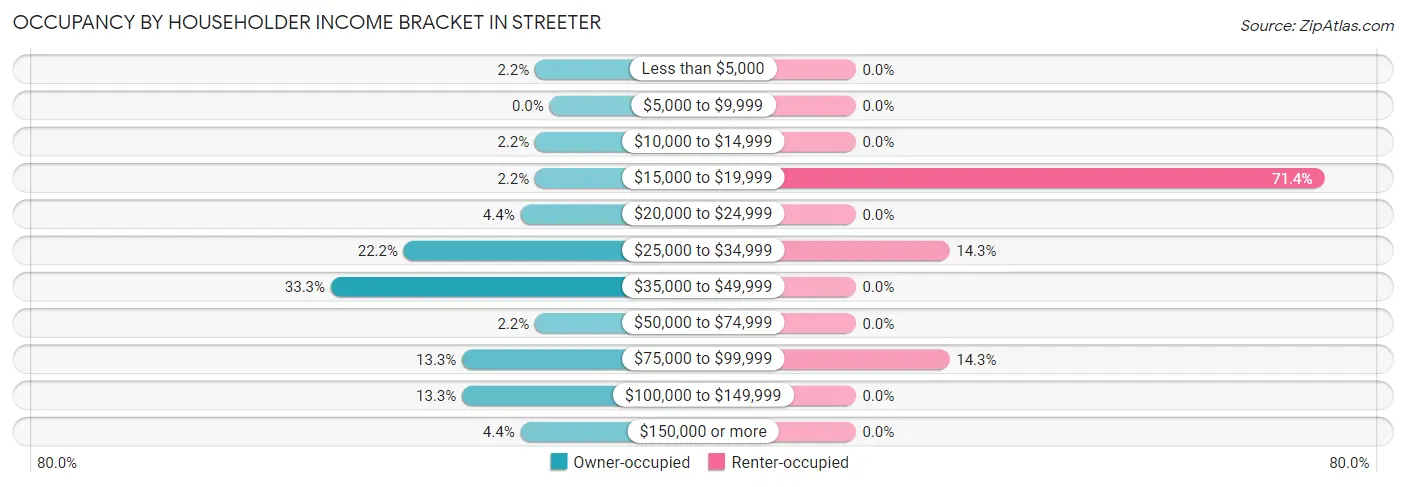
| Income Bracket | Owner-occupied | Renter-occupied |
| Less than $5,000 | 1 (2.2%) | 0 (0.0%) |
| $5,000 to $9,999 | 0 (0.0%) | 0 (0.0%) |
| $10,000 to $14,999 | 1 (2.2%) | 0 (0.0%) |
| $15,000 to $19,999 | 1 (2.2%) | 5 (71.4%) |
| $20,000 to $24,999 | 2 (4.4%) | 0 (0.0%) |
| $25,000 to $34,999 | 10 (22.2%) | 1 (14.3%) |
| $35,000 to $49,999 | 15 (33.3%) | 0 (0.0%) |
| $50,000 to $74,999 | 1 (2.2%) | 0 (0.0%) |
| $75,000 to $99,999 | 6 (13.3%) | 1 (14.3%) |
| $100,000 to $149,999 | 6 (13.3%) | 0 (0.0%) |
| $150,000 or more | 2 (4.4%) | 0 (0.0%) |
| Total | 45 (100.0%) | 7 (100.0%) |
Monthly Housing Cost Tiers in Streeter
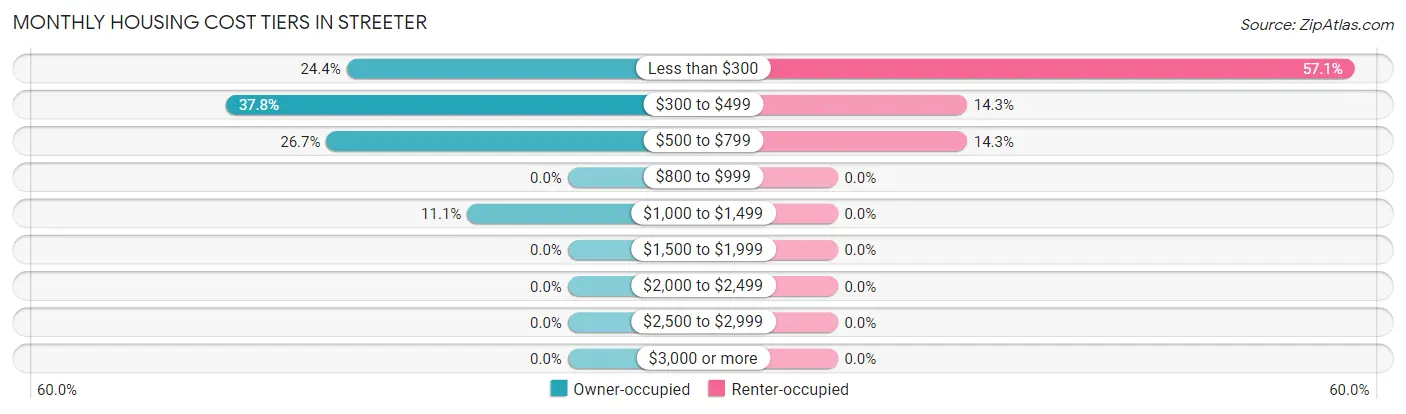
| Monthly Cost | Owner-occupied | Renter-occupied |
| Less than $300 | 11 (24.4%) | 4 (57.1%) |
| $300 to $499 | 17 (37.8%) | 1 (14.3%) |
| $500 to $799 | 12 (26.7%) | 1 (14.3%) |
| $800 to $999 | 0 (0.0%) | 0 (0.0%) |
| $1,000 to $1,499 | 5 (11.1%) | 0 (0.0%) |
| $1,500 to $1,999 | 0 (0.0%) | 0 (0.0%) |
| $2,000 to $2,499 | 0 (0.0%) | 0 (0.0%) |
| $2,500 to $2,999 | 0 (0.0%) | 0 (0.0%) |
| $3,000 or more | 0 (0.0%) | 0 (0.0%) |
| Total | 45 (100.0%) | 7 (100.0%) |
Physical Housing Characteristics in Streeter
Housing Structures in Streeter
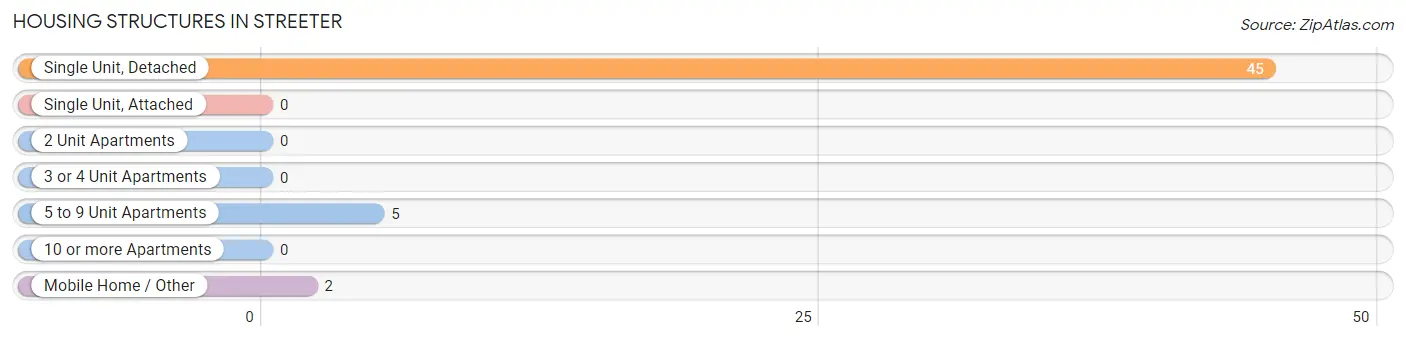
| Structure Type | # Housing Units | % Housing Units |
| Single Unit, Detached | 45 | 86.5% |
| Single Unit, Attached | 0 | 0.0% |
| 2 Unit Apartments | 0 | 0.0% |
| 3 or 4 Unit Apartments | 0 | 0.0% |
| 5 to 9 Unit Apartments | 5 | 9.6% |
| 10 or more Apartments | 0 | 0.0% |
| Mobile Home / Other | 2 | 3.8% |
| Total | 52 | 100.0% |
Housing Structures by Occupancy in Streeter
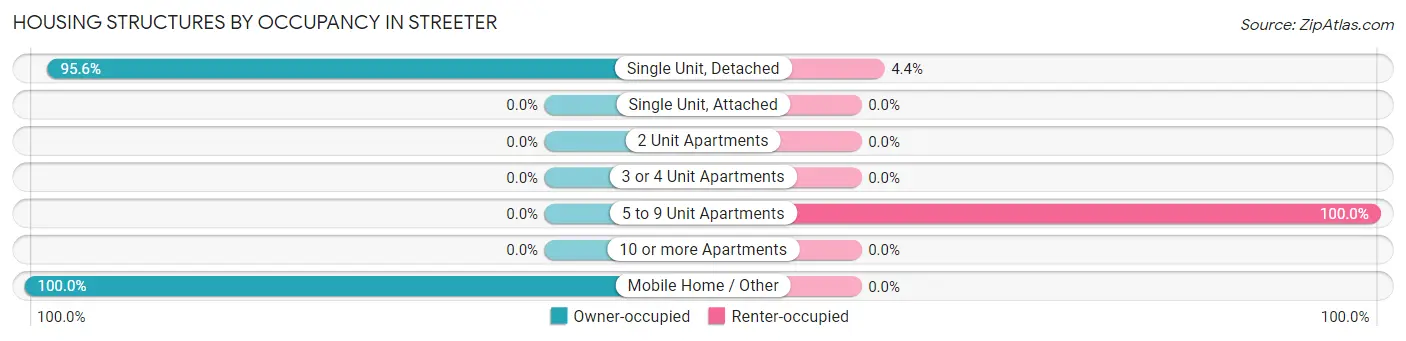
| Structure Type | Owner-occupied | Renter-occupied |
| Single Unit, Detached | 43 (95.6%) | 2 (4.4%) |
| Single Unit, Attached | 0 (0.0%) | 0 (0.0%) |
| 2 Unit Apartments | 0 (0.0%) | 0 (0.0%) |
| 3 or 4 Unit Apartments | 0 (0.0%) | 0 (0.0%) |
| 5 to 9 Unit Apartments | 0 (0.0%) | 5 (100.0%) |
| 10 or more Apartments | 0 (0.0%) | 0 (0.0%) |
| Mobile Home / Other | 2 (100.0%) | 0 (0.0%) |
| Total | 45 (86.5%) | 7 (13.5%) |
Housing Structures by Number of Rooms in Streeter
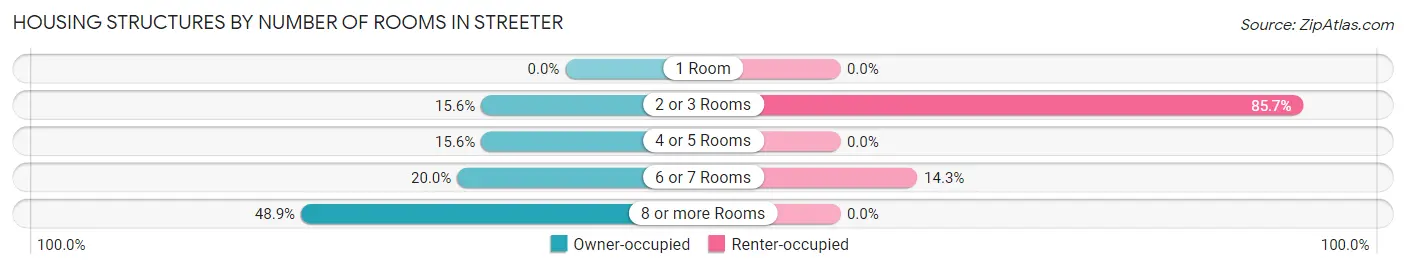
| Number of Rooms | Owner-occupied | Renter-occupied |
| 1 Room | 0 (0.0%) | 0 (0.0%) |
| 2 or 3 Rooms | 7 (15.6%) | 6 (85.7%) |
| 4 or 5 Rooms | 7 (15.6%) | 0 (0.0%) |
| 6 or 7 Rooms | 9 (20.0%) | 1 (14.3%) |
| 8 or more Rooms | 22 (48.9%) | 0 (0.0%) |
| Total | 45 (100.0%) | 7 (100.0%) |
Housing Structure by Heating Type in Streeter
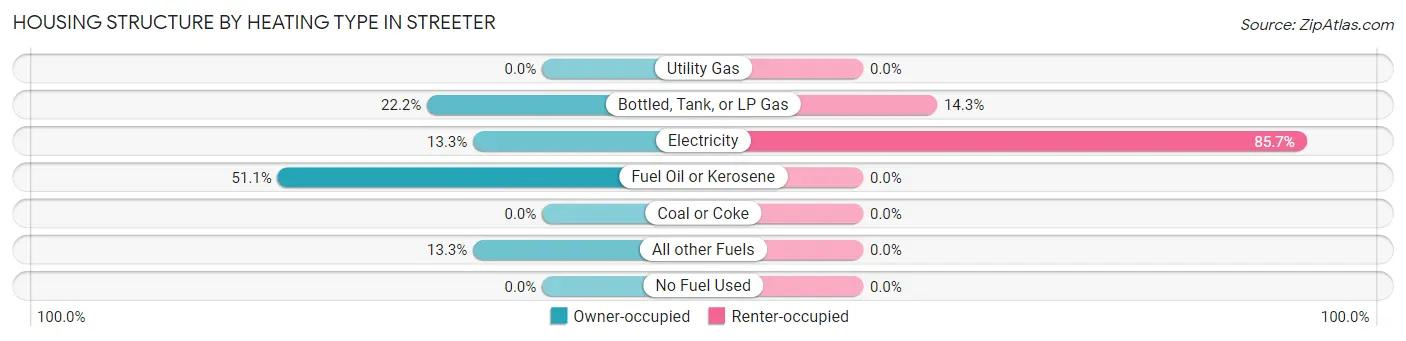
| Heating Type | Owner-occupied | Renter-occupied |
| Utility Gas | 0 (0.0%) | 0 (0.0%) |
| Bottled, Tank, or LP Gas | 10 (22.2%) | 1 (14.3%) |
| Electricity | 6 (13.3%) | 6 (85.7%) |
| Fuel Oil or Kerosene | 23 (51.1%) | 0 (0.0%) |
| Coal or Coke | 0 (0.0%) | 0 (0.0%) |
| All other Fuels | 6 (13.3%) | 0 (0.0%) |
| No Fuel Used | 0 (0.0%) | 0 (0.0%) |
| Total | 45 (100.0%) | 7 (100.0%) |
Household Vehicle Usage in Streeter
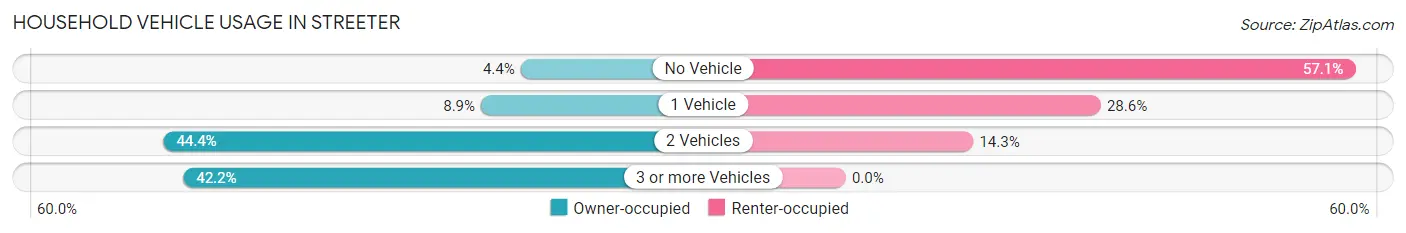
| Vehicles per Household | Owner-occupied | Renter-occupied |
| No Vehicle | 2 (4.4%) | 4 (57.1%) |
| 1 Vehicle | 4 (8.9%) | 2 (28.6%) |
| 2 Vehicles | 20 (44.4%) | 1 (14.3%) |
| 3 or more Vehicles | 19 (42.2%) | 0 (0.0%) |
| Total | 45 (100.0%) | 7 (100.0%) |
Real Estate & Mortgages in Streeter
Real Estate and Mortgage Overview in Streeter
| Characteristic | Without Mortgage | With Mortgage |
| Housing Units | 38 | 7 |
| Median Property Value | $57,800 | $0 |
| Median Household Income | $39,167 | $2 |
| Monthly Housing Costs | $431 | $0 |
| Real Estate Taxes | $625 | $0 |
Property Value by Mortgage Status in Streeter
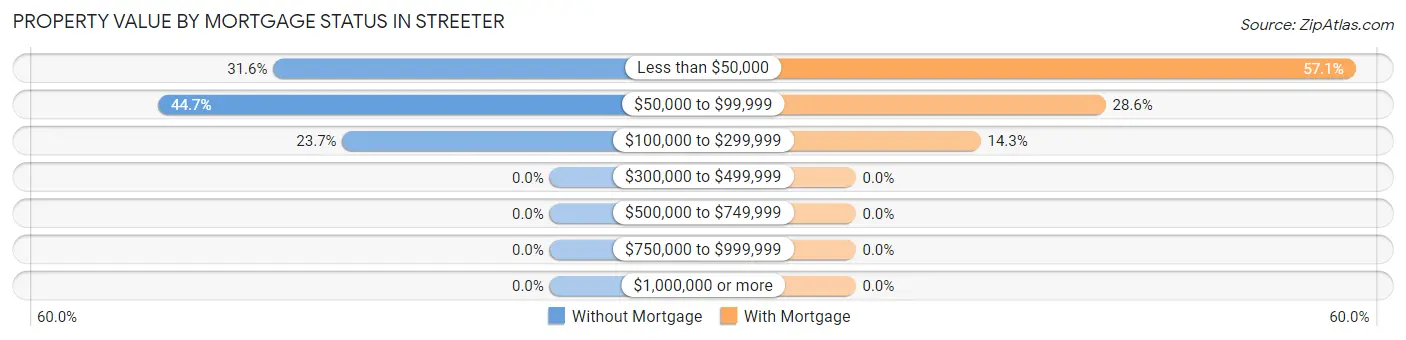
| Property Value | Without Mortgage | With Mortgage |
| Less than $50,000 | 12 (31.6%) | 4 (57.1%) |
| $50,000 to $99,999 | 17 (44.7%) | 2 (28.6%) |
| $100,000 to $299,999 | 9 (23.7%) | 1 (14.3%) |
| $300,000 to $499,999 | 0 (0.0%) | 0 (0.0%) |
| $500,000 to $749,999 | 0 (0.0%) | 0 (0.0%) |
| $750,000 to $999,999 | 0 (0.0%) | 0 (0.0%) |
| $1,000,000 or more | 0 (0.0%) | 0 (0.0%) |
| Total | 38 (100.0%) | 7 (100.0%) |
Household Income by Mortgage Status in Streeter
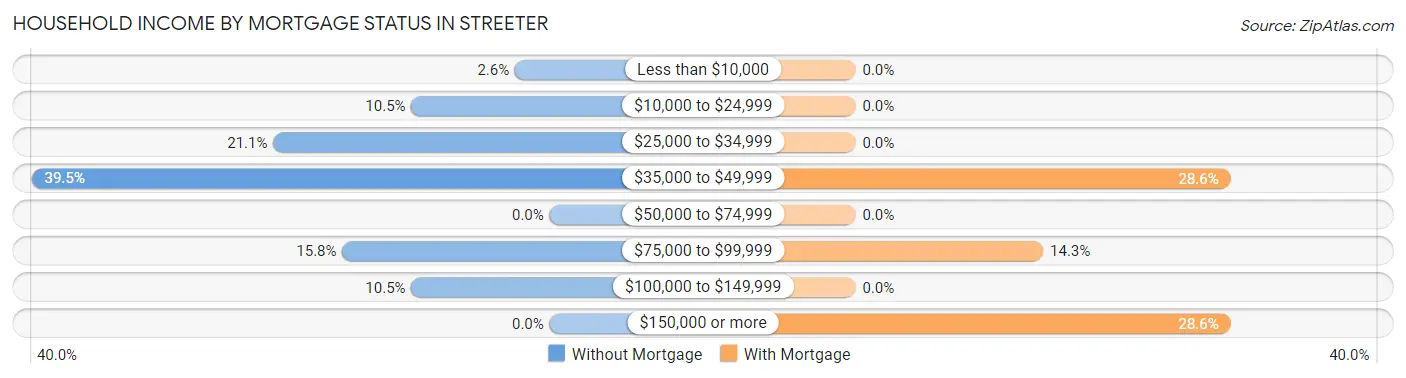
| Household Income | Without Mortgage | With Mortgage |
| Less than $10,000 | 1 (2.6%) | 0 (0.0%) |
| $10,000 to $24,999 | 4 (10.5%) | 0 (0.0%) |
| $25,000 to $34,999 | 8 (21.0%) | 0 (0.0%) |
| $35,000 to $49,999 | 15 (39.5%) | 2 (28.6%) |
| $50,000 to $74,999 | 0 (0.0%) | 0 (0.0%) |
| $75,000 to $99,999 | 6 (15.8%) | 1 (14.3%) |
| $100,000 to $149,999 | 4 (10.5%) | 0 (0.0%) |
| $150,000 or more | 0 (0.0%) | 2 (28.6%) |
| Total | 38 (100.0%) | 7 (100.0%) |
Property Value to Household Income Ratio in Streeter
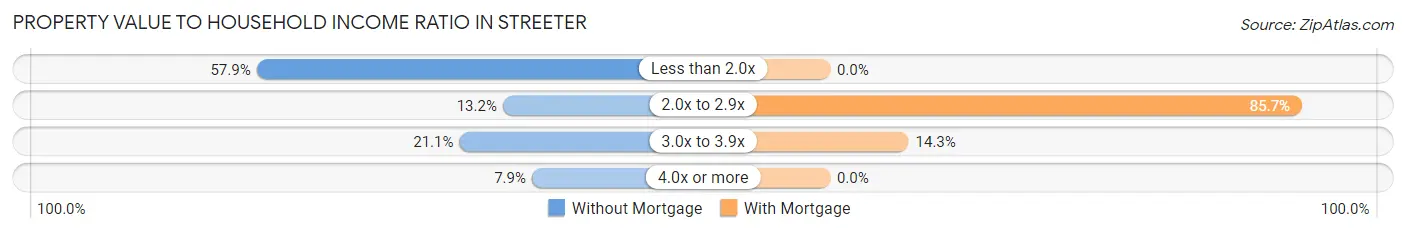
| Value-to-Income Ratio | Without Mortgage | With Mortgage |
| Less than 2.0x | 22 (57.9%) | 0 (0.0%) |
| 2.0x to 2.9x | 5 (13.2%) | 6 (85.7%) |
| 3.0x to 3.9x | 8 (21.0%) | 1 (14.3%) |
| 4.0x or more | 3 (7.9%) | 0 (0.0%) |
| Total | 38 (100.0%) | 7 (100.0%) |
Real Estate Taxes by Mortgage Status in Streeter
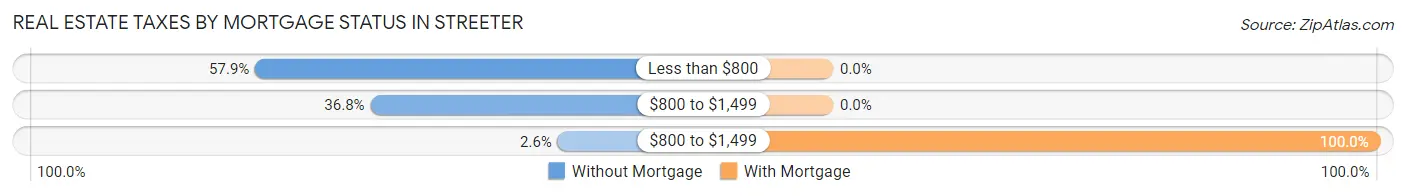
| Property Taxes | Without Mortgage | With Mortgage |
| Less than $800 | 22 (57.9%) | 0 (0.0%) |
| $800 to $1,499 | 14 (36.8%) | 0 (0.0%) |
| $800 to $1,499 | 1 (2.6%) | 7 (100.0%) |
| Total | 38 (100.0%) | 7 (100.0%) |
Health & Disability in Streeter
Health Insurance Coverage by Age in Streeter
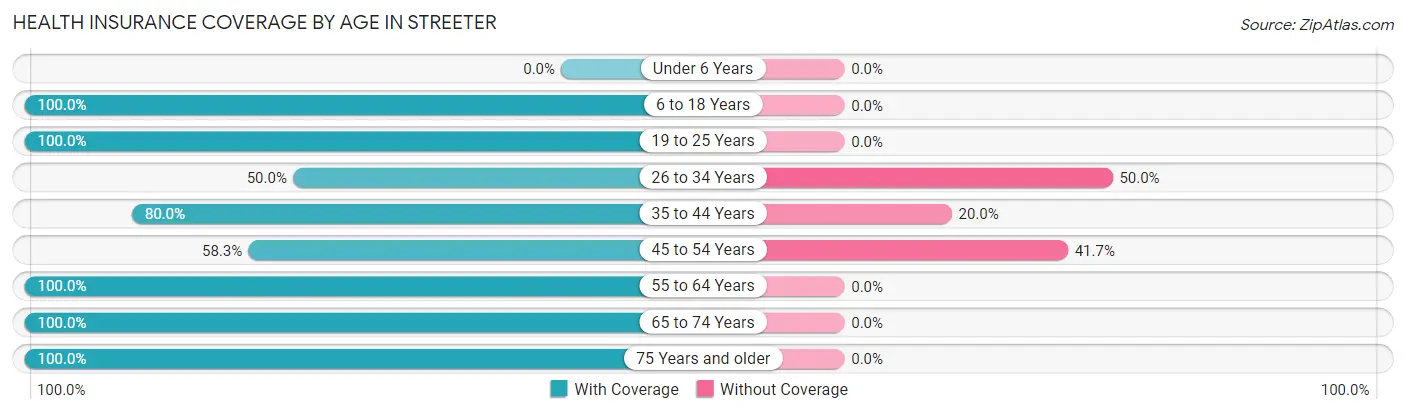
| Age Bracket | With Coverage | Without Coverage |
| Under 6 Years | 0 (0.0%) | 0 (0.0%) |
| 6 to 18 Years | 2 (100.0%) | 0 (0.0%) |
| 19 to 25 Years | 2 (100.0%) | 0 (0.0%) |
| 26 to 34 Years | 2 (50.0%) | 2 (50.0%) |
| 35 to 44 Years | 8 (80.0%) | 2 (20.0%) |
| 45 to 54 Years | 7 (58.3%) | 5 (41.7%) |
| 55 to 64 Years | 13 (100.0%) | 0 (0.0%) |
| 65 to 74 Years | 24 (100.0%) | 0 (0.0%) |
| 75 Years and older | 23 (100.0%) | 0 (0.0%) |
| Total | 81 (90.0%) | 9 (10.0%) |
Health Insurance Coverage by Citizenship Status in Streeter
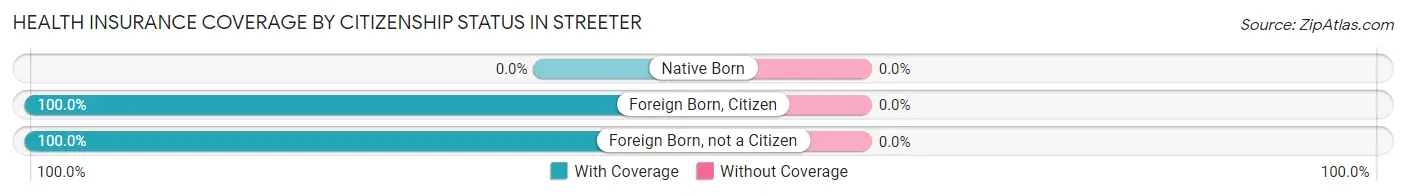
| Citizenship Status | With Coverage | Without Coverage |
| Native Born | 0 (0.0%) | 0 (0.0%) |
| Foreign Born, Citizen | 2 (100.0%) | 0 (0.0%) |
| Foreign Born, not a Citizen | 2 (100.0%) | 0 (0.0%) |
Health Insurance Coverage by Household Income in Streeter
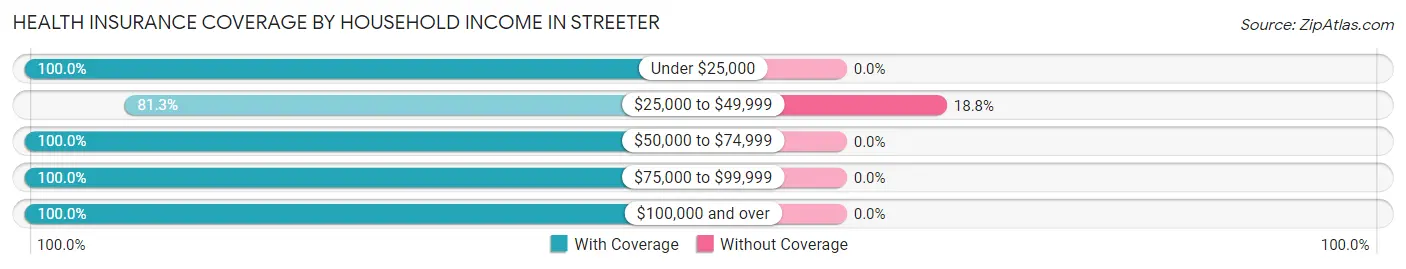
| Household Income | With Coverage | Without Coverage |
| Under $25,000 | 12 (100.0%) | 0 (0.0%) |
| $25,000 to $49,999 | 39 (81.2%) | 9 (18.8%) |
| $50,000 to $74,999 | 3 (100.0%) | 0 (0.0%) |
| $75,000 to $99,999 | 9 (100.0%) | 0 (0.0%) |
| $100,000 and over | 18 (100.0%) | 0 (0.0%) |
Public vs Private Health Insurance Coverage by Age in Streeter
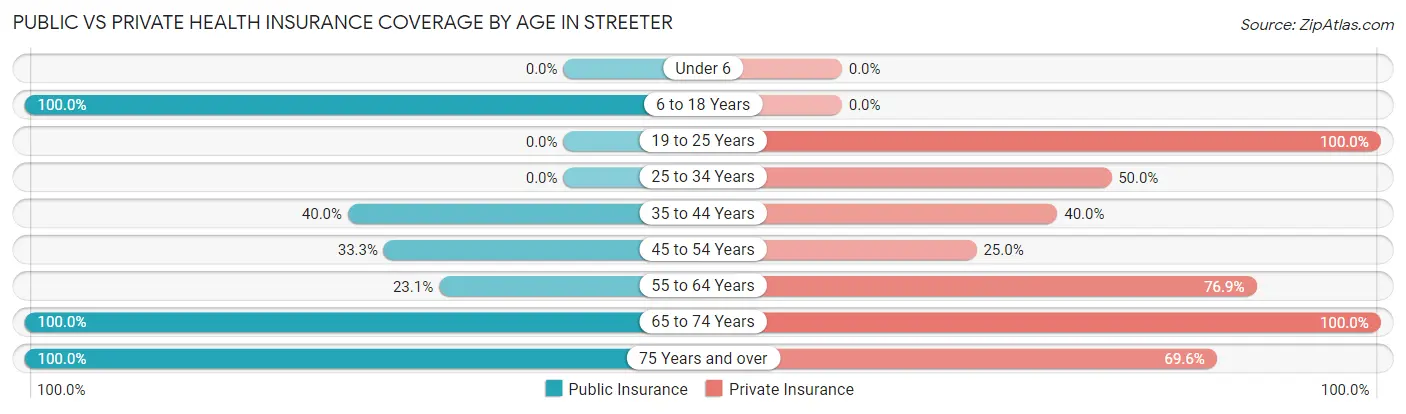
| Age Bracket | Public Insurance | Private Insurance |
| Under 6 | 0 (0.0%) | 0 (0.0%) |
| 6 to 18 Years | 2 (100.0%) | 0 (0.0%) |
| 19 to 25 Years | 0 (0.0%) | 2 (100.0%) |
| 25 to 34 Years | 0 (0.0%) | 2 (50.0%) |
| 35 to 44 Years | 4 (40.0%) | 4 (40.0%) |
| 45 to 54 Years | 4 (33.3%) | 3 (25.0%) |
| 55 to 64 Years | 3 (23.1%) | 10 (76.9%) |
| 65 to 74 Years | 24 (100.0%) | 24 (100.0%) |
| 75 Years and over | 23 (100.0%) | 16 (69.6%) |
| Total | 60 (66.7%) | 61 (67.8%) |
Disability Status by Sex by Age in Streeter
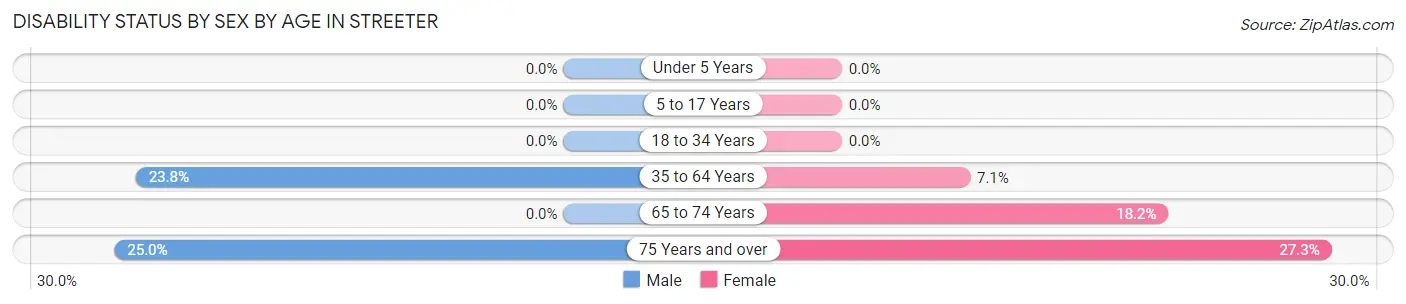
| Age Bracket | Male | Female |
| Under 5 Years | 0 (0.0%) | 0 (0.0%) |
| 5 to 17 Years | 0 (0.0%) | 0 (0.0%) |
| 18 to 34 Years | 0 (0.0%) | 0 (0.0%) |
| 35 to 64 Years | 5 (23.8%) | 1 (7.1%) |
| 65 to 74 Years | 0 (0.0%) | 2 (18.2%) |
| 75 Years and over | 3 (25.0%) | 3 (27.3%) |
Disability Class by Sex by Age in Streeter
Disability Class: Hearing Difficulty
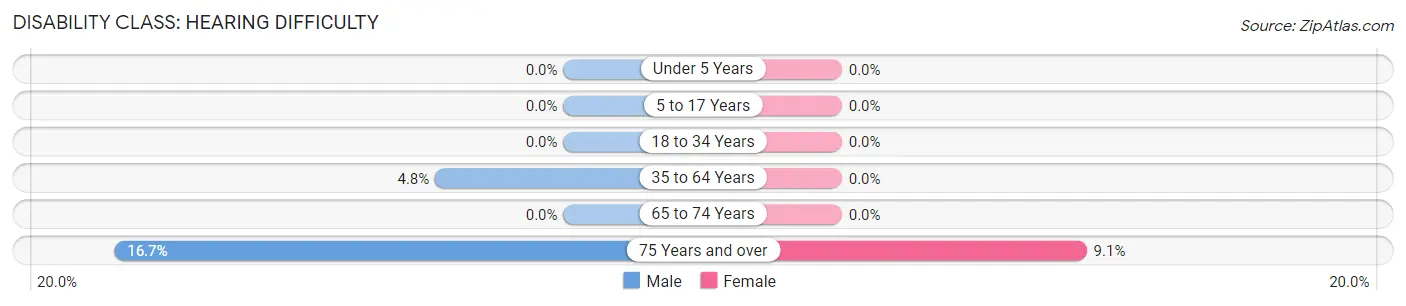
| Age Bracket | Male | Female |
| Under 5 Years | 0 (0.0%) | 0 (0.0%) |
| 5 to 17 Years | 0 (0.0%) | 0 (0.0%) |
| 18 to 34 Years | 0 (0.0%) | 0 (0.0%) |
| 35 to 64 Years | 1 (4.8%) | 0 (0.0%) |
| 65 to 74 Years | 0 (0.0%) | 0 (0.0%) |
| 75 Years and over | 2 (16.7%) | 1 (9.1%) |
Disability Class: Vision Difficulty
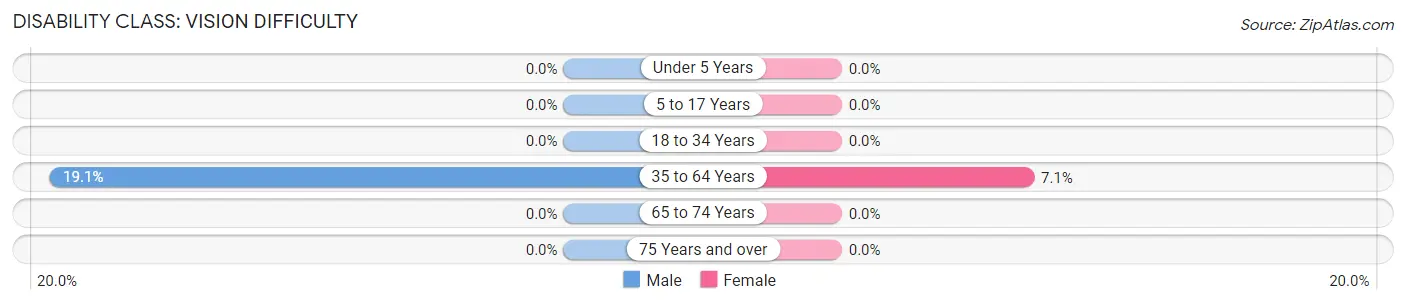
| Age Bracket | Male | Female |
| Under 5 Years | 0 (0.0%) | 0 (0.0%) |
| 5 to 17 Years | 0 (0.0%) | 0 (0.0%) |
| 18 to 34 Years | 0 (0.0%) | 0 (0.0%) |
| 35 to 64 Years | 4 (19.1%) | 1 (7.1%) |
| 65 to 74 Years | 0 (0.0%) | 0 (0.0%) |
| 75 Years and over | 0 (0.0%) | 0 (0.0%) |
Disability Class: Cognitive Difficulty
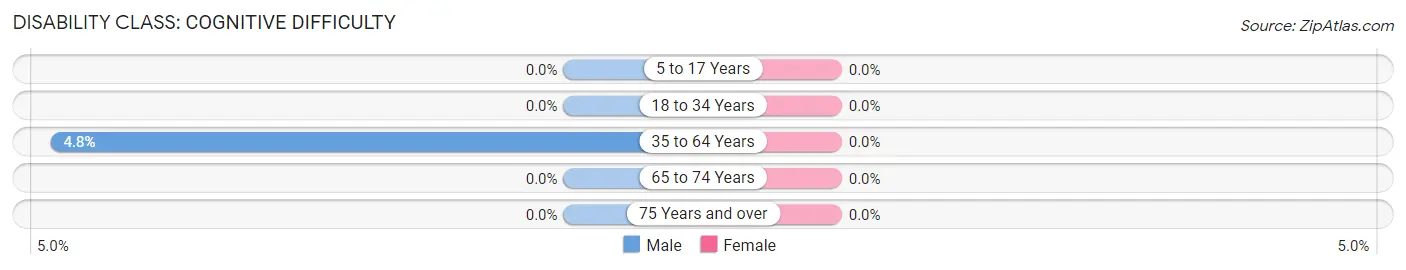
| Age Bracket | Male | Female |
| 5 to 17 Years | 0 (0.0%) | 0 (0.0%) |
| 18 to 34 Years | 0 (0.0%) | 0 (0.0%) |
| 35 to 64 Years | 1 (4.8%) | 0 (0.0%) |
| 65 to 74 Years | 0 (0.0%) | 0 (0.0%) |
| 75 Years and over | 0 (0.0%) | 0 (0.0%) |
Disability Class: Ambulatory Difficulty
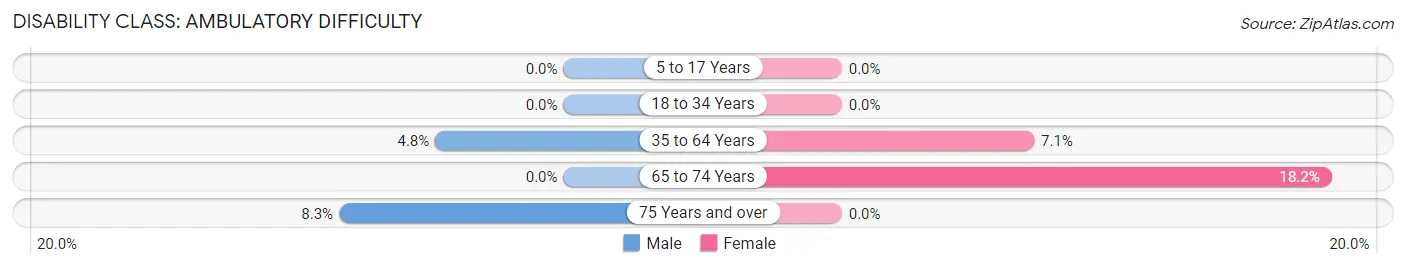
| Age Bracket | Male | Female |
| 5 to 17 Years | 0 (0.0%) | 0 (0.0%) |
| 18 to 34 Years | 0 (0.0%) | 0 (0.0%) |
| 35 to 64 Years | 1 (4.8%) | 1 (7.1%) |
| 65 to 74 Years | 0 (0.0%) | 2 (18.2%) |
| 75 Years and over | 1 (8.3%) | 0 (0.0%) |
Disability Class: Self-Care Difficulty
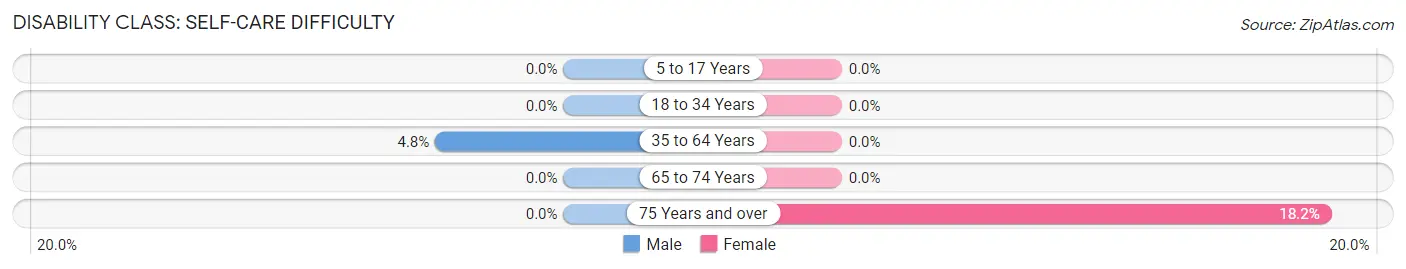
| Age Bracket | Male | Female |
| 5 to 17 Years | 0 (0.0%) | 0 (0.0%) |
| 18 to 34 Years | 0 (0.0%) | 0 (0.0%) |
| 35 to 64 Years | 1 (4.8%) | 0 (0.0%) |
| 65 to 74 Years | 0 (0.0%) | 0 (0.0%) |
| 75 Years and over | 0 (0.0%) | 2 (18.2%) |
Technology Access in Streeter
Computing Device Access in Streeter
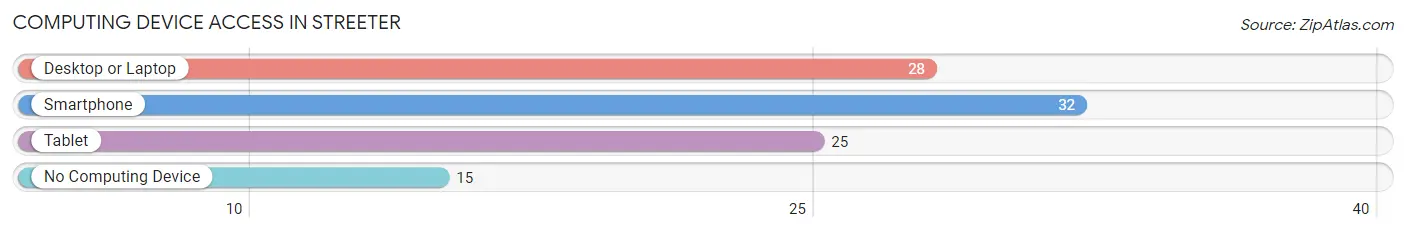
| Device Type | # Households | % Households |
| Desktop or Laptop | 28 | 53.8% |
| Smartphone | 32 | 61.5% |
| Tablet | 25 | 48.1% |
| No Computing Device | 15 | 28.8% |
| Total | 52 | 100.0% |
Internet Access in Streeter
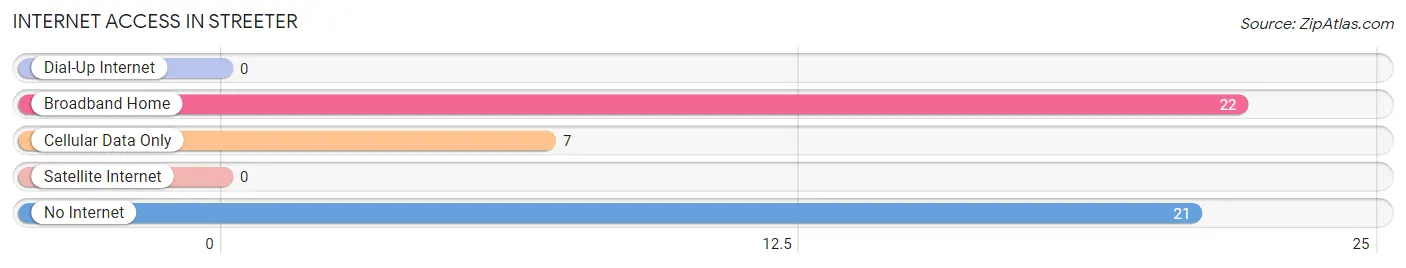
| Internet Type | # Households | % Households |
| Dial-Up Internet | 0 | 0.0% |
| Broadband Home | 22 | 42.3% |
| Cellular Data Only | 7 | 13.5% |
| Satellite Internet | 0 | 0.0% |
| No Internet | 21 | 40.4% |
| Total | 52 | 100.0% |
Streeter Summary
The city of Streeter, North Dakota is located in Stutsman County in the southeastern corner of the state. It is situated on the James River, approximately 20 miles west of Jamestown. The city was founded in 1883 and was named after the first postmaster, William Streeter. The population of Streeter was estimated to be 545 in 2019.
Geography
Streeter is located in the Red River Valley, a flat, fertile region of the Great Plains. The city is situated on the James River, which flows through the city and is a tributary of the Red River. The city is surrounded by rolling hills and prairies, and is located in an area of the state known for its abundant wildlife.
The climate in Streeter is typical of the Great Plains, with hot summers and cold winters. The average annual temperature is 48°F, and the average annual precipitation is 17.5 inches.
Economy
Streeter’s economy is largely based on agriculture. The city is home to several large farms, and the surrounding area is known for its production of wheat, corn, and soybeans. Streeter is also home to several small businesses, including a grocery store, a hardware store, and a restaurant.
The city is served by the Streeter Public School District, which includes an elementary school, a middle school, and a high school. The city is also home to a branch of the North Dakota State University system.
Demographics
The population of Streeter is predominantly white, with a small minority population. The median household income is $45,000, and the median home value is $90,000. The city has a low unemployment rate, and the poverty rate is below the national average.
Streeter is a small, rural community with a strong sense of community and a commitment to preserving its history and culture. The city is home to several historic sites, including the Streeter Museum and the Streeter Historical Society. The city also hosts several annual events, including the Streeter Days Festival and the Streeter Rodeo.
Streeter is a small, rural community with a strong sense of community and a commitment to preserving its history and culture. The city is home to several historic sites, including the Streeter Museum and the Streeter Historical Society. The city also hosts several annual events, including the Streeter Days Festival and the Streeter Rodeo. Streeter is a great place to live, work, and raise a family.
Common Questions
What is Per Capita Income in Streeter?
Per Capita income in Streeter is $35,804.
What is the Median Family Income in Streeter?
Median Family Income in Streeter is $39,167.
What is the Median Household income in Streeter?
Median Household Income in Streeter is $38,750.
What is Inequality or Gini Index in Streeter?
Inequality or Gini Index in Streeter is 0.40.
What is the Total Population of Streeter?
Total Population of Streeter is 90.
What is the Total Male Population of Streeter?
Total Male Population of Streeter is 52.
What is the Total Female Population of Streeter?
Total Female Population of Streeter is 38.
What is the Ratio of Males per 100 Females in Streeter?
There are 136.84 Males per 100 Females in Streeter.
What is the Ratio of Females per 100 Males in Streeter?
There are 73.08 Females per 100 Males in Streeter.
What is the Median Population Age in Streeter?
Median Population Age in Streeter is 66.1 Years.
What is the Average Family Size in Streeter
Average Family Size in Streeter is 2.2 People.
What is the Average Household Size in Streeter
Average Household Size in Streeter is 1.7 People.
How Large is the Labor Force in Streeter?
There are 41 People in the Labor Forcein in Streeter.
What is the Percentage of People in the Labor Force in Streeter?
45.6% of People are in the Labor Force in Streeter.